
Abstract
Health care organizations are challenged to find ways to measure not only process of care but also outcomes of care. Gundersen Health System’s Orthopaedic Surgery Department in the La Crosse, Wisconsin area developed a process to collect outcomes of care for patients having hip or knee arthroplasty procedures and planned to use these data to determine impact on patients’ lives. The Hip Osteoarthritis Outcomes Score and Knee Osteoarthritis Outcomes Score, adapted from the widely used Western Ontario and McMaster Universities Osteoarthritis Index, were collected preoperatively and at 1 year postoperatively. From these data, the health system determined that patients were experiencing significant improvement in 4 of 5 scales. Further recommendations include evaluating the impact of patients’ age, sex, and preoperative body mass index on outcomes, as well as evaluating the impact of more patient involvement in goal setting on recovery time and functional outcomes.
Measurement of outcomes has become health care organizations’ preferred approach to determine the quality of care they provide. State and federal agencies also are requiring outcome measures rather than process measures to demonstrate safety and effectiveness of physician practice. As the nation’s baby boomer population ages, demand for total joint arthroplasty of the hip and knee is expected to rise,1,2 and physicians want a tool with which to measure patients’ functional outcomes—not only to demonstrate progress under their care but also to assist with clinical decision making and appropriate goal setting for patients. 3
A number of tools to measure total joint arthroplasty outcomes exist, but choosing the tool that best suits the needs of an organization can be challenging. Gundersen’s Department of Orthopaedics staff reviewed numerous tools and chose the Knee Osteoarthritis Outcome Score (KOOS) and Hip Osteoarthritis Outcome Score (HOOS) surveys as its preferred functional outcome tools. The HOOS and KOOS surveys were developed as an extension of the Western Ontario and McMaster Universities Osteoarthritis Index to more pointedly evaluate outcomes identified as important to patients. 4
The KOOS and HOOS surveys score 5 separate categories, allowing for identification of—and intervention in—specific areas in which patients are experiencing less improvement. Other instruments conflate these categories, yielding a single outcome score. That approach can smooth out the areas of high and low performance, making it difficult to pinpoint areas requiring additional attention 4 and possibly resulting in poorer outcomes for patients in the long term. For these reasons, Gundersen Health System selected the HOOS and KOOS surveys as the most appropriate tools with which to measure total hip and total knee arthroplasty outcomes. Presurgical and postsurgical outcomes in each of the 5 categories—pain, other symptoms, activities of daily living, sport and recreation, and quality of life—were compared.
The aim of this quality improvement study was to evaluate the process by which Gundersen Health System would collect functional outcome information in the Department of Orthopaedics and to determine the impact of total joint arthroplasty on patients for both internal and external reporting. The data will be used to make improvements to the total joint program and to address any less than optimal functional outcomes in hip and knee joint arthroplasty patients.
Methods
On April 1, 2010, Gundersen’s Department of Orthopaedics in La Crosse, Wisconsin, began collecting HOOS and KOOS scores for all total hip and total knee replacement patients. Patients were asked to complete a functional assessment tool—either at home (early phase of the study) or at their total joint teaching class, which was held approximately 1 to 2 weeks prior to their surgery date. The nurse educator explained to patients that this tool would be used to compare their current state with their state 1 year after surgery and that the results would be recorded in their medical records. The patients were then left to complete the survey on their own to avoid administrator bias; however, the nurse was available if patients had questions about the survey. After completion, the HOOS and KOOS surveys were collected and answers were entered into an online calculator for scoring. Scores were then documented in the patients’ medical records, as well as on an electronic spreadsheet used to track patient progress. Each functional area of the spreadsheet was color-coded to make it easier for the reader to identify any change from pretest to posttest. The spreadsheet was housed in an electronic folder accessible to all total joint surgeons and nursing staff for review at any time. Tabs were created to separate information by surgeon.
When patients returned for their 1-year postoperative follow-up, the tool was administered again by the nursing staff. Patients were given time to complete the survey on their own, again with staff available if questions arose. The tool was mailed to patients who were not scheduled for a 1-year follow-up appointment, along with a letter requesting that they complete the tool and return it in the enclosed self-addressed stamped envelope. The date the tool was sent to the patient was documented in the electronic spreadsheet. When the tool was returned, it was scored and the score entered into the spreadsheet. Scores were reviewed by the nursing staff to identify patients who may have required follow-up. If needed, a telephone call was made to the patient to gather more information. The nurse then determined whether the patient needed a follow-up appointment with the surgeon.
Results
A total of 167 hip and 332 knee patients had paired presurgical and postsurgical data in all scales. In the KOOS group, 37.6% of participants were men, the average age was 69.8 years, and the average time to follow-up was 404 days. Among the HOOS participants, 49.7% of respondents were men, the average age was 69 years, and the average time to follow-up was 408 days.
Paired samples t tests were run to determine whether the presurgical and postsurgical scores were significantly different. Results were found to be significant at the P < .001 level for all 5 individual scales, as well as for the overall scores, for both the HOOS and the KOOS (Figures 1 and 2). Using Journal of Bone and Joint Surgery findings 5 as a reference point, a minimum change of 10 points from pretest to posttest using the KOOS tool was determined to be clinically significant. Improvements greater than 10 points were observed every month since the beginning of data collection for all scales with the exception of sport and recreation, which did not improve in February 2012. Following quality improvement protocol, data were graphed over time in order to visualize the impact of changes being made to the total hip and knee replacement program throughout the data collection period (Figures 3 and 4). The program continues to use these data to measure the impact of changes being made to the processes to improve patient outcomes.
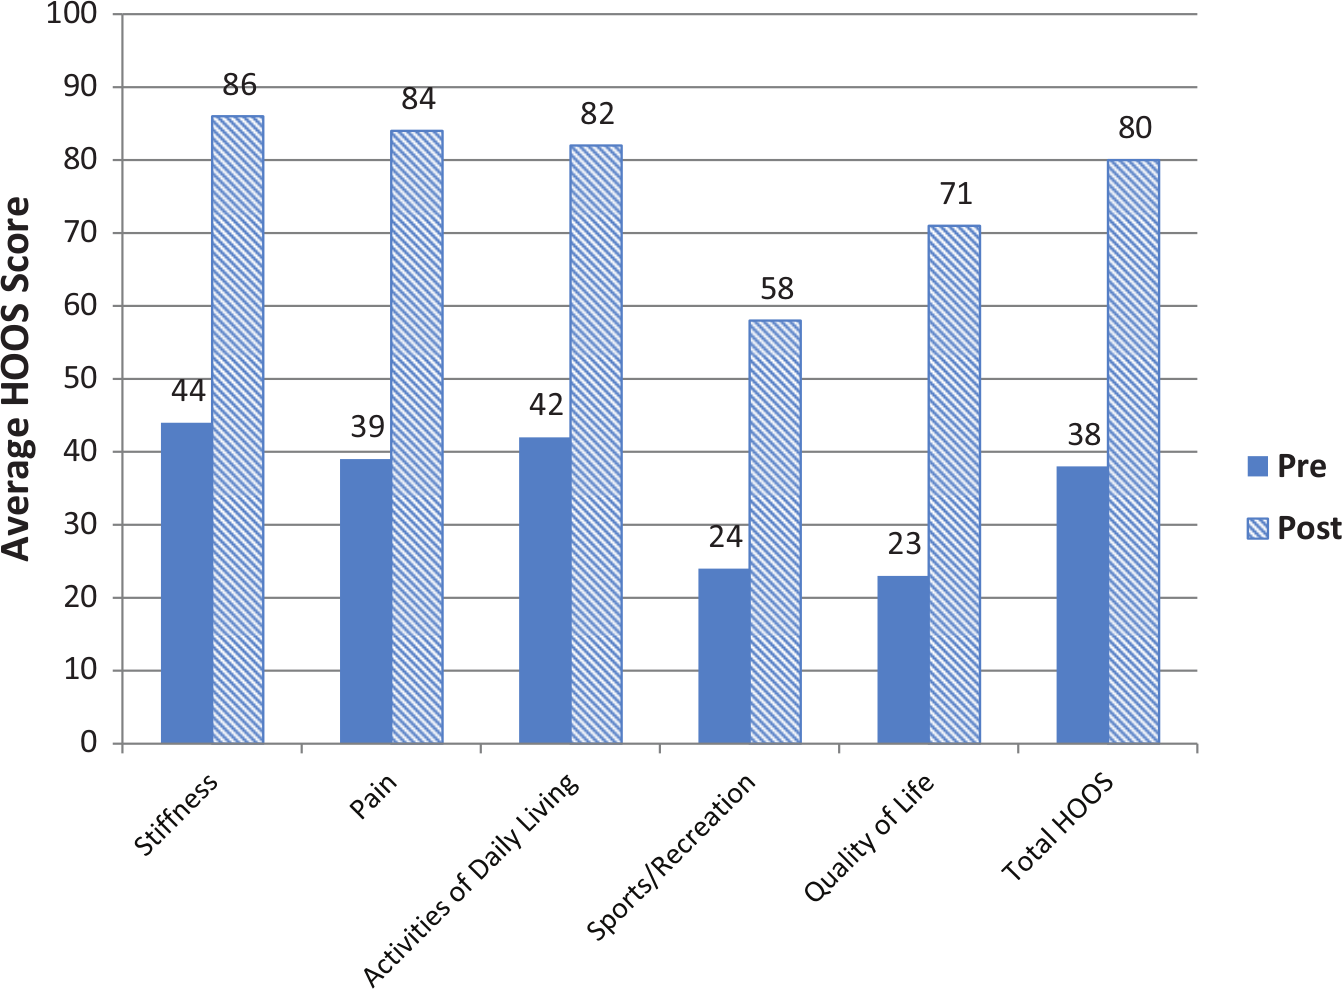
Average score at pre and post for Hip Osteoarthitis Outcome Score (HOOS), N = 167.
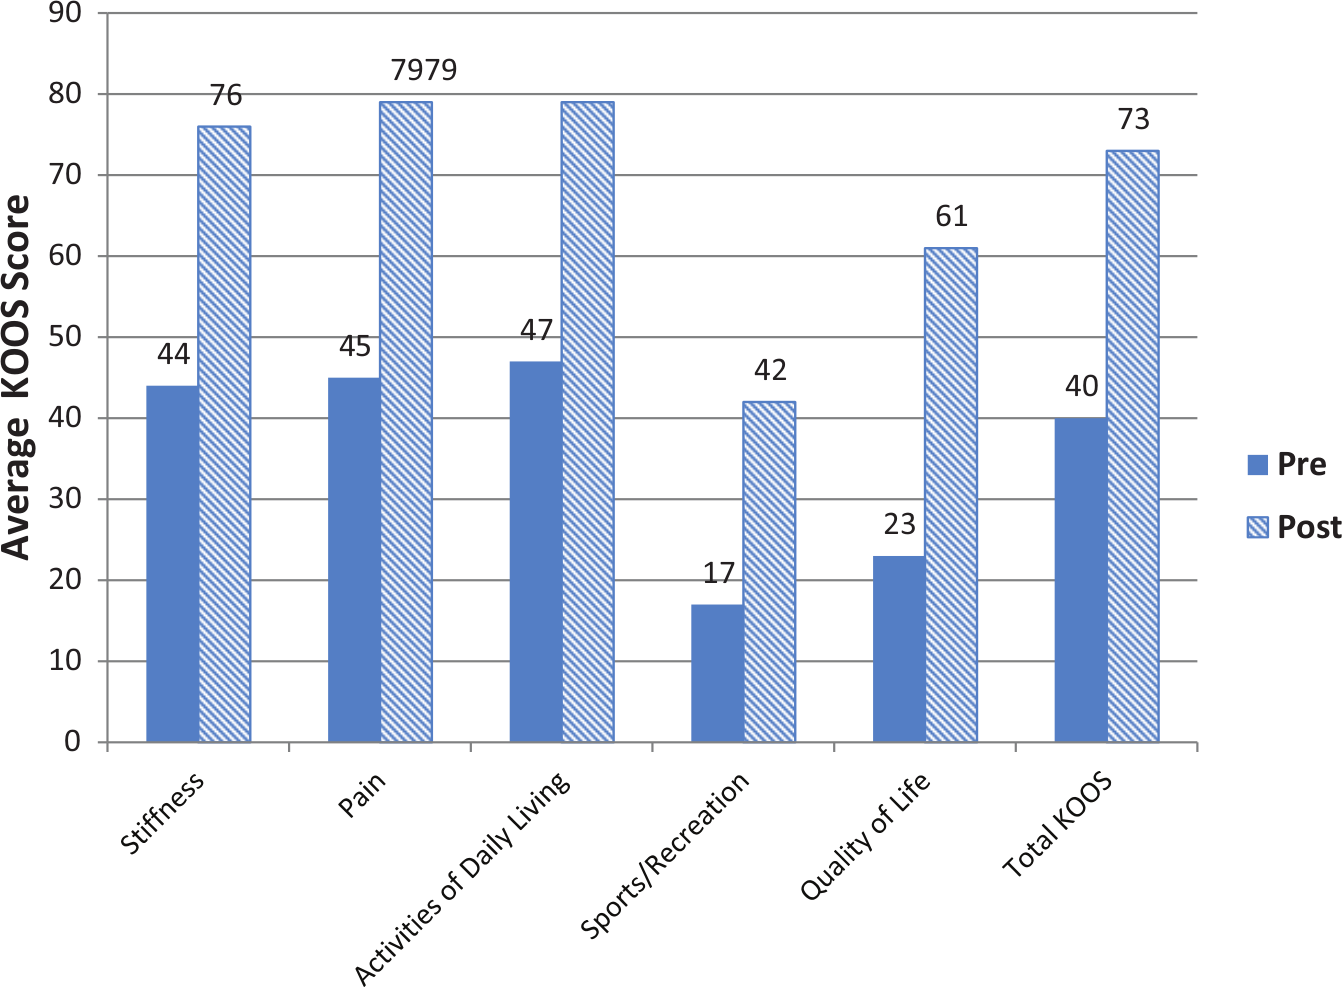
Average score at pre and post for Knee Osteoarthritis Outcomes Score (KOOS), N = 332.
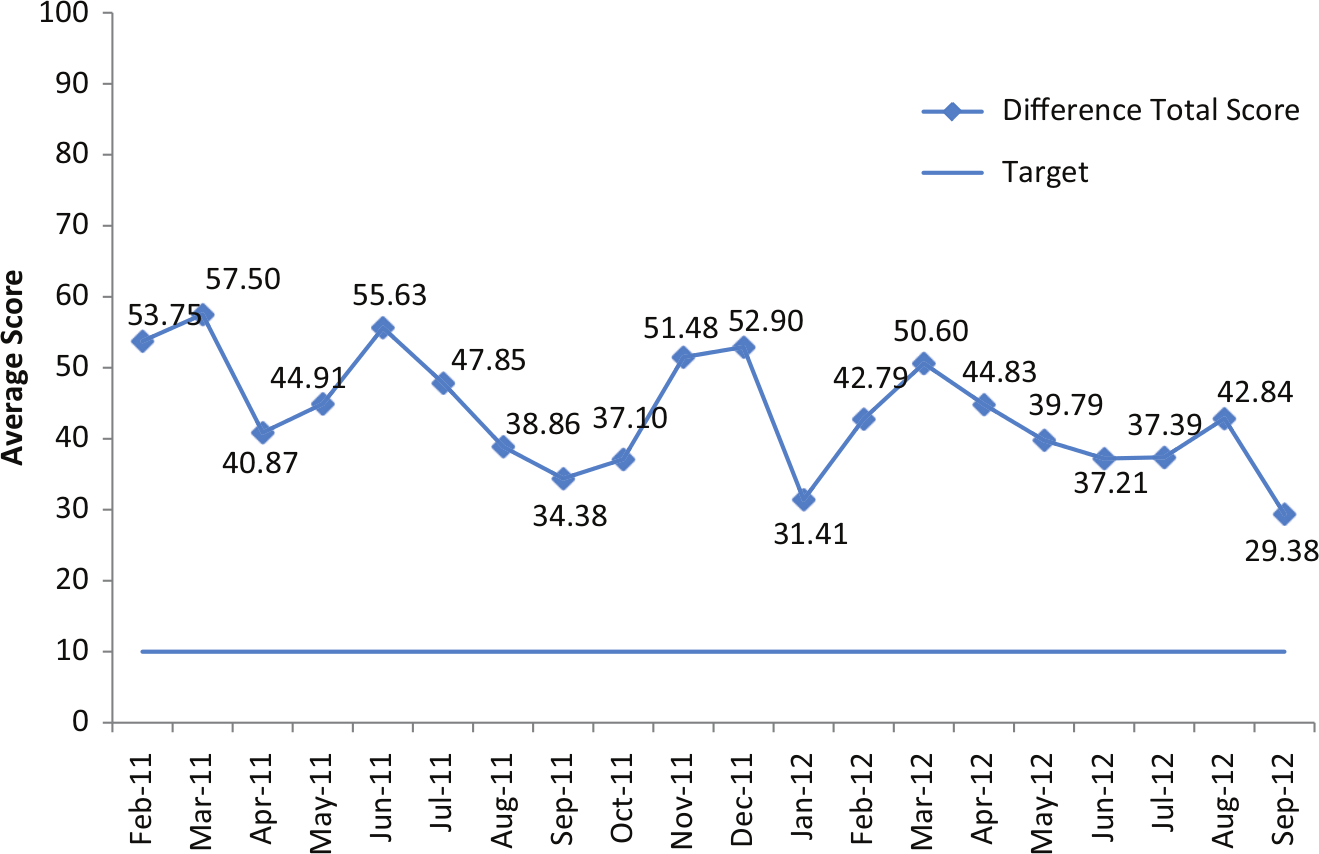
Hip Osteoarthitis Outcome Score pretest to posttest results—change in total overall score by month, February 2011 to September 2012.
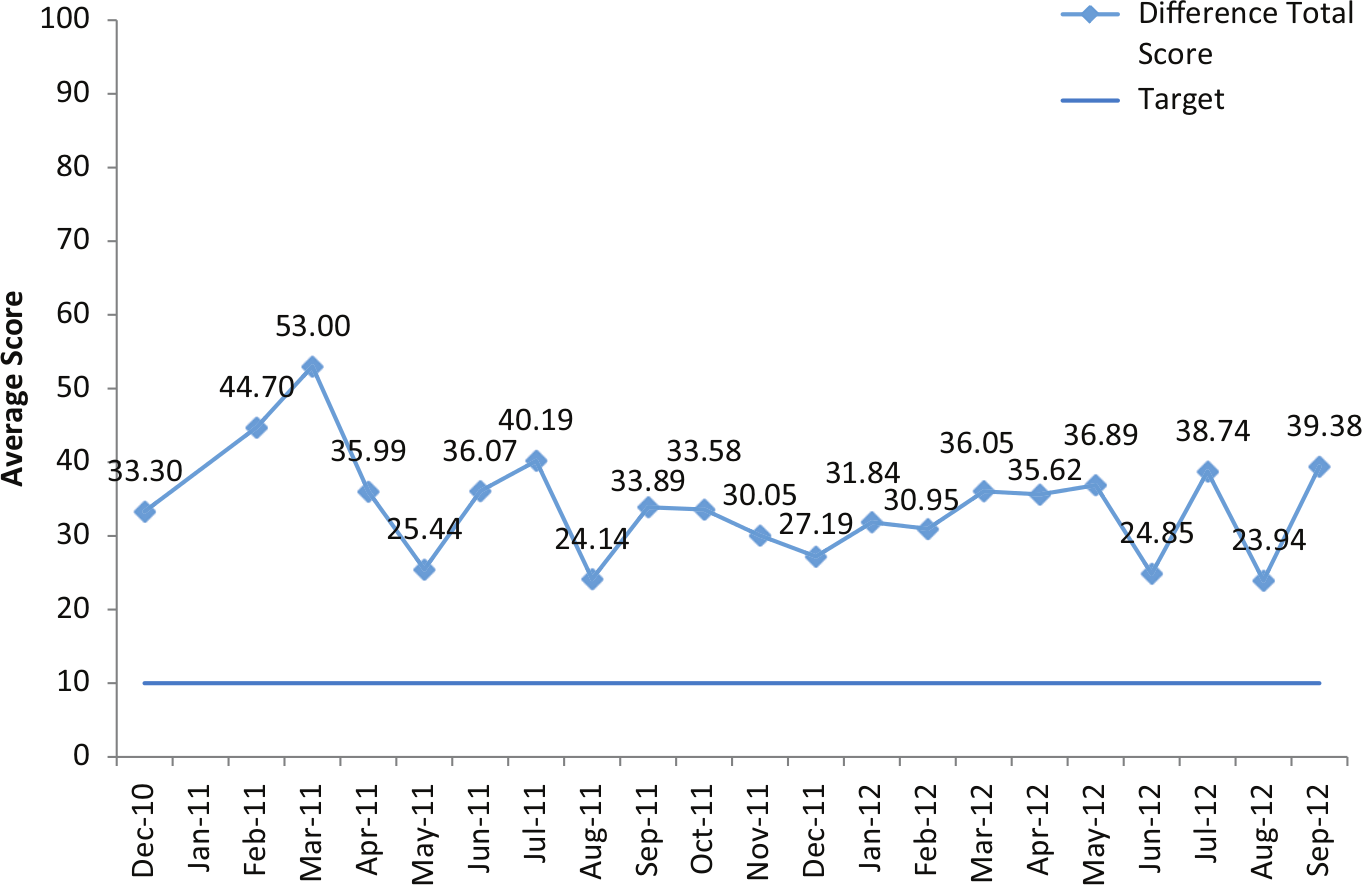
Knee Osteoarthritis Outcomes Score pretest to posttest results—change in total overall score by month, December 2010 to September 2012.
Discussion
Although the HOOS and KOOS surveys have been used for Gundersen Health System Orthopaedics total joint patients since April 1, 2010, the team may have missed opportunities with some patients because the data collection process had not been perfected during the early months of the project. First, the team believed that many patients viewed the tool as “just another survey” and had no interest in completing it. Thus, the team began to explain that the tool would be used to compare patients’ presurgical status with their postsurgical status and that this information would show not only the degree of improvement in important categories such as quality of life but also would help identify any areas in which they might need further attention. Second, the team found that when patients took the surveys home to complete, they often did not return them. Return rates improved when time was built into the education classes so that patients could complete the surveys on-site. This process worked well for presurgical surveys, but it was more difficult to get the 1-year postoperative tool completed because many patients were no longer being followed by their surgeon. To overcome this barrier, the team decided to mail 1-year postsurvey assessments to patients who had not made a return visit by 12 months. A detailed letter explaining the reason for collecting the data was mailed to the patient along with the survey and a self-addressed, stamped envelope in which to return it. The mailing was documented on the data collection tracking sheet. Response rate improved greatly after this process was implemented. Programs that do not have the administrative support necessary to collect data via mailings may need to consider other means to ensure that the 1-year follow-up data are collected.
When 6 months of pre–post data had been collected, graphing was completed to show improvements in all subscales of the tool. An updated graph was sent to all the total joint surgeon teams and the total joint committee for their review each quarter. The total joint committee includes representatives from clinical management, nursing, physical therapy, occupational therapy, social work, and quality and patient safety. This committee meets every month to discuss barriers and improvement ideas. Before these data were collected, the team had no quantitative data with which to demonstrate success with joint replacements; only qualitative data collected via patient feedback was available. As the process for using data to drive results continues to grow and become more transparent internally and externally, the team expects the results to improve.
Establishing a baseline target for level of improvement is currently being discussed by the surgical team. An improvement of 10 points is considered a significant improvement according to the literature on the HOOS and KOOS tools. Thus far, the data are showing significant improvements in all areas of the tool using the 10 points recommendation. The surgical team is averaging greater improvements with their overall HOOS scores than KOOS scores. This is likely because arthritis of the hip joint tends to be more debilitating than that of the knee. Thus, hip patients likely have lower presurgical scores, so they sense greater improvement after surgery.
Patients were asked to indicate which subscales were most important to them; they identified the quality of life and pain scales as the most important. Greatest improvements were noted in quality of life for both hip and knee replacements, with an average 48% improvement for hips and 37% for knees. Pain had the second greatest improvement, at 45% for hips and 34% for knees. The team has concluded that improvement from pre to post in the pain scales may be understated for some patients. For example, the preoperative pain scores of patients using anti-inflammatories or pain medications were likely better than those of patients who were not using anything for pain control. Their posttest scores could be identical, but patients who had not been taking anything when the original tool was completed would show a greater improvement in pain than would those patients who had been using pain control at pretest. Stiffness seemed to improve nearly as much as pain, and the team believes this had a synergistic impact on activities of daily living and quality of life, with improved independence.
The smallest improvements were noted in the sport and recreation category, with an average improvement of 34% for hips and 25% for knees. The team expected improvement in this category to be low because the average age of the health system’s total joint patient was about 69 years. Patients also rank this as their least valued category.
Along with obtaining the functional scores, the clinical team typically sees patients for a 6-week follow-up survey to gain insight into how to improve patients’ overall experience. Using this feedback, the process continues to improve. If the right education is given, the patient is well prepared and has realistic expectations, reflected in better HOOS/KOOS scores. The team also has identified areas of the study that could lead to more support for using the HOOS and KOOS tools. Areas being considered for future analysis are age, sex, and body mass index. It will be important for the team to continue to evaluate the functional scores and identify ways to improve them. Using these data, the committee team will determine where the focus for organizational education is most needed to lead improvement. To improve the current program, discussions will be held about recommendations for future study.
Footnotes
Acknowledgements
Special thanks to Total Joint Committee members: Lynn Wolter, PT; Patti Schmidt, PT assistant; Nathan Jordan, OT; Bonnie Borchardt, SOA; Brenda Bender-Lueck, RN; Charlotte Grant; Becky Inglis, RN; Molly Willenbring, PA-C; Wendy Williams, OT; Jodi Hendrickson, SW; Sue Sacia, RN; Kendra Reynolds, RN; Ted Riley, MD; Mark Topolski, MD; Andrew Saterbak, MD; and Chad Harbour, MD.
Declaration of Conflicting Interests
The authors declared no conflicts of interest with respect to the research, authorship, and/or publication of this article.
Funding
The authors received no financial support for the research, authorship, and/or publication of this article.