
Abstract
The purpose of this study was to use fault tree analysis to evaluate the adequacy of quality reporting programs in identifying root causes of postoperative bloodstream infection (BSI). A systematic review of the literature was used to construct a fault tree to evaluate 3 postoperative BSI reporting programs: National Surgical Quality Improvement Program (NSQIP), Centers for Medicare and Medicaid Services (CMS), and The Joint Commission (JC). The literature review revealed 699 eligible publications, 90 of which were used to create the fault tree containing 105 faults. A total of 14 identified faults are currently mandated for reporting to NSQIP, 5 to CMS, and 3 to JC; 2 or more programs require 4 identified faults. The fault tree identifies numerous contributing faults to postoperative BSI and reveals substantial variation in the requirements and ability of national quality data reporting programs to capture these potential faults. Efforts to prevent postoperative BSI require more comprehensive data collection to identify the root causes and develop high-reliability improvement strategies.
Bloodstream infections (BSIs) are among the most common preventable complications following surgery. 1 Central line–associated bloodstream infections (CLABSIs), in particular, represent 14% of all health care–associated infections. Patients who develop early postoperative BSIs (ie, within the first 60 postoperative days) experience longer hospital stays, higher costs of care, increased readmission rates, and higher mortality. 2 Although mortality rates from BSI have decreased over the past decade, the overall number of deaths has increased because the number of infections has increased. This is particularly true for CLABSIs, with recent epidemiological studies reporting an annual incidence of 600 000 cases of CLABSIs (not all of them postoperative) per year in the United States. 3
Multiple quality data reporting programs exist in the United States, with the aim of facilitating quality improvement and eliminating complications, including preventable BSIs. The Centers for Medicare and Medicaid Services (CMS) requires acute care hospitals to report methicillin-resistant Staphylococcus aureus bacteremia and CLABSI rates and has tied those rates to hospital reimbursement. 4 In addition to national efforts, regional and specialty-specific quality initiatives, including the National Surgical Quality Improvement Program (NSQIP), have created voluntary reporting programs for hospitals to track BSI rates.4 -6 However, the multitude of hospital quality data reporting programs have resulted in administrative burden on hospitals, with an estimate of $30 to $80 per discharged patient being spent on data collection and reporting of quality metrics.7,8 The number of quality data reporting programs, variation in data requirements, and lack of coordination between programs has led to confusion and redundancy at the institutional level. 9 Estimates of the administrative burden are as high as 90 h/month and $100 000 per year per hospital. 10
Although mandates from multiple health care agencies have increased reporting of BSIs, the effect of increased reporting and payment incentives on quality improvement remains unimpressive. Fault tree analysis (FTA) is a tool for understanding how individual faults contribute to an undesirable event or a “bad outcome.”11,12 The faults are identified and arranged in a hierarchy, and deductive analysis is used to demonstrate their interaction and expose areas of vulnerability in the system. In an effort to improve health care delivery, researchers have used FTA to understand the causes and implement interventions to reduce the occurrence of medical errors and adverse events.13 -15
The purpose of this study was to use FTA to (1) identify basic causes of postoperative BSIs and (2) evaluate the adequacy of national quality metrics as aids in identifying root causes of postoperative BSIs.
Methods
FTA is a tool for understanding how the interaction of faults leads to an undesirable event of interest.11,12 The faults identified within the system are illustrated in a hierarchy that demonstrates how each fault contributes to the primary undesirable event. Each fault is connected with logical symbols that help explain the sequence of events necessary for the undesired event to occur—in this case, a BSI. The tree was constructed by (1) identifying causes of BSI through a literature review, (2) reviewing the tree events with subject matter experts for accuracy, and (3) qualitatively analyzing the quality metrics required by 3 major health care agencies.
Literature Review
A review of the literature was performed to identify articles describing the occurrence of a postoperative BSI. A PubMed search was conducted using the terms (surgery) AND (((bloodstream infection[MeSH Terms]) OR bloodstream infection[MeSH Terms])) AND ((complication, postoperative[MeSH Terms]) OR period, postoperative[MeSH Terms]))). Figure 1 displays the results of the search. The initial search yielded 699 articles; 533 articles were retained after limiting the search results to studies published in English and published after January 1, 2005. The titles and abstracts were reviewed for relevance, resulting in 92 articles selected for full text review. Articles reporting risk factors for postoperative BSI were selected for inclusion. After full text review, 90 articles were used to create the fault tree. Bibliographies of the selected articles also were reviewed to complete the search; no new articles were identified. The search and initial exclusion of articles were performed by 2 independent reviewers (LMM, ZAA).
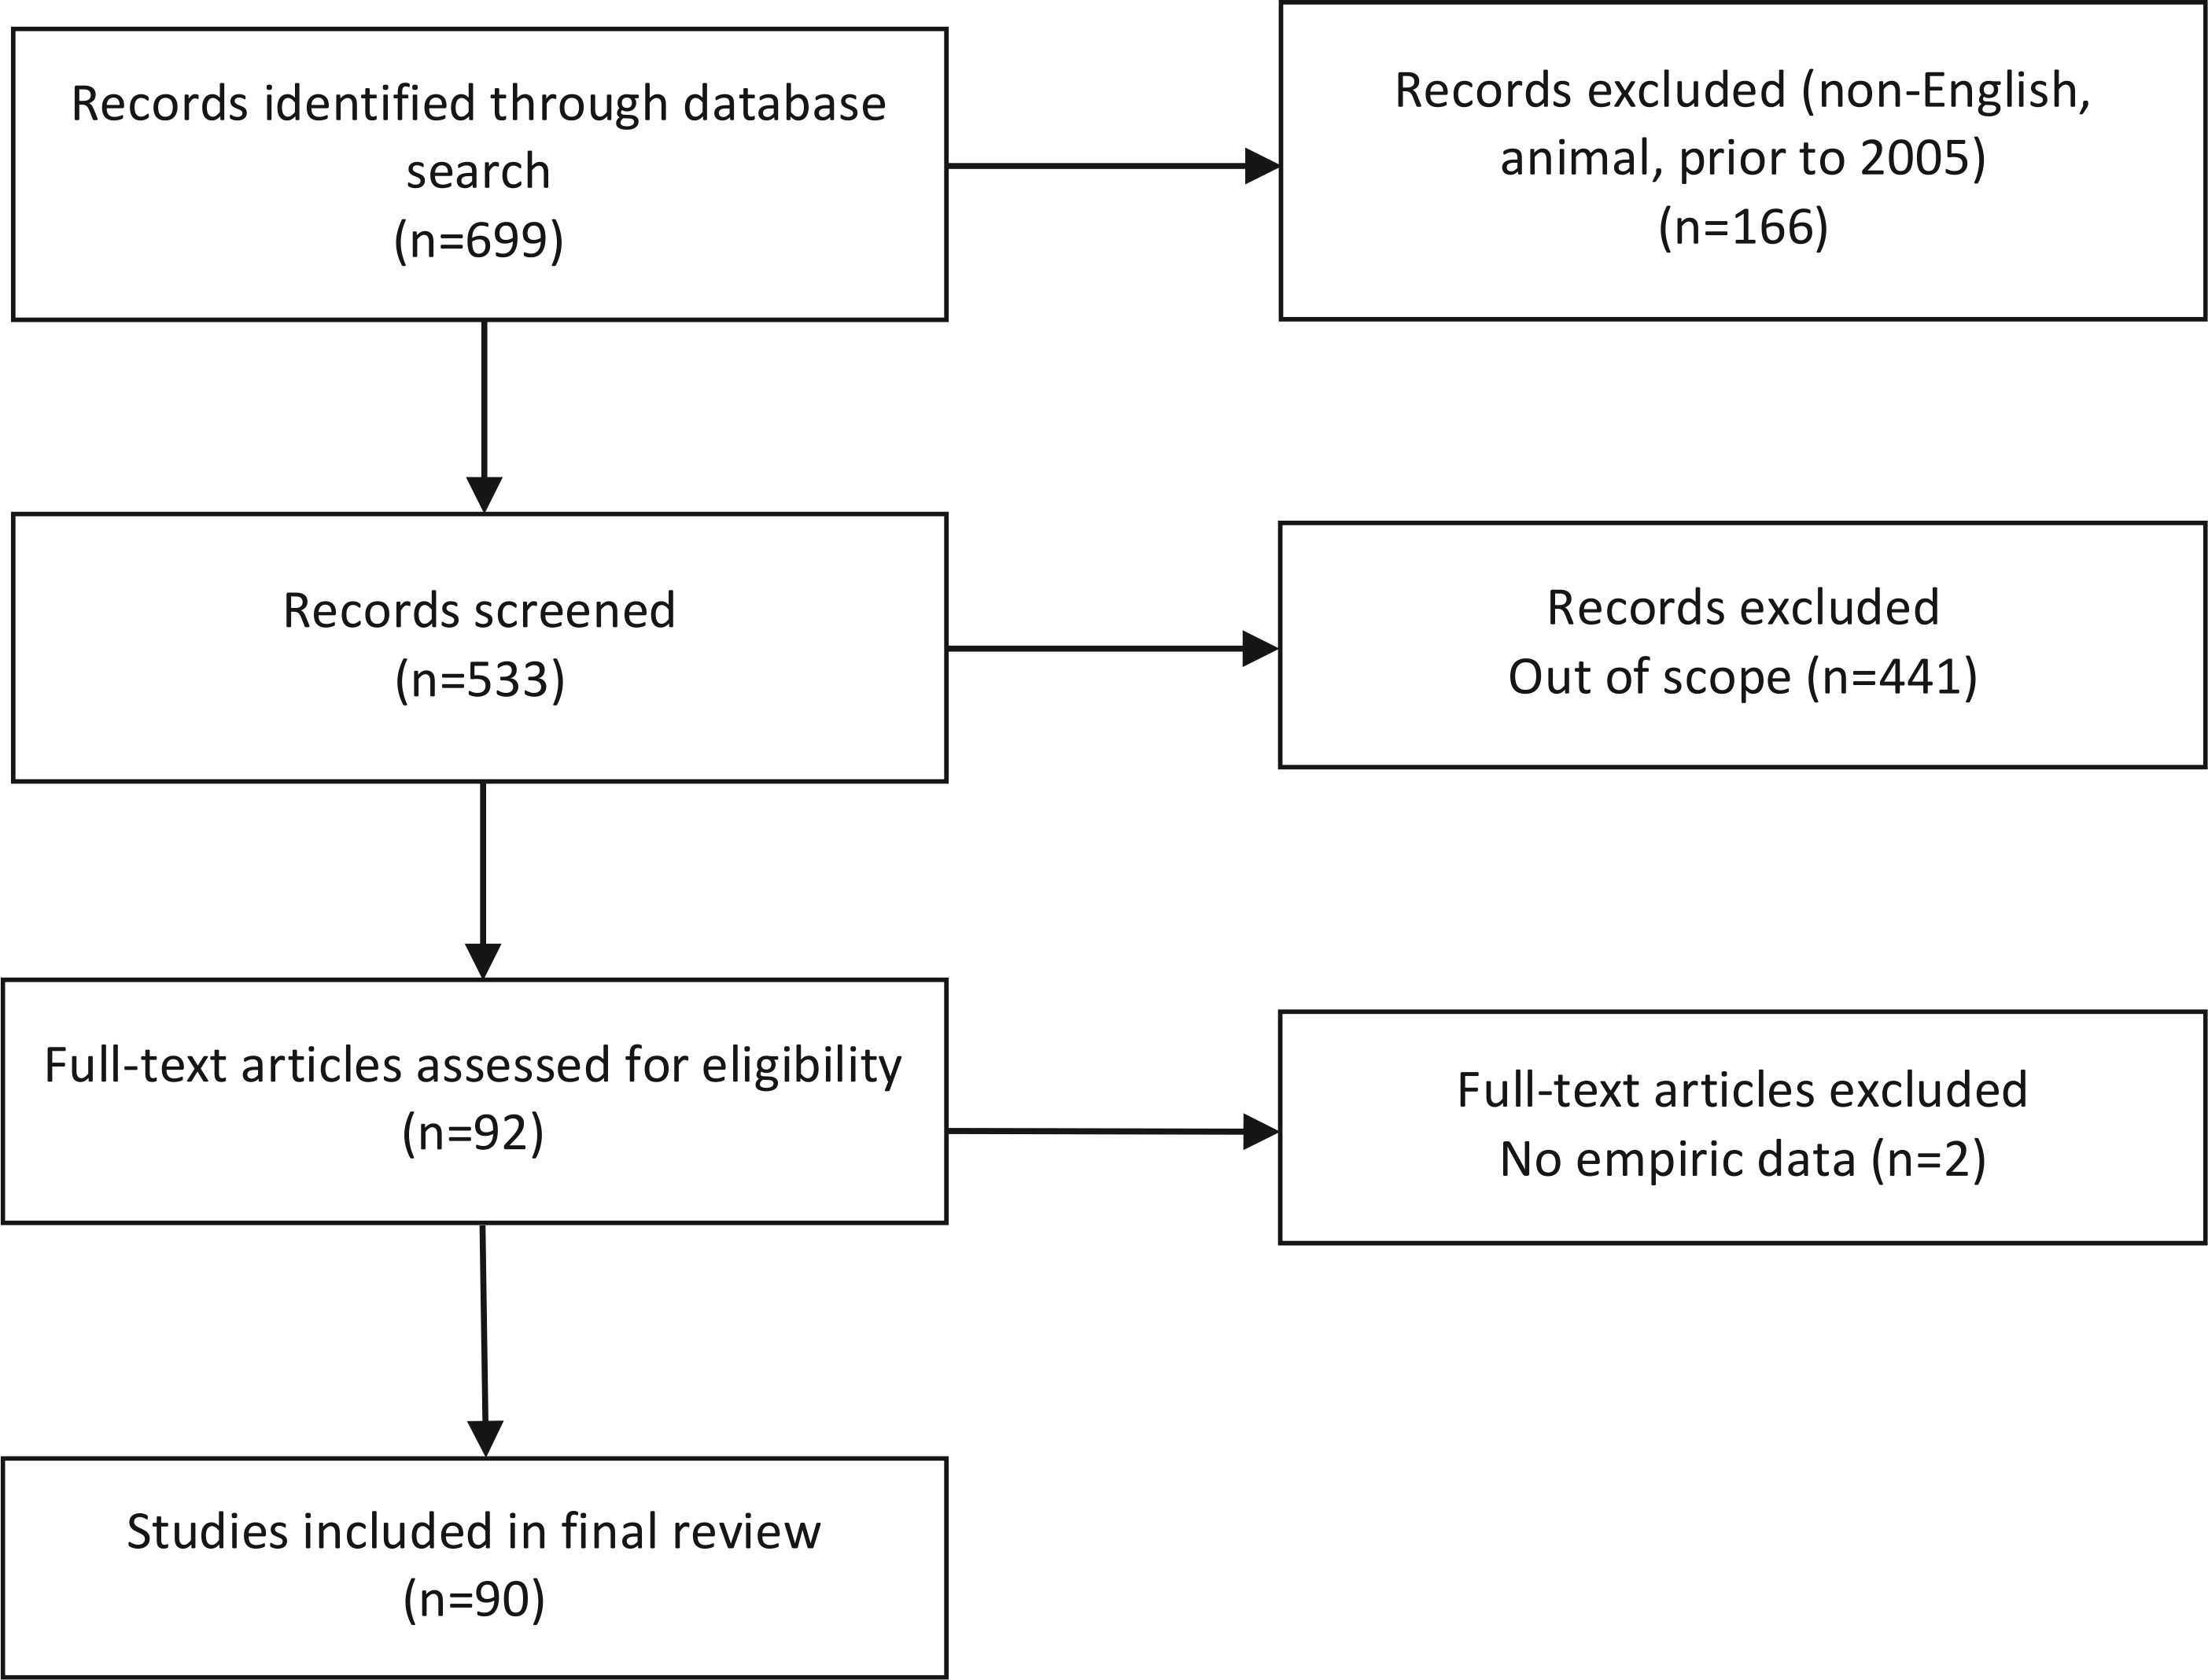
Search strategy.
Fault Tree Construction
Table 1 provides definitions for all relevant terms. Postoperative BSI was identified as the final undesirable event in the hierarchy. Faults were identified based on descriptions of circumstances leading to the occurrence of postoperative BSI. Intermediate faults were defined as midprocess faults, which each occur as a result of one or more preceding faults. Basic faults were defined as faults with sufficient data at the system level and no further discernable cause. The preliminary faults were refined and classified by a multidisciplinary team, including industrial engineers (ZAA, RK), a quality manager (CB), and clinicians (LMM, TAR). A preliminary fault tree was created and connection (AND/OR) gates were assigned. All members of the team then reviewed the fault tree.
Relevant Terms.
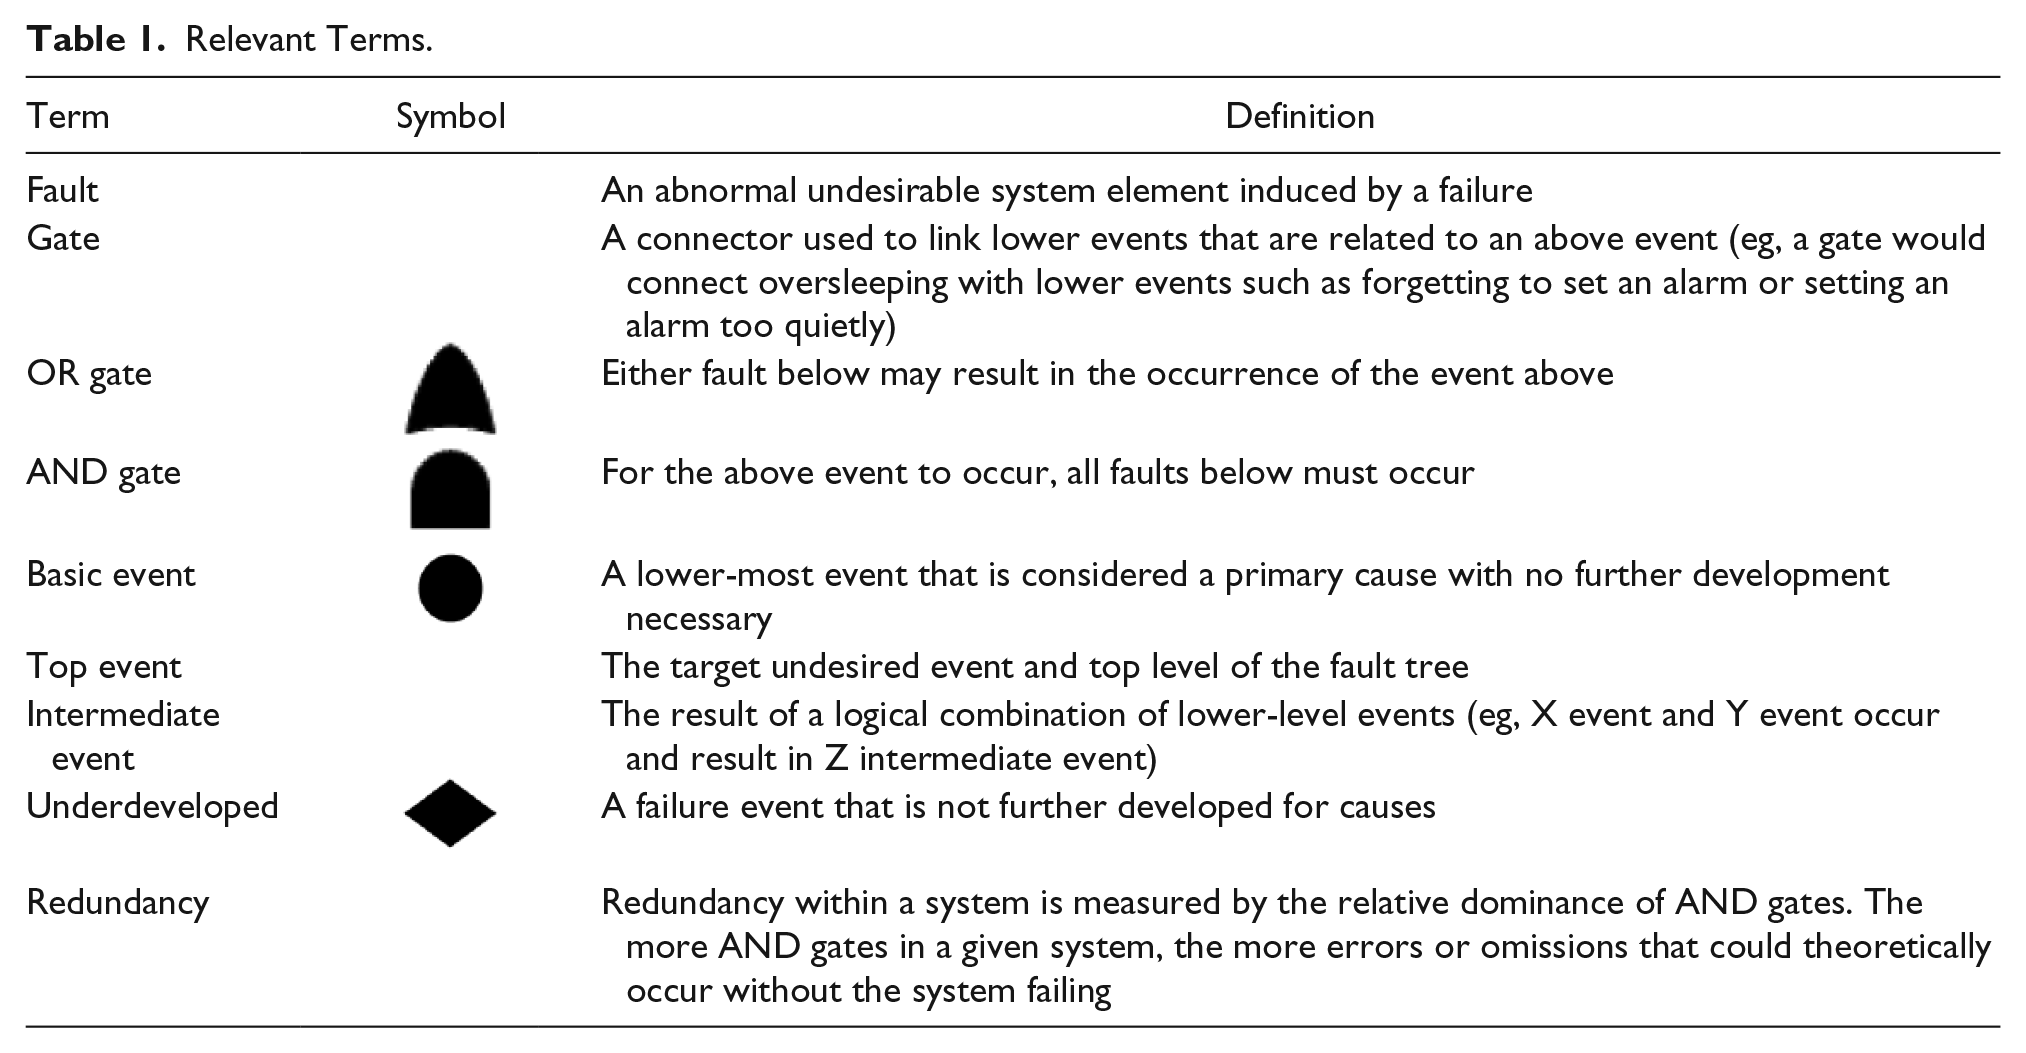
Faults were connected with one of 2 logical gates.
AND gates: all connected faults need to occur to result in the above undesired state.
OR gates: any single fault will result in the above undesired state.
After classifying the identified faults, the overall redundancy within the system was assessed. In reliability engineering, redundancy is defined as the existence of duplicate systems or components that serve as backup when the primary system fails. 16 Analogously, in the present study, redundancy was defined based on the protective nature of fault events connected with AND gates in the system. When 2 or more faults have to occur in order for a subsequent fault to happen, the system is protected with a redundancy because the absence of any one of the faults will prevent occurrence of the subsequent undesired state. System redundancy was quantified based on the number of AND gates within the fault tree. The more AND gates, the greater the system redundancy.
Data Reporting Programs
The final fault tree was used to compare 3 quality data collection and reporting programs: NSQIP, CMS, and The Joint Commission (JC). NSQIP requirements were obtained from the American College of Surgeons (ACS) NSQIP Data User Guide, with assistance from the ACS NSQIP Surgical Clinical Reviewer nurse at the study center. CMS and JC metrics were obtained from the respective Web sites.16,17 A summary of the reporting requirements, as used in this analysis, is provided in the online appendix (available at http://journals.sagepub.com/doi/suppl/10.1177/1062860615614944).
Results
The first 3 levels of the fault tree are shown in Figure 2. The complete tree includes 105 faults, connected by 34 OR gates and 4 AND gates, over 7 levels. Of the 105 total faults, 26 are included in the NSQIP (14 at levels 3 and 4), CMS (5 at levels 3-5), and JC (3 at levels 3 and 4) quality data reporting programs. (Online figures SDC 1-3, which show the complete tree, are available at http://journals.sagepub.com/doi/suppl/10.1177/1062860615614944.) An additional 4 faults are collected by multiple organizations: wound contamination class (CMS and JC), invasive device to blood contamination (NSQIP, CMS, JC), urinary tract infection (NSQIP, CMS, JC), and wound infection (NSQIP). Although presence of an invasive device leading to blood contamination is tracked by all reporting programs, none of the basic events that cause this fault are recorded (eg, failure to avoid femoral site, catheter change in setting of infection).
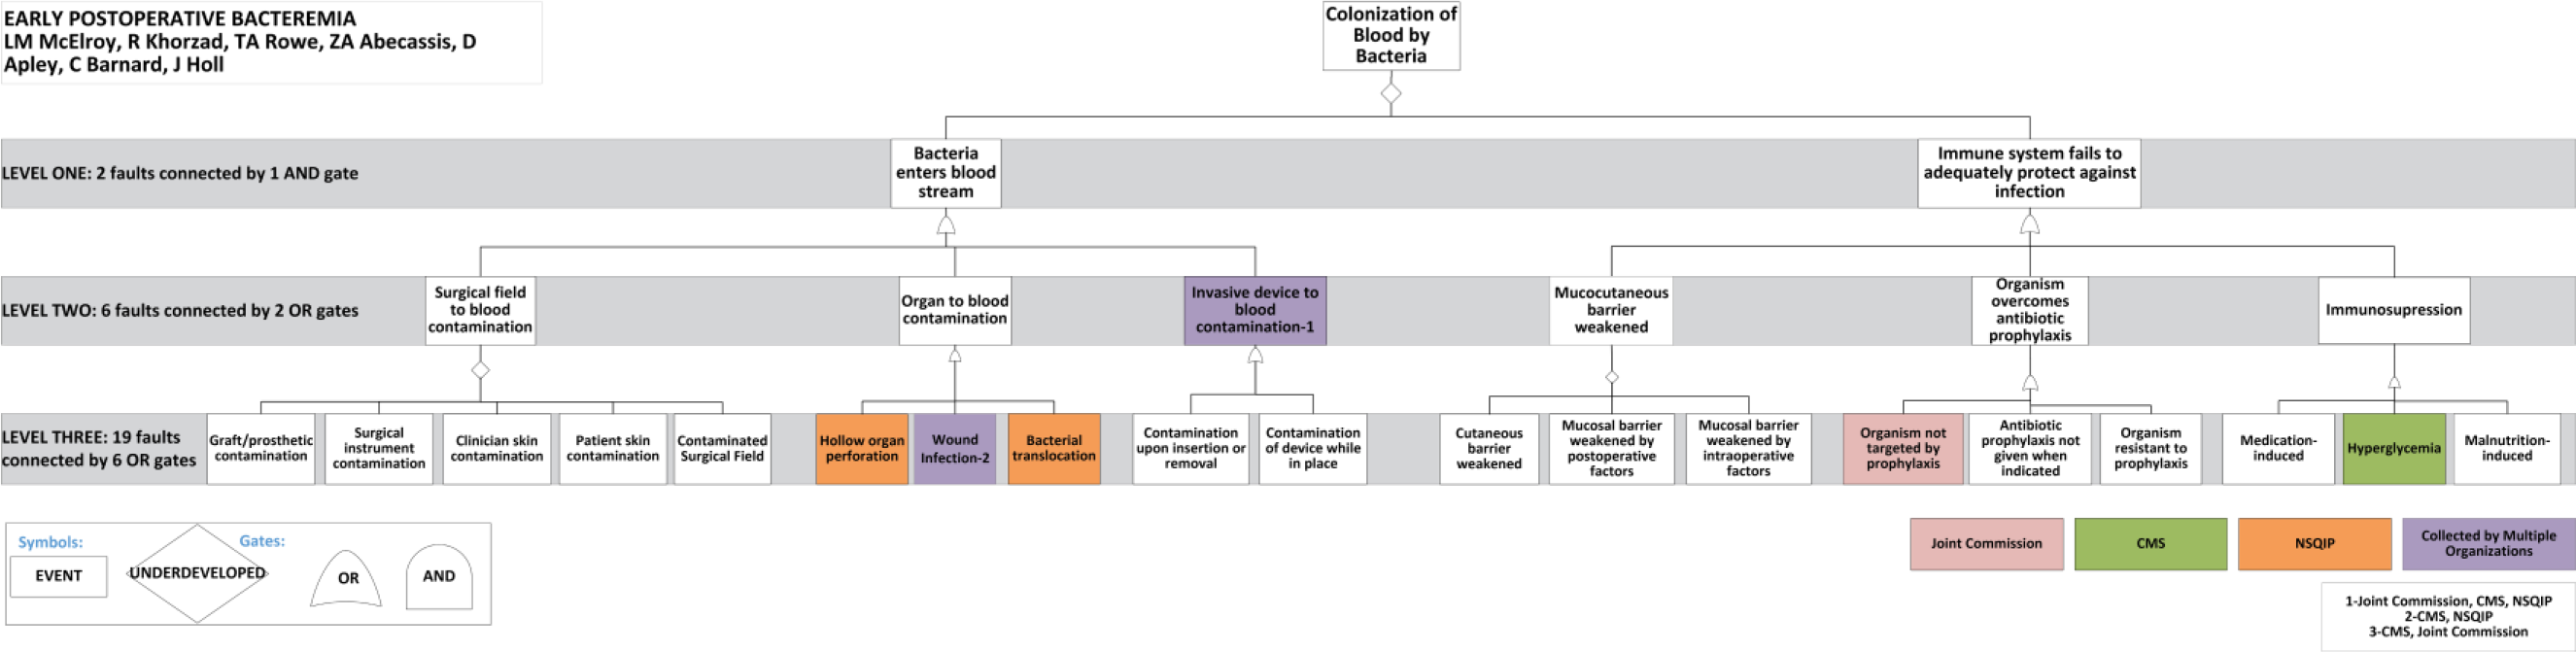
Levels 1 to 3 of the fault tree.
Fault Tree Levels
Table 2 summarizes the fault tree by levels. At level 1, 2 faults are necessary for the top-level event, iatrogenic BSI, to occur: entry of bacteria in the blood and failure of the immune system to adequately eliminate the bacteria. At level 2, 6 key intermediate faults encompass the vast majority of events noted in the literature. The first 3 faults, connected by OR gates, describe mechanisms by which bacteria enter the bloodstream. The next 3 intermediate faults, connected by OR gates, describe mechanisms by which the immune response fails to protect against infection. Overall, level 2 has no redundancy; any single fault can proceed to the next level. Of the 6 level-2 faults, one third are included in data quality reporting programs, one as a directly reported quality metric and one as an indirectly reported metric, meaning that if all preceding faults are reported, it is inferred.
Fault Tree by Level.
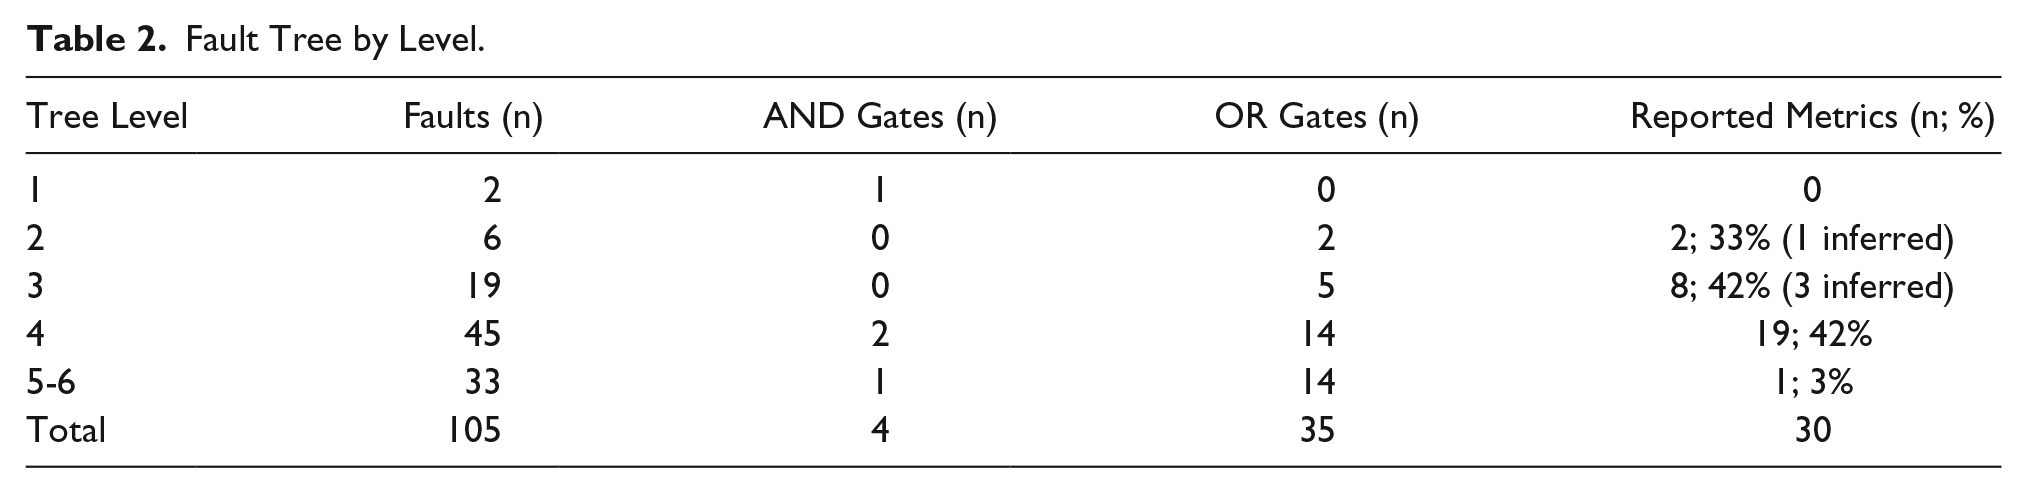
The breakdown of faults for levels 3 to 6 are shown in Table 2. Most of the faults in levels 5 to 6 have not been further explored for basic causes in this study.
Basic Causes of Postoperative BSI
The basic faults, identified on the tree, can be summarized by 7 causes of postoperative BSI: (1) failure to clean hands; (2) failure to prep skin; (3) inappropriate use of indicated antibiotic prophylaxis; (4) catheter exchange in the setting of active infection; (5) failure to provide postoperative enteral nutrition; (6) inappropriate line care; and (7) unintended iatrogenic immunosuppression (wrong dose, duration, or sequence). These causes represent active system failures, when the bad outcome occurs, but they also can help expose latent system failures such as “inexperience,” “unclear protocols,” or “work over load,” which together increase vulnerability of the system and the chance of clinical infection. Of the basic faults, 2 are required quality metrics: one by JC one by NSQIP.
Discussion
Postoperative BSI is a common source of morbidity and mortality in surgical patients, despite nearly a decade of efforts to reduce its occurrence. The FTA conducted in this study reveals a lack of redundancy in the systems and processes of care related to BSI prevention. The myriad faults that can lead to postoperative BSI are connected by 36 OR gates and only 4 AND gates, which suggests substantial vulnerability caused by single failures in the system. A commonly used analogy is the Swiss Cheese model, devised by James Reason, which emphasizes the need for systems that are better able to tolerate the occurrence of errors, such that several errors must occur for system failure to occur.18,19 However, without sufficient redundancy within a complex system, a single human error can trigger disastrous effects.20,21
An example of how redundancy could be added in this process to prevent BSI is the incorporation of technology such as “SwipeSense,” a system that improves convenience and measures point-of-care hand hygiene; it produces real-time data, thereby eliminating the need for time-consuming manual observations while improving compliance with hand hygiene through immediate feedback. Another example is the addition of semiautomatic safeguards to aid humans, such as an immediate alert to multiple people (including the patient’s caregiver) if a medication has not been given to a patient at the prescribed time.
The fault tree generated by this study identifies numerous contributing faults to BSI and reveals substantial variation in the requirements and ability of national quality data reporting programs to capture these potential faults. Although the metrics required by each program are clearly intended to support reduction in postoperative BSI, the metrics vary. Of the 3 reporting programs (NSQIP, CMS, JC) examined in this article, only 4 metrics were collected by 2 or more programs. In addition, no quality reporting program provided a method for collecting metrics for a comprehensive set of basic faults leading to postoperative BSI. NSQIP collected the largest number of potential faults (or contributing factors), suggesting that specialty-specific reporting programs supported by highly trained clinical abstractors may offer the most comprehensive metrics regarding faults that contribute to adverse clinical outcomes. It is also notable that this is the most expensive approach to collecting clinical quality data.
Collection of data for quality reporting and improvement creates an administrative burden and incurs costs in time and money. However, if well targeted, standardized to permit benchmarking, comprehensive, and with real-time feedback capabilities, such efforts can be valuable investments to help organizations measure, evaluate, and improve the quality and safety of care. But at present, the required data collection is demonstrably incomplete. Although some hospitals have chosen to augment mandatory data collection efforts with internal performance improvement efforts, such site-specific projects may preclude meaningful benchmarking. National efforts to prevent postoperative adverse events, such as BSI, will require better-targeted data collection. Health care providers, regulatory bodies, and agencies such as CMS and state agencies need to collaborate, standardize data collection, and accelerate transparency of data to the general public. The Minnesota Hospital Association Pilot Project is exemplar because it combined hospital clinical information and administrative data to create an enhanced database for quality improvement. 22 The risk-adjusted results are used to provide immediate feedback to hospitals about their performance and to inform quality improvement efforts. The project has a multifaceted communication strategy that includes a Web page, summary graphics, intranet communications, and conference calls. This effort demonstrates how a local effort that combines health information technology with a robust implementation strategy can reduce administrative burden and facilitate ongoing communication around a clinical problem of interest.
Limitations of this study include those inherent to any FTA, including the possible omission of faults that can contribute to BSI. The analysis is qualitative and the fault tree would be strengthened by quantitative analyses to populate each fault with its frequency to allow for prioritization of causes of postoperative BSI. Such a quantitative analysis also may be a more accurate way to assess the adequacy of quality-required metrics at institutional levels and requires the existence of reliable data to estimate these frequencies. However, because infection is still a relatively low-frequency event, usual epidemiological strategies may not be sufficient to identify the specific contribution of each basic failure to the incidence of infection.
Thus, despite limitations, the fault tree created in this study is useful as a template to facilitate root cause analysis and to guide data collection efforts for quality improvement. In addition to the qualitative results of the fault tree, each fault can be populated with national or local incidence rates to determine the highest-yield target for intervention design. Quality improvement collaboration may be one way to increase the richness and usefulness of information about root causes of postoperative BSI. There are numerous national improvement collaboratives, focused on CLABSI, catheter-associated urinary tract infection, and early recognition of sepsis, via the national Hospital Engagement Networks and other initiatives. Specialty-specific collaboratives such as NSQIP currently offer the most comprehensive and clinically sophisticated data collection.
US hospitals are faced with regulatory, financial, and community transparency pressures to collect and report data on quality-related processes and outcomes. The 3 nationally significant reporting programs, NSQIP, CMS, and JC, lead data collection efforts for US health care institutions but lack systematic collection of enough data points to analyze root causes that contribute to the outcome of BSI. Although the fault tree can be used as a template to facilitate root cause analyses and develop tailored interventions, it also can help determine what additional data should be collected to understand the root causes of BSI. Improvement efforts will be hampered if they lack a comprehensive understanding of the root causes. To the extent that root causes are unpreventable, measurement of infections also will be compromised by inadequate risk adjustment. National efforts to prevent postoperative BSI will require better-targeted collection of data and increased collaboration among health care providers and governing and regulatory bodies.
Footnotes
Declaration of Conflicting Interests
The authors declared no potential conflicts of interest with respect to the research, authorship, and/or publication of this article.
Funding
The authors received the following financial support for the research, authorship, and/or publication of this article: This work is funded by the Agency for Healthcare Research and Quality and National Institute of Diabetes and Digestive and Kidney Diseases T32 training grants (McElroy 5T32HS78-15, T32DK77662-7).
References
Supplementary Material
Please find the following supplemental material available below.
For Open Access articles published under a Creative Commons License, all supplemental material carries the same license as the article it is associated with.
For non-Open Access articles published, all supplemental material carries a non-exclusive license, and permission requests for re-use of supplemental material or any part of supplemental material shall be sent directly to the copyright owner as specified in the copyright notice associated with the article.