
Abstract
Workflows in the service industry are subject to exceptional circumstances that affect the ability to complete work in a timely manner. For instance, workflows may need to deal with sudden spikes in customer demand due to a variety of events such as promotional deals, product launches, major news, or natural disasters. Escalation strategies can be incorporated into the design of a workflow so that it can cope with sudden spikes in the number of service requests while mitigating the effects of missed deadlines. In this article, we propose a method for evaluating escalation strategies using simulation technology. The effectiveness of the proposed method is demonstrated on a workflow from an insurance company.
Introduction
Business processes in the service industry are vulnerable to sudden increase in demand due to exceptional circumstances. For example, in the insurance industry, severe flooding caused by heavy rain may lead to sudden spikes in insurance claims. In order to cope with such spikes, insurers need to rapidly adapt their operations, for example, by incorporating escalation strategies into their workflows.
In the context of workflow management, an escalation is an action performed when a workflow execution is delayed to the extent that it is not on track to meet its deadline (Van der Aalst et al., 2007). For example, in an insurance claim workflow, an escalation is to redeploy staff from other departments into the call centers or to require less information from callers when lodging insurance claims so that more claims can be recorded. The decision on whether or not to escalate, and how, needs to consider the cost of missing the deadline (e.g. lower customer services standards) and the cost of escalating (e.g. additional staff costs).
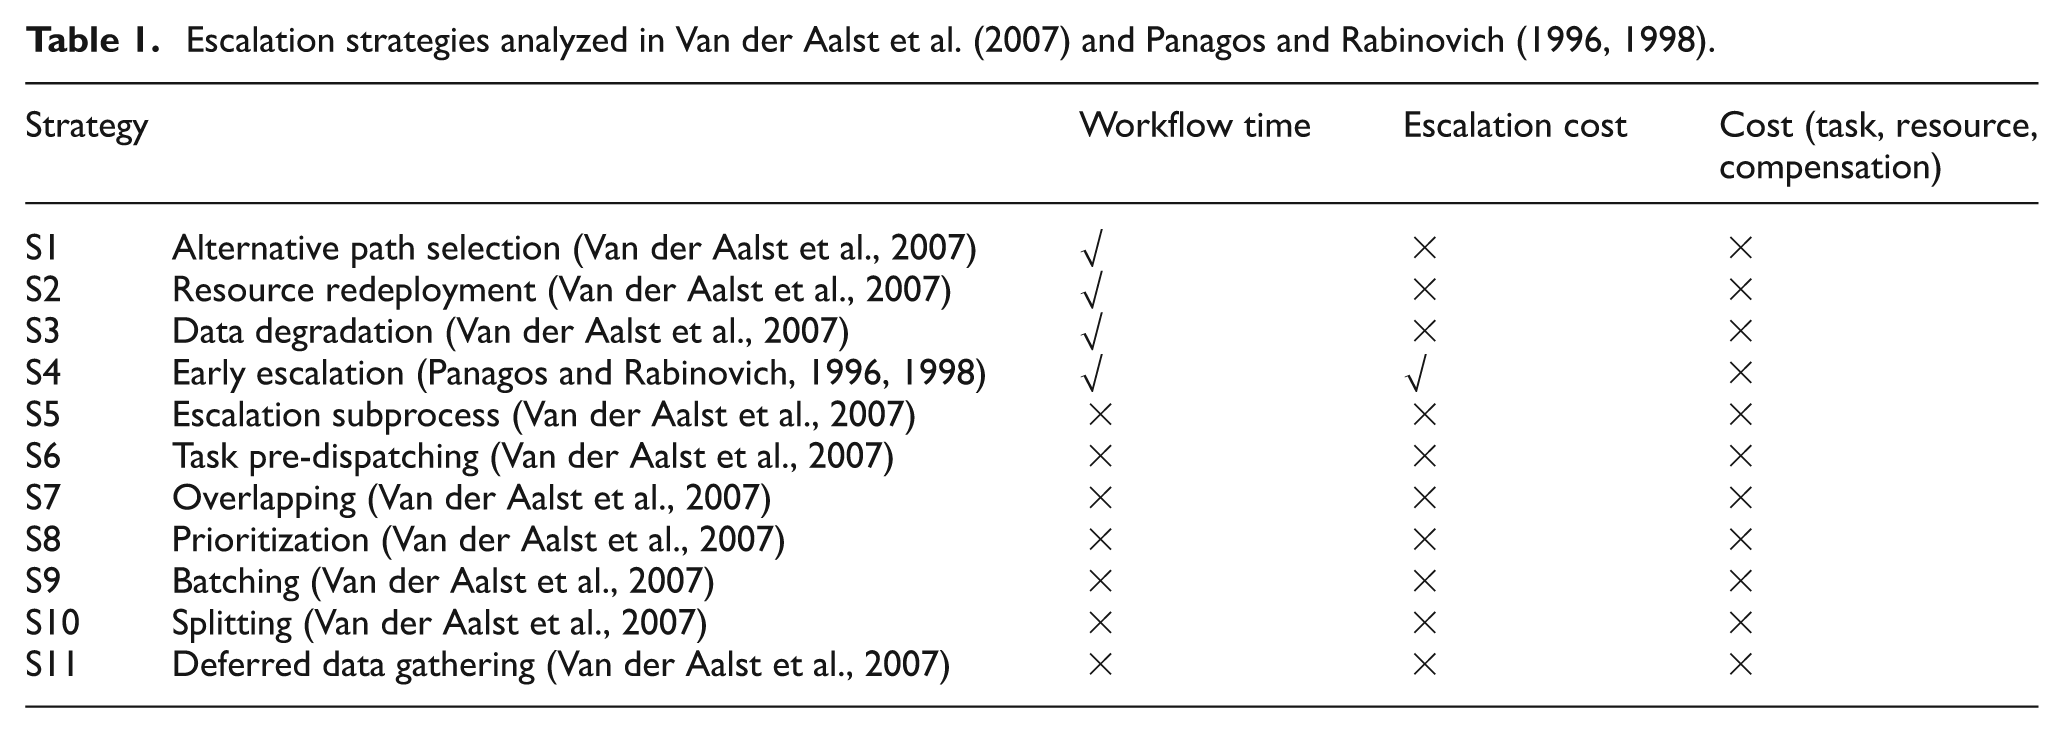
Several escalation strategies have been proposed in the literature (Panagos and Rabinovich, 1996, 1998; Van der Aalst et al., 2007), each one with its own trade-offs. In a previous work (Chan et al., 2009), a simulation-based method for evaluating four deadline escalation strategies proposed in the literature (Panagos and Rabinovich, 1996, 1998; Van der Aalst et al., 2007) was presented as follows:
S1: Alternative path selection (Van der Aalst et al., 2007). An alternative execution path is taken to accelerate the execution in order to meet a deadline (at the detriment of additional cost or reduced quality).
S2: Resource redeployment (Van der Aalst et al., 2007). Resources (workers) are moved from one resource pool to another in order to accelerate certain tasks that may cause some workflow cases to run late.
S3: Data degradation (Van der Aalst et al., 2007). Data entry or data checking steps are performed in a minimalistic manner or postponed to a late stage in order to meet a deadline.
S4: Early escalation (Panagos and Rabinovich, 1996, 1998). Continuous monitoring and prediction algorithms are employed to detect deadline violations as early as possible. When it is detected that a deadline may be missed, a task is triggered to inform a designated actor about the potential deadline violation.
In this article, we extend the simulation-based method presented in Chan et al. (2009) to deal with seven additional escalation strategies proposed in Van der Aalst et al. (2007), namely, escalation subprocess, task pre-dispatching, overlapping, prioritization, batching, splitting, and deferred data gathering. These strategies are applied to a case study from the insurance industry. Using this case study, we show how to design simulation experiments to evaluate the impact of escalation strategies on key performance indicators (KPIs). In doing so, we illustrate trade-offs involved when selecting escalation strategies and provide guidelines to deal with these trade-offs.
This article is structured as follows. In section “Background and related work,” we discuss related work on escalation and time management in workflows. In section “Escalation strategies,” we introduce the escalation strategies. In sections “Escalation strategy evaluation method,”“Introducing escalations,” and “Experimental results,” we describe the simulation method and illustrate it via a case study. Finally, we conclude in section “Conclusion.”
Background and related work
Panagos and Rabinovich (1996, 1998) proposed “Dynamic Deadline Adjustment” and “Early Escalation” as complementary strategies to minimize the number of escalations needed during workflow execution and to mitigate their associated costs. Dynamic Deadline Adjustment aims at minimizing the number of escalations by attaching an “expected execution task” to each task, and by continuously monitoring each workflow execution in order to detect delays as soon as possible. When a task takes less than expected to complete, the difference between the expected and actual execution time is accumulated into a slack time variable. When the slack time is negative, it means that the workflow execution is delayed. This is where a second strategy, namely, Early Escalation, kicks in. In the Early Escalation strategy, an algorithm is used to predict whether a case is going to miss a deadline. When a potential deadline violation is detected, the case is escalated. Escalations are defined as actions executed in parallel to the normal workflow in order to reduce the risk of a deadline violation. Panagos and Rabinovich (1996, 1998) evaluate their strategies using simulation technology, but only from a temporal perspective (without considering resource costs).
Van der Aalst et al. (2007) analyze deadline escalation strategies using a so-called 3D approach (Detect, Decide and Do). In this approach, potential deadline violations are first detected and suitable escalation strategies are selected and applied. Van der Aalst et al. (2007) evaluate the effectiveness of some sample escalation strategies using simulation experiments. The strategies considered in their study are alternative path selection (performing an alternative task when the execution is delayed), resource redeployment (bringing in more resources into the workflow execution), data degradation (requiring less data input in order to move faster), escalation subprocess, task pre-dispatching, overlapping, prioritization, batching, splitting, and deferred data gathering. Similar to Panagos and Rabinovich (1996, 1998), Van der Aalst et al. (2007) only evaluate escalation strategies from the time perspective. In contrast, in this article, we propose a simulation-based method that takes into account the cost of task execution, the cost of resources, and compensation cost. The escalation strategies analyzed in Van der Aalst et al. (2007) and Panagos and Rabinovich (1996, 1998) are summarized in Table 1. In this article, we focus on strategies S5–S11 as the first four strategies are analyzed in our previous work (Chan et al., 2009).
Escalation strategies analyzed in Van der Aalst et al. (2007) and Panagos and Rabinovich (1996, 1998).
Other work in the field of workflow escalation includes that of Georgakopoulos et al. (2000), who outline an approach to support dynamic changes in workflows in crisis situations (e.g. for rescue operations during natural disasters). Their focus is on enabling decision makers to escalate at runtime by changing the course of the workflow execution as required, while retaining some level of control. In contrast, our work focuses on analyzing the effectiveness and costs of different escalation strategies at design time.
A related topic is that of specifying and analyzing time constraints in workflows. Eder et al. (1999) propose Program Evaluation and Review Technique (PERT)-like techniques for analyzing time constraints attached to workflows. Bettini et al. (2002) propose algorithms for checking time constraint satisfiability at design time, while Chen and Yang (2008) propose techniques for efficiently checking time constraints at runtime. Finally, Rhee et al. (2004) propose a PERT-based technique to calculate critical paths and slack time and a guide to help workers prioritize tasks in order to optimize throughput. These and similar related studies are complementary to ours since we do not deal with checking time constraints or optimizing the overall execution of the workflow, but we focus on evaluating escalation strategies to deal with workflow cases that are likely to miss their deadlines.
Previous work also addresses the issue of determining the (minimum) amount of resources needed in a workflow in order to ensure that temporal constraints are met with a certain probability (Son and Kim, 2001). The reverse analysis is done in Li et al. (2004), where based on the available resources, estimates of average execution time per workflow instance are derived. This work is complementary to ours: the estimates obtained using such techniques can be used to implement escalation strategies based on resource redeployment.
Escalation strategies
A case is an execution of a workflow model (also called process model). For example, in an insurance claim process, a case is the set of activities performed in order to handle a given insurance claim. An escalation strategy describes actions to be taken when a case or a set of cases are predicted to miss the deadline. In this article, we consider the following escalation strategies.
S5: Escalation subprocess. When a case is predicted to miss a deadline or the case has already missed the deadline but is still active, a special subprocess is instantiated. The subprocess is intended to perform actions specifically related to the deadline violation, such as renegotiating a new deadline or performing compensation actions and canceling the case.
S6: Task pre-dispatching. The idea of task pre-dispatching is to “pipeline” the execution of upcoming tasks in the case in order to accelerate the case. In other words, a lookahead is performed to find out which tasks will need to be executed, and wherever possible, preparations for these tasks are triggered, for example, by putting these upcoming tasks on the worklists of the corresponding workers so that they are aware that they will need to perform the task with urgency once it is ready for execution. In the case where the execution of an upcoming task is conditional (e.g. only if a certain branch in the workflow is taken), it may happen that the preparatory actions for this task need to be undone. This means that this strategy might create additional work that may become later unnecessary (thus cost is increased). In this article, we examine the case where only upcoming tasks that definitely need to be performed (as opposed to conditionally) are pre-dispatched.
S7: Overlapping. The main idea is to make two sequential activities execute in parallel as much as possible. This strategy decreases the workflow time by creating concurrency, along the lines of task pre-dispatching. However, the trade-off is that this strategy increases the coordination overhead between tasks and therefore involves additional costs. It also involves allocating resources earlier, and this may have an impact on other cases.
S8: Prioritization. By assigning higher priority to cases that are running late, this strategy allows these cases to be accelerated at the expense of other cases competing for the same resources. The assignment of priority can be driven by various parameters such as the cost of the case and waiting time. The priority value is used to rank work items that are waiting to be assigned to a given resource (i.e. work items corresponding to cases with higher priority are given precedence). This strategy will make some cases with low priority have longer workflow time because they will spend more time in the waiting queues. In this article, the compensation cost is used as the priority value of a case: the higher the compensation cost of a case is, the higher the priority of work items associated to this case.
S9: Batching. Group tasks or cases together and assigns them to one resource or a group of resources. This strategy reduces the workflow time by eliminating setup times and handover time, but it also entails that some cases will be waiting for others before being treated in batch.
S10: Splitting. In this escalation strategy, a task assigned to a resource or group of resources is split into smaller tasks that are performed in parallel and assigned to separate resources. Because of parallelism, this strategy can reduce the workflow time. The trade-off is the additional setup time, handover time, setup cost, handover cost, and cost of consolidating the outputs of smaller tasks.
S11: Deferred data gathering. The idea of this strategy is not to gather data until the point when these data are actually needed. The idea here is that some workflows have tasks early on during the workflow that are meant to gather data from the user or other stakeholders. However, some of these data are not needed straight but only later in the workflow. Accordingly, data gathering tasks may be accelerated by requiring less data to be gathered, thus speeding up the workflow execution. When data are actually needed, they are gathered by the task that needs the data.
Escalation strategy evaluation method
In this section, we present the simulation-based method for evaluating escalation strategies. The method consists of the following steps: (1) annotate the process model, (2) define normal and escalated scenarios, (3) simulate scenarios and estimate escalation needs, (4) introduce escalations by “perturbing” the workflow models, (5) simulate the workflow model with escalations, and (6) analyze simulation results.
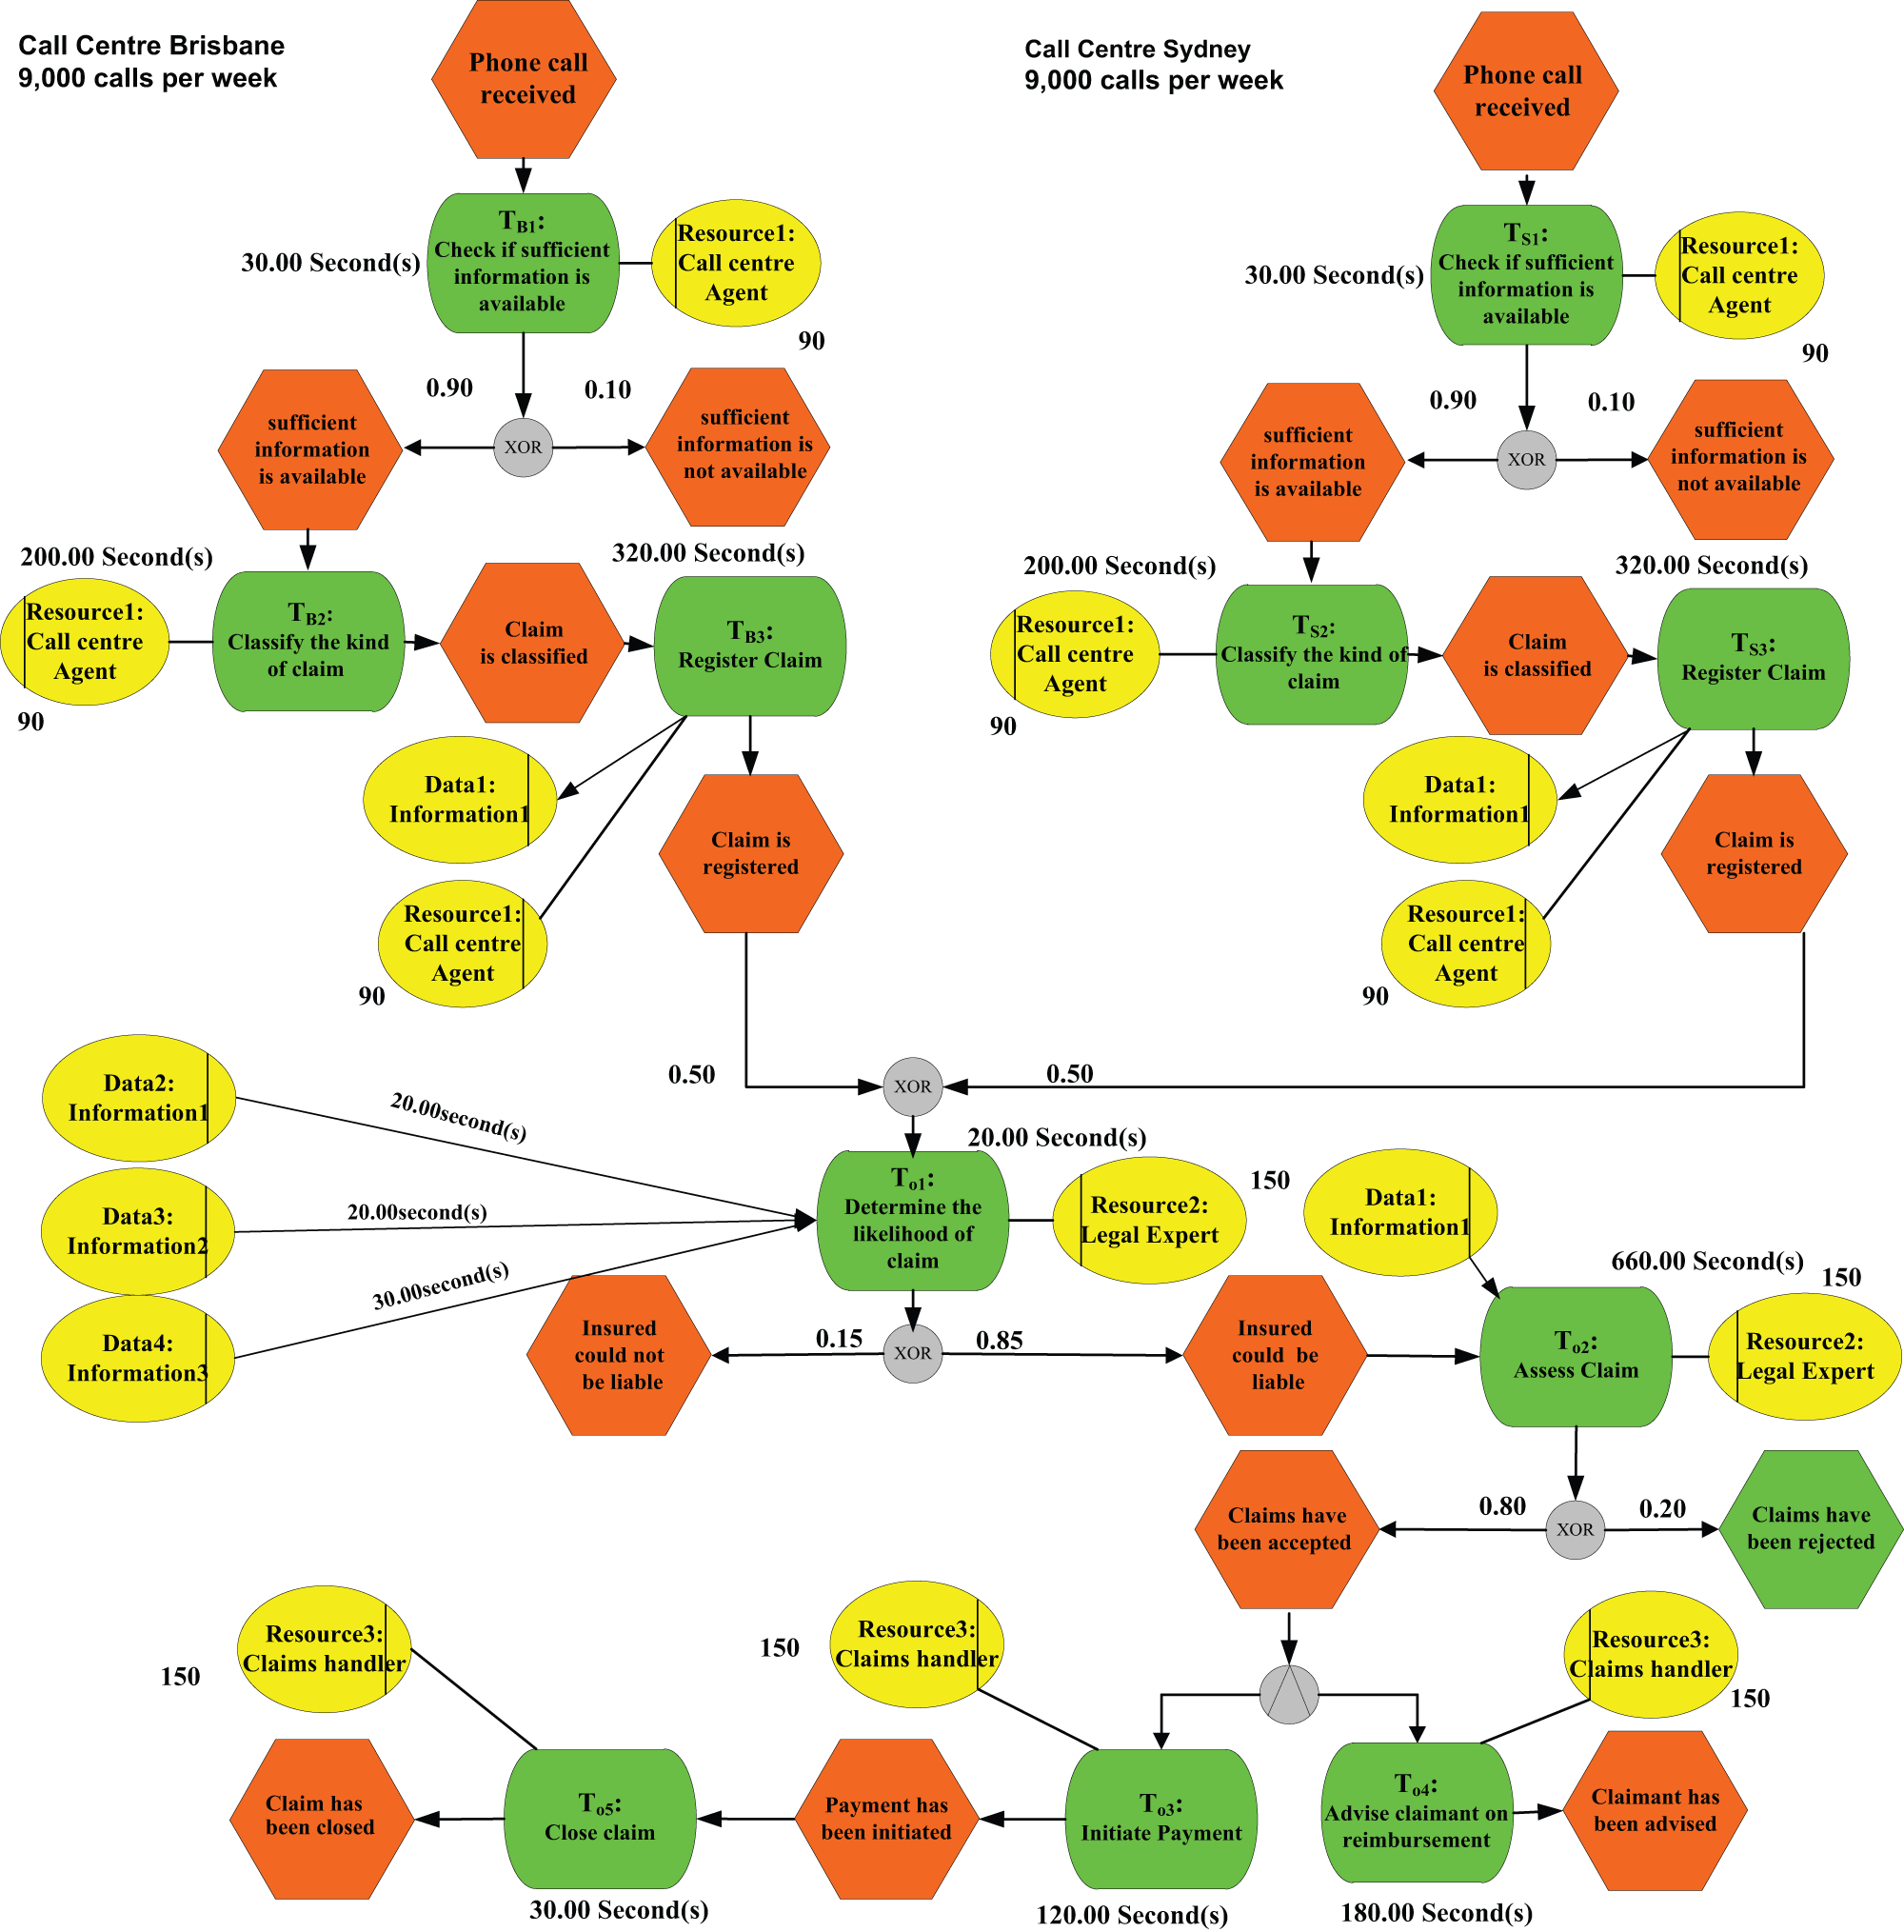
To illustrate the method, we will make reference to an insurance claims handling process model taken from Van der Aalst et al. (2007). The process model is depicted in Figure 1 in the form of an Event-Driven Process Chain (EPC). In the EPC notation, a process model is represented as a directed graph consisting of functions (rounded rectangles) representing tasks; events (hexagons) representing, for example, outcomes of decisions; connectors (circles) representing, for example, points of choice; and resource types (ellipses). 1
The base model.
The EPC model in Figure 1 captures a process in a large Australian insurance company for handling inbound phone calls for lodging different types of insurance claims. Three subprocesses are involved in this process: the back-office subprocess, the Brisbane call center subprocess, and the Sydney call center subprocess. There are three tasks in each call center: “check if sufficient information is available,” “classify the kind of claim,” and “register claim.” Call center agents handle all tasks in each call center. Each case must be handled by a single resource. There are 90 call center agents assigned to each call center, respectively. In task “register claim,” one data item is required as input. In normal conditions, approximately 9000 calls are received in each call center. Once the information gathering process in the call center has been completed, a claim moves into the back-office process.
In the back office, there are 150 legal experts, 150 claim handlers, and 5 tasks: (1) determine likelihood of claim, (2) assess claim, (3) initiate payment, (4) advise claimant on reimbursement, and (5) close claim. An insurance claim will be rejected in call centers or in back office if the claim is not qualified for reimbursement. Similar to call centers, each case in back office is handled by identical resources. In task “determine likelihood of claim,” three data items are required as input. In task “access claim,” one data item is required as input.
We extend the insurance claim scenario from Van der Aalst et al. (2007) by
Including an additional task “classify the kind of claim” and a new data item for the task “register claim” for both call centers;
Introducing three new data items for the task “determine the likelihood of claim” and a new resource called “legal experts” for the first two tasks in the back office.
In the first step of the method, the modeler gathers data to annotate the process model with attributes. These attributes are classified into four dimensions: task, case, resource, and data as discussed below. The problem of assigning values to simulation attributes has been widely studied in the field of business process simulation (Greasley, 2004; Tan and Takakuwa, 2007). Complementary techniques to this problem include the following:
Domain expertise derived via interviews or other qualitative data gathering methods (e.g. wide-band Delphi) with domain experts.
Sampling experiments, wherein simulation attribute values are derived from observations made on a sample of cases in the workflow during a given time window.
Industry benchmarks such as Supply-Chain Operations Reference (SCOR) and American Productivity and Quality Centre (APQC) that provide reference values for KPIs of typical processes in a variety of domains.
Input analysis, wherein simulation attributes are derived from past execution data, such as, for example, analyzing records of task execution times in order to determine the probability distribution of the duration of each task.
Sensitivity analysis, wherein a given assignment of values to simulation attributes—obtained via one of the above methods—is tested against reality by running simulations with the assigned attribute values and comparing the simulation results with the observed performance of the “As Is” process.
In the case study at hand, attribute values were derived from the case study data provided in Van der Aalst et al. (2007), which were themselves derived from interviews with domain experts. In the case of “data attributes,” values were chosen in a way that is consistent with the data in Van der Aalst et al. (2007), though not directly taken from Van der Aalst et al. (2007).
Attributes of a task
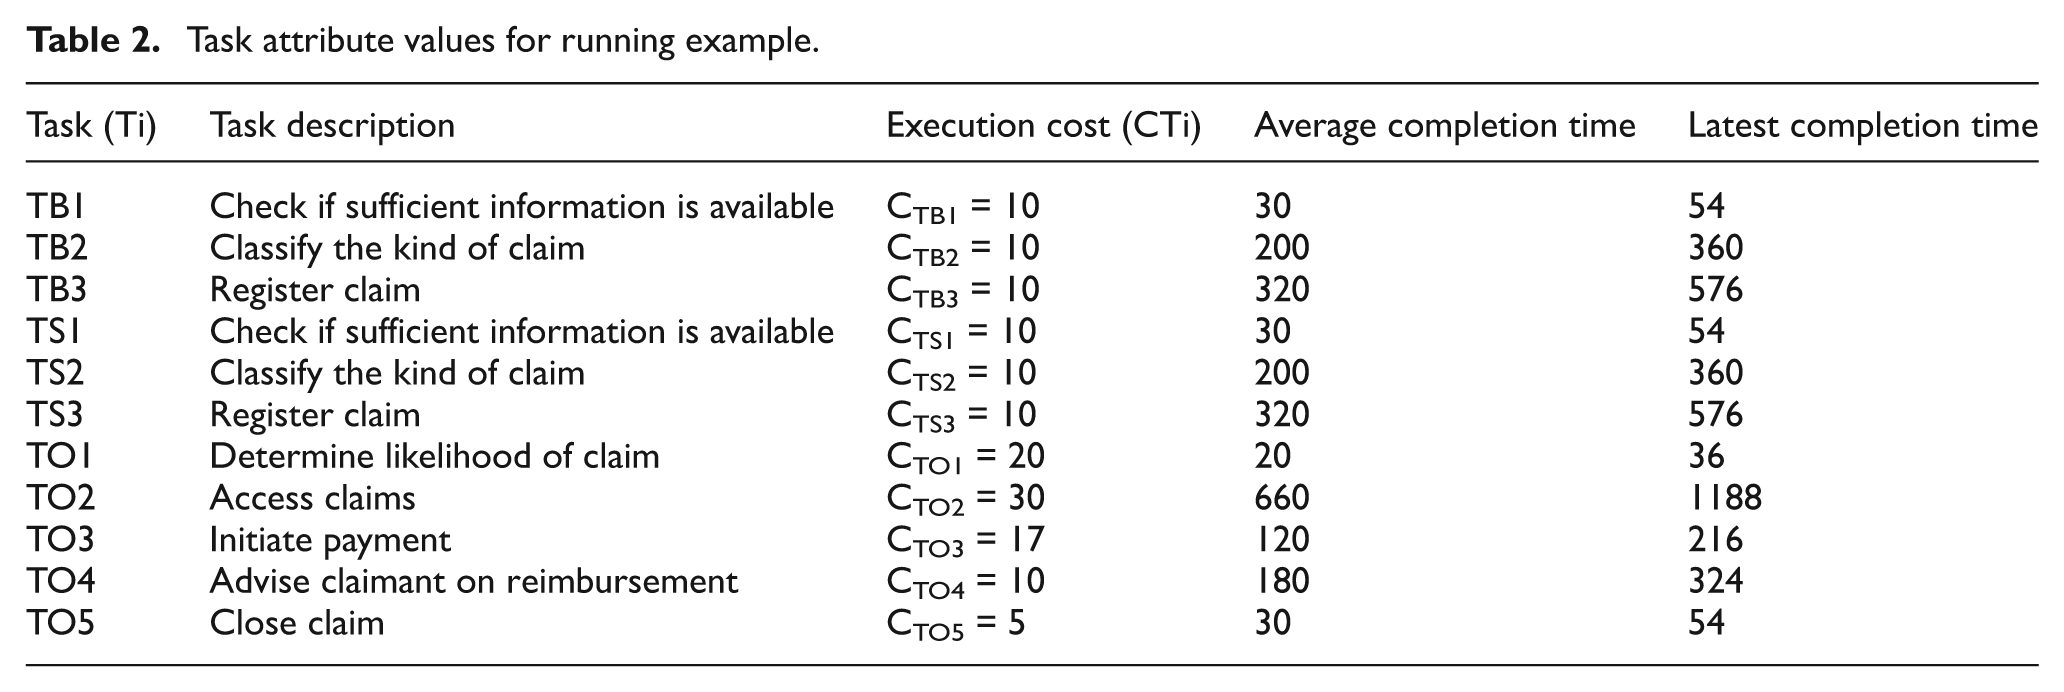
Each task is assigned with an average execution time (shown in seconds in Figure 1). In addition, for each task, three attributes are required to assess escalation options: execution cost, average completion time, and latest completion time. Latest completion time is defined as 1.8 times of average completion time. Exponential distribution is used in the simulation for the execution time of every activity. In Table 2, we give initial attribute values for each task in the running example.
Task attribute values for running example.
Attributes of a case
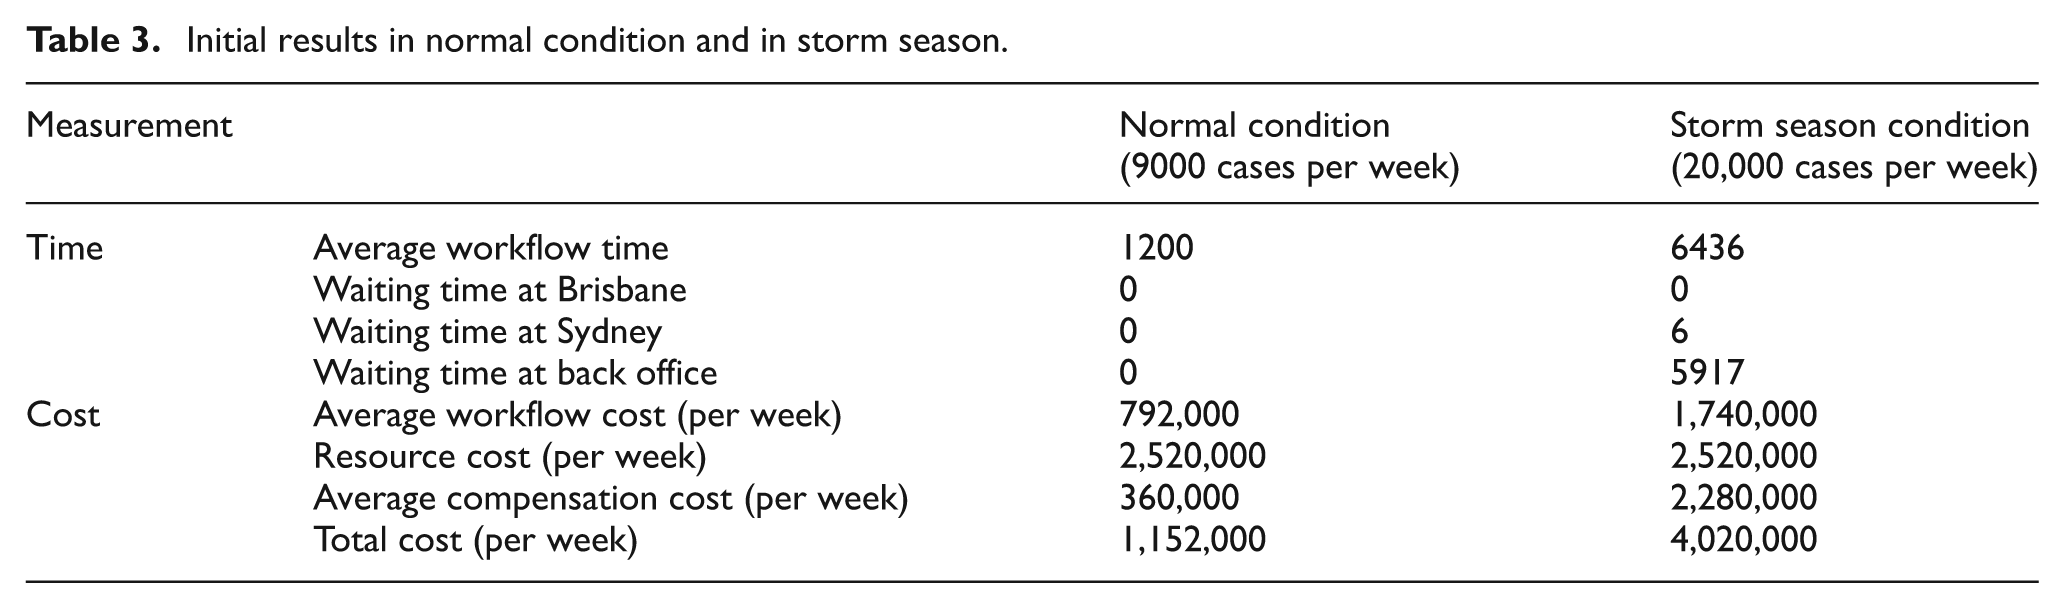
Each case is assigned a unique identifier as well as a deadline, which is calculated based on average execution time of the tasks in the critical path of the workflow. In addition, a compensation cost (i.e. the cost of missing the deadline) is assigned to each case. The compensation cost can be a fixed amount, or a value from a certain range, or a function that takes as input the amount of time by which the deadline is missed. In the running example, we assume that escalation cost is uniformly drawn from the range (120–170).
Attributes of a resource
Each (human) resource has three attributes: (1) role: used to describe the responsibility of an employee in the workflow; (2) amount: number of resources; and (3) cost: wage of a resource. Three types of resources (Resource 1, Resource 2, and Resource 3) are defined in the running example. The first type of resources is composed of 180 call center agents. The second type of resources includes 150 legal experts. The third type of resources includes 150 claim handlers. There are 90 call center agents assigned to each call center, respectively. Legal experts are assigned to tasks TO1 and TO2 in the back office. Claim handlers are assigned to the remaining tasks TO3, TO4, and TO5 in the back office. The wage of a call center agent is 4000 (per 2 weeks), and the wage of a legal expert and claim handler is 6000 (per 2 weeks). Resource cost represents the cost of utilizing a specific resource for a case.
Data attributes
Each association (task, data object) is annotated with an estimated preparation time—the time required to retrieve and prepare the data for the task in question. In the running example, three data objects (Data1, Data2, and Data3) are required for task “Determine likelihood of claim.” This task can only be executed when all three objects are available. In our experiments, the preparation time of Data1, Data2, and Data3 was 20, 20, and 30 s, respectively.
The second step of the simulation method is to define the scenarios: one normal scenario and one or many escalated scenarios. In the running example, we assume that there are two scenarios: (1) a normal scenario with approximately 9000 cases per 2-week period at each call center and (2) an escalated scenario (storm season) where the number of calls increases to 20,000 cases. Here, we assume a negative exponential distribution, but other distributions can be adopted.
The third step of the method is to encode the process model and associated attributes for the normal scenario using a discrete event simulation technique. In this article, we use Colored Petri Nets (CPN; CPN Group, 2013), but other techniques/tools could be used instead (e.g. Arena).
Once the initial process model and its attributes are encoded, we simulate it under each scenario. Table 3 shows the results of simulation in storm season and in normal condition. The results show that the current model is suitable for the normal scenario but not for the storm season. Thus, escalation is needed. Table 3 specifically shows that a bottleneck exists in back office at task TO1 during storm season.
Initial results in normal condition and in storm season.
Introducing escalations
The next step in the simulation method is to perturb the base process model in order to incorporate different escalation strategies. Below, we show how this is done for the escalation strategies previously introduced, using the running example as a basis.
S5: Escalation subprocess. To apply this strategy, we introduce an additional subprocess to speed up the insurance claim process. Only one escalation task, TS (Compensation-and-cancellation with client), is included in the subprocess. We define the execution cost and average time of TS as 25 and 120, respectively. During the execution of TS, a negotiation is carried out with the client to delay his/her claim request. Since the claim is going to be delayed, appropriate compensation is also offered to the client. We define the compensation cost of TS as 140. After executing TS, the case is considered end.
In addition, a new prediction task TP is added to determine whether the subprocess should be applied. We define the execution cost and average time of TP as 0 and 5, respectively. The prediction task TP and escalation task TS are inserted in the locations in the workflow where a case is initially assigned to a resource. In Figure 2, TP and TS are inserted at the beginning of back office. In this model, all tasks in a call center are handled by the same call center agent, and all tasks in the back office are handled by the same claim handler. The workflow after applying Escalation subprocess (S5) is shown in Figure 2.
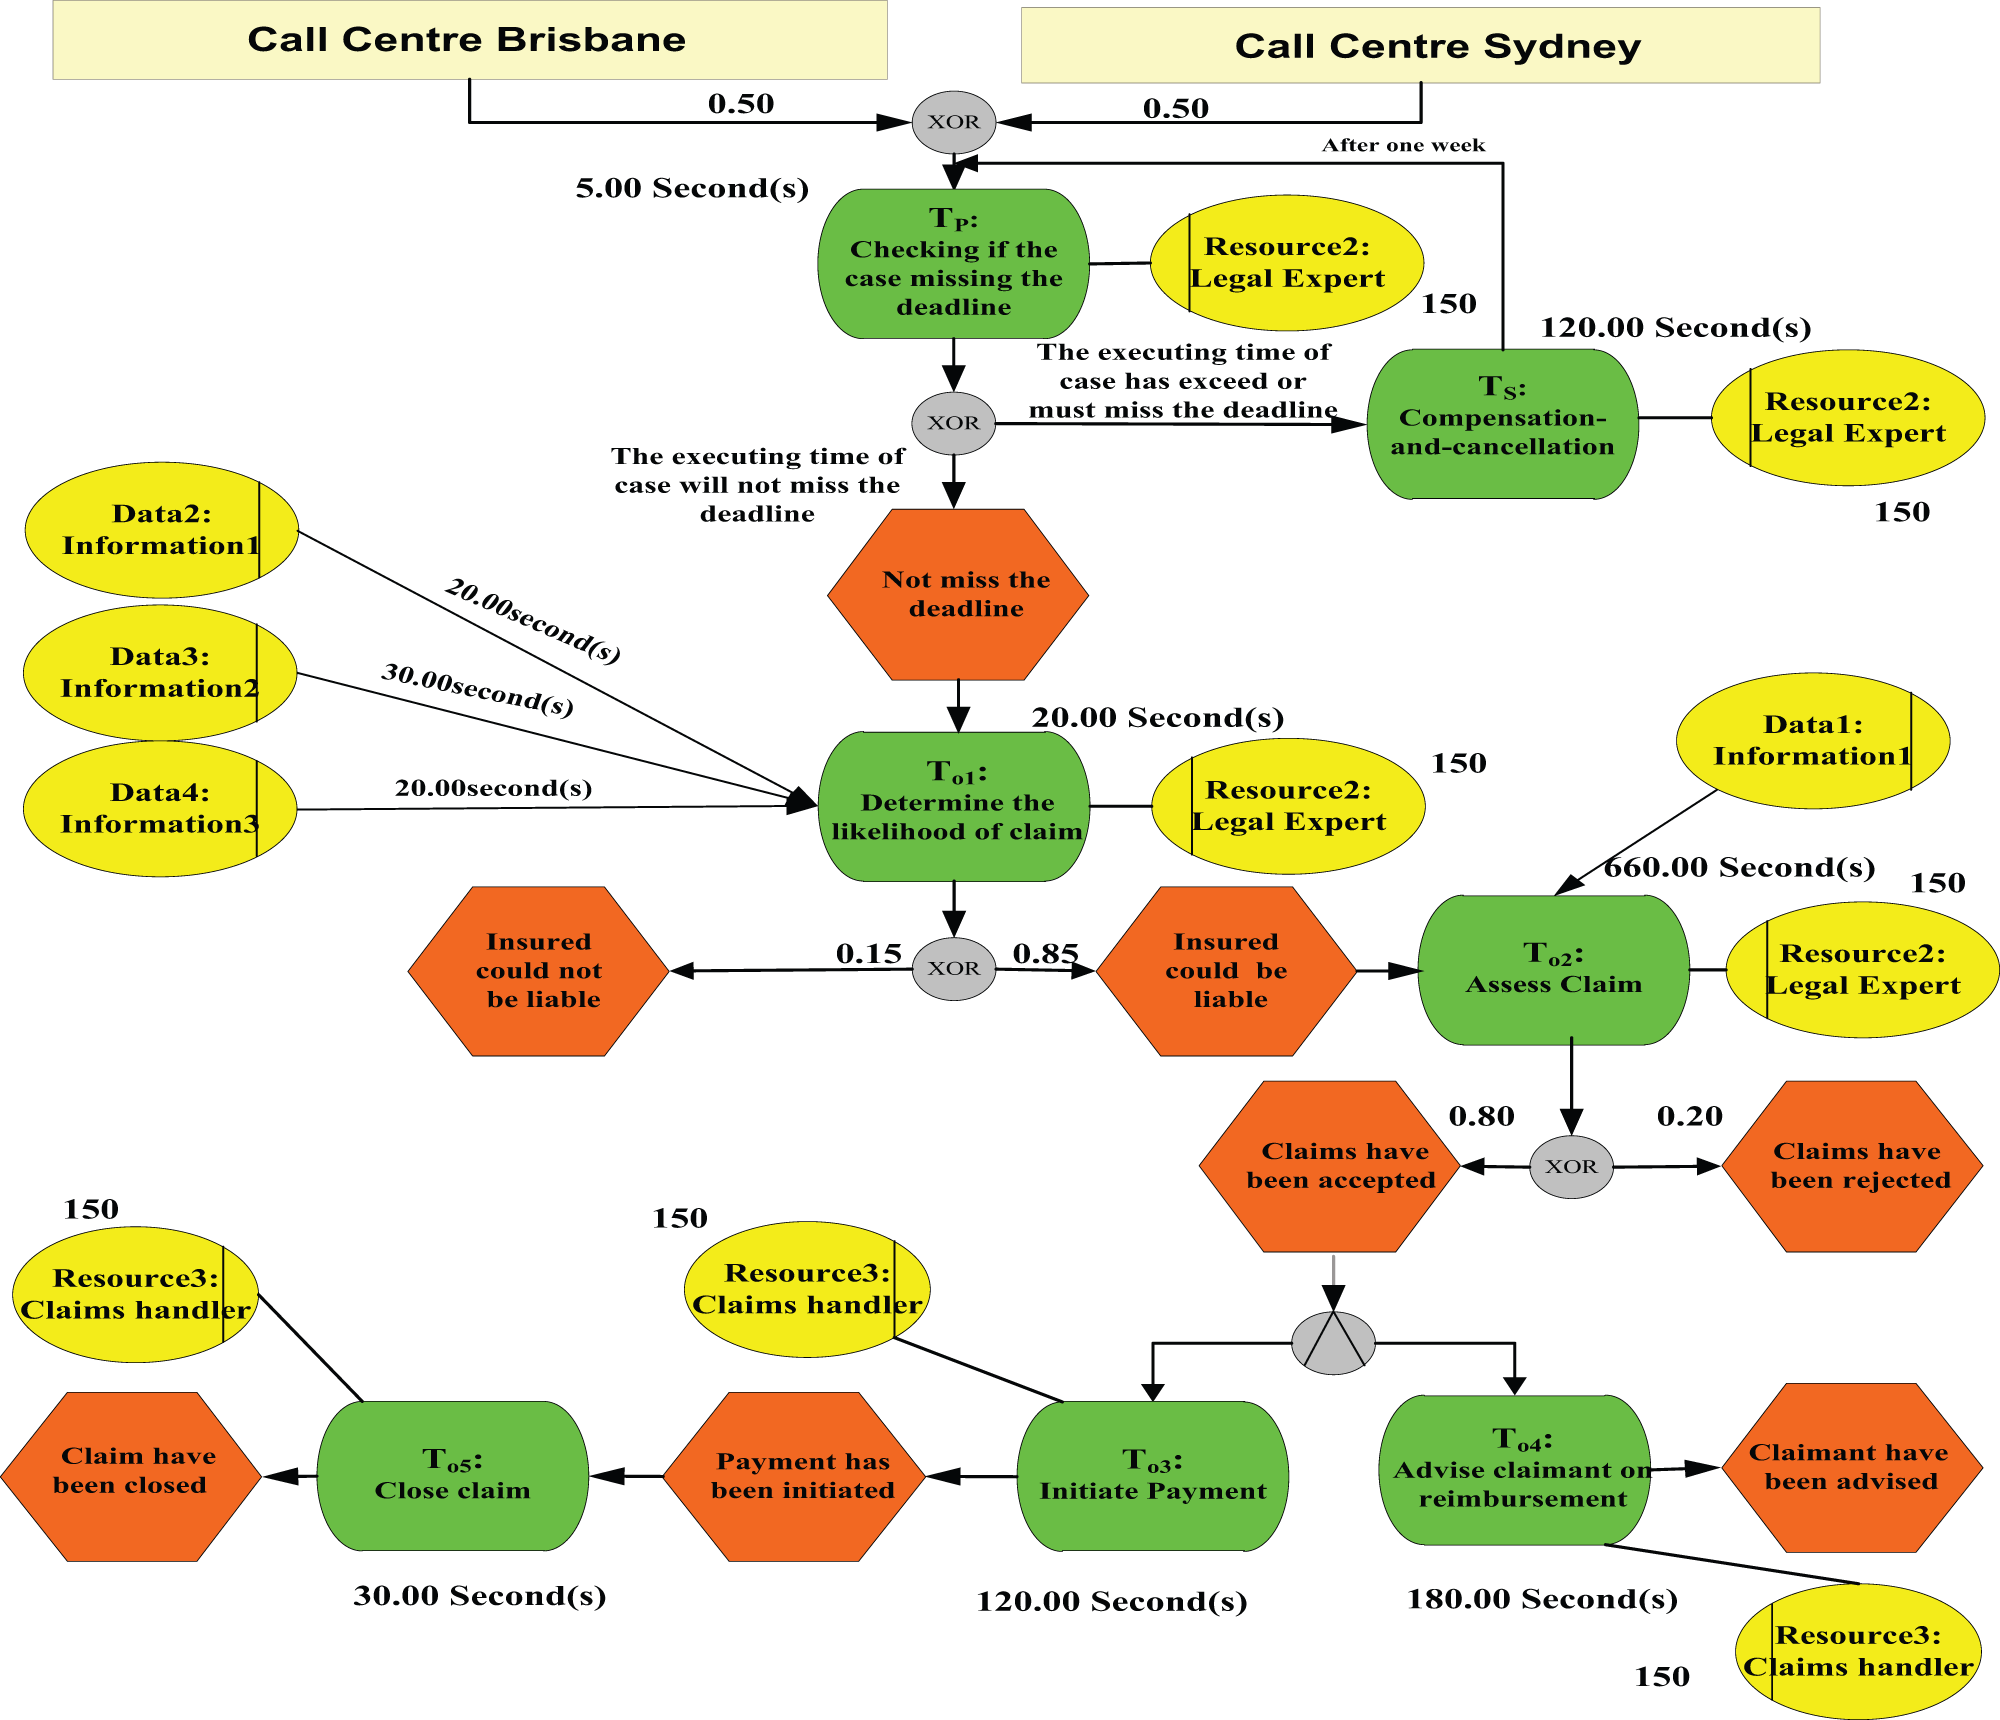
Running example after applying the Escalation subprocess (S5).
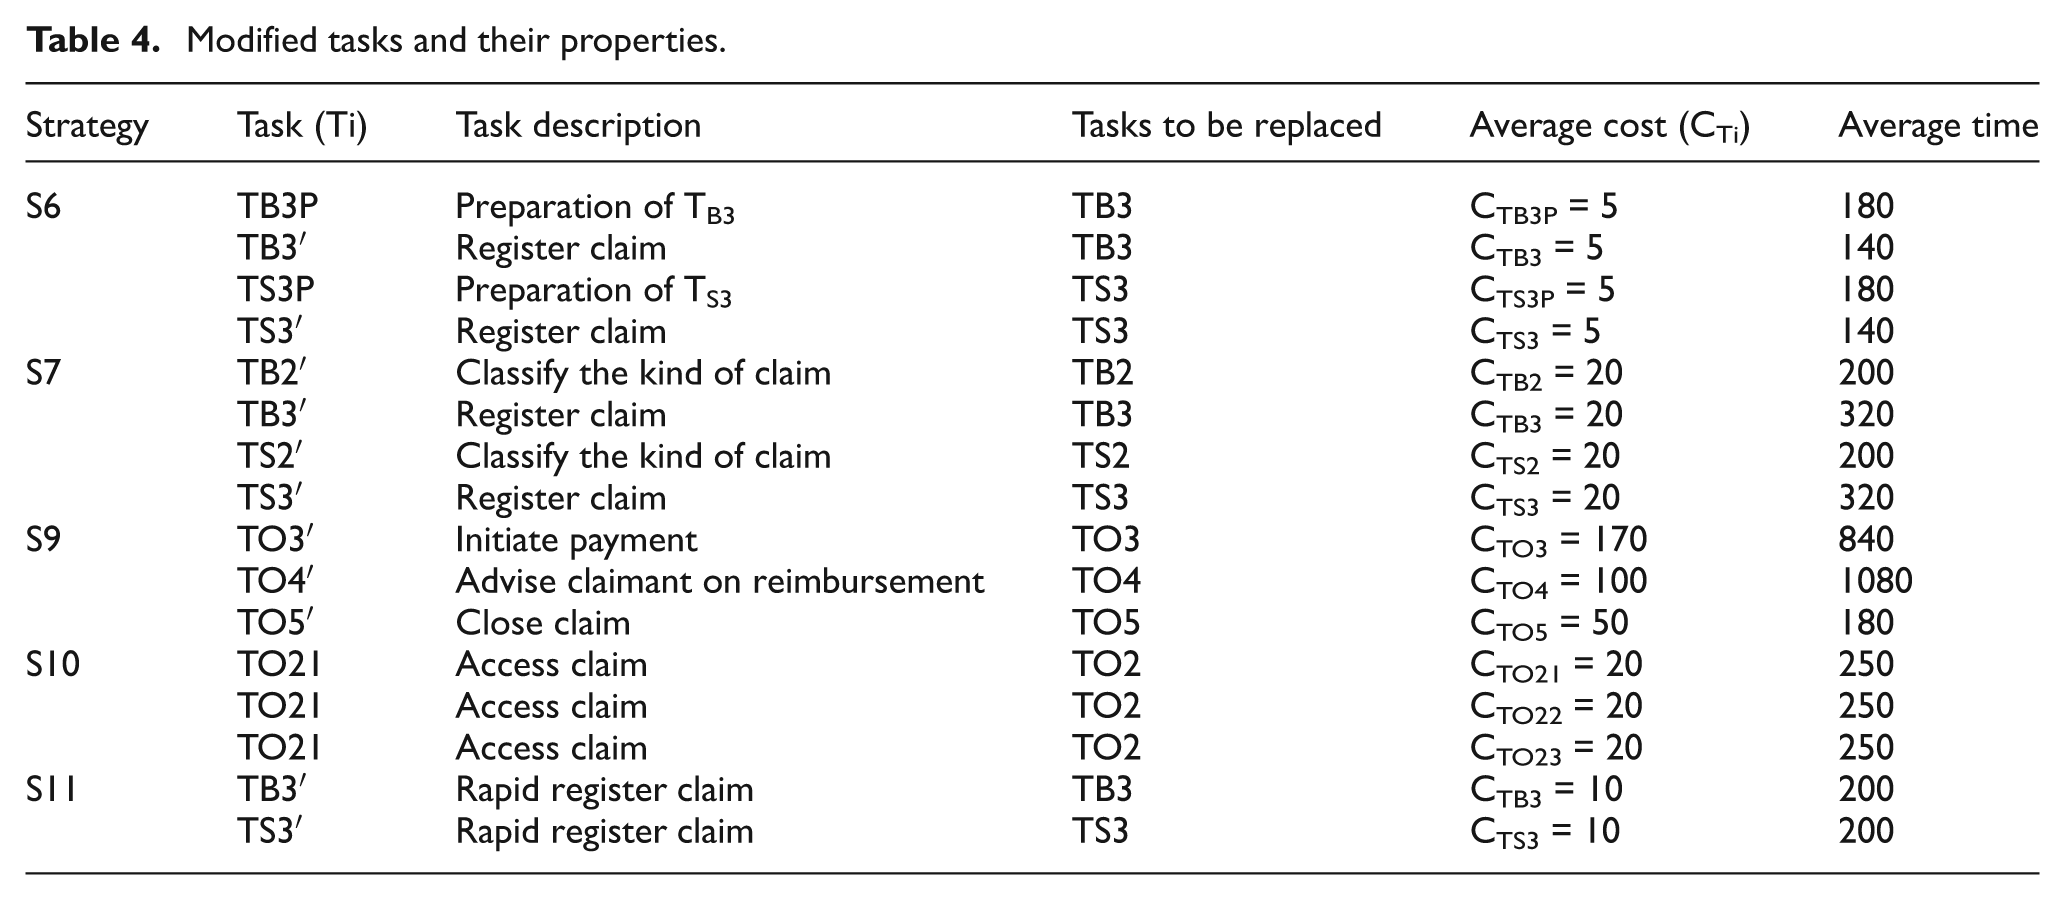
S6: Task pre-dispatching. To apply this strategy, task TB3 is replaced by TB3P and TB3′, and task TS3 is replaced with TS3P and TS3′. Tasks TB3P and TB2 and tasks TS3P and TS2 are executed simultaneously and handled by different resources. Therefore, this strategy increases the demand of resources and nearly no influence to the cost and reliability of these alternative tasks (see Table 4).
S7: Overlapping. To apply this strategy, we introduce four tasks TB2′, TS2′, TB3′, and TS3′ to replace TB2, TS2, TB3, and TS3, respectively (see Table 4). Tasks TB2′ and TB3′ are executed in parallel and are handled by different resources, and the same holds for tasks TS2′ and TS3′. This parallelism leads to higher execution cost when compared to the original tasks, due to additional coordination efforts.
S8: Prioritization. We insert an escalation task, namely TC, where priorities are assigned to tasks in the back office. The execution cost and average time of TC are 0 and 10, respectively. During the execution of TC, if the case is running late, the case is assigned a priority according to its compensation cost. Task TC is inserted as the first task in the back-end part of the workflow.
S9: Batching. We introduce an additional escalation task, namely, “Assign every 10 cases to be handled by one resource” (or TA for short) in order to batch the cases. We define the execution cost and average time of TA as 30 and 10, respectively. TC is designed to batch every 10 cases to one resource and therefore results the execution cost for batching cases. Three tasks TO3′, TO4′, and TO5′ are introduced to replace TO3, TO4, and TO5 (see Table 4). These new tasks handle every 10 cases by one resource.
S10: Splitting. Task TO2 is replaced by three tasks TO21, TO22, and TO23 (cf. Table 4) that are executed by three legal experts in parallel, thus leading to shorter average completion times for Task Assess claim compared to the original task. The setup and handover time of TO21, TO22, and TO23 are set to 30. The average completion time of tasks TO21, TO22, and TO23 is longer than the average completion time of task TO2 due to additional setup and handover time. The cost of tasks TO21, TO22, and TO23 is also higher than the cost of task TO2 in the original model due to setup and handover costs and cost of consolidating the outputs of the smaller tasks.
S11: Deferred data gathering. We introduce two new alternative tasks TB2′ and TS2′ to replace TB2 and TS2 (see Table 4). These new tasks are designed to quickly process their job by not gathering information item 1, thus resulting shorter average completion time compared to the original tasks. In addition, a task TOA (“Gathering information1”) is added in the back office in order to gather information item 1 when this information is needed (the probability that this information item is needed is 0.7). The execution cost and average time of TOA is 5 and 120, respectively. Task TOA is performed before task Assess Claim and only if information item 1 is required.
Modified tasks and their properties.
Experimental results
The final step in the proposed method is to analyze the simulation results in terms of KPIs. In the current experiment, we use average workflow time, workflow cost, compensation cost, and total cost to analyze the strategies. Workflow execution time and costs are two crucial dimensions of the insurance claim process, and thus, KPIs from these dimensions are chosen to measure the effect of escalation strategies. Depending on the user’s requirements, other KPIs could be used for analyzing the trade-off among escalation strategies, including service level (fraction of workflow cases which are completed on or before the deadline), efficiency (ratio of execution time and waiting time in workflow instances), utilized capacity of resources (e.g. utilization of resource “Call Center Agent” in our experiment), average processing time of a resource, and average delay (total number of late days/total number of workflow instances). For instance, a manager of a logistic company might be interested in using KPIs such as service level and efficiency to evaluate the escalation strategies in a delivery process.
Time
Figure 3 shows waiting time of workflow process in storm condition. The analysis on waiting time reveals the existence of a bottleneck at the back office during storm condition. Hence, applying escalation strategies at the back office is expected to be more effective than applying at the call centers. The average of the workflow time, which applies various escalation strategies, is depicted in Figure 4.
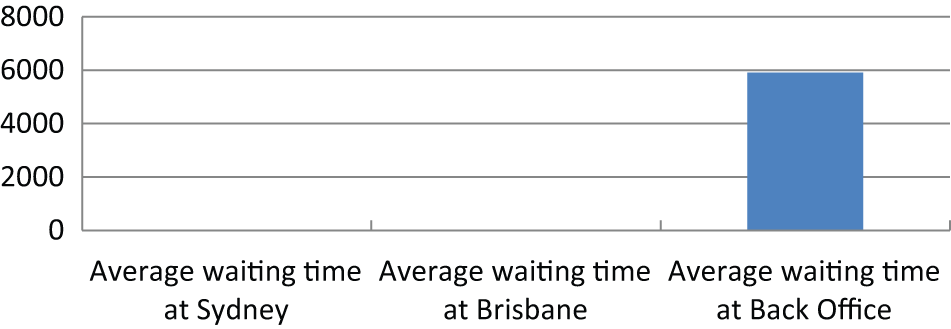
Average waiting time during storm condition.
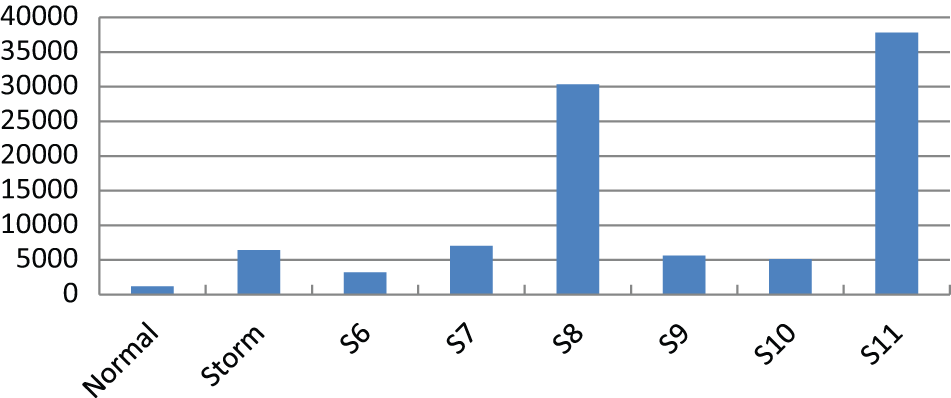
Average workflow time of the workflow.
Results indicate that task pre-dispatching (S6), overlapping (S7), prioritization (S8), splitting (S10), and deferred data gathering (S11) do not reduce average workflow time. There are several potential reasons for this phenomenon.
First, the positions in the experimental model where these strategies were applied are not bottlenecks. As for the deferred data gathering (S11), the average workflow time at the call centers has been decreased by these strategies; however, the number of tasks at the back office has been increased and the pressure and workload of the bottlenecks at the back office are not been addressed. Therefore, deferred data gathering (S11) does not reduce but increases the average time for the workflow system.
The aim of the prioritization (S8) strategy is not to reduce the average workflow time but to reduce compensation cost.
Task pre-dispatching (S6), overlapping (S7), and splitting (S10) decrease workflow time for cases that are running late, but at the same time, they increase the demand for resources. As resources are already highly utilized during storm conditions, this additional resource demand cannot be handled and leads to higher waiting times, which in turn lead to an increase in average workflow time.
In Figure 4, escalation subprocess (S5) is the best strategy in reducing the average workflow time followed by batching (S9). Batching (S9) decreases the setup time and handover time, leading to a reduction in average workflow time. In the case of escalation subprocess (S5), the subprocess is executed when a case is about to miss the deadline. The fact that the execution time of such subprocess is shorter than that of the original task leads to shorter execution times for those cases for which the escalation is applied. At the same time, these shorter execution times lead to lower resource utilization, which has a positive effect on the remaining cases.
Workflow cost
We differentiate between workflow cost, resource cost, and compensation cost. Workflow cost is the total execution cost of all cases during a 1-week period. The execution cost of a case is the sum of the execution cost of tasks involved in that particular case (see Table 3). Figure 5 shows the average workflow cost per week in various conditions. It also shows that the workflow cost in normal condition is significantly lower. As expected, high workflow cost is recorded under storm conditions due to larger numbers of insurance claims. The results also show that overlapping (S7) and splitting (S10) increase the workflow cost. Overlapping (S7) increases the workflow cost due to additional coordination effort. Splitting (S10) increases the workflow cost due to additional setup costs, handover costs, and costs of consolidating the outputs of the smaller tasks. The remaining escalation strategies have no influence on workflow cost since they do not modify the control flow.
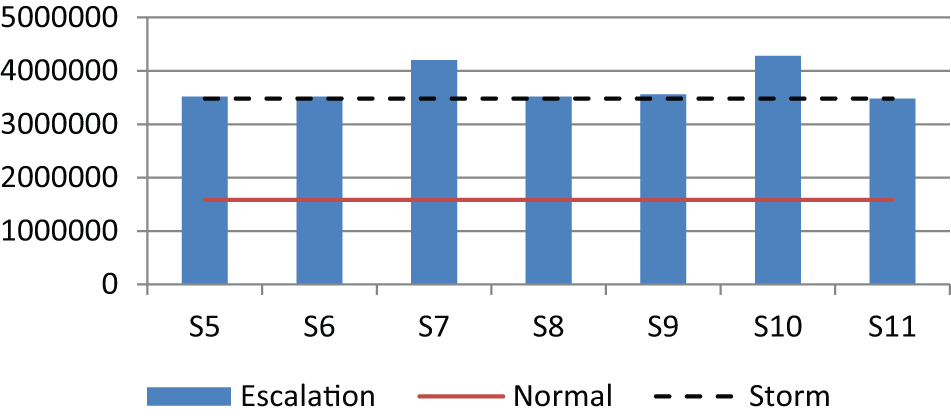
Comparison on average workflow cost.
Resource cost
All escalation strategies have the same resource cost since these strategies do not bring in additional resources nor do they remove resources. The strategies affect the utilization of resources, but do not alter the set of resources working on the workflow.
Compensation cost
Compensation cost is incurred when workflow cases miss their deadlines. We assume that compensation cost is normally determined when the case starts, but can be renegotiated (cf. Early Escalation strategy). Figure 6 shows the average compensation cost (per week) of the experiment model in various conditions. Comparison between Figures 4 and 6 reveals that the escalation strategies with shorter average workflow time also have lower compensation cost, except in the case of Prioritization (S8). Prioritization (S8) does not shorten workflow time overall. It shortens the workflow time of the cases that are missing their deadline, but in doing so, it takes away resources from other cases, thus pushing the average execution time of these other cases. In doing so, Prioritization (S8) reduces the compensation cost since fewer cases miss their deadline. In other words, prioritization tends to push cases to the level where they use all the time they are allowed to use, but without missing their deadline. Of course, in an environment of high resource utilization, some cases still miss their deadline despite prioritization and thus some compensation cost is still present.
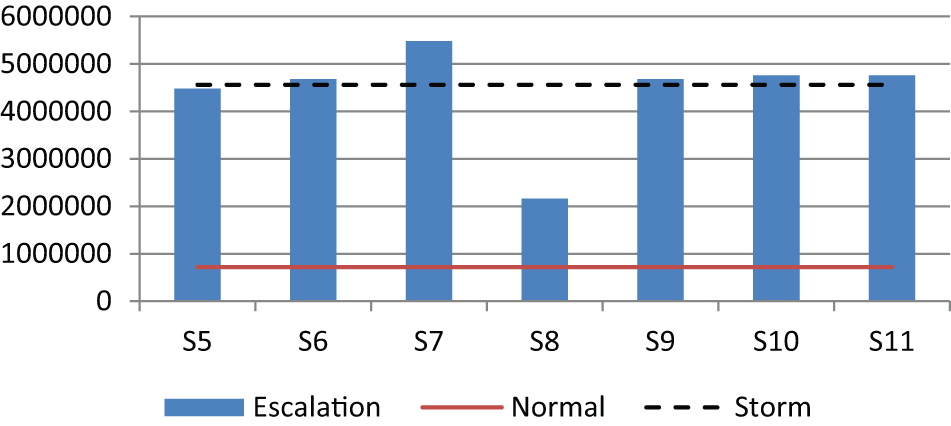
Compensation cost of workflow process in various conditions.
Total cost
The total cost is the sum of workflow cost, resource cost, and compensation cost. Total workflow costs for different scenarios are shown in Figure 7. This figure shows that the total cost of applying overlapping (S7) and splitting (S10) exceeds the total cost of the experimental model in storm condition (with no escalation). The reason is that both strategies are unable to decrease the workflow time. Specifically, they are less effective in reducing the number of cases missing their deadlines, and as a result, a large number of clients have to be compensated. Prioritization (S8) has the lowest total cost among all strategies since it has the lowest compensation cost.
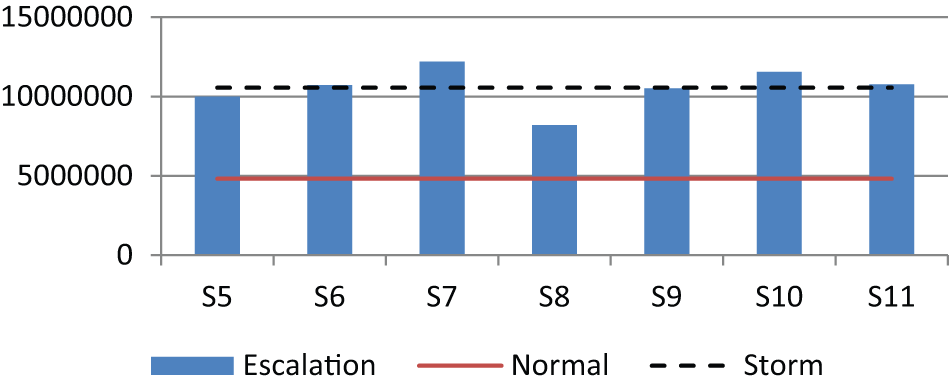
Total cost of workflow process in various conditions.
Conclusion
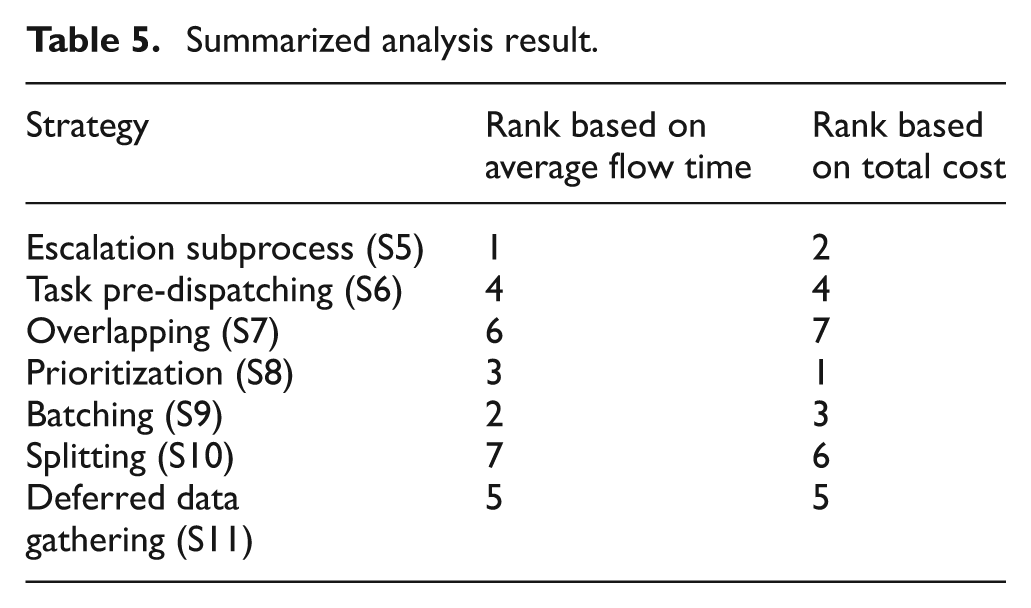
We presented a simulation method to evaluate escalation strategies, and we applied it to a case study. The case study allowed us to assess the relative impact of the escalation strategies on two KPIs: average workflow time and average cost. The relative performance of the escalation strategies on the case study is outlined in Table 5.
Summarized analysis result.
The results put into evidence the following trade-offs:
If the level of resource utilization is high for sustained periods of time, escalation strategies that introduce additional resource demand for the purpose of speeding up late cases end up having an adverse effect on average workflow time overall. This is the case of strategies task pre-dispatching (S6), overlapping (S7), and splitting (S10). We can thus hypothesize that these strategies should be deployed only when there is a slack in resource utilization; however, an additional study with different levels of resource utilization is needed to validate this hypothesis. Also, we observe that deferred data gathering (S11) reduces the workflow time in the front-end, but adds workload to the back-end, and thus increases waiting time in the back-end. Thus, we hypothesize that deferred data gathering (S11) is more effective when used in conjunction with a Resource Redeployment strategy (i.e. increase the number of resources at the back-end).
Prioritization (S8) does not reduce average workflow time when applied in isolation since this strategy speeds up cases that are running late at the expense of other cases. The strategy aims at decreasing compensation cost, not average workflow time. Accordingly, we hypothesize that this strategy is more effective when combined with a strategy that decreases average workflow time.
The choice of locations where escalation strategies are applied is an important factor. The analysis confirms that when escalation strategies are applied to tasks that are not in a bottleneck, they are less effective in terms of workflow time. For instance, Task pre-dispatching (S6), which is applied on the call centers, has less effectiveness in decreasing workflow time.
Prioritization (S8) has the most visible effects on cost, mainly because of its positive impact on compensation cost. Escalation subprocess also has a positive effect on compensation cost.
The above observations are to some extent specific to the insurance case study presented in this article and the simulation parameters chosen for the tasks inserted when applying each escalation strategy. While these observations do not necessarily generalize to other case studies or when using different parameters, they highlight trade-offs when selecting and applying escalation strategies. In addition, the evaluation results suggest that applying certain strategies in isolation may not address the escalation problems associated with a given workflow. Instead, analysts should consider combining escalation strategies, taking into account their budget, execution time constraints, and desired service quality standard.
In summary, this article described a method for designing simulation experiments in order to evaluate the impact of various escalation strategies on a given workflow when the workflow is subjected to demand spikes (i.e. a higher-than-usual inter-arrival rate). Through a case study, we illustrated trade-offs involved when selecting escalation strategies, and we provided guidelines to deal with these trade-offs. The method can be applied to evaluate the performance of the presented escalation strategies on a given workflow subjected to different scenarios such as different arrival rates, different numbers of available resources, or different effects of applying a given escalation strategy on execution times and other KPIs. We foresee that the method can be extended to handle other escalation strategies besides those considered in this article, although a validation of this claim is beyond the scope of this article.
Footnotes
Declaration of conflicting interests
The authors declare that there is no conflict of interest.
Funding
This research is funded by the University of Macau under grant RG056/06-07S/SYW/FST, MYRG041(Y1-L1)-FST13-SYW, and by ERDF via the Estonian Centre of Excellence in Computer Science.