
Abstract
The problem this work aims to solve is the improvement of the leanness level of a company jeopardized by the lack of lean engagement. The objectives of the research are to present a method based on a lean self-assessment approach, consisted of a qualitative self-assessment method based on lean elements that drives an index definition associated with a roadmap. The method consists in providing a roadmap for the assessed enterprise composed by the company’s lean index, recommendations and countermeasures deriving from Delphi and Kendall Coefficient of Concordance (W) application among lean experts, leading the assessed enterprise to achieve results in terms of lean engagement, autonomy, and decision support criteria for future resource allocation. The results demonstrated that method can highlight gaps where additional improvements and investments would be necessary in the assessed enterprise. Finally, the study concludes that the lean performance identification associated to a lean roadmap in a company can be a highly effective tool to improve lean adoption in a leanness organization.
Keywords
Introduction
Ever since lean manufacturing first appeared in the literature, authors have tried to describe it theoretically (Hines et al., 2006, 2004; Lewis, 2000; Possamai and Ceryno, 2008; Shah and Ward, 2007). However, their descriptions have been ambiguous and unclear (Boaden, 1997). Authors have declared at least 25 lean manufacturing tools. In common to all of them are waste elimination and the focus on available resource optimization, to which engineering techniques (Karam et al., 2018) and statistics fundamentals (Kiran, 2017) are applied. In the definition adopted by this study, lean practices are a set of methods, procedures, techniques, and tools aimed to continuously create customer value and reduce product lead time (Shah and Ward, 2007). According to Morgan and Liker, a lean company (LC) aims for lean practices along the whole lean development process (LDP), not only the manufacturing shop phases (Morgan and Liker, 2006; Pessôa and Seering, 2014). The non-engagement of lean aspects along the development phases is the definition of a leanness company (Bauch, 2004). In an ideal product development process (PDP), the process itself should work as a single-piece manufacturing flow. That way, it is possible to reduce errors in investigation loops interactions (Bonnal et al., 2006).
A lean management research and deployment trajectory is a singular process in each organization (Lewis, 2000). Researchers have already demonstrated that implementing lean practices can help large manufacturing enterprises to increase their operational performance (Krafcik, 1988; Ōno, 1988; Womack et al., 1991). Other researchers have also addressed the lean roadmap issue by focusing on the core critical success factors for lean performance examination in the PDP (Aikhuele and Turan, 2018; Leite et al., 2016) and explored the roadmap, metrics and management for concurrent engineering (CE) in the product development environment (Prasad, 1997a, 1997d; Prasad et al., 1998). Therefore, the objective of this research is to combine the lean assessment to a roadmap, based on a lean index (LI) self-assessment method focused on identifying the main positive and negative factors for a leanness enterprise. The self-assessment method was selected for this study in order to insure the engagement in decision-making processes for the lean way, where some examples and case applications are available from recent literature (Dwarakanath and Wallace, 1995; Hauser et al., 2006; McNally and Schmidt, 2011). On the LDP, McCarthy et al. (2006) have identified three levels of decision-making: strategic, review, and in-stage. The in-stage is where agents deal with multiple decisions involving producing and processing a rich diversity of criteria that are the basis of PDP creative activities and ideas. This is the stage on which this study intends to focus.
The first step when creating a great product is to understand what exactly makes a product great (Prasad, 1996b). In other words, the goal of PDP is to create such manufacturable physical product through a set of connected life-cycle processes (Prasad, 2016a). Also in PDP, decision-making grows out of a process over time (Christiaans and Almendra, 2010), and the engagement in decision-making process is closely related to on-going assessments and roadmaps. Specifically in LDP, the more extensive presence of top management support is critical for continued company-wide implementation of lean practices and decision-making. To develop a coherent management philosophy seems a daunting task, given the wide range of possibilities and practices that must be addressed (Prasad, 1997b). Thus, the concept of decision making focusing on the system level is adopted by this method and supports the engagement in decision-making processes, specifically in PDP.
Background
Today manufacturing sectors are much more fiercely competitive and global than before (Prasad, 2001a). Thus, to design and execute an enterprise transformation, it is crucial to have assessments that measure multiple performance dimensions during the process’s execution in order to understand its current state and chart out the transformation plan that will lead the company into a different future state (Kueng, 2000). Such assessments can help in identifying performance gaps, prioritize focus and play a role in helping to generate a future state vision for the enterprise. As the transformation plan is implemented, ongoing assessments can also offer feedbacks and measure progress. This feedbacks can be used to revise the transformation plan and patch over time.
The management organizational capability for an enterprise operation (internal or external) is becoming very crucial for achieving not only time-to-market, but also improved productivity, and better efficiency (Prasad, 1996a). Various methods and tools for an enterprise’s operational performance are comprised under lean strategy’s umbrella (Bhasin, 2012). The earliest model found in the literature was presented by Karlsson and Åhlström (1996), who developed a model capable of determining the progress of a lean manufacturing firm in the effort to adopt lean fundamentals from the book “The Machine that Changed the World,” by Womack et al. (1991). According to Schalock et al. (2014) one of the major strengths of an evidence-based assessment instrument is that it is an organizational assessment tool that represents a new approach to organizational evaluation based on self-assessment.
In recent years, product development (PD) has been an essential element of competitive engineering (Duhovnik et al., 2001). Since PD is a nonlinear (Kline, 1985; Nightingale, 2000) and dynamic system process (Huang and Gu, 2006), it is hard to determine what value is added—especially in LDP, where design changes constantly happen in the first phases of a PD. In the PDP context, this also involves design, production planning, and manufacturing (Amitrano et al., 2015), typically leading to lots of change and rework (Mihm et al., 2002), while seeking for a high leanness level and there are more opportunities for competitive advantages in PDP than in any other department or area of industrial companies (Mendes and de Toledo, 2015; Morgan, 2002; Toledo et al., 2008). A leanness level is defined by Vinodh and Chintha (2011) as a performance measure of lean operation. Comm and Mathaisel (2005) described leanness as a relative measure of whether a company is lean or not. The number of studies in the literature on leanness assessment is low compared to those on lean implementation areas (Narayanamurthy and Gurumurthy, 2016). This study’s contributions compared to previous and very recent papers are described in Table 1 in a chronological sequence. From the assessed studies, over 90 papers, articles, journals, and full thesis from the last 23 years were screened and refined in order to compose a systematic literature review.
Present contribution compared to previous and very recent papers.
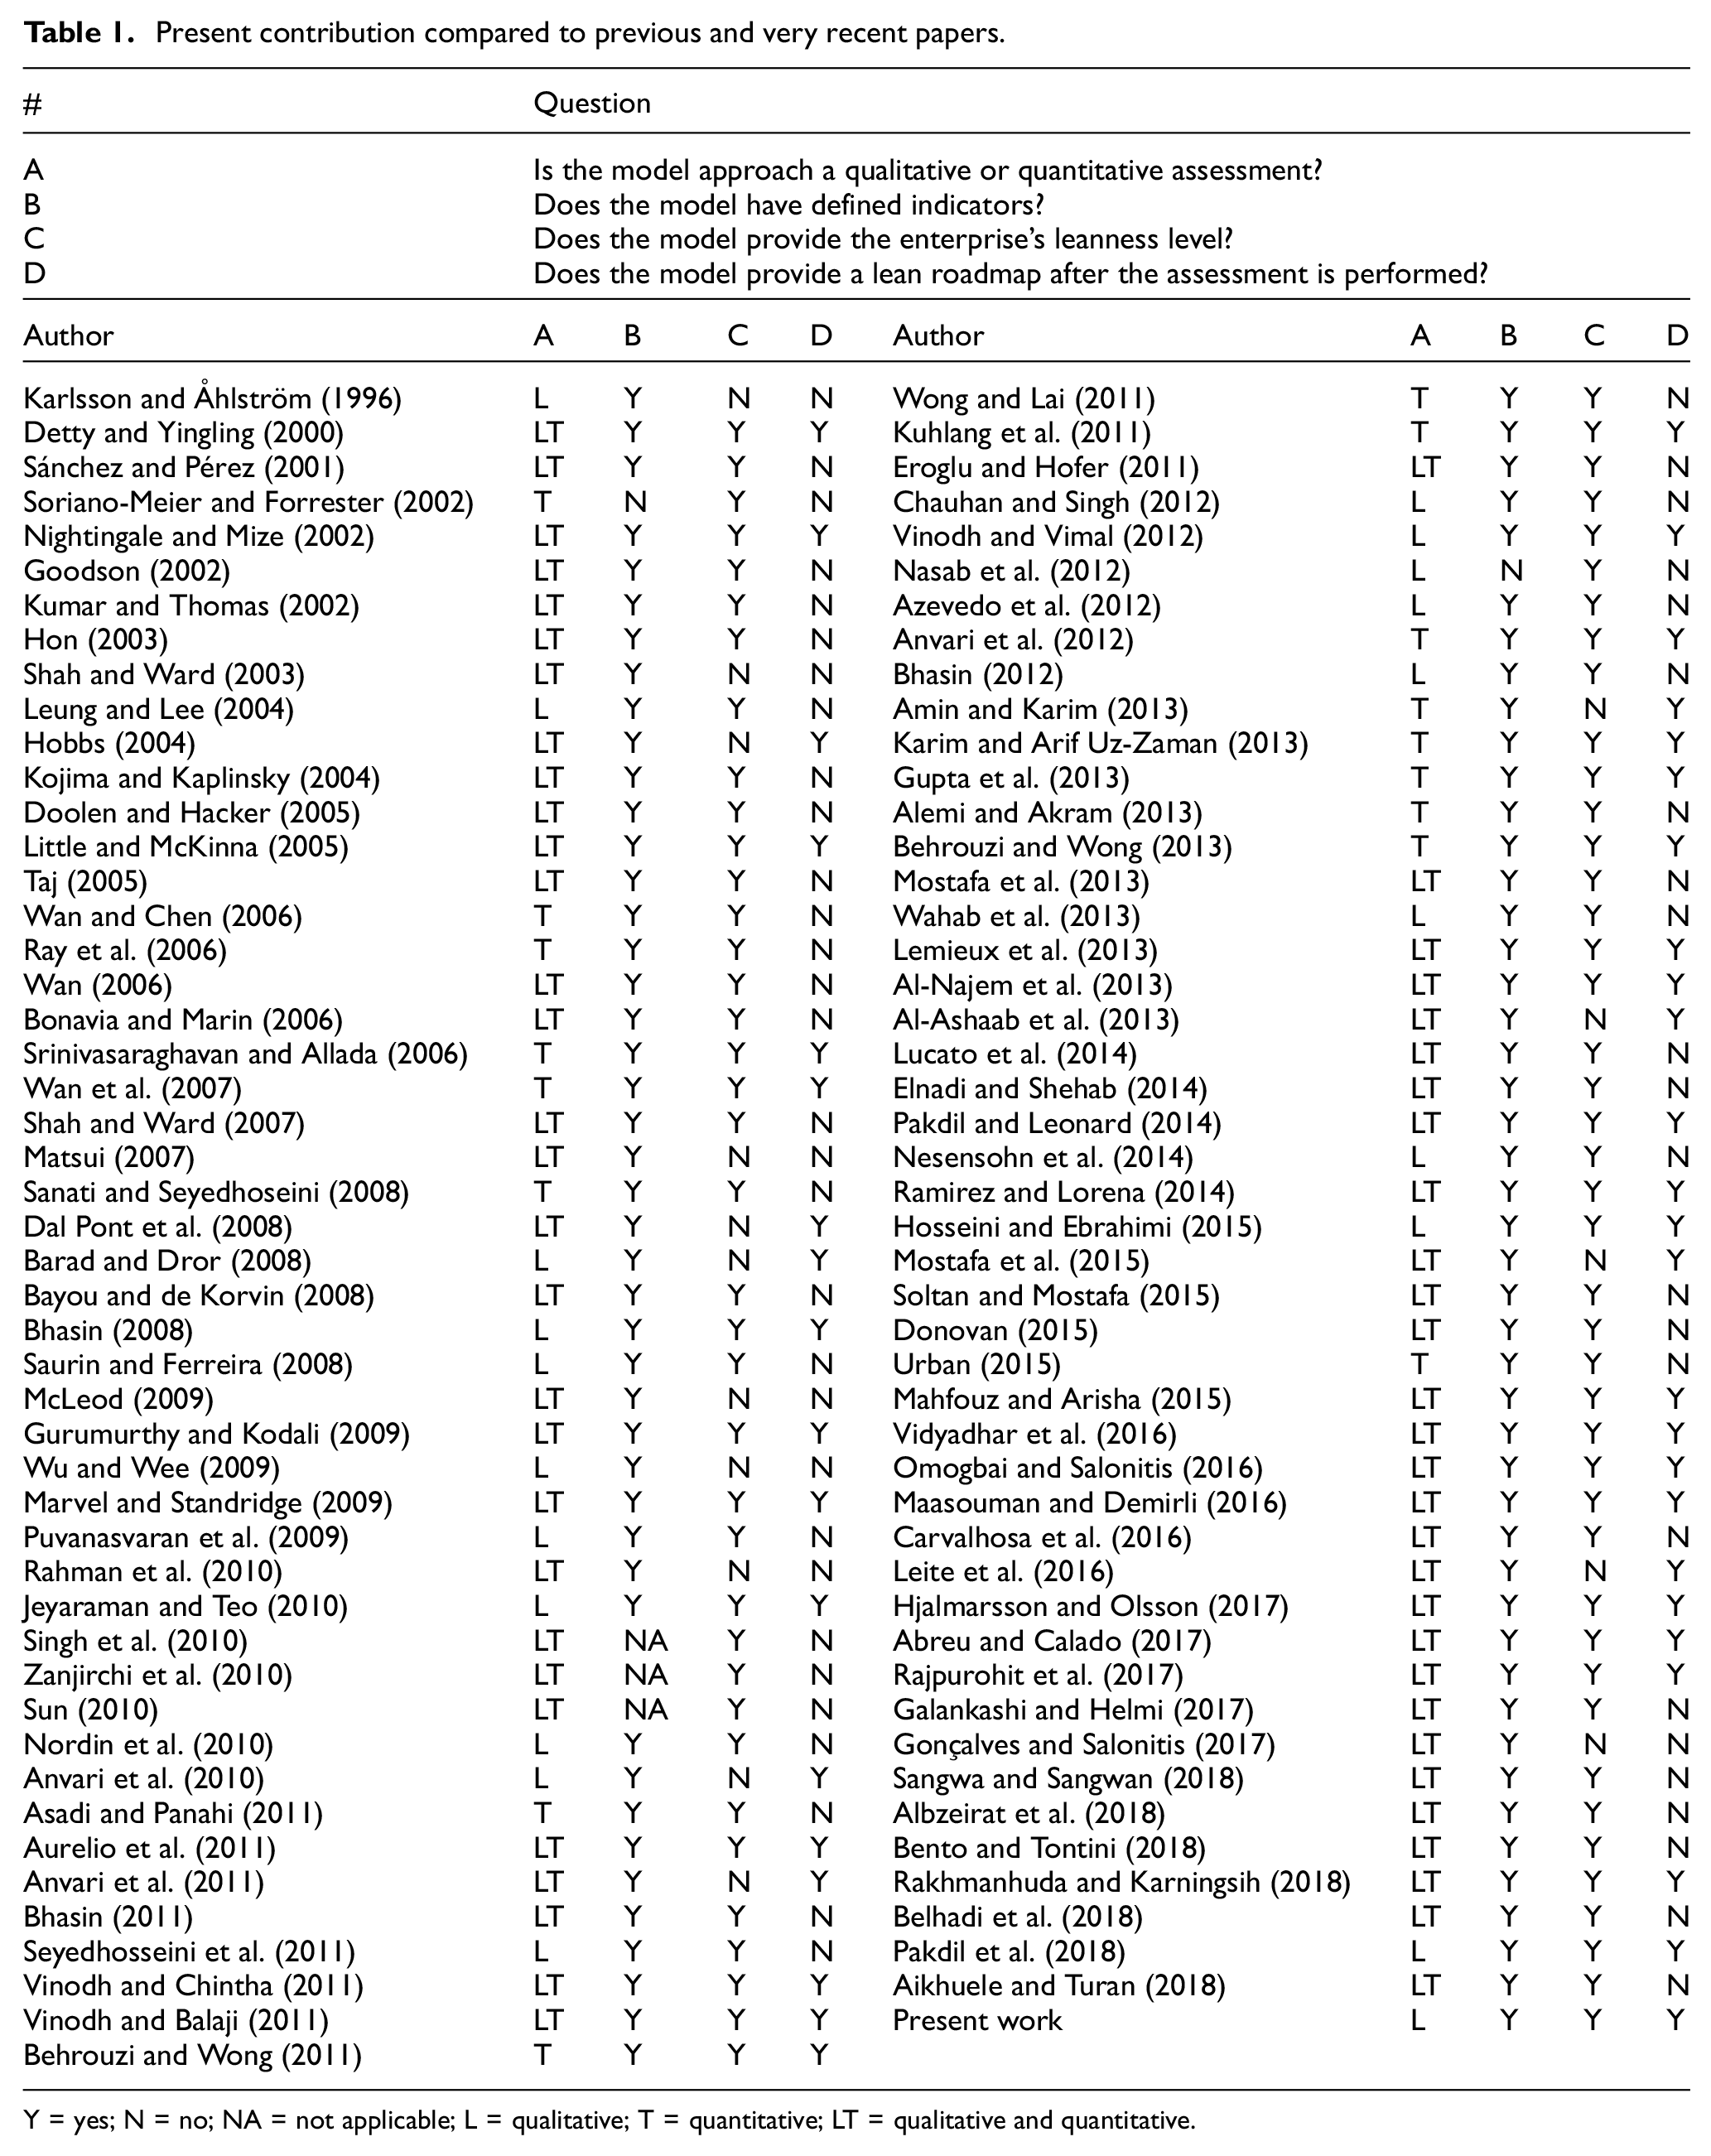
Y = yes; N = no; NA = not applicable; L = qualitative; T = quantitative; LT = qualitative and quantitative.
Although the first leanness research was published in 1996 by Karlsson and Åhlström (1996), the next leanness study appeared in the literature only 4 years later in 2000, and was by Detty and Yingling (2000). As per Table 1, there is a majority of proposed frameworks addressing a leanness indicator thought the usage of a qualitative/quantitative assessment. However, there is also a lack of a self-assessment method for the leanness level definition, associated with a roadmap to provide insights for the decision makers. This is one of the gaps this research aims to fit.
Methodology: a roadmap for a leanness company to emerge as a true lean organization
The method presented by this study is divided into two topics: the LI equations and the lean roadmap definition. The LI is the rate responsible for indicating the current leanness level of the enterprise and based on its adequacy to the ranges established by the method, a specific set of recommendations are deployed according to the criteria detailed in the following subsections.
Lean index
The performance of an organization is largely governed by the system in which it is contained. Thus, a LI overall is an important rate for any company emerging as a lean organization (Prasad, 2001b). The lean elements considered in this study are the ones adopted by the lean wheel system (LWS) model. The LWS intends to be a pictorial model that shows the elements that support lean product development and their relationship as illustrated in Figure 1.
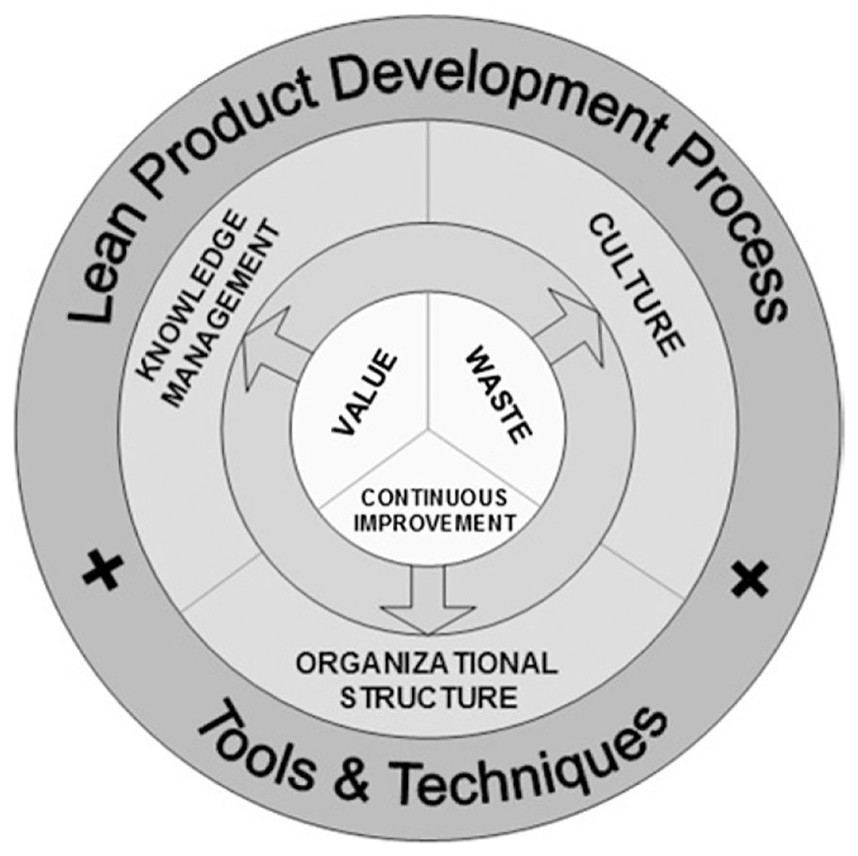
Lean wheel system elements (Pessôa and Trabasso, 2017).
In the LWS metaphor, the lean elements are rooted as the hub elements interfacing one with each other (Pessôa and Trabasso, 2017). The LWS elements considered in this method are defined in Table 2 and the “core lean elements” composed by: value, waste, and continuous improvement had their definitions criteria adopted from the literature.
Lean wheel system elements definition (Pessôa and Trabasso, 2017).
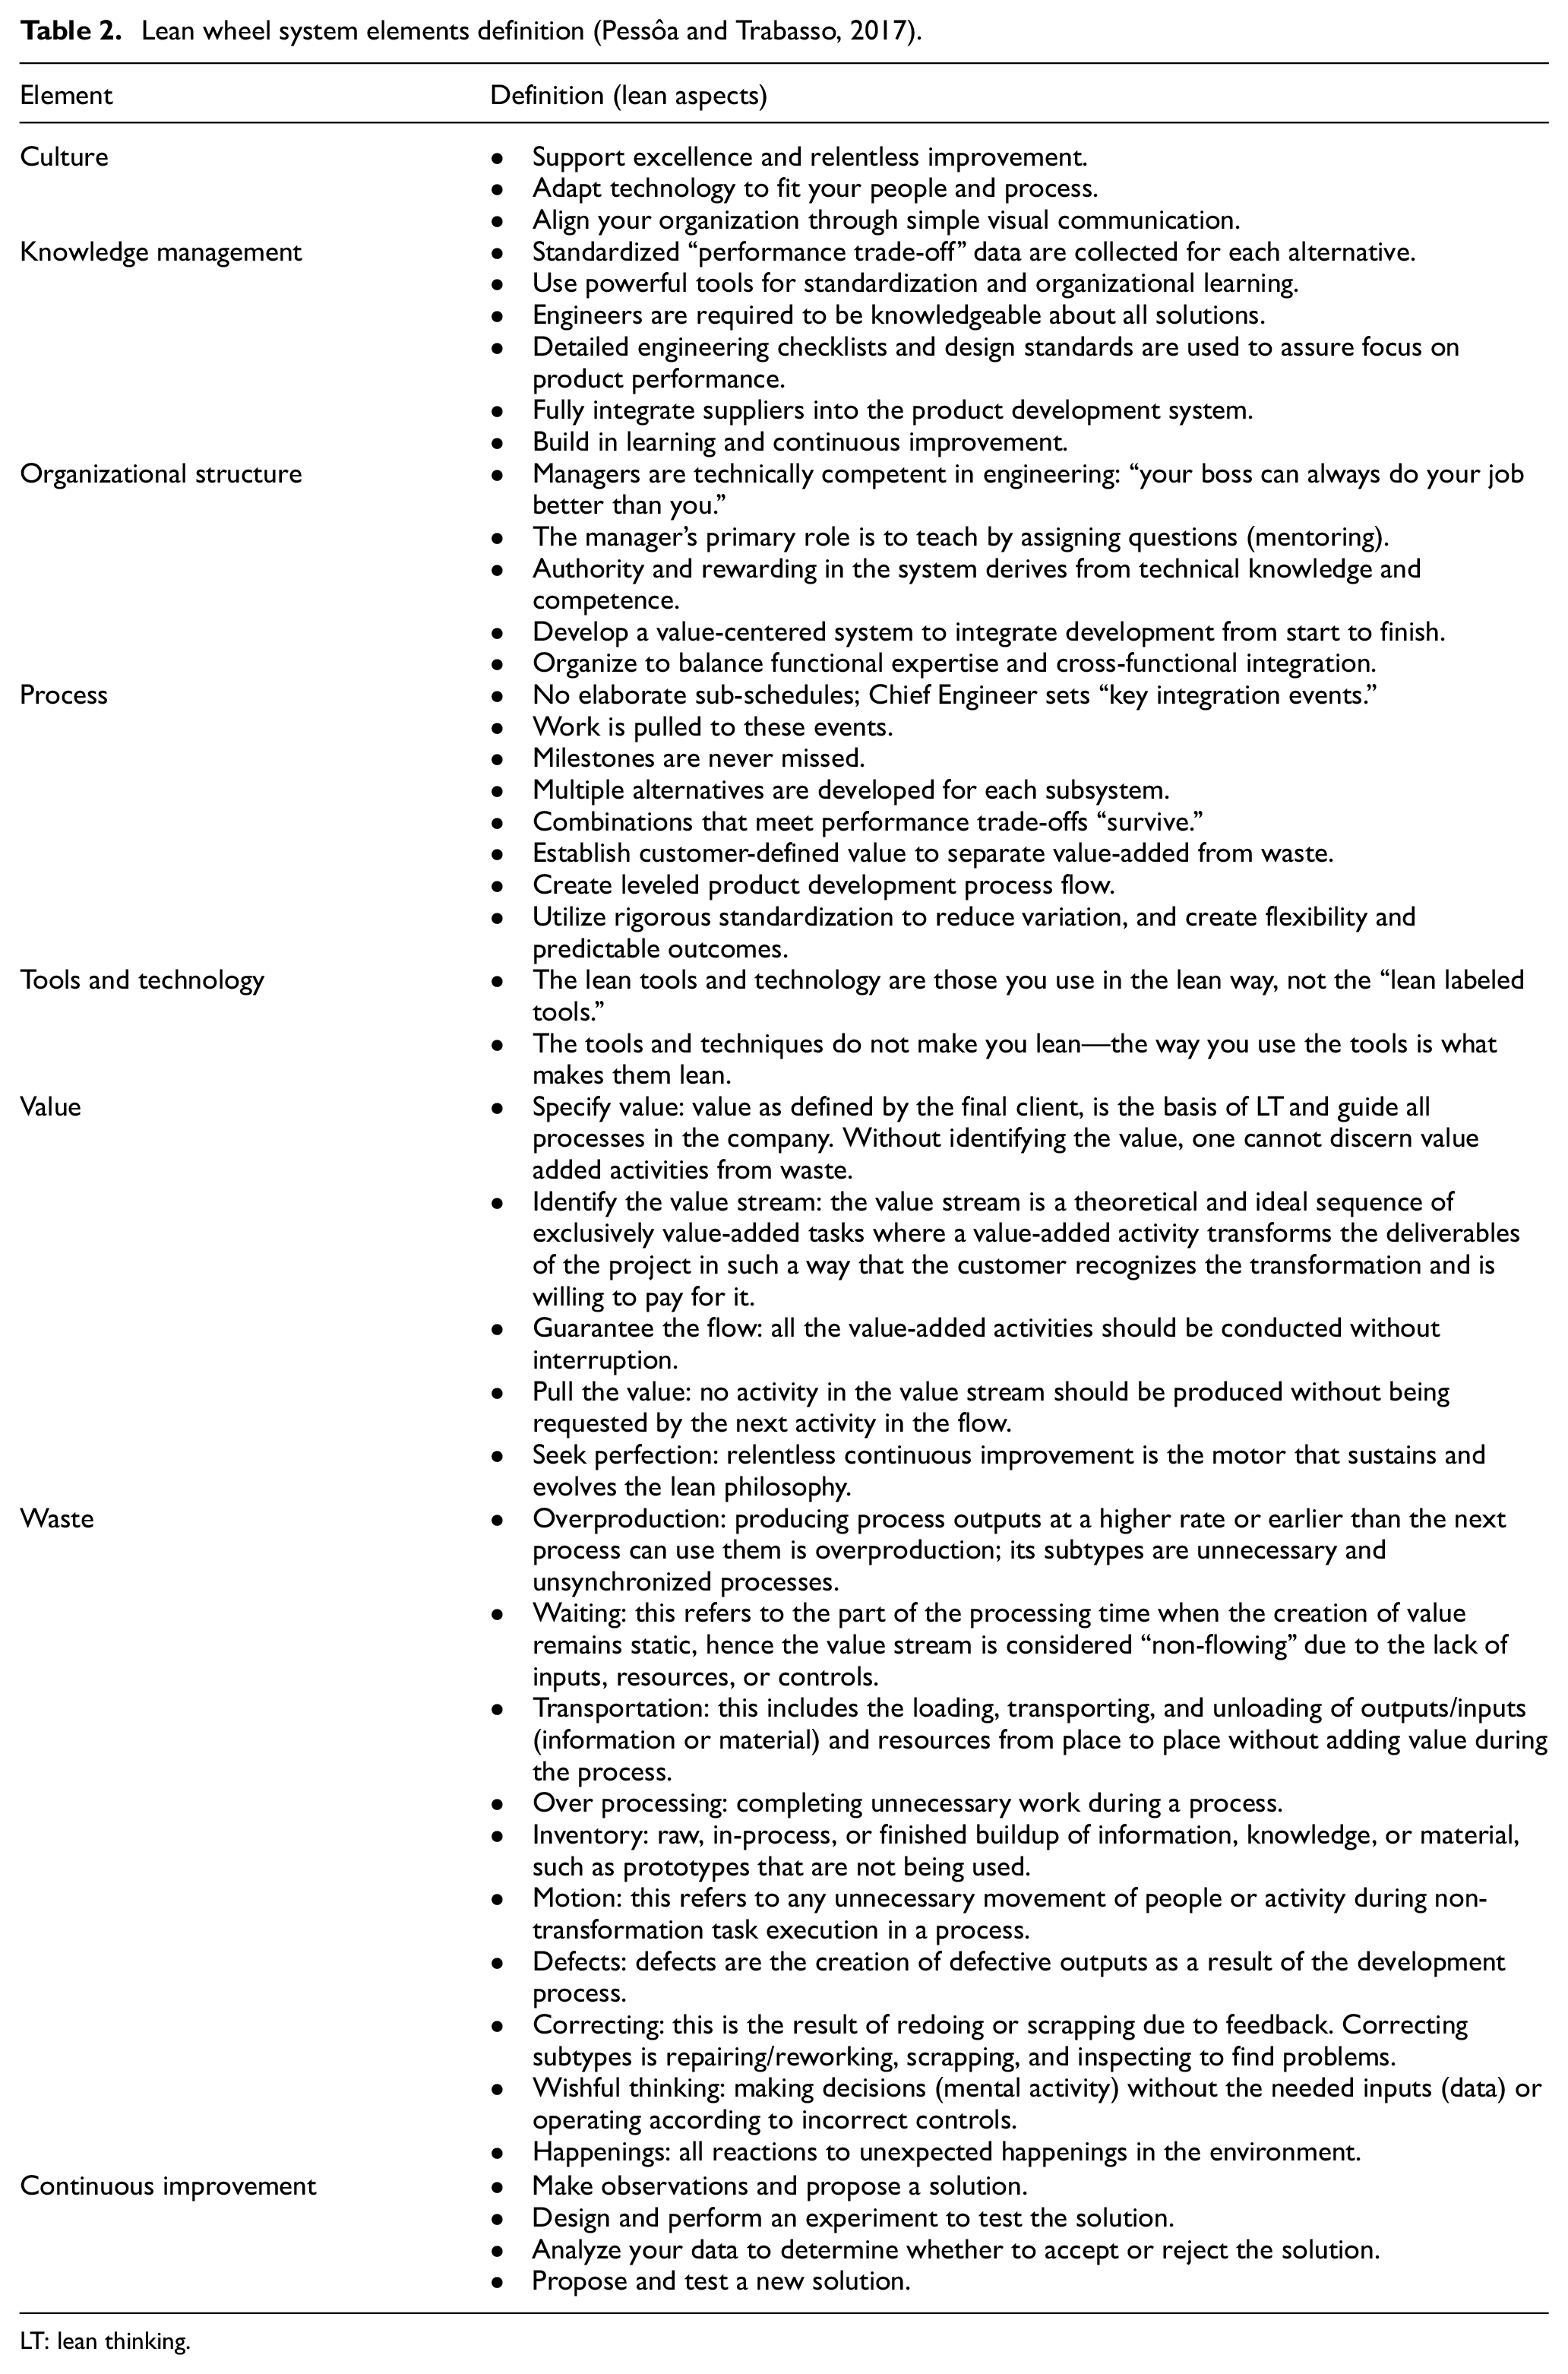
LT: lean thinking.
The LI has five possible progressive maturity levels in its composition. The levels range from least capable (Level 0) to a true lean organization (Level 5). Table 3 defines the meaning of each level. These levels are intended to depict a progression in the lean capability of the enterprise, relatively to the particular lean aspect being assessed.
Progressive maturity LI levels.
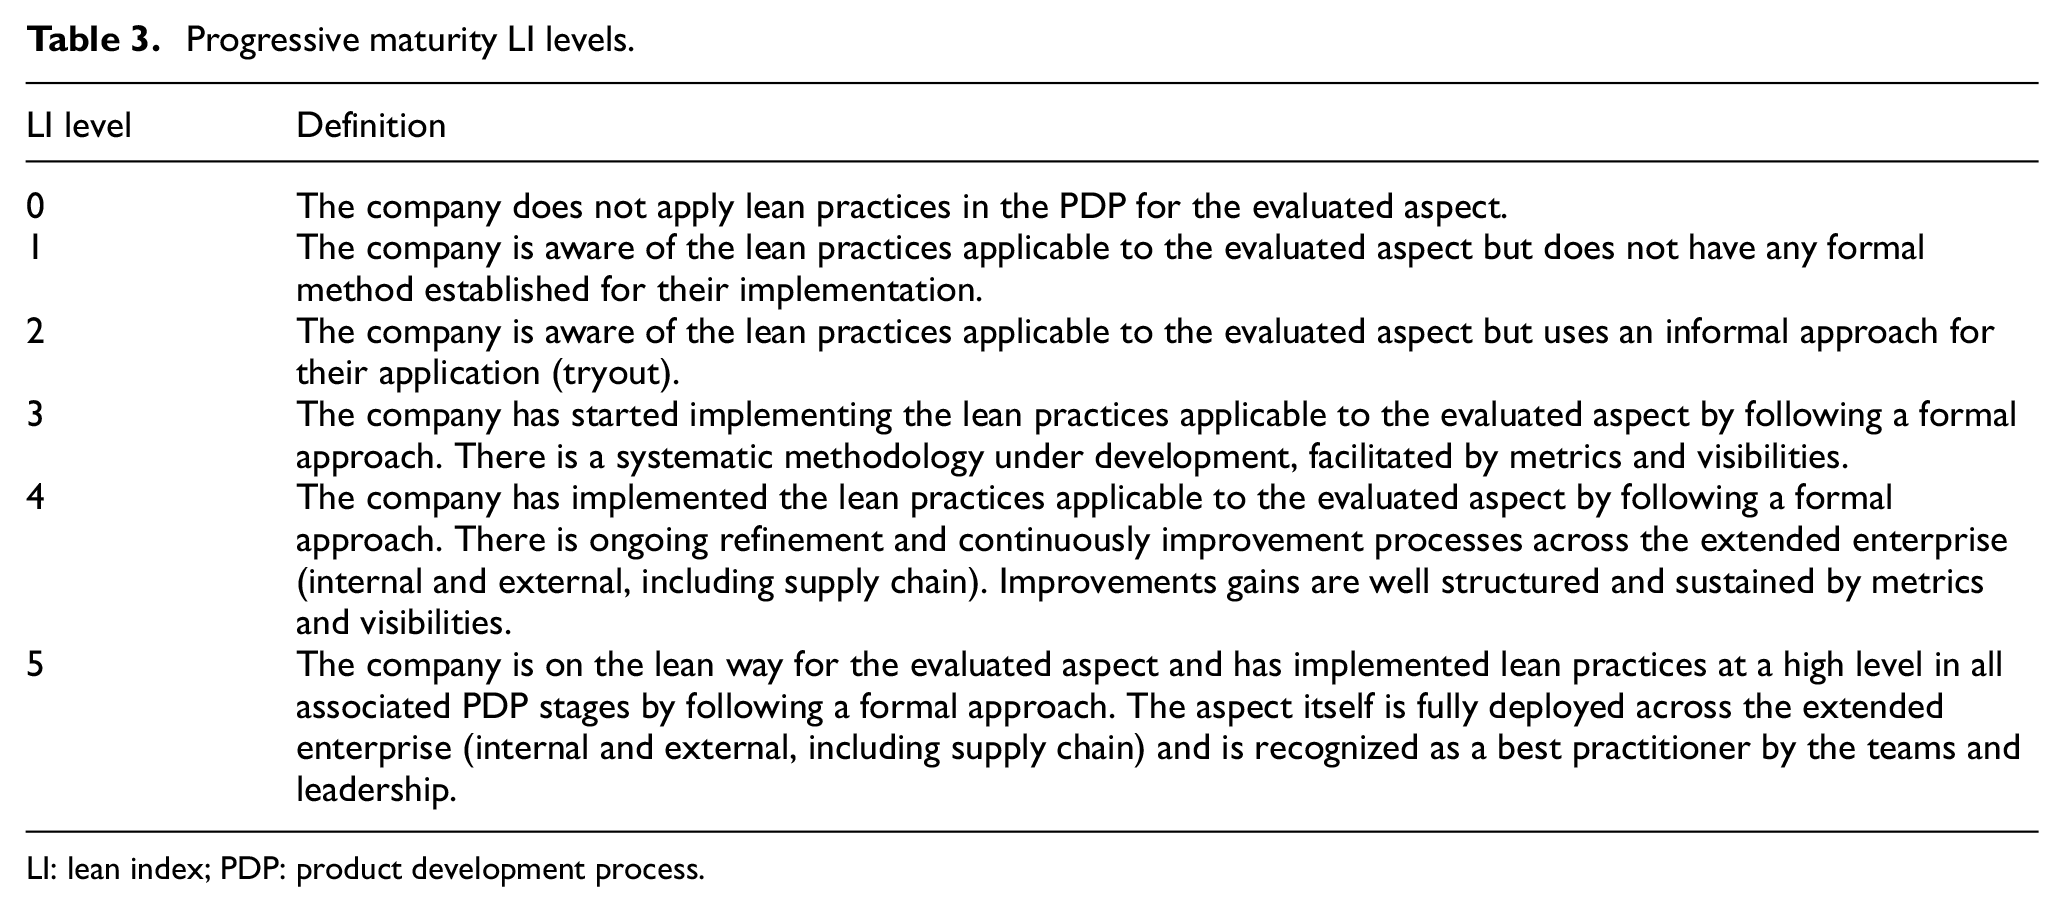
LI: lean index; PDP: product development process.
For the LI construction, each lean element defined in Table 2 receives a theoretical value rate 5 in a 0–5 scale in order to set the referential lean rate (LR). This referential value is called the theoretical true lean organization rate (TTLOR) and will be used as an input for the method deployment. The referential LR is considered to be a theoretical value because fulfilling all lean aspects is rather difficult, if not impossible. The referential LR is indicated in Table 4.
Theoretical true lean organization lean rates.
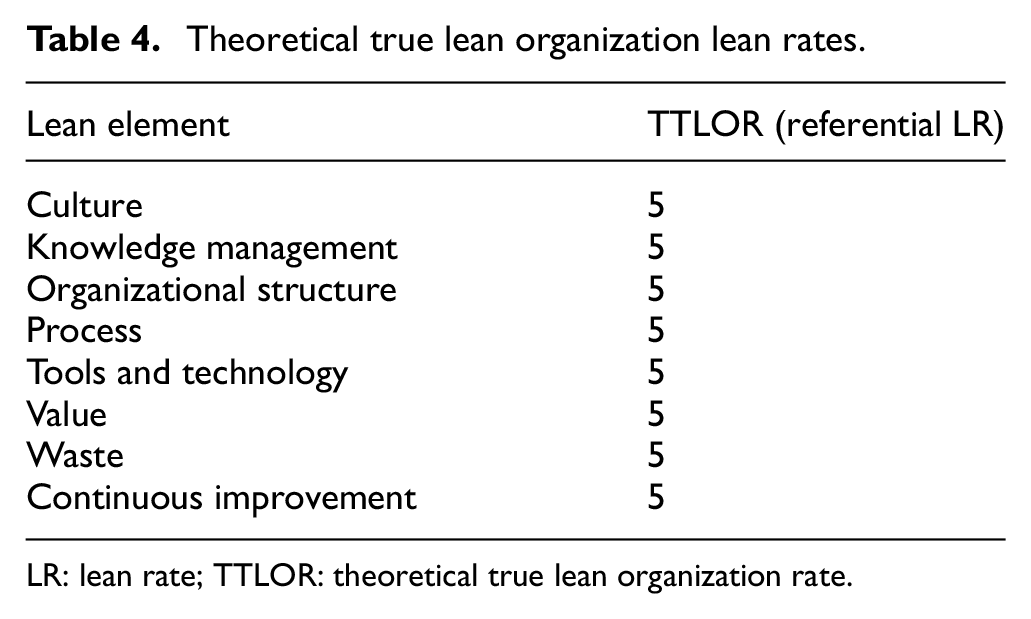
LR: lean rate; TTLOR: theoretical true lean organization rate.
The referential LR is defined in order to establish a baseline for the LI calculation based on the TTLOR. Equation (1) describes the TTLOR.

The TTLOR is a theoretical value that indicates a true lean organization company where all definition criteria aspects are in line with the PDP.
Each lean element considered in Table 4 has its own (and real) element lean rate (ELR) when the assessment is performed for each lean aspect considered in Table 2, by the enterprise intended to emerge as a true lean organization. The ELR is defined in equation (2).
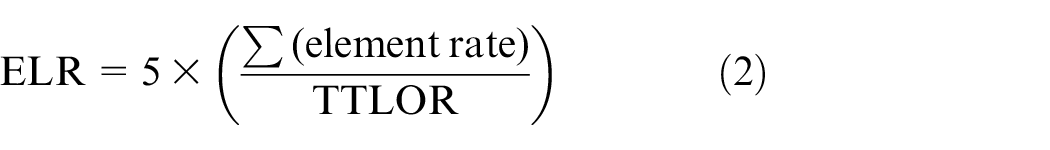
As mentioned before, the ELR is a realistic rate that comes directly from the self-assessment performed by the enterprise during the method’s deployment. As far as each lean element considered in Table 2 has a different definition criteria aspects amount, the relativeness between them are achieved through equation (2), which standardizes the “weights” considered for all the elements through a “5×” multiplication factor, and also by the TTLOR considered in the mathematics as shown in equation (2).
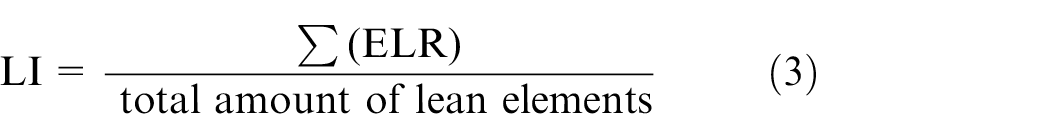
Within the TTLOR and the ELR, it is possible to get the LI by calculating the average between the sum of all ELR and the total amount of lean elements considered by the method, as indicated in equation (3).
The LI is based on a comparison between the company’s current state and a future target condition that best describes a true lean organization company (theoretical value), emerging from a scenario where all lean elements are in line with the lean product development process. Based on the LI, the lean index level range (LILR) and the lean engagement level diagnosis (LELD) are established in order to deploy the full engagement diagnosis and associated lean roadmap for the assessed enterprise. For an LI where the result is close to the target condition, for example, the LILR value shall be up to 90% from the reference value in a 0–5 scale. However, an LI with values between 44% and 30% of the reference value on a 0–5 scale indicates poor lean engagement. An LI below 29% from the reference value on a 0–5 scale indicates that the assessed enterprise is unqualified for the evaluated lean element. The definitions and rate criteria for the LILR are presented in Table 5 and, the LELD, definitions and rate criteria are presented in Table 6.
Lean index level ranges.
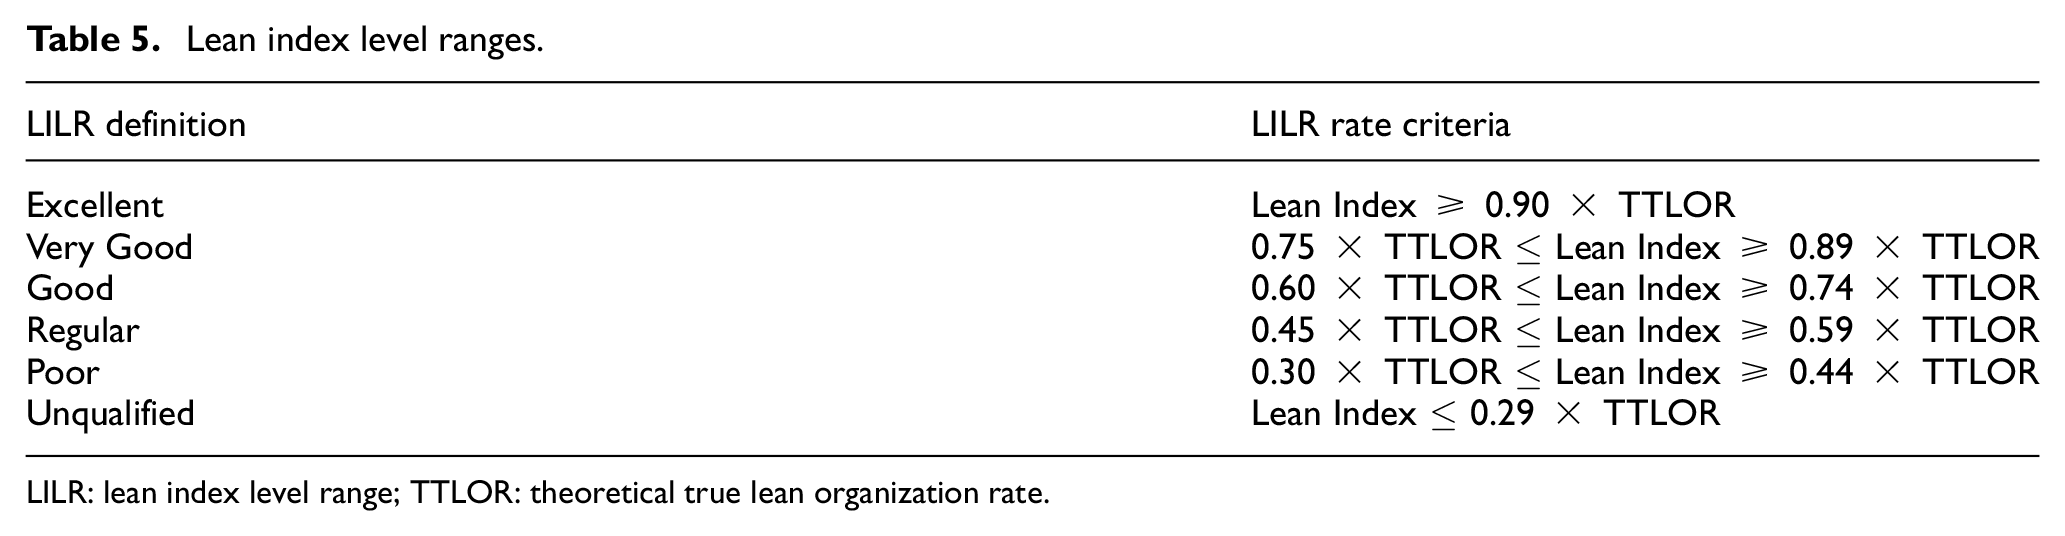
LILR: lean index level range; TTLOR: theoretical true lean organization rate.
Lean engagement level diagnosis definition.
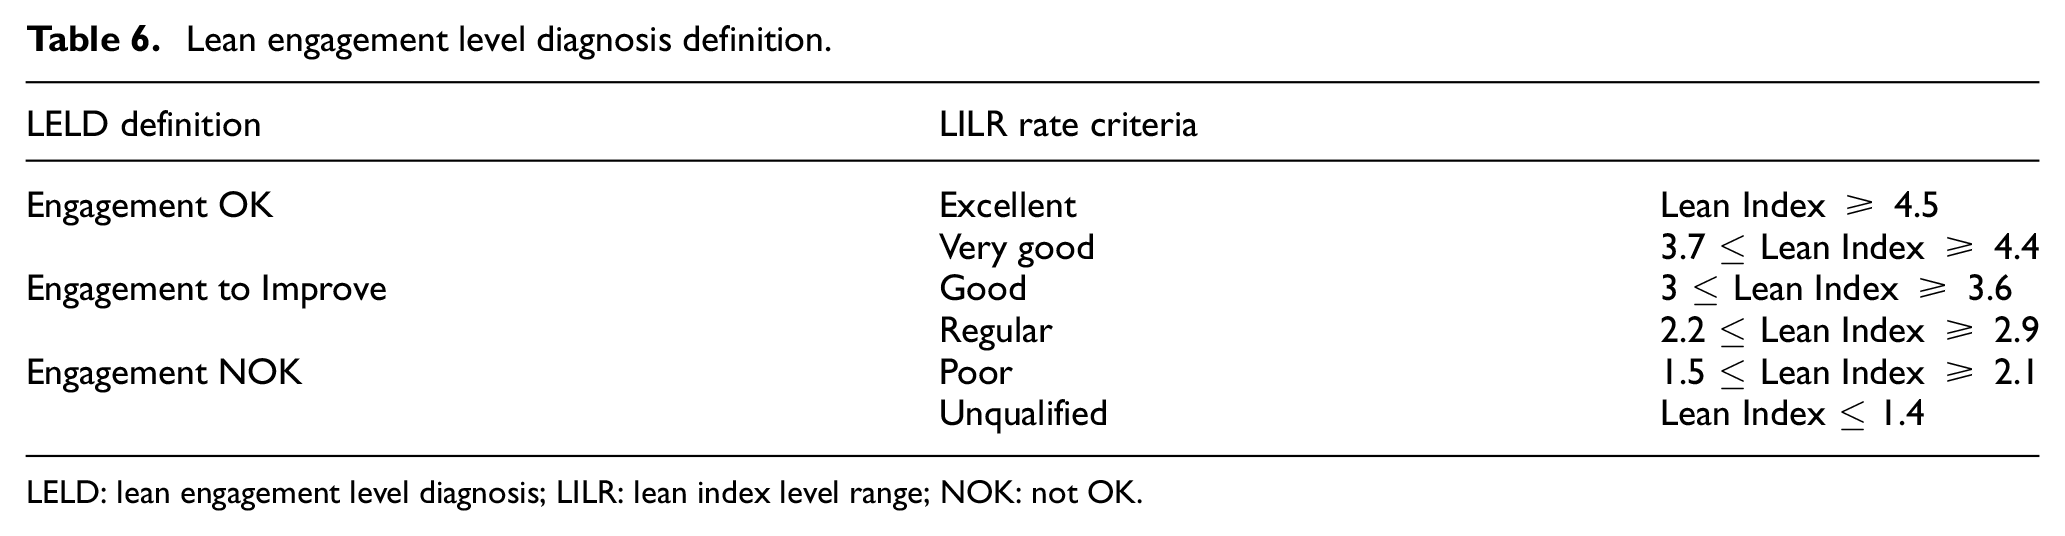
LELD: lean engagement level diagnosis; LILR: lean index level range; NOK: not OK.
Engagement OK means the LILR is between excellent and very good. A company with such a high level is in line with the lean concept and techniques. The lean enterprise shall continue seeking continuous improvements and waste reduction by the application of Kaizen, PDCA (plan, do, control, and act), and SDCA (standardize, do, check, and act). A new evaluation shall be performed every 6 months in order to guarantee current LELD.
Engagement to Improve means the LILR is between good and regular. A company at such an intermediate level is line to succeed with the lean concept and techniques but also has opportunities to overcome it. The lean company shall continue seeking continuous improvements and waste reduction according to the lean roadmap defined for each assessed element. A new evaluation shall be performed every 3 months in order to confirm the current LELD and to check for progress to the next level at the assessment reapplication.
Engagement NOK means that the LILR is between poor and unqualified. A company with such a low level is in the beginning of the lean transformation patch. The enterprise shall continue seeking continuous improvements and waste reduction according to the lean roadmap defined for each assessed element. A new evaluation shall be performed on a monthly basis in order to be ready for the next assessment reapplication.
Each lean element and related definition criteria has a selected amount of countermeasures (CMs) associated with it. The CMs composes the lean roadmap and are applicable only for those cases where the assessed enterprise is diagnosed within the LELD “Engagement to Improve” or “Engagement NOK.” For those cases, the proposed roadmap can lead the enterprise on acting on the identified weakest lean elements. Figure 2 illustrates an interaction cycle, where the more countermeasures are applied after each assessment cycle, the more a company can emergence as a true lean organization. The objective of the interaction cycles is to demonstrate the importance of continually seeking improvement and process optimization after the roadmap and associated lean initiatives take place.
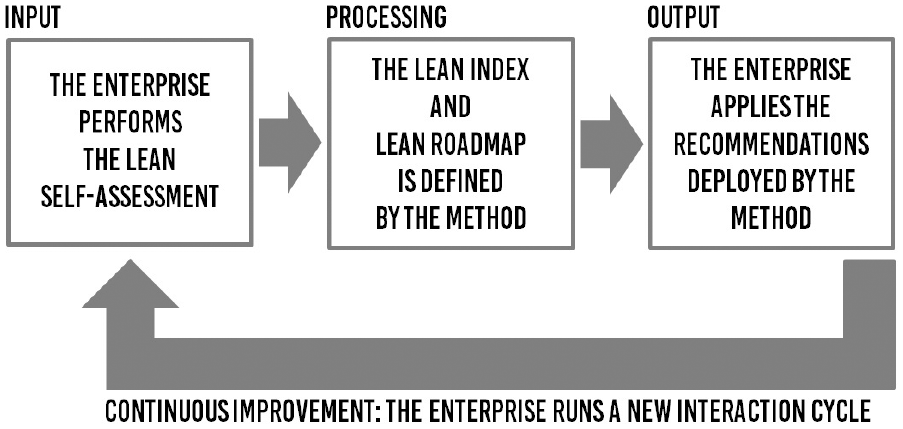
Interaction cycle (constructed by authors).
Lean roadmap
A roadmap is a traffic-flow example that indicates several possible routes from a chosen starting point to a desired destination (Prasad, 2016b). The lean roadmap proposed by this study was established by the Delphi research methodology, that has been previously presented as a survey (Bandyopadhyay, 2005), a study (Keebler and Plank, 2009; Stevenson and Spring, 2007), a technique (Akkermans et al., 1999; Babbar et al., 2008; Lummus, 2007; Manuj et al., 2009), and a method (Hameri and Hintsa, 2009; Reyes and Giachetti, 2010). Initially, a group of 15 professionals was invited to make up the lean experts board. However, seven of them could not attend, resulting in a total of eight lean experts for the Delphi application. Interviews were launched in order to compose the roadmap for each lean element considered on this research (see Appendix 1). The Delphi application was performed by January 2018, and comprised two rounds, as per the following approach. In the first round, the respondents were asked to give their perceptions for each lean element regarding a roadmap to be followed by a leanness enterprise to emerge as a true lean organization. In the second round, panel members exchanged their assumptions in relation to those given by the group as a whole, and they came up with an average definition after the group’s reflection on the shared response group dynamics performed among the participants. The second round questionnaire (see Appendix 1) comprised same questions as the first round, plus the average answers gathered from first loop. Once more, it was launched among the lean experts, now considering the “group’s response” as per the first round conclusion. The results were considered to be the consensus of the lean specialists group regarding a lean roadmap for the elements considered by this study to be implemented in a leanness enterprise emerging as a true lean organization.
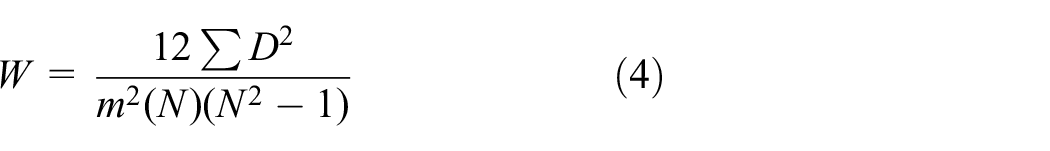
To obtain a measure of consistency among the eight lean expert’s responses, Kendall Coefficient of Concordance (W) was also applied. Kendall Coefficient of Concordance (W) is a statistical test of agreement among two or more judges, or of the consistency of two or more sets of rankings in a contest (Israel, 2009). This coefficient varies between “0,” indicating no agreement between judges, and “+1,” indicating a complete agreement among the judges on the ranking of various attributes. In equation (4), Kendall coefficient of concordance (W) is demonstrated.
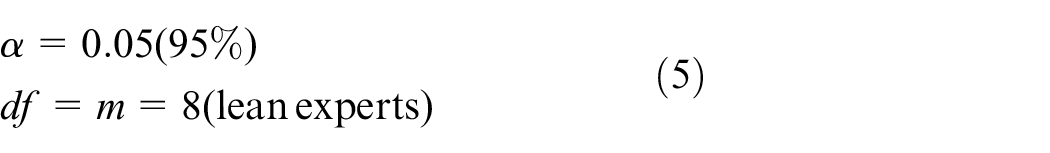
As a level of significance for equation (4), the proposed method adopted a 95% confidence interval, as indicated in equation (5).
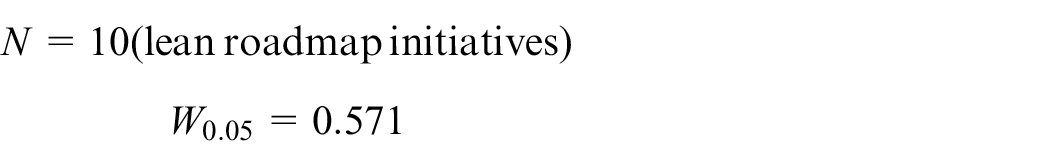
According to equations (4) and (5) application, when Kendall coefficient of concordance (W) is from 0.571 to 1, it means that the lean experts selected for this study consolidation set an agreement or concordance trend for the lean element roadmap under evaluation. The same way, as far as Kendall coefficient of concordance (W) is below 0.571–0, then there is no overall agreement or concordance trend for the lean element roadmap under evaluation; as a result the identified ranges for the coefficient of concordance (W) were used for the roadmap definition. Appendix 1 presented the same roadmap action plan (AP)/CMs for all the lean elements considered by the method; and only the ones assigned within Kendall coefficient of concordance (W) attending the first criteria (from 0.571 to 1) were considered for each lean element roadmap definition. Table 7 presents the roadmap resulting from the Delphi and Kendall coefficient of concordance (W) application.
Lean roadmap.
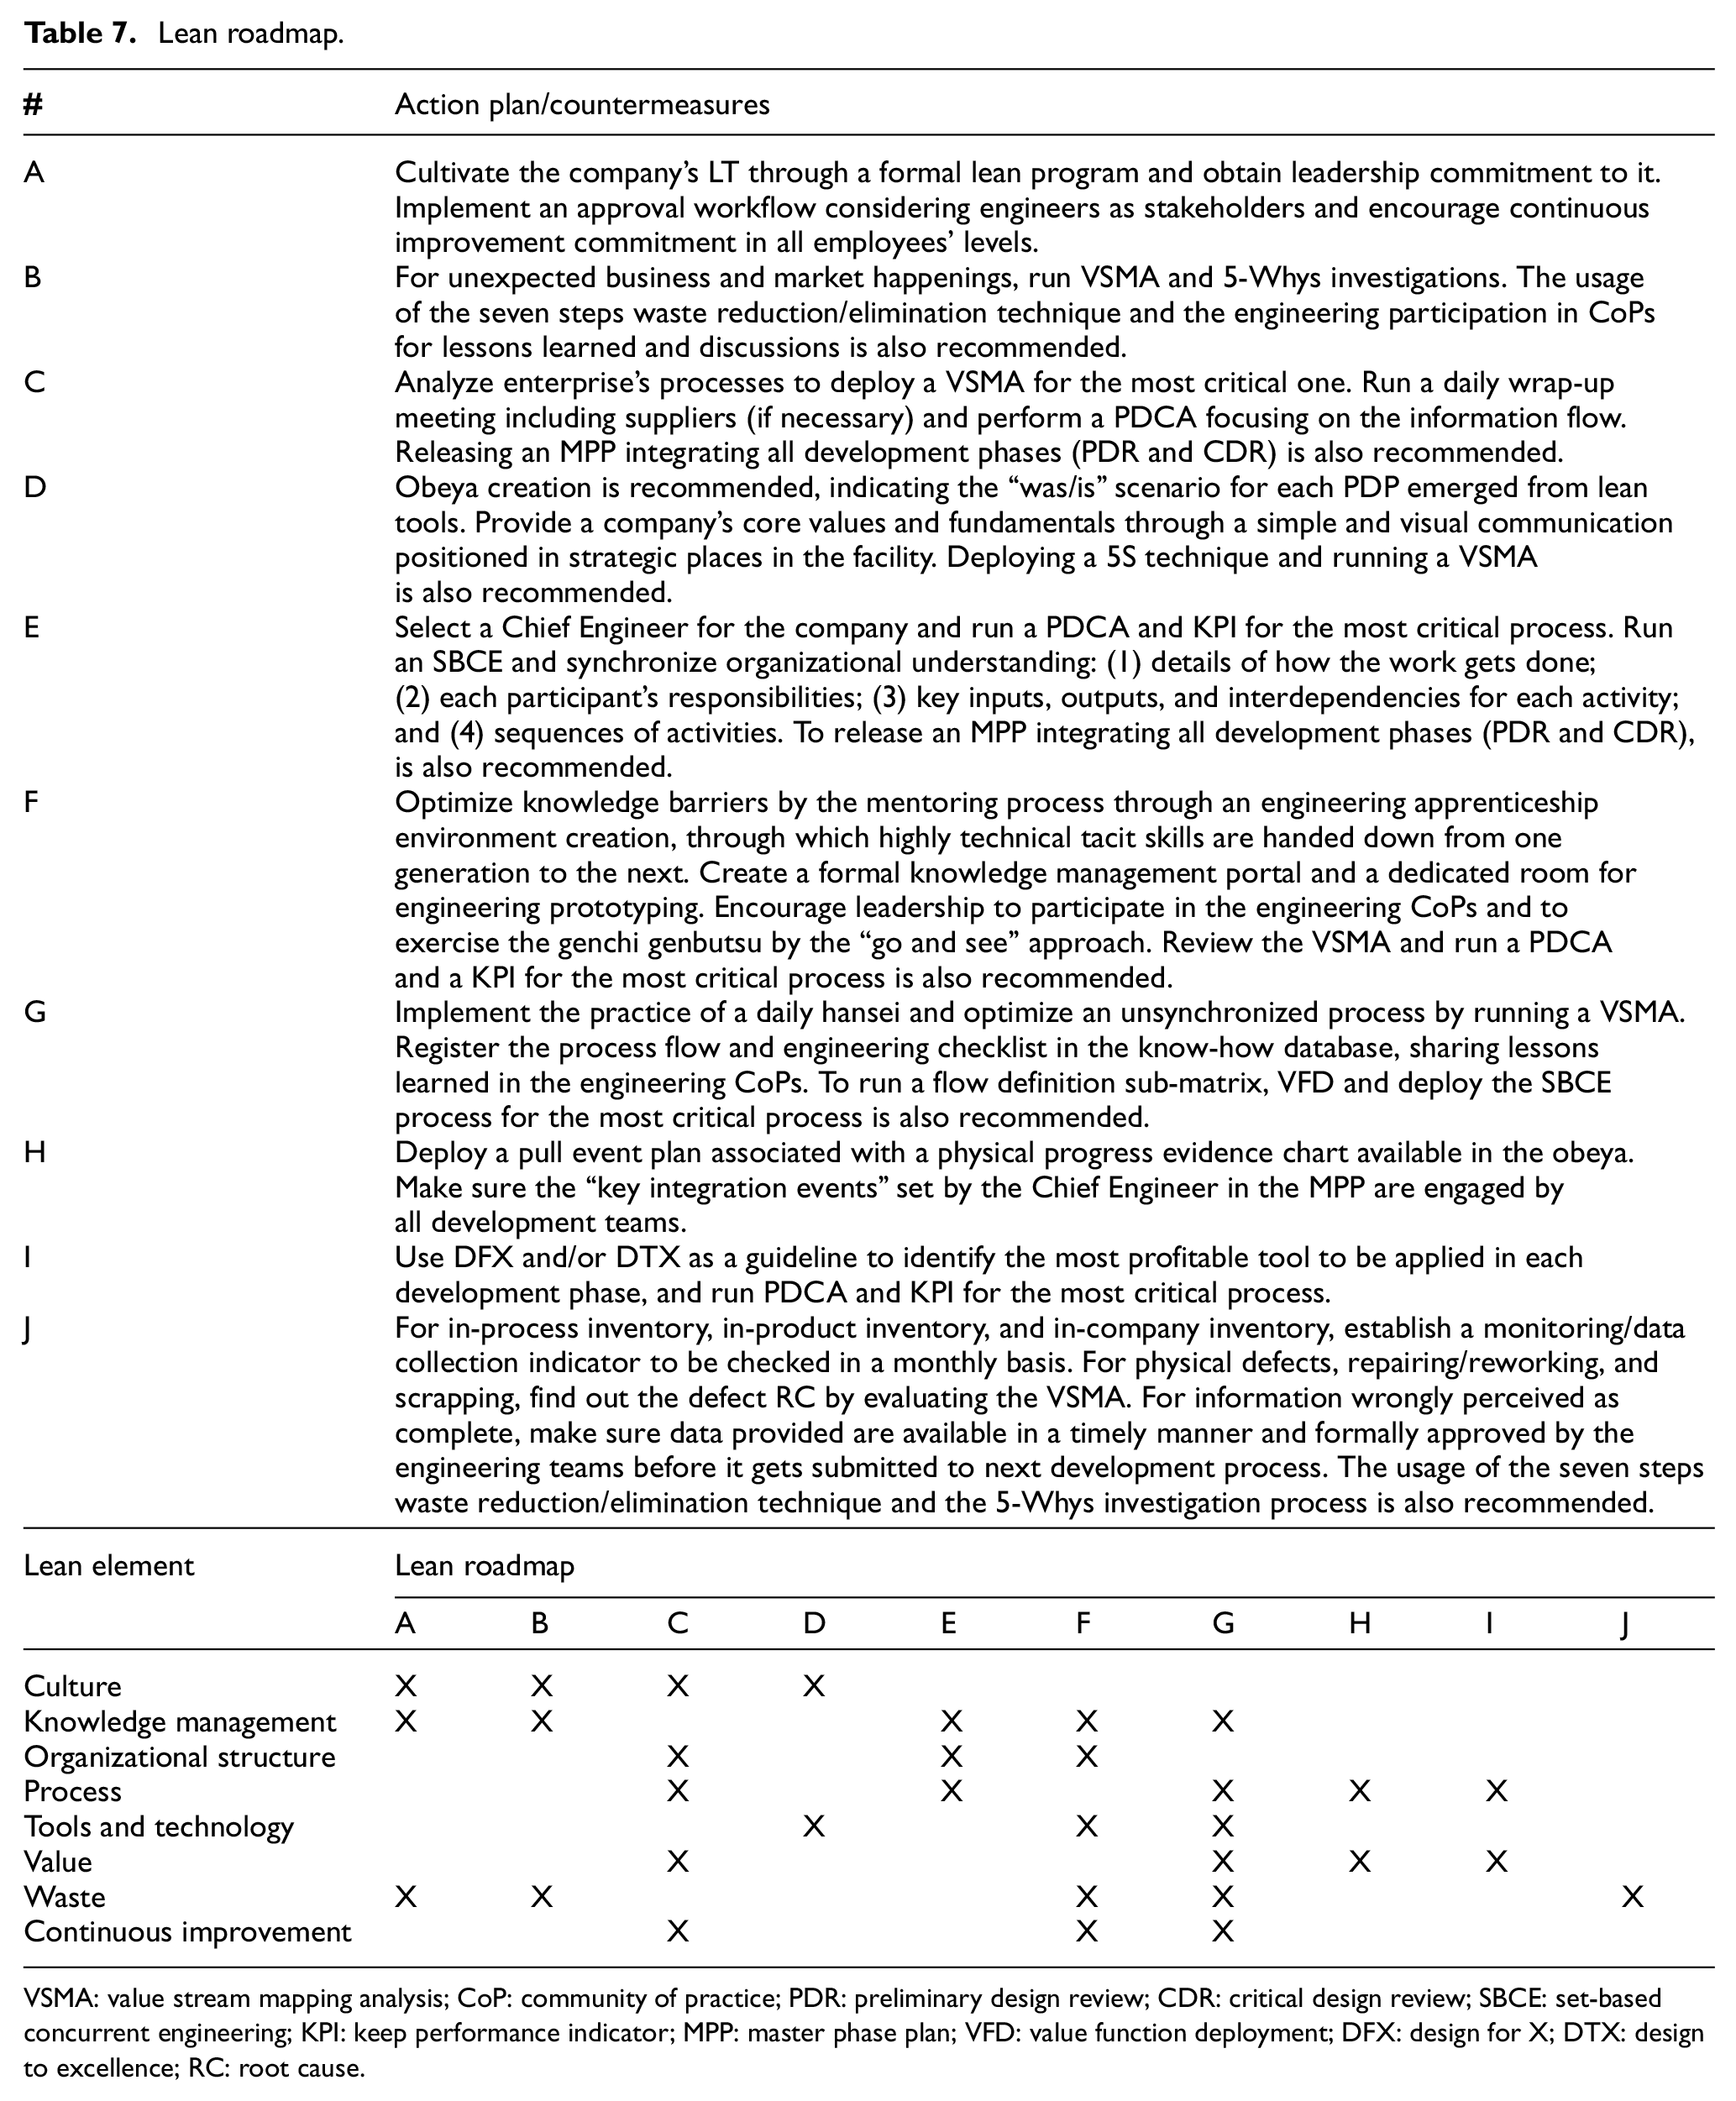
VSMA: value stream mapping analysis; CoP: community of practice; PDR: preliminary design review; CDR: critical design review; SBCE: set-based concurrent engineering; KPI: keep performance indicator; MPP: master phase plan; VFD: value function deployment; DFX: design for X; DTX: design to excellence; RC: root cause.
Results and analysis
Recently, products like aircraft and helicopters are becoming more and more complex than before (Prasad, 2001c) and the manufacturing industry each time moves toward to products customization (CJ Anumba et al., 2000). The complexity and variety of new product introduction (NPI) have grown from a very “simple” to a “complex” scenario. At the same time, the time-to-market dimension has shrunk (Prasad, 1994a, 1997c). As part of this context, the case study for the method application is an aeronautical company responsible for supplying interiors and hydraulic components for the Brazilian aircraft manufacturing industry. It was founded on 4 July 1990 in Rio de Janeiro and had around 100 employees by the time method was deployed. The facility also contained manufacturing, laboratory, and engineering departments engaged in the development and production of its products.
Results
The method’s deployment results prior to the countermeasures application in the assessed enterprise are summarized in Table 8. In the same way, the method's deployment results after the countermeasures application in the assessed enterprise are summarized in Table 9.
Lean engagement assessment summary prior to roadmap.
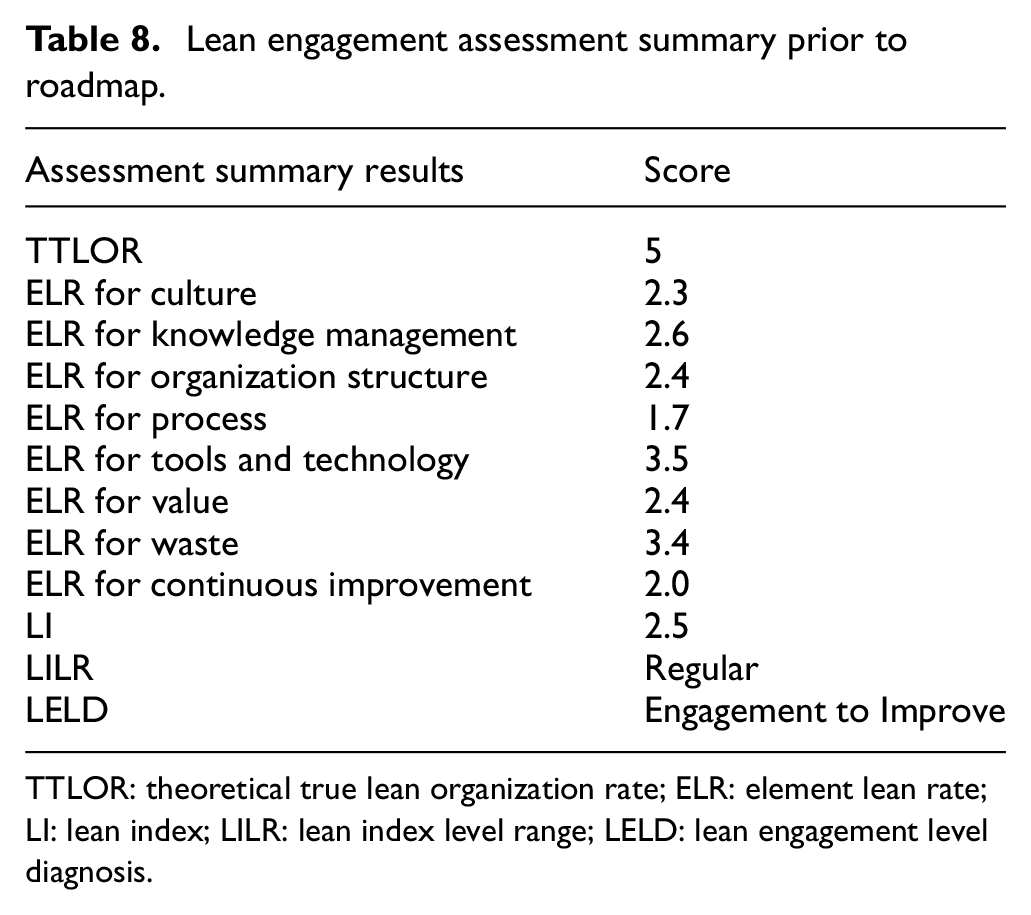
TTLOR: theoretical true lean organization rate; ELR: element lean rate; LI: lean index; LILR: lean index level range; LELD: lean engagement level diagnosis.
Lean engagement assessment summary after roadmap.
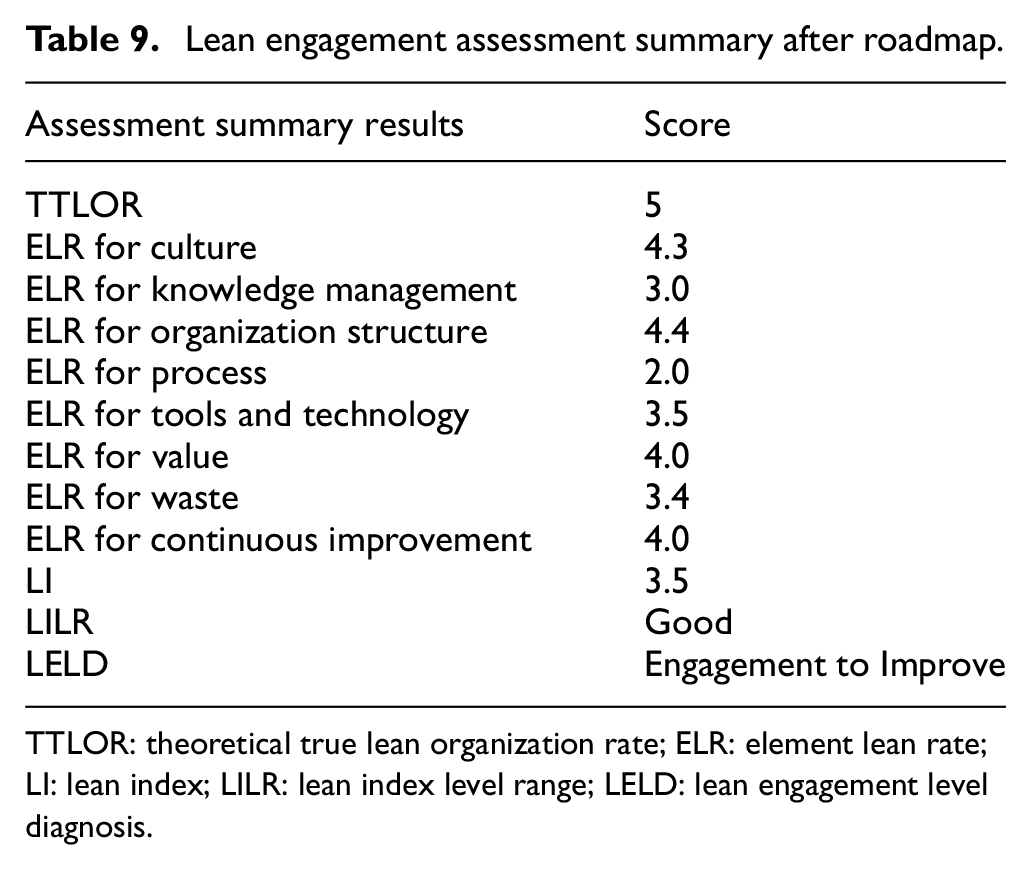
TTLOR: theoretical true lean organization rate; ELR: element lean rate; LI: lean index; LILR: lean index level range; LELD: lean engagement level diagnosis.
As far as the lean index for the case study enterprise scored 2.5 on a 0–5 scale prior to the countermeasures application, and the LILR was categorized as “Regular,” the LELD was classified as “Engagement to Improve” according to Table 6 criteria. The “Engagement to Improve” classification conducted the enterprise to apply the lean roadmap deployed by the method, taking countermeasures for the assessed lean elements classified as “Engagement to Improve” or “Engagement NOK” as per Table 6 criteria and definitions.
Three months after the method’s application and the roadmap recommended by this study being applied, the case study enterprise was reassessed, and the results are summarized in Table 9.
Analysis
As demonstrated by Table 9, after the roadmap’s application for the case study enterprise, there was a slight improvement in the overall LILR and several associated lean elements. The elements “sponsored” by leadership such as: culture, organizational structure, value, and continuous improvement had a bigger impact on the reassessment, demonstrating that lean initiatives are closely related to all enterprises’ levels of engagement to succeed on the transformation patch.
The LILR was upgraded from ``Regular'' to “Good” but the LELD was still classified as “Engagement to Improve.” That way, a roadmap was also deployed by the method after the reassessment, providing recommendations and countermeasures only for the lean elements with low ELR as per Table 5 and 6 criteria.
Conclusion
The proposed method can be used as guidance for the managers to introduce recommended changes on their lean implementation journey. The lean implementation patch is not a destination but a journey, and a high lean index value is not directly linked to the number of lean methods and tools adopted by the company, but it is closely related to a maturity level constructed on a daily basis and supported by the performance indicators. The manufacturing sustained growth and earnings are based on creating high value products in very dynamic global markets (Prasad, 1994b). That way, the comprehensive implementation of lean practices is necessary and, in order to be effective, all lean initiatives should be “sponsored” by leadership (Badri et al., 1995; Danese et al., 2017; García et al., 2013; Hu et al., 2015; Netland, 2016; Shah and Ward, 2007). Finally, since a lean organization is in new technological advances constant touch and frequently employs technologies to improve an existing product (Prasad, 1995), it cannot be sustained using conventional techniques alone. The application of complementary methodologies and methods such as the lean integrated and connected (LIC), knowledge capture and reuse (KCR), library of knowledge frameworks (Nada et al., 1998; Prasad, 2017), life-cycle measures and metrics for concurrent product and process design (Prasad, 2000) and a performance assessment based on reliability/decision-based integrated product development (DIPD) frameworks (Prasad, 1999, 2002) are also recommended.
Footnotes
Appendix 1
Declaration of conflicting interests
The author(s) declared no potential conflicts of interest with respect to the research, authorship, and/or publication of this article.
Funding
The author(s) received no financial support for the research, authorship, and/or publication of this article.