
Abstract
In mid-2011, the Florida legislature reduced the state’s early voting period from fourteen days to eight and eliminated the final Sunday of early voting. We compare observed voting patterns in 2012 with those in the 2008 General Election and find that racial/ethnic minorities, registered Democrats, and those without party affiliation had significant early voting participation drops and that voters who cast ballots on the final Sunday in 2008 were disproportionately unlikely to cast a valid ballot in 2012. Florida’s decision to truncate early voting may have diminished participation rates of those already least likely to vote.
Introduction
Contestation over the right to vote in the United States has been a continual battle that dates to the country’s founding (Hasen 2012; Keyssar 2000). Since the Civil Rights Era and through the mid-2000s, though, there was a semblance of continuity in the conduct of elections, presumably due in part to the federal government’s role in election administration under the purview of the Voting Rights Act of 1965 (e.g., May 2013; Wang 2012). The last several years have heralded an end to this period of relative calm as important election laws have been altered in many states (Minnite 2012). Some of the recent changes to voting procedures have clearly expanded ballot access—for example, by permitting no-excuse absentee voting, in-person early voting prior to Election Day, and election day voter registration (e.g., Burden et al. 2014; Gronke 2012; Hanmer 2009; Tolbert 2008). Other laws, though, have had more ambiguous effects—for example, by requiring forms of identification prior to vote, the effects of which are the subject of ongoing research (Barreto, Nuño, and Sanchez 2009; de Alth 2008; Dropp 2013; Mycoff, Wagner, and Wilson 2009; Sobel and Smith 2009).
Although the anticipated effects of an ostensibly advantageous electoral rule change may not always pan out in an expected direction (Bowler and Donovan 2013; Shepsle 1989), it is nonetheless true that small perturbations in election administration practices can portend large effects (e.g., Frisina et al. 2008). With this in mind, we explore the consequences of what some might argue is a seemingly innocuous and technical electoral rule change in the state of Florida, namely, a reduction as of mid-2011 in the number of permitted days of early voting. Drawing on multiple slices of official statewide voter files, we seek to ascertain whether the retrenchment of early voting in Florida may have shifted the behavior of racial/ethnic minorities and partisans and also whether it had differential effects across voter groups and more broadly diminished early voting participation. Much of our analysis turns on comparisons of early voting patterns in Florida from the 2012 General Election with those that took place in 2008. While we focus here on many different types of Floridians, the early voting rates of Blacks and Democrats deserve special attention because these two groups have historically in Florida been disproportionately heavy users of early voting and Sunday early voting in particular (Herron and Smith 2012). These dual regularities are important insofar as Florida House Bill 1355, the source of the aforementioned, mid-2011 changes to Florida’s early voting laws, altered Florida’s early voting landscape in two ways: it reduced the number of early voting days from fourteen to eight and it eliminated early voting on the final Sunday before a Tuesday election.
Those in the Florida legislature responsible for altering the state’s early voting period may have understood that their decisions were not benign. The Palm Beach Post reported soon after the 2012 General Election that some backers of House Bill 1355 admitted that the legislation’s changes to early voting in Florida were aimed squarely at Democrats and were intended to drive down Democratic early voting rates. Former Florida Republican Party chairman Jim Greer noted several weeks after the 2012 presidential contest, “The Republican Party, the strategists, the consultants, they firmly believe that early voting is bad for Republican Party candidates.” Greer also explicitly referred to the invocation of voter fraud (the stated motivation for reducing the number of early voting days) as a “marketing ploy” and said as well that staff members told him, “We’ve got to cut down on early voting because early voting is not good for us” (Kam and Lantigua 2012).
Briefly, our results suggest that the reduction in Florida’s early voting period worked as allegedly designed. Beyond highlighting variance in early voting usage across Florida’s main racial/ethnic and partisan groups, we show that Democratically leaning groups were most affected in 2012 by a surge on the final day of early voting, a surge that did not exist in 2008 when Florida’s early voting period was longer. We show as well that overall early voting turnout was down in 2012 compared with 2008 and down disproportionately among Blacks and registered Democrats (which, as an aside, makes the aforementioned surge on the last day of early voting even more striking). Of course, that early voting was down in 2012 could be simply an artifact idiosyncratic to the 2012 General Election. Nonetheless, the declines we identify were most pronounced among racial and ethnic minorities—who in Florida and elsewhere tend to be registered as Democrats (Wayne 2011, 95)—and such declines are in line with the cited objectives associated with trimming the early voting period in Florida. We show as well that voters who cast their ballots on the last Sunday of early voting in 2008 had relatively low participation rates in the 2012 General Election. As with various other electoral reforms (Piven and Cloward 2000; Rosenstone and Hansen 1993), from this it follows that the truncation of early voting in Florida—particularly the elimination of the final Sunday of early voting—may have dampened the participation of those voters who most benefited from what previously was an extended period of early voting.
In the upcoming section, we offer an overview of the scholarship and history of early voting in the United States with particular attention to the adoption of early voting in Florida. We then present our research design, describe data sources, and characterize the 2008 and 2012 Florida registered voter pools and early voting electorates. Our main results appear next, and these draw attention to 2008–2012 changes in Florida early voting participation. We conclude with some thoughts about the broader participatory effects of reducing early voting.
Early Voting and Its Discontents
Across the country and over the course of the past ten years, states have expanded the ability of citizens to cast early ballots (e.g., Gronke 2012; Gronke and Stewart 2013). Early in-person voting provides registered voters with the flexibility to cast their ballots before Election Day at either a centralized voting center or at one of many polling stations scattered across a jurisdiction such as a county or township. The term early voting encompasses several convenient mechanisms of ballot casting prior to Election Day—including in-person ballots cast at early voting polling locations, traditional no-excuse absentee ballots, and mail-in ballots. Here we use the term only as it pertains to in-person voting at an early voting polling station prior to Election Day. The actual process of voting an in-person early ballot is practically identical to that associated with casting an in-person ballot on Election Day, and this contrasts with absentee voting, which requires a signature verification step.
The gradual incorporation of early voting across what is now a majority of states is a type of electoral rule change, and for decades scholars have acknowledged that even seemingly minor institutional changes can impact voter participation rates. With respect to early voting, the geographic and temporal accessibility of early voting centers—locations where early voters cast their ballots—affects how many and which voters decide to cast a ballot prior to Election Day (Gimpel, Dyck, and Shaw 2006; Stein and Vonnahme 2011). However, some scholars have argued that in-person early voting does not in the aggregate lead to increased voter turnout. In his survey of election reforms, for example, Gronke (2008, 450) concludes that early voting “does encourage turnout among regular voters for low-intensity contests, but it does not help solve the participation puzzle for new voters or those outside the system for reasons of disinterest, language, disability, or other burdens.” Stein (1998) found in his study of Harris County, Texas, in 1994 that strong partisans and especially Democrats were disproportionately likely to use early voting. Tellingly, Stein uncovered scant sociodemographic variance between those who reported casting an early ballot and those who said they waited to vote on Election Day. Other scholars, drawing on survey responses, have similarly found few differences between respondents who said they voted early and those who said they voted on Election Day (e.g., Neeley and Richardson 2001). The literature on election reforms contains various other examples of mixed results as to whether in-person early voting enhances voter turnout or merely shifts the timing in which voters who are already likely to cast ballots actually vote (e.g., Gronke and Galanes-Rosenbaum 2008; Gronke, Galanes-Rosenbaum, and Miller 2007; Gronke, Hicks, and Toffey 2009; Gronke and Toffey 2008).
Could the introduction of early voting have driven down turnout rates? In a recent contribution to the literature on election reform, Burden et al. (2014) argue that it has, perhaps because early voting—broadly defined—reduces the importance of Election Day per se and the associations that voters have with this day. Berinsky (2005) neatly summarizes such a paradox, what he refers to generally as “the perverse consequences of electoral reform.” Indeed, it is certainly conceivable that the introduction of early voting may exacerbate existing socioeconomic inequalities when it comes to turnout, as likely voters may be those most predisposed to take advantage of the “convenience” of early voting. However, as much of the early research on early in-person voting and vote-by-mail was conducted in racially relatively homogeneous states such as Oregon (e.g., Karp and Banducci 2000; Southwell 2004; Southwell and Burchett 2000), it remains an open-ended question as to whether the institutionalization of early voting in a more heterogeneous state, say Florida, may reduce existing inequalities in voter turnout. Stein, Leighley, and Owens (2005) argue that early in-person voting may not be “self-actuating” and may rely instead on mobilization efforts by partisan operatives. In a battleground state like Florida, there is considerable evidence that partisan operatives encourage peripheral voters to vote early (Herron and Smith 2012).
Notwithstanding the less-than-conclusive evidence associated with early voting and electoral participation, a handful of states during the 1990s adopted no-excuse absentee and early in-person voting. In the 1992 General Election, fewer than 8 percent of all voters cast ballots early or by mail, but the subsequent surge across the country in nontraditional methods of voting has been impressive. By 2012, roughly 32 percent of all voters nationwide mailed or cast early in-person ballots prior to Election Day, more than twice the percent of voters who cast early in-person ballots in the 2000 General Election (McDonald 2013). The number of states adopting early voting escalated following the 2000 General Election when states like Florida began to require county supervisors of elections to offer early voting to registered voters. 1 In 2004, the Florida legislature passed a law mandating the availability of early voting in the offices of Supervisors of Elections with additional sites permitted in city halls or public libraries. In-person early voting in Florida was to commence on the fifteenth day before an election and end the day prior to Election Day. The legislation that established these procedures was amended slightly in 2005 to end early voting on the second day prior to a General Election and to require eight hours of early voting each weekday during the two-week window and eight hours in the aggregate on both weekends. 2
Given the bipartisan—and indeed unanimous—support in the Florida legislature for the expansion in 2004 of early voting, it came as a surprise to many that in 2011, the Florida state legislature decided to limit early voting in the state, reducing the number of days as well as the number of hours of early voting that Supervisors of Election were required to offer. 3 In May, 2011, with practically party-line votes in both chambers, the Republican-controlled legislature passed the previously noted House Bill 1355, and Republican Governor Rick Scott signed the bill two weeks later. In addition to restricting voter registration drives by individuals and civic organizations and requiring provisional ballots to be cast by registered voters moving within Florida yet across county lines, House Bill 1355 truncated the early voting period from fourteen to eight days and explicitly eliminated the possibility that Supervisors of Elections could offer early voting on the final Sunday immediately preceding an Election Day (Herron and Smith 2013b). 4
During the debate surrounding House Bill 1355, Republican state lawmakers and then-Secretary of State Kurt Browning claimed that the reduction in days was designed to “combat voter fraud,” “reduce the burden on poll workers,” and “provide needed flexibility to local election supervisors” (Browning 2011). The Majority Leader of the Florida House of Representatives, Carlos Lopez-Cantera, praised the bill because it “will not only protect citizens’ voting rights but also increase voter access.” 5 However, many voting rights organizations, Democratic politicians, and several independently elected Supervisors of Elections decried the changes that House Bill 1355 mandated. The Florida League of Women Voters issued a press release claiming that the bill reverted to “Jim Crow-like tactics” and would inexorably deter racial and ethnic minorities from voting. 6 Concerned about the reduction in the early voting period, Leon County Supervisor of Elections Ion Sancho told the House State Affairs Committee as House Bill 1355 was being debated that the state’s “electoral infrastructure is completely maxed out” and that Supervisors of Elections “would not be able to process record numbers of voters” in the shorter time frame. 7
What follows is a study of these changes to early voting in Florida. Although our analysis is limited to the differential effects of changing one election law in a single state (Nicholson-Crotty and Meier 2003), it has broad implications beyond the state of Florida. Several states in 2013—including Arizona, Indiana, Nebraska, North Carolina, Tennessee, Texas, and Wisconsin—have either proposed or passed legislation to reduce early voting (Brennan Center for Justice 2013). With the demise of Section 4 of the Voting Rights Act, which unfettered nine states and numerous local jurisdictions from federal oversight, it is presumably unwise to think that the pace of changes to electoral codes across the country will decrease in the near future.
Research Design and Data
Our analysis of the consequences in Florida of shortening early voting relies on three statewide voter files; these files are dated December 31, 2012, March 31, 2013, and December 31, 2008. Voter files are essentially lists of registered voters, and we use the former two files when calculating statistics about voters in the 2012 General Election and the latter file when studying the 2008 General Election. We obtained our three voter files through public records request to the Florida Department of State (FDOS), and each voter file contains a wealth of details on every registered voter in Florida, including such information as party affiliation, race/ethnicity, date of birth, and date of registration. Every individual whose name is in a Florida voter file is identified by a unique voter identification number, and these numbers are held fixed across voter files. The reason that there are different files on different dates is because the Florida registered voter pool changes over time as new voters are registered, registered voters move out of Florida, pass away, and so forth. 8 Beyond statewide voter files, our analysis also relies on county-level early voting files made public by FDOS. 9 For each of the approximately 2.6 million early voters in 2008 and approximately 2.4 million early voters in 2008, the early voting files contain voter identification numbers, the dates on which each early voter voted, and the locations at which they cast their ballots. Because the county-level early voting files contain voter identification numbers, we can link these files with our statewide Florida voter files and then use the demographics in the latter to draw conclusions about the Florida early voting electorates in 2012 and 2008. Both our statewide voter files and early voting files contain individual-level data. As such our findings on who votes when, so to speak, are not vulnerable to ecological fallacies, nor are they subject to self-reporting biases that affect estimates of election turnout (e.g., Ansolabehere and Hersh 2012).
Percents do not sum up to 100 due to rounding and the fact that only three racial/ethnic and partisan affiliations are listed. “Composition” refers to the percentage of a registered voter pool (2008 or 2012) that a given group constituted. NPA = no party affiliation.The analysis that follows is comparative and turns on early voting trends observed in 2008 and those in 2012. We draw on such comparisons because 2008 is the logical baseline for an analysis of the effects of truncating Florida’s early voting period. Both the 2008 and 2012 General Elections featured presidential contests with the same Black Democratic candidate, Barack Obama, facing a White Republican opponent. And, we offer here both across- and within-county comparisons of 2008 and 2012 early voting because Florida counties may differ systematically in the extent to which their voters are, say, Democratic, and the extent to which they historically avail themselves of early voting opportunities.
Registered and Early Voters in Florida, 2008 and 2012
There were approximately 12.6 million registered voters in Florida as of the 2008 and 2012 General Elections, and Table 1 contains racial/ethnic and partisan breakdowns for these individuals. 10 The breakdowns list the three most populous racial/ethnic groups and partisan affiliations in the state. Table 1 contains the official names of the racial/ethnic groups as designated by the FDOS, and we refer to these groups as Black, Hispanic, and White. A registered voter in Florida who selected not to affiliate with a party would receive the designation NPA—no party affiliation—in the state’s voter file.
Characteristics of the Florida Registered Voter Pool, 2008 and 2012 General Elections.
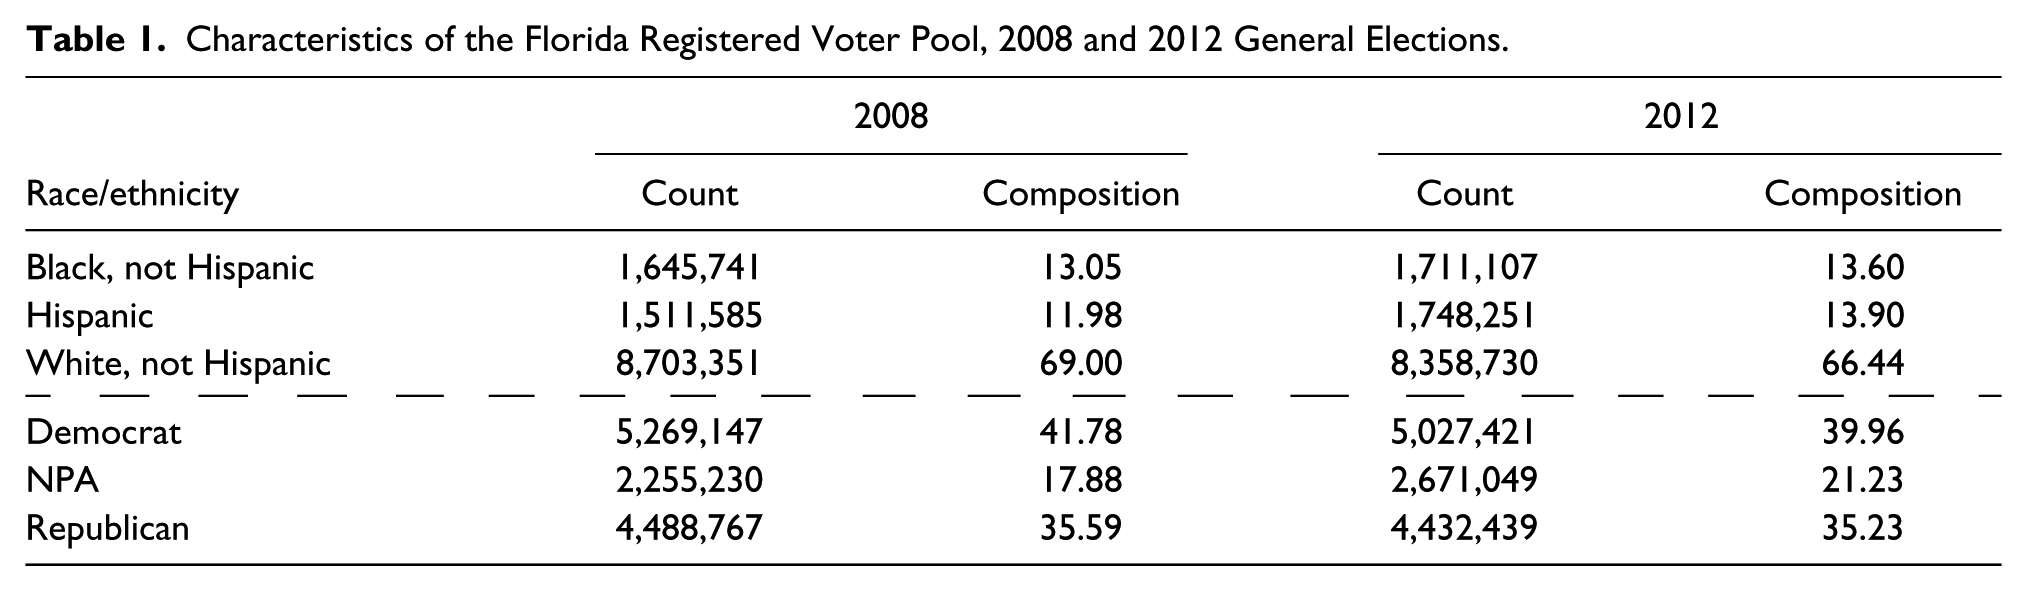
In both 2008 and 2012, White was the most common racial/ethnic classification among registered voters in Florida; more than two-thirds of registered voters self-identified as White on their voter registration cards. In contrast, Blacks and Hispanics each made up between approximately 13 and 12 percent, respectively, of the 2008 registered voter pool, and these percentages rose to roughly 14 percent each in 2012. In terms of partisan affiliation, Table 1 shows that Democrats were the largest such group in Florida in both 2008 and 2012 followed closely by Republicans and then NPA registrants.
Were early voting electorates in 2008 and 2012 representative of Florida registered voters with respect to race/ethnicity and partisanship? Table 2 addresses this question, providing basic counts—for example, the total numbers (“Count”) of Black, Hispanic, and White early voters in 2008 and 2012—as well as percentages (“Composition” and “Participation”) that address the extent to which racial/ethnic and partisan groups engaged in early voting in 2008 and 2012. The two columns labeled “Composition” report the racial/ethnic composition of the early voting electorates in 2008 and 2012. Recall from the earlier Table 1 that, for example, Blacks made up around 13 percent of Florida’s registered voter pool in 2008 and almost 14 percent in 2012. Nonetheless, Blacks composed approximately 22 percent of the early voting pool in these two years. In contrast, Hispanic participation in early in 2008 and 2012 was slightly less than the percentage of Hispanics in the Florida registered voter pool. Finally, Whites were underrepresented among early voters in both 2008 and 2012. The “Composition” columns in Table 2 thus show how the early voting electorates in both 2008 and 2012 overrepresented Blacks and underrepresented Hispanics and Whites relative to overall voter registration.
Early In-Person Electorates, 2008 and 2012 General Elections.
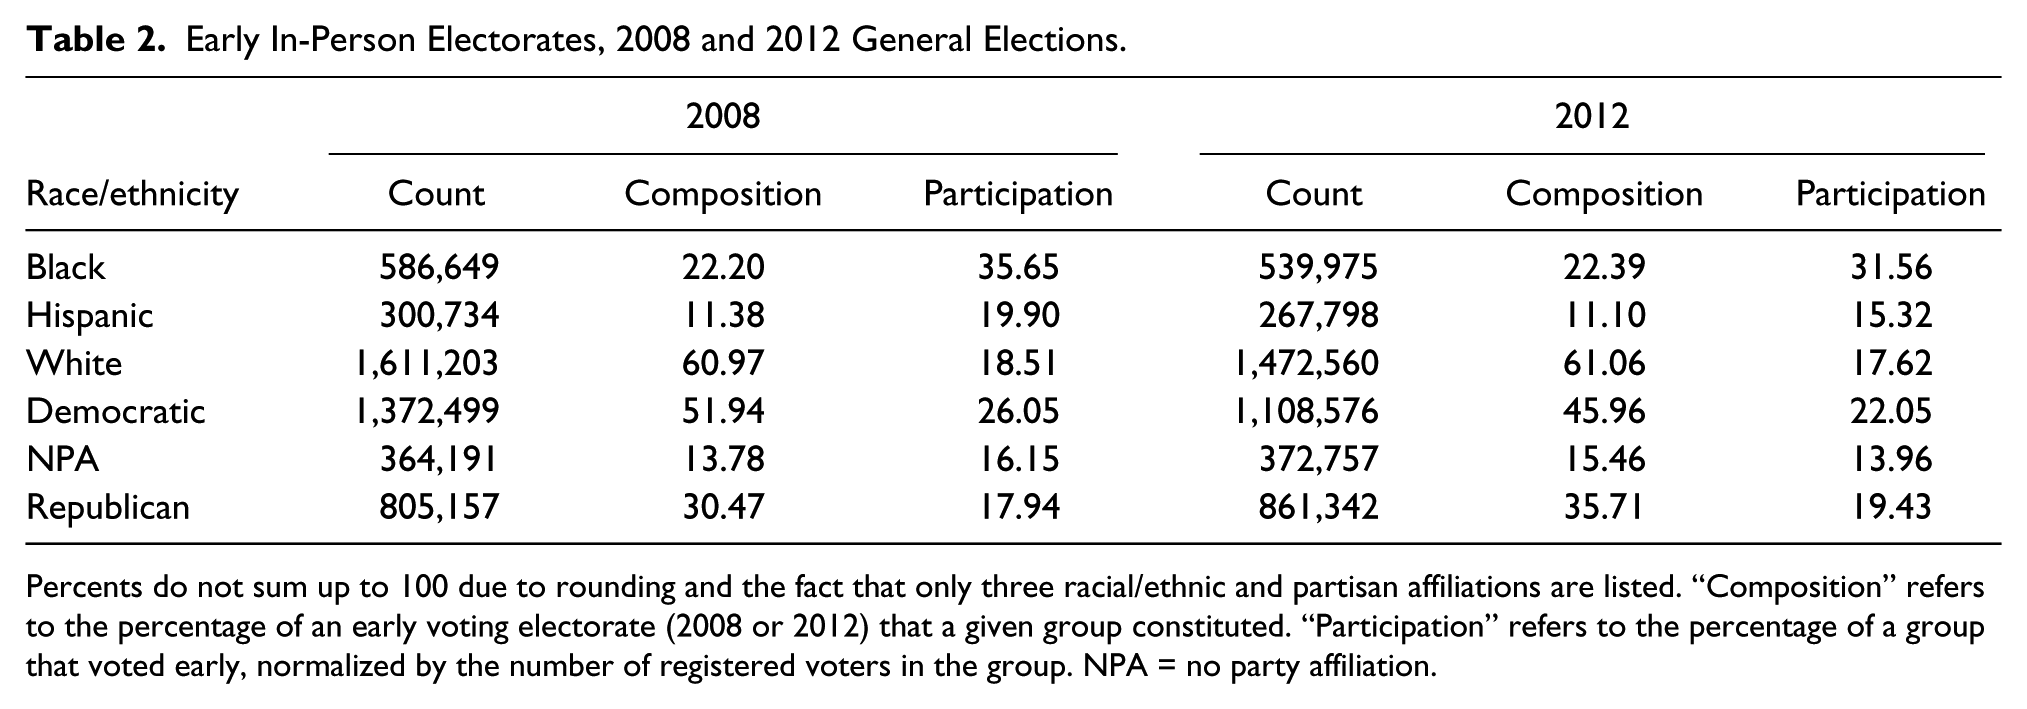
Percents do not sum up to 100 due to rounding and the fact that only three racial/ethnic and partisan affiliations are listed. “Composition” refers to the percentage of an early voting electorate (2008 or 2012) that a given group constituted. “Participation” refers to the percentage of a group that voted early, normalized by the number of registered voters in the group. NPA = no party affiliation.
Another perspective on the interaction of race/ethnicity and early voting can be found in the two “Participation” columns of Table 2. For a given racial/ethnic group, these columns report the percentages of the said group that used early voting in 2008 and 2012. For example, the Black early voting participation rate in 2008 was nearly 37 % this means that more than one-third of Black registered voters in Florida voted early in 2008.
Moreover, and key to understanding the change in early voting participation between 2008 and 2012, both the Black and Hispanic early voting participation rates fell dramatically between these two years. In particular, the Black early voting participation rate dropped more than four percentage points and the Hispanic rate, almost four and a half percentage points. In contrast, the White early voting participation rate dropped less than one percentage point between 2008 and 2012. These differences are all statistically significant at conventional confidence levels; and, the Black versus White and Hispanic versus White differences are also significant. Statistical significance here is hardly surprising given the large numbers of early voters who participated in the 2008 and 2012 General Elections. More important than statistical significance is the fact that a four percentage point drop is clearly substantively large: tens of thousands of fewer Blacks and Hispanics voted early in 2012 compared with 2008, despite the increase in the number of registered minority voters in 2012.
Our conclusions about Black and Hispanic drops in early voting would not necessarily be that meaningful if the electorate in 2012 were significantly different than that in 2008. For example, if Blacks voted overall less frequently in 2012 than they did in 2008, the drop in early voting that we have highlighted above could be understood as simply reflecting a drop in Black electoral participation. To that end, consider Table 3. This table reports the composition of the 2008 and 2012 overall voting electorates. In particular, we say that a voter was in a given electorate if he or she cast a valid ballot in the associated election, or tried to do so, but ended up casting a rejected ballot.
Characteristics of the Florida Electorate, 2008 and 2012 General Elections.
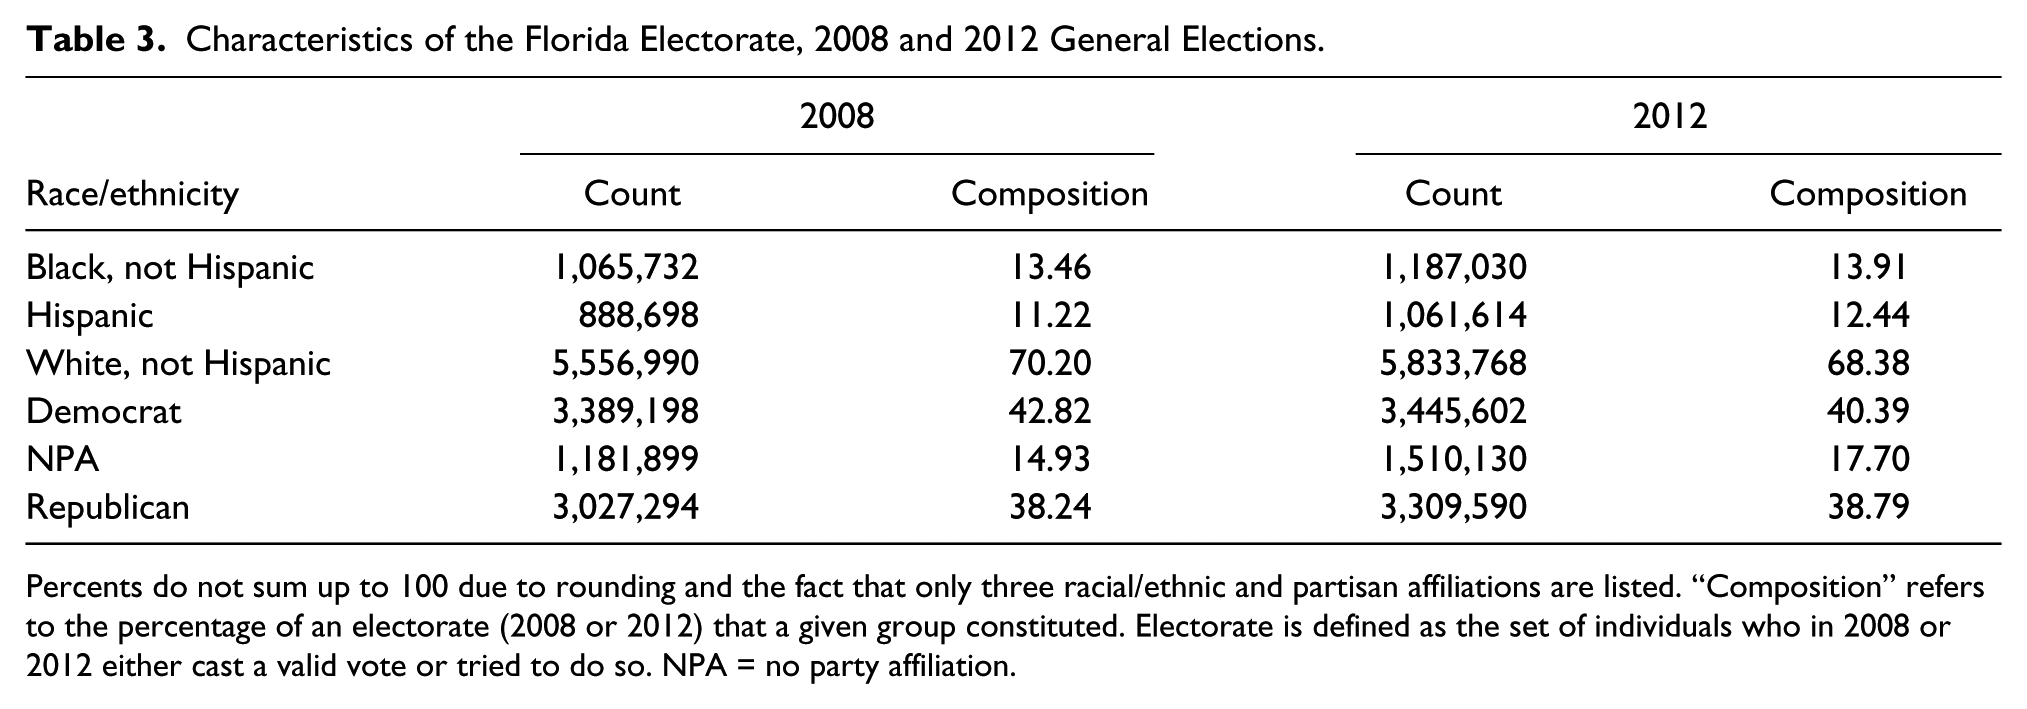
Percents do not sum up to 100 due to rounding and the fact that only three racial/ethnic and partisan affiliations are listed. “Composition” refers to the percentage of an electorate (2008 or 2012) that a given group constituted. Electorate is defined as the set of individuals who in 2008 or 2012 either cast a valid vote or tried to do so. NPA = no party affiliation.
Simply put, Table 3 implies that the Florida electorates in 2008 and 2012 were very similar. It is not the case, say, that Blacks and Hispanics dropped out of Florida electorate between 2008 and 2012. With respect to registered Democrats, the early voting composition of this party affiliation dropped almost six percentage points between 2008 and 2012 (see Table 2). While the number of registered Democrats who voted in 2012 was also down, the early voting Democratic drop was more than twice as large as the approximate 2.43 percentage point 2012–2008 drop in the Democratic composition of the overall Florida voting electorate. Thus Table 3 assures us that the early voting changes between 2008 and 2012 that we have documented cannot be explained entirely by changes in the composition of the Florida electorate.
Do the drops we have documented in Black and Hispanic early voting reflect changes across Florida or might they reflect anomalous racial/ethnic early voting rates in a small set of counties in the state? There are, after all, 67 counties in Florida, and these counties range in size from Miami-Dade, with its nearly 1.4 million registered voters as of the 2012 General Election, to Liberty County, which at that time had fewer than 5,000 registrants. To ensure that Table 2’s results on lower minority early voting turnout in 2012 versus 2008 do not reflect the dominance of any single county in Florida, we disaggregate our racial/ethnic early voting participation data.
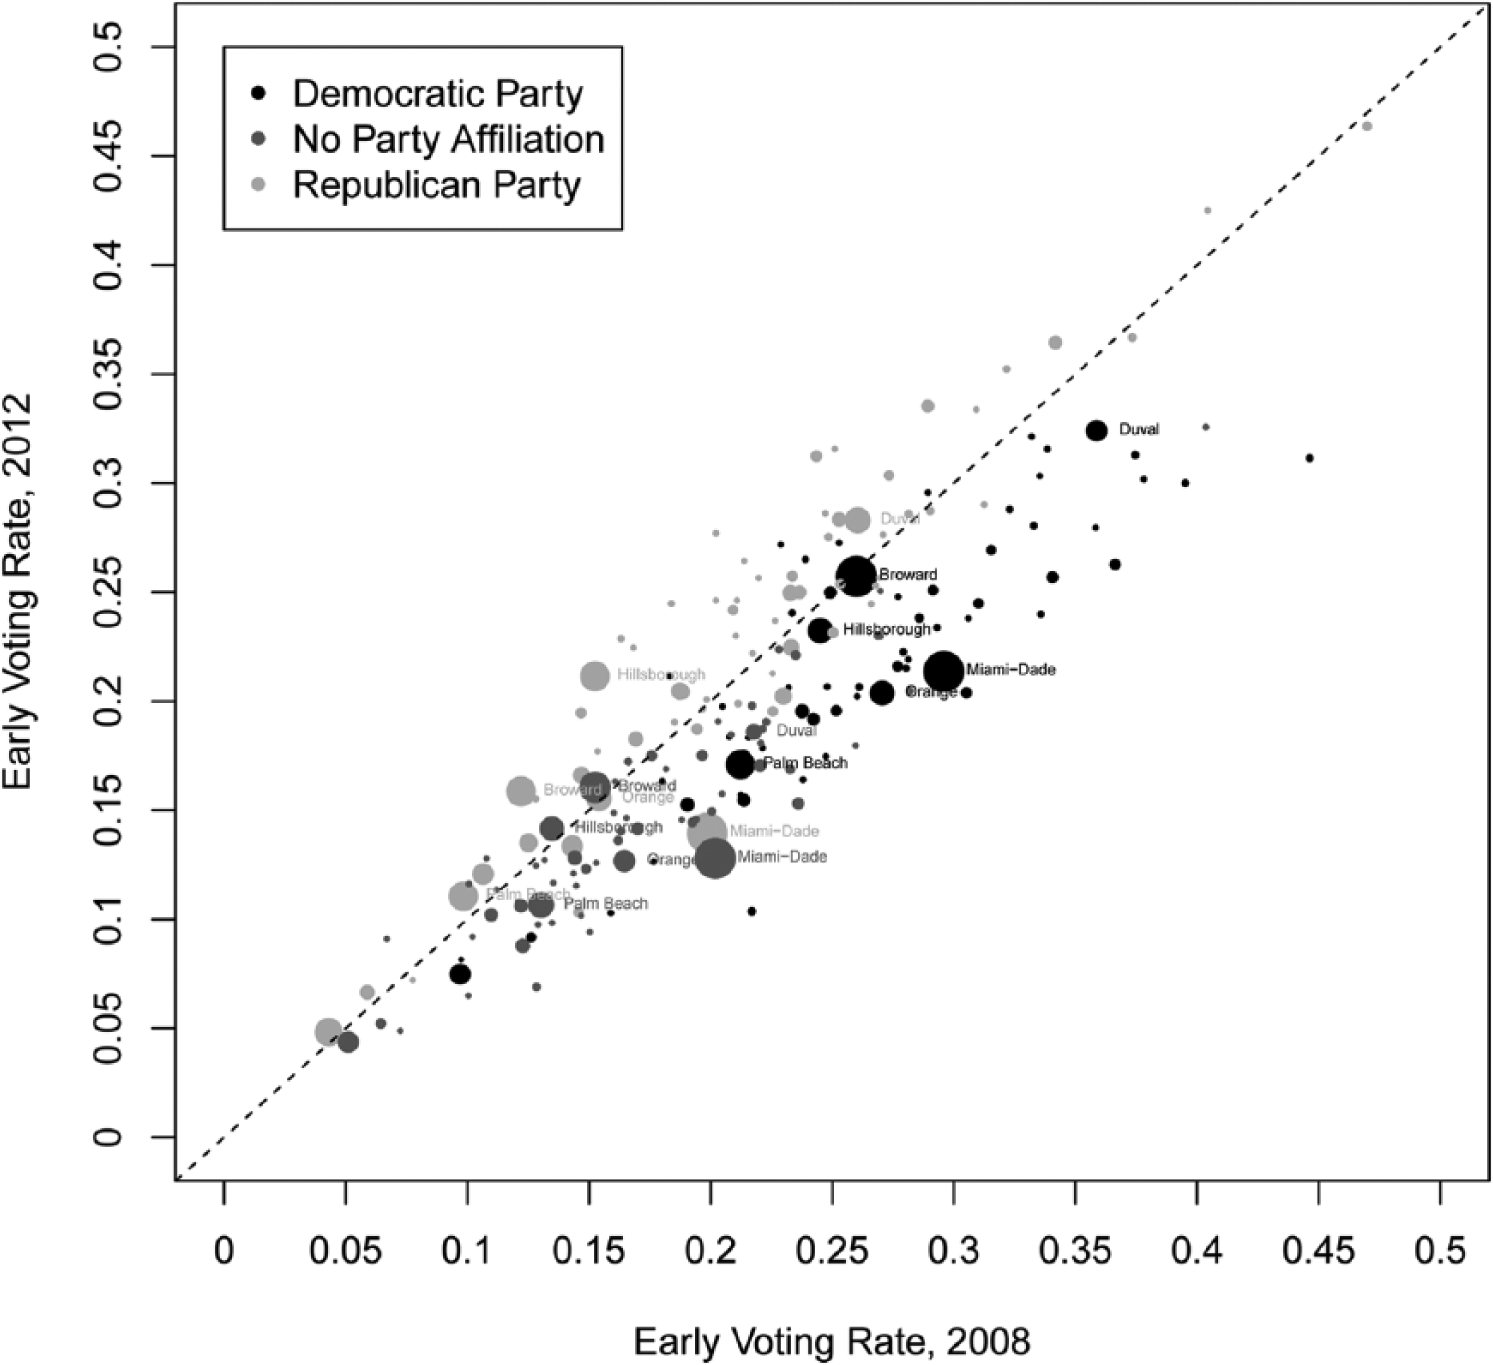
For each racial/ethnic group in each Florida county (e.g., Blacks in Broward County), we define the 2008 early voting turnout rate as the fraction of registered voters from that group who voted early in the 2008 General Election. This yields 67 × 3 = 201 racial/ethnic turnout rates, namely, three rates per county. We similarly compute early voting turnout rates for the 2012 General Election. At the end of this exercise, we have a pair of early voting turnout rates (2008 and 2012) for each racial/ethnic group in each Florida county, and Figure 1 plots these rates against each other. There are three dots per Florida county, and dot colors are black (denoting Black early voting rates), dark gray (Hispanic), and light gray (White). Figure 1 also contains a dashed 45° line. If a point falls on this line, then the county and racial/ethnic group associated with it had identical early voting turnout rates in 2008 and in 2012. Last, dot size is proportional to the number of registered voters in a county as of the 2012 General Election.
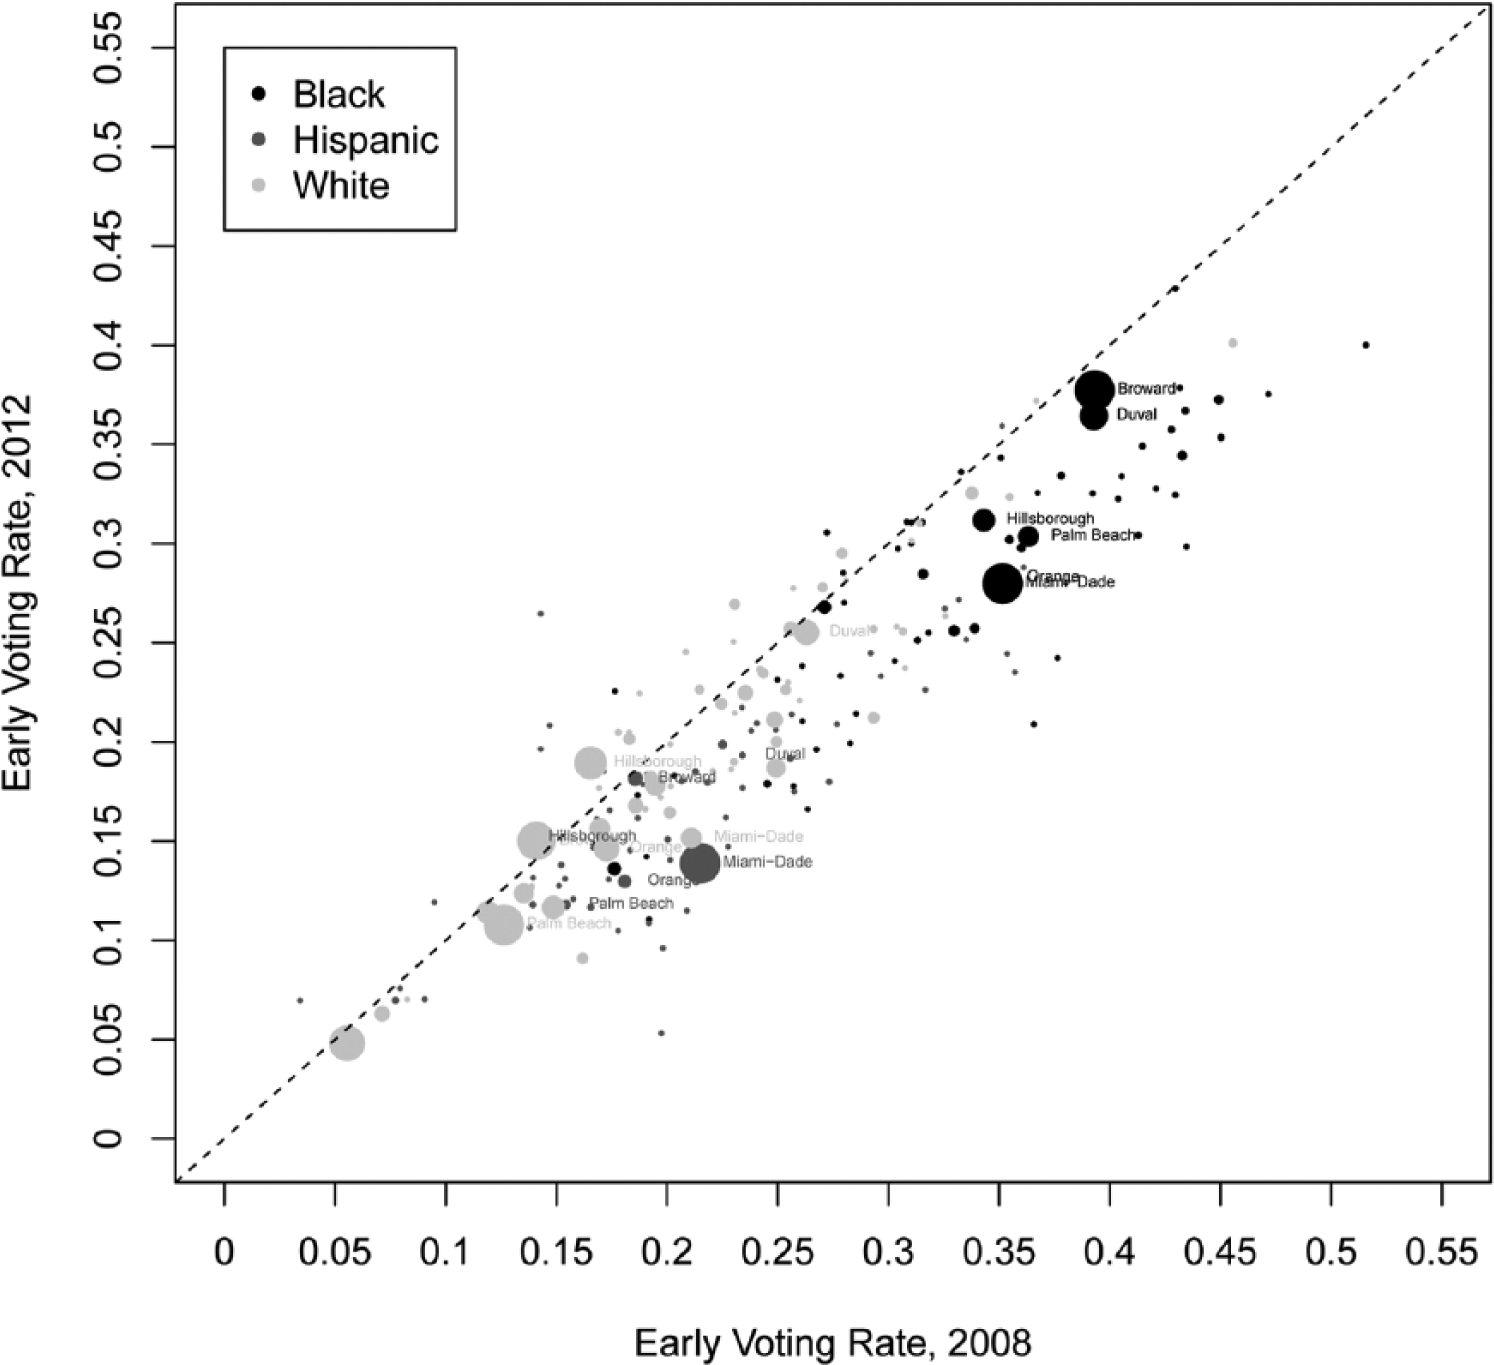
Early voter racial/ethnic affiliation, 2008 versus 2012.
Several patterns are evident in Figure 1. First, across almost every county in Florida, Black voters were disproportionately heavy users of early voting in both 2008 and 2012; note the heavy concentration of black dots in the upper right side of the figure. Second, all of the medium- and large-sized black dots in the figure are below the pictured 45° line; in these counties, Black early voting rates declined between 2008 and 2012. Third, one sees similar 2008 to 2012 declines in Hispanic early voting rates, the most obvious exemplar being Miami-Dade County (labeled in the figure). Fourth, White early voting rates were mixed with respect to changes between 2008 and 2012; indeed, Figure 1 shows that 2012 White early voting rates in Hillsborough and Broward Counties were actually greater than corresponding 2008 rates. Overall, Figure 1 confirms that our earlier result about lower minority early voting turnout in 2012 compared with 2008 is consistent across almost all counties in Florida.
Turning now to party affiliation, we first discuss Florida-wide figures in Table 2 and then disaggregate our party affiliation results by county. With respect to the former, Table 2’s figures reflect the strong association—in Florida at least—of party affiliation and early voting. For example, Florida Democrats are disproportionately heavy users of early voting; although they made up only around 40 percent of the Florida registered voter pool in 2008 and 2012, they constituted over 50 percent of early voters in the former and almost 46 percent in the latter election. Republicans were underrepresented among early voters in 2008 but well-represented in 2012.
The most important party-related features of Table 2 pertain to changes between 2008 and 2012. To be precise, the Democratic share of the early voting pool dropped from 2008 to 2012 (from approximately 52% to 46%), and this drop was made up for by both NPA and Republican early voters. In particular, the Democratic early voting turnout rate was lower in 2012 than in 2008 (four percentage points lower) and the Republican rate was greater in the more recent election (approximately 1.5 percentage points higher).
Turning now to disaggregated results, for each county and each party affiliation we calculate a 2008 early voting rate (2008 early voters divided by registered voters), and we do the same for 2012. We then plot 2008 and 2012 early voting rates against each other, and results are shown in Figure 2. As in the earlier race/ethnicity plot, this figure contains a dashed 45° line that describes how 2008 early voting rates related to 2012 rates. A dot that falls on the line denotes a county-partisan affiliation group that had equal early voting turnout rates in 2008 and 2012; a dot that falls above the 45° line is indicative of a county group that had a greater early voter turnout rate in 2012 compared with 2008, and vice versa for a dot that falls below the line.
Early voter party affiliation, 2008 versus 2012.
Among large or even medium-sized Democratic dots (black) in Figure 2, all fall below the pictured 45° line. Thus, in all but the smallest counties in Florida, Democratic early voting turnout was down in 2012. In contrast, many Republican (light gray) dots lie above this line; the latter connote counties in which Republican early voting turnout was greater in 2012 than in 2008. Broward County’s Democratic early voting rate is very close to the 45° line in Figure 2 but lies below it nonetheless.
Among NPA registered voters, comparisons of 2008 and 2012 early voting rates are more mixed. Some dark gray dots in Figure 2 are aligned with the 45° line although most fall below it. This ambiguous result is intuitive if one thinks that NPA registrants are combinations of Democrats and Republicans, perhaps individuals with weak partisan allegiances. Regardless of this interpretation, the larger dark gray dots in Figure 2 tend to be below the 45° line with two prominent exceptions, Broward and Hillsborough. One can also see from the locations of the NPA (dark gray) dots in Figure 2 that partisan voters (registered Democrats and Republicans) tended in both 2008 and 2012 to use early voting more than those registered without party affiliation.
Figure 2 is notable because it highlights 2008 to 2012 changes in early voting turnout rates across different voter partisanship groups. One could in principle argue that Florida’s shortened early voting period in 2012 was nonproblematic because it affected early voting across the entire state and that all voters—Democrats, Republicans, and NPAs—were thus treated uniformly by the mid-2011 reduction in Florida’s early voting period. Nonetheless, the distribution of points in Figure 2 is consistent with the idea that the reduction in early voting caused by the passage of House Bill 1355 had a disproportionately greater effect on registered Democrats in Florida than on Republicans.
Temporal Dynamics of Early Voting in 2008 and 2012
The official 2012 early voting period lasted eight days, and voter counts by day appear in Table 4. 11 This table illustrates several notable aspects of Florida early voting in 2012. First, notwithstanding an unintended, supplemental day of early voting—some Miami-Dade and Palm Beach County early voters who arrived to cast their ballots on Saturday, November 3, faced such long lines that they did not actually vote until Sunday, November 4—all early voting days in 2012 were heavily used. The day with the least number of voters was the second day of early voting, Sunday, October 28, and even on that day over 230,000 Floridians—around 9.6 percent of all early voters—cast early ballots. 12 In contrast, in 2008, when there were fourteen days of early voting in Florida, there were fewer than 54,000 early voters on Sunday, October 26, the least used day of early voting.
Daily Counts and Participation Rates in 2012 Early In-Person Voting.
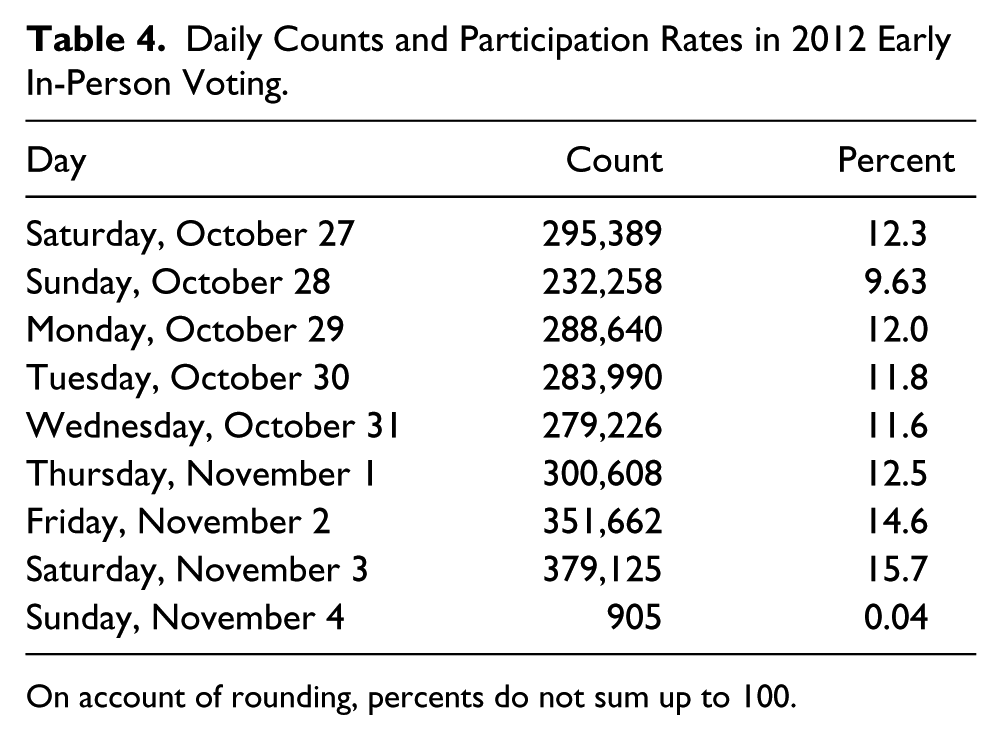
On account of rounding, percents do not sum up to 100.
Second, the most heavily used early voting day in 2012 was the last official day of early voting, Saturday, November 3, on which nearly 380,000 Floridians cast ballots. Over 15 percent of all 2012 early voters voted on that final Saturday, a day associated with prominent reports of extensive lines (Duret 2012; Mazzei, Mcgrory, and Bustos 2012). While the official Florida early voting files do not state the exact time that each early voter cast his or her ballot, media reports are very much consistent with the surge in early voting on this day (Mazzei, Mcgrory, and Bustos 2012; Miller 2012). In contrast, during the 2008 early voting period, fewer than 300,000, or approximately 11 percent of early votes were cast on the most popular early voting day (Herron and Smith 2012, 342). While this number is large, Table 4 shows that there were three early voting days in 2012 with more than 300,000 early voters; one of those days, Saturday, November 3, approached 400,000 early voters.
In summary, what one observes in Table 4 is heavy use throughout the early voting period combined with a last day surge. We now delve deeper into the matter of whether this surge was anomalous and in so doing compare its magnitude with last day early voting in 2008.
Last Day Surge in Early Voting: Typical or New in 2012?
Was the late surge in early voting unusual in 2012, or is it typical for General Election early voters in Florida to rush to the polls on the last possible early voting day? While we do not have a large set of elections with which to answer this question, we can nonetheless ascertain whether a last day surge occurred in 2008 when the early voting period in Florida was longer, namely, fourteen days versus eight as in 2012.
We thus proceed as follows. First, we note that ten Florida counties in 2008 offered early voting on the last Sunday of that year’s early voting period. These counties—quite diverse in terms of population and registered voters—were Bradford, Broward, Dixie, Duval, Jackson, Miami-Dade, Palm Beach, Pinellas, Sarasota, and Seminole. 13 This list does not include all 67 counties in Florida because counties in the state in 2008 had more flexibility in determining their early voting hours than they had in 2012. Second, for these ten counties, we calculate the number of 2008 early voters who cast votes on each day of early voting and we do the same thing for 2012. Figure 3 compares early voting counts by day only in our ten comparable counties with an eye toward determining whether there was an early voting surge in 2008 akin to what we observed in 2012. Were we to compare all counties in Figure 3, including those that did not have last day early voting in 2008, we would bias our results in favor of not finding a last day surge in 2012.
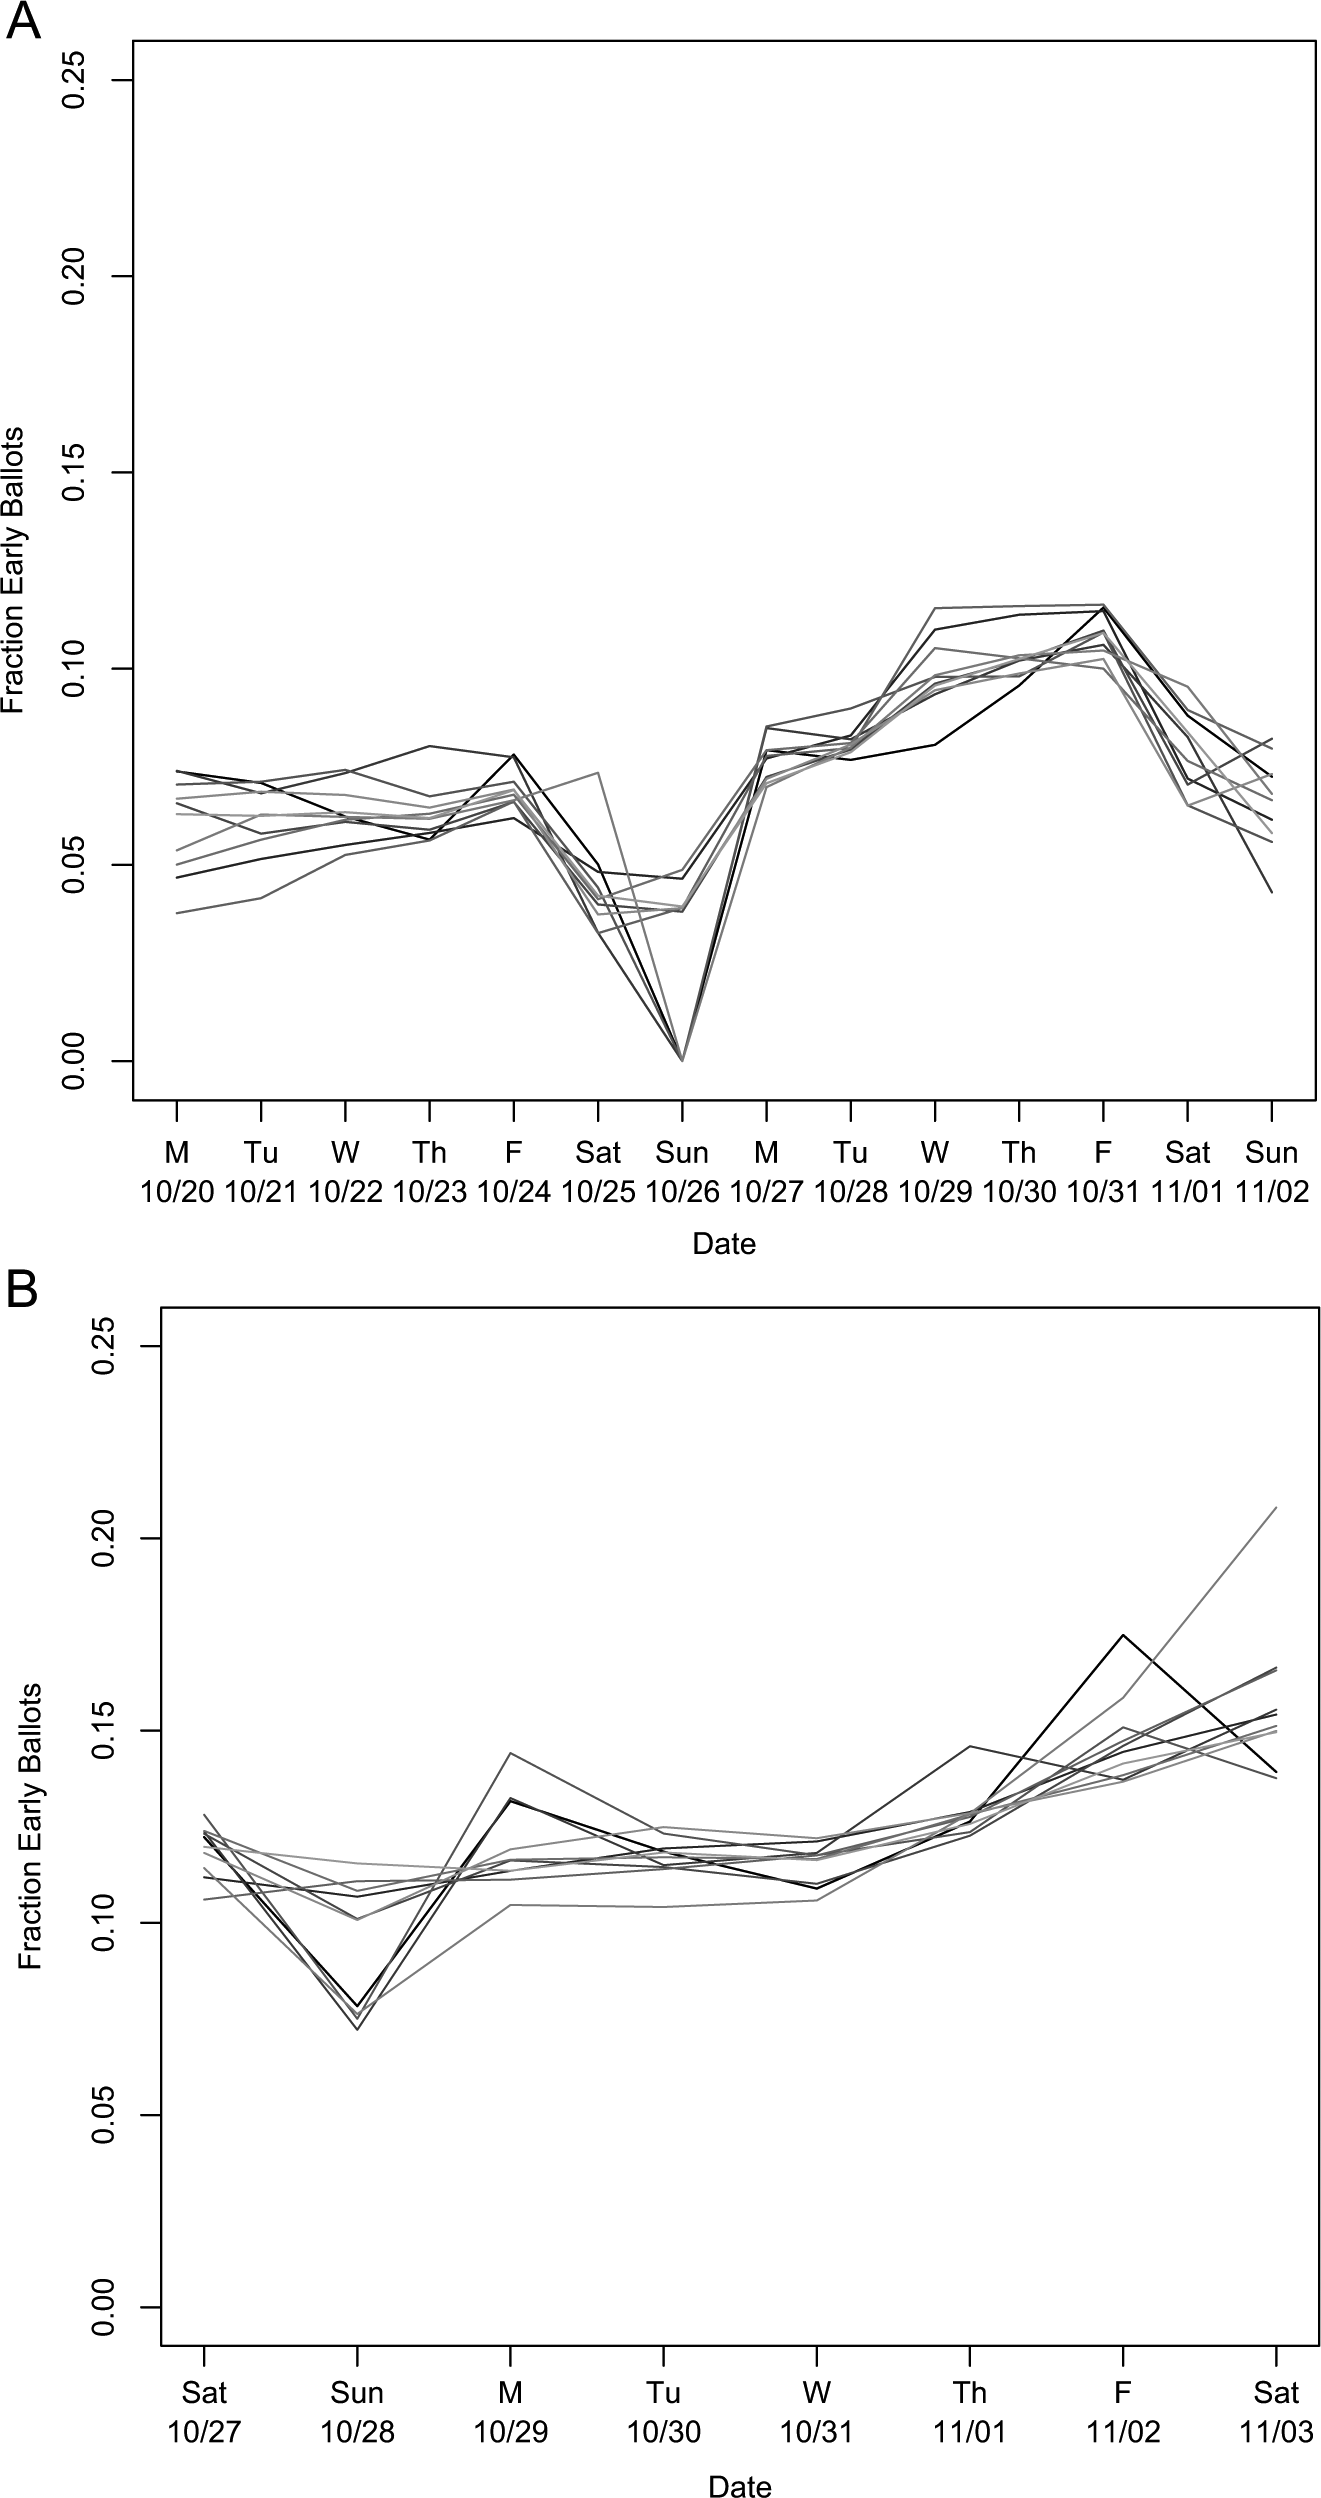
Daily early voting participation rates in ten Florida counties: (A) 2008 and (B) 2012.
Figure 3 has two panels, one for 2008 and one for 2012, and each panel contains a plot with ten lines. Each line represents one of the ten Florida counties named above, and county shades of gray are common across the two panels. The vertical axes in the two panels of Figure 3 indicate the fractions of early voters who voted on a particular day, and days are listed on the panels’ horizontal axes. Although the two vertical axes in Figure 3 are identical, the two horizontal axes in Figure 3 differ; this reflects the fact that the early voting periods in 2008 and 2012 had different lengths.
It is evident from Figure 3A that there was substantial temporal variability in early voting turnout across the fourteen days of the 2008 General Election early voting period. In particular, the gray lines in the figure show that around 5 to 7 percent of early voters voted on the first five days of the 2008 early voting period; then there was a weekend drop on the first Saturday of early voting and a complete Sunday drop in the counties that did not allow voting on the first Sunday of early voting; following the middle weekend, turnout increased, and finally, early voting numbers tailed down sharply during the final weekend of early voting. These patterns stand in contrast to the lack of evidence of a final weekend (Saturday) drop in early voting in 2012. Although a few of the pictured counties in Figure 3B had more voters on Friday, November 2, than on Saturday, November 3, most counties in the plot served a greater number of voters on the last day of early voting. Figure 3B thus provides visual evidence of the last day surge in early voting in 2012.
Was this surge directly caused by the shorter early voting period compared with 2008? While the two panels of Figure 3 cannot by themselves prove that the reduction in Florida’s early voting period prior to the 2012 General Election was itself responsible for the crush of voters late in the 2012 early voting period, the temporal patterns in the panels are nonetheless consistent with the idea that, in 2012, demand for early voting was extensive and many thousands of voters were forced to allocate themselves into relatively few early voting days. We know that total early voting counts in 2008 were greater than in 2012—see Table 2—and yet we still observe a large surge in last day early voting in 2012. Some backers of Florida’s House Bill 1355 argued that the shorter early voting period in 2012 was designed to make early voting more difficult, and Figure 3 suggests that this objective was achieved.
Temporal Trends in Early Voting and Race/Ethnicity
We have already noted that an election’s official early voting files—there are 67 of them, one per county—contain unique voter identification numbers and dates of early vote for every individual who voted early in the said election. Thus to ascertain the racial breakdown of the Florida early voting electorate in these two years, we merge our early voting files with the statewide voter file using voter identification numbers to link them.
When we carry out this merge for the 2012 General Election, we find matches for all but 1,879 early voters. Insofar as there were approximately 2.4 million early voters in Florida in 2012, this yields a coverage rate of approximately 99.92 percent. Thus when we write about race/ethnicity as they pertain to early voting in 2012, we use the 99.92 percent sample as opposed to the full set of early voters from this general election. However, when we write of trends that involve neither race/ethnicity, we use all early voters in our analysis minus a single voter whose date of early vote in the early voting files is clearly erroneous. 11 With respect to early voting in the 2008 General Election, the race/ethnicity coverage rate is 99.97 percent.
Our coverage of racial/ethnic patterns in early voting focuses on the three groups, Black, Hispanic, and White, that together constitute most of Florida’s registered voter pool. Recall that Table 2 previously made it clear that Florida’s early voting electorates in 2008 and 2012 were disproportionately Black, and here we build on this result by exploring early voting trends in race/ethnicity as they vary by day. In particular, Figure 4 describes daily trends in racial/ethnic early voting composition in 2008 and 2012. A group’s early voting composition on any given day must lie between 0 and 1, where 0 denotes that the group had no early voters on the said day and 1 denotes that all early voters were from that group. Judging by the relative placements of gray and black dots in both panels of Figure 4, it is evident that, on all regular early voting days in 2008 and in 2012, White voters cast the most early votes, followed by Blacks, and then Hispanics.
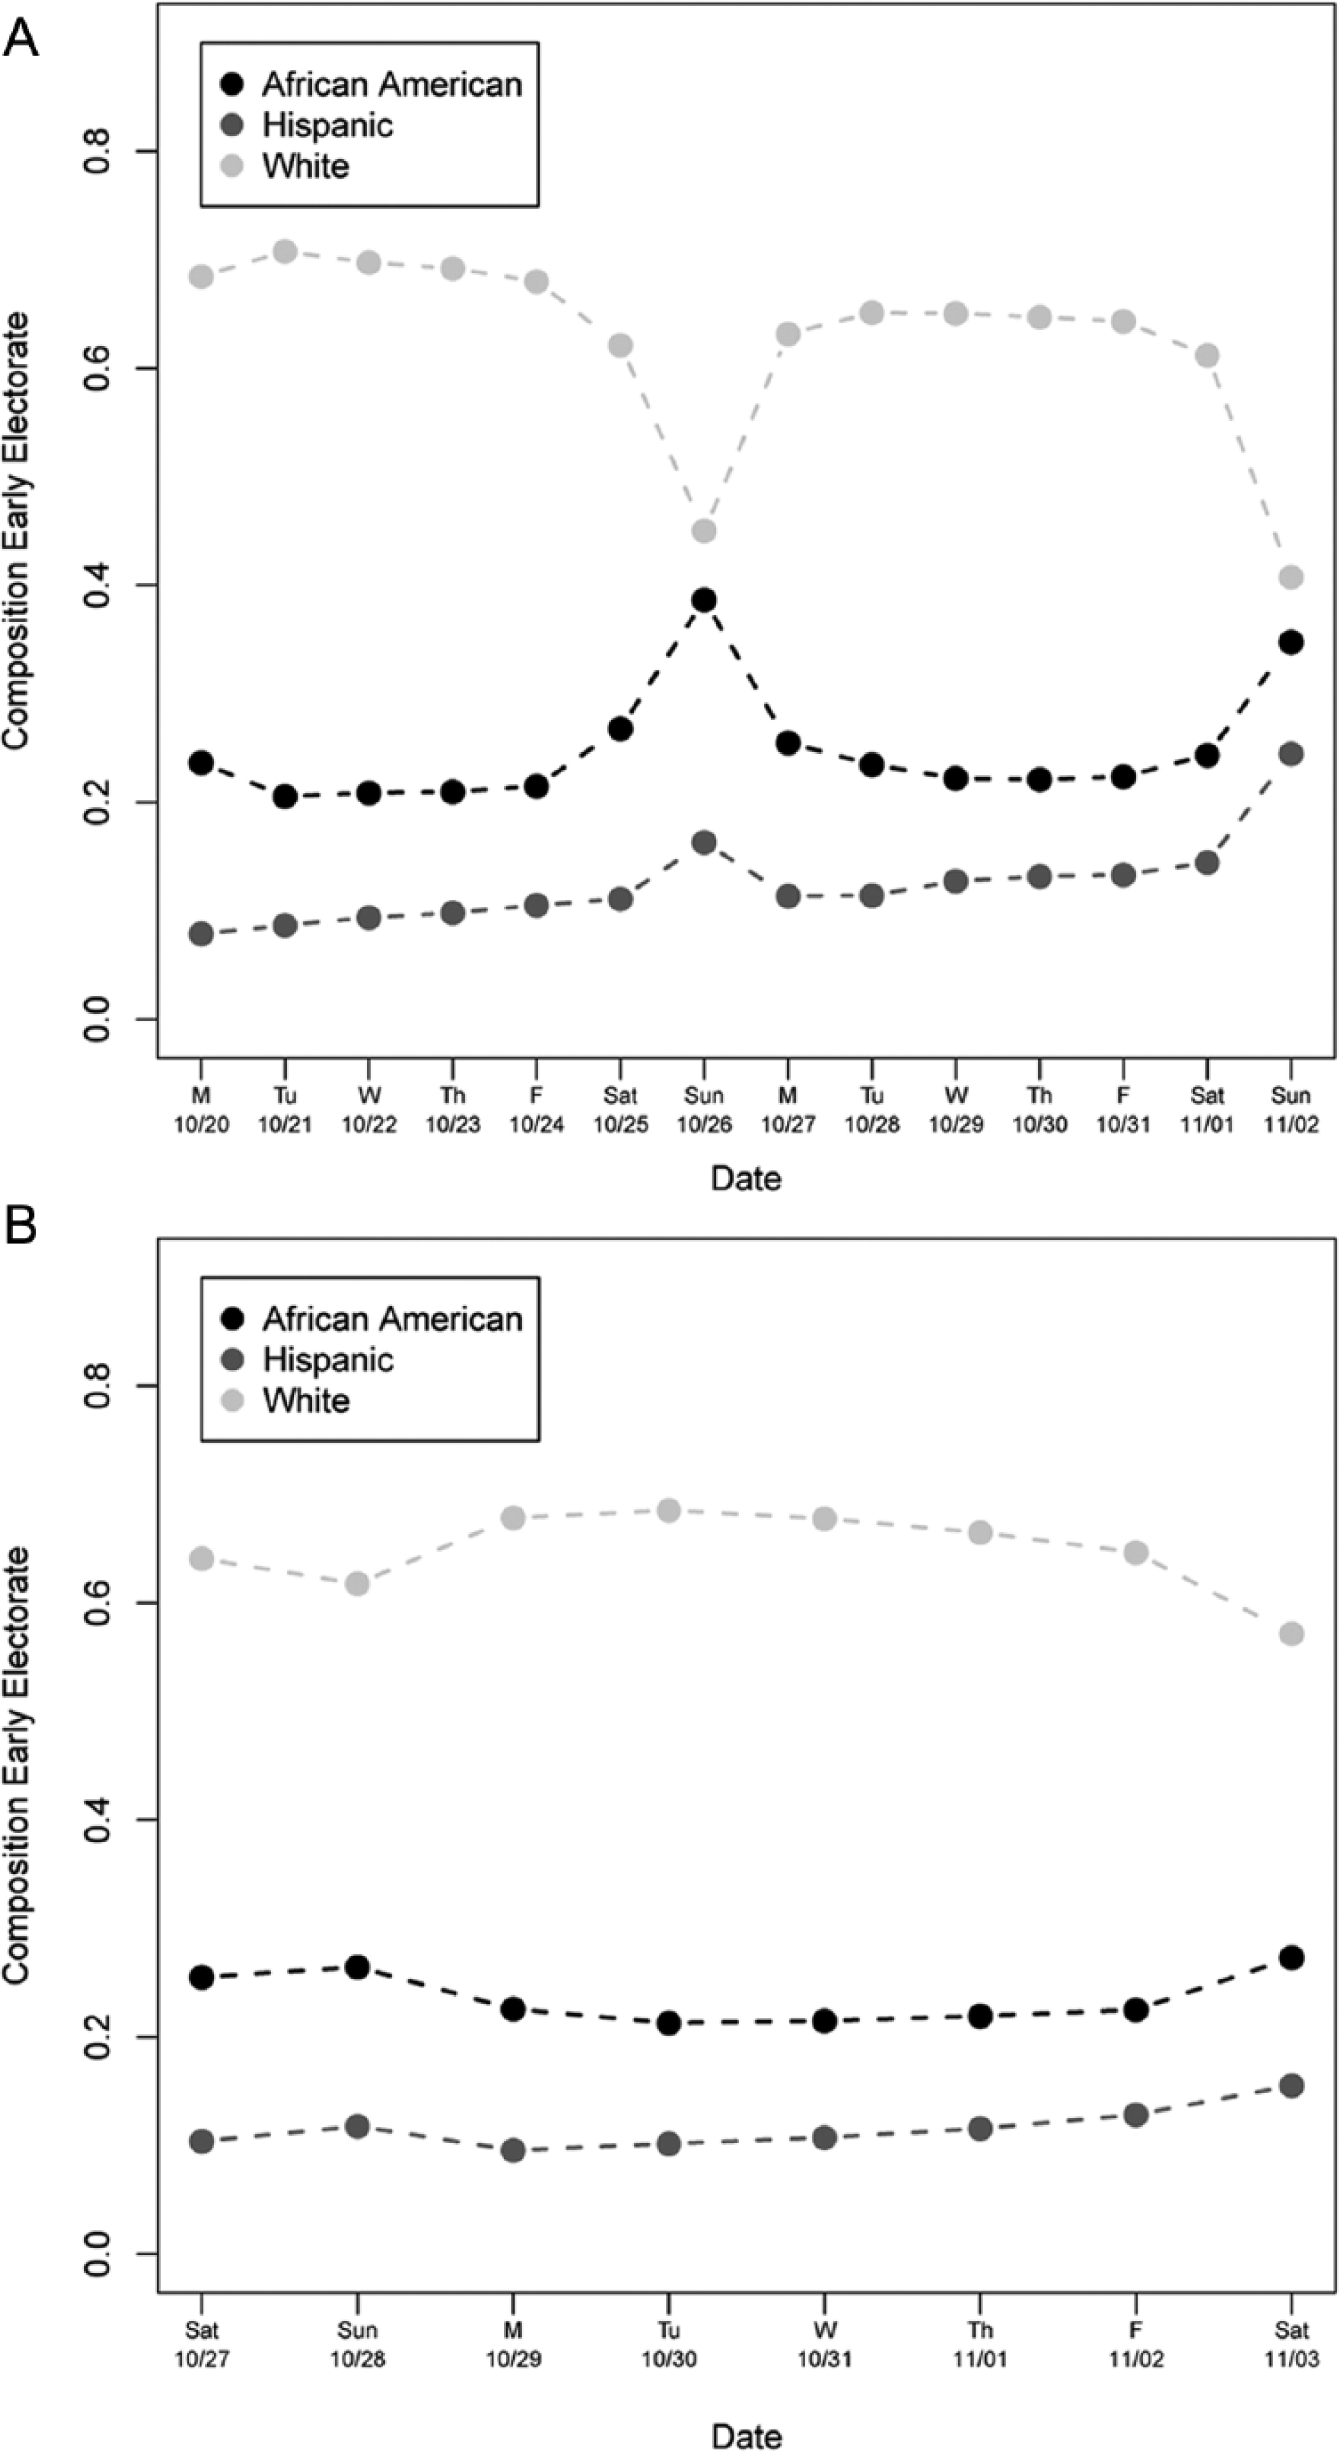
Early voting by race and day, (A) 2008 and (B) 2012 general elections.
Recall from Table 1 that Blacks and Hispanics each constituted approximately 14 percent of the Florida registered voter pools in 2008 and 2012. Despite this, we see in Figure 4 that in both 2008 and 2012, Blacks made up over approximately 20 percent of the early voter electorate on each day of early voting. In contrast, Hispanics were sometimes overrepresented among early voters and sometimes underrepresented. Comparing Figures 4A and 4B is complicated by the fact that early voters in 2008 had more choices over which day to cast their ballots. Nonetheless, we see in both these figures that Blacks and Hispanics voted disproportionately often on weekends. The weekend racial/ethnic gap was greater in 2008 than in 2012, however. Moreover, the dramatic drop-off in White early voting that we see on the last day of the 2008 early voting period did not occur on the last day of the 2012 early voting period.
Both panels in Figure 4 illustrate the point that minority voters, in particular Black voters, vote early disproportionately often. Why do minorities behave in this way? In 2008, many observers speculated that churches frequented by Black voters engaged in a “Souls to the Polls” movement on the last Sunday of early voting that year (Herron and Smith 2012). This explanation is not as compelling in 2012, however, as the last official day of early voting was a Saturday.
The excessive lines reported to have affected early voting locations on Saturday, November 3, 2012, would by necessity have affected minority voters disproportionately more than White voters. As discussed earlier, some observers speculated that the rationale for the Florida state legislature’s decreasing early voting reflected a targeting strategy aimed at minority voters. Insofar as Black and Hispanic voters in Florida have tended disproportionately to prefer voting early on weekends, any lengthy delays at the polls that occurred on a Saturday or Sunday due to inadequate or inefficient staffing likely would have had a disproportionate impact on minorities, possibly even to the point that a prospective voter might leave or turn away from a wending queue (e.g., Stewart 2013). In essence, compressing early voting into just eight days created a ceiling effect, limiting the sheer number of voters that could be processed, especially in counties with heavy concentrations of minority voters (Herron and Smith 2013a).
Temporal Trends in Party Affiliation and Early Voting
We turn now to the matter of partisanship and consider whether there are temporal trends in early voting participation for registered Democrats, Republicans, and those Floridians without party affiliation (NPAs). In particular, Figure 5 plots daily partisan compositions of the early voting electorates in 2008 and 2012 (parties are listed alphabetically), and the implications of its two panels are relatively straightforward.
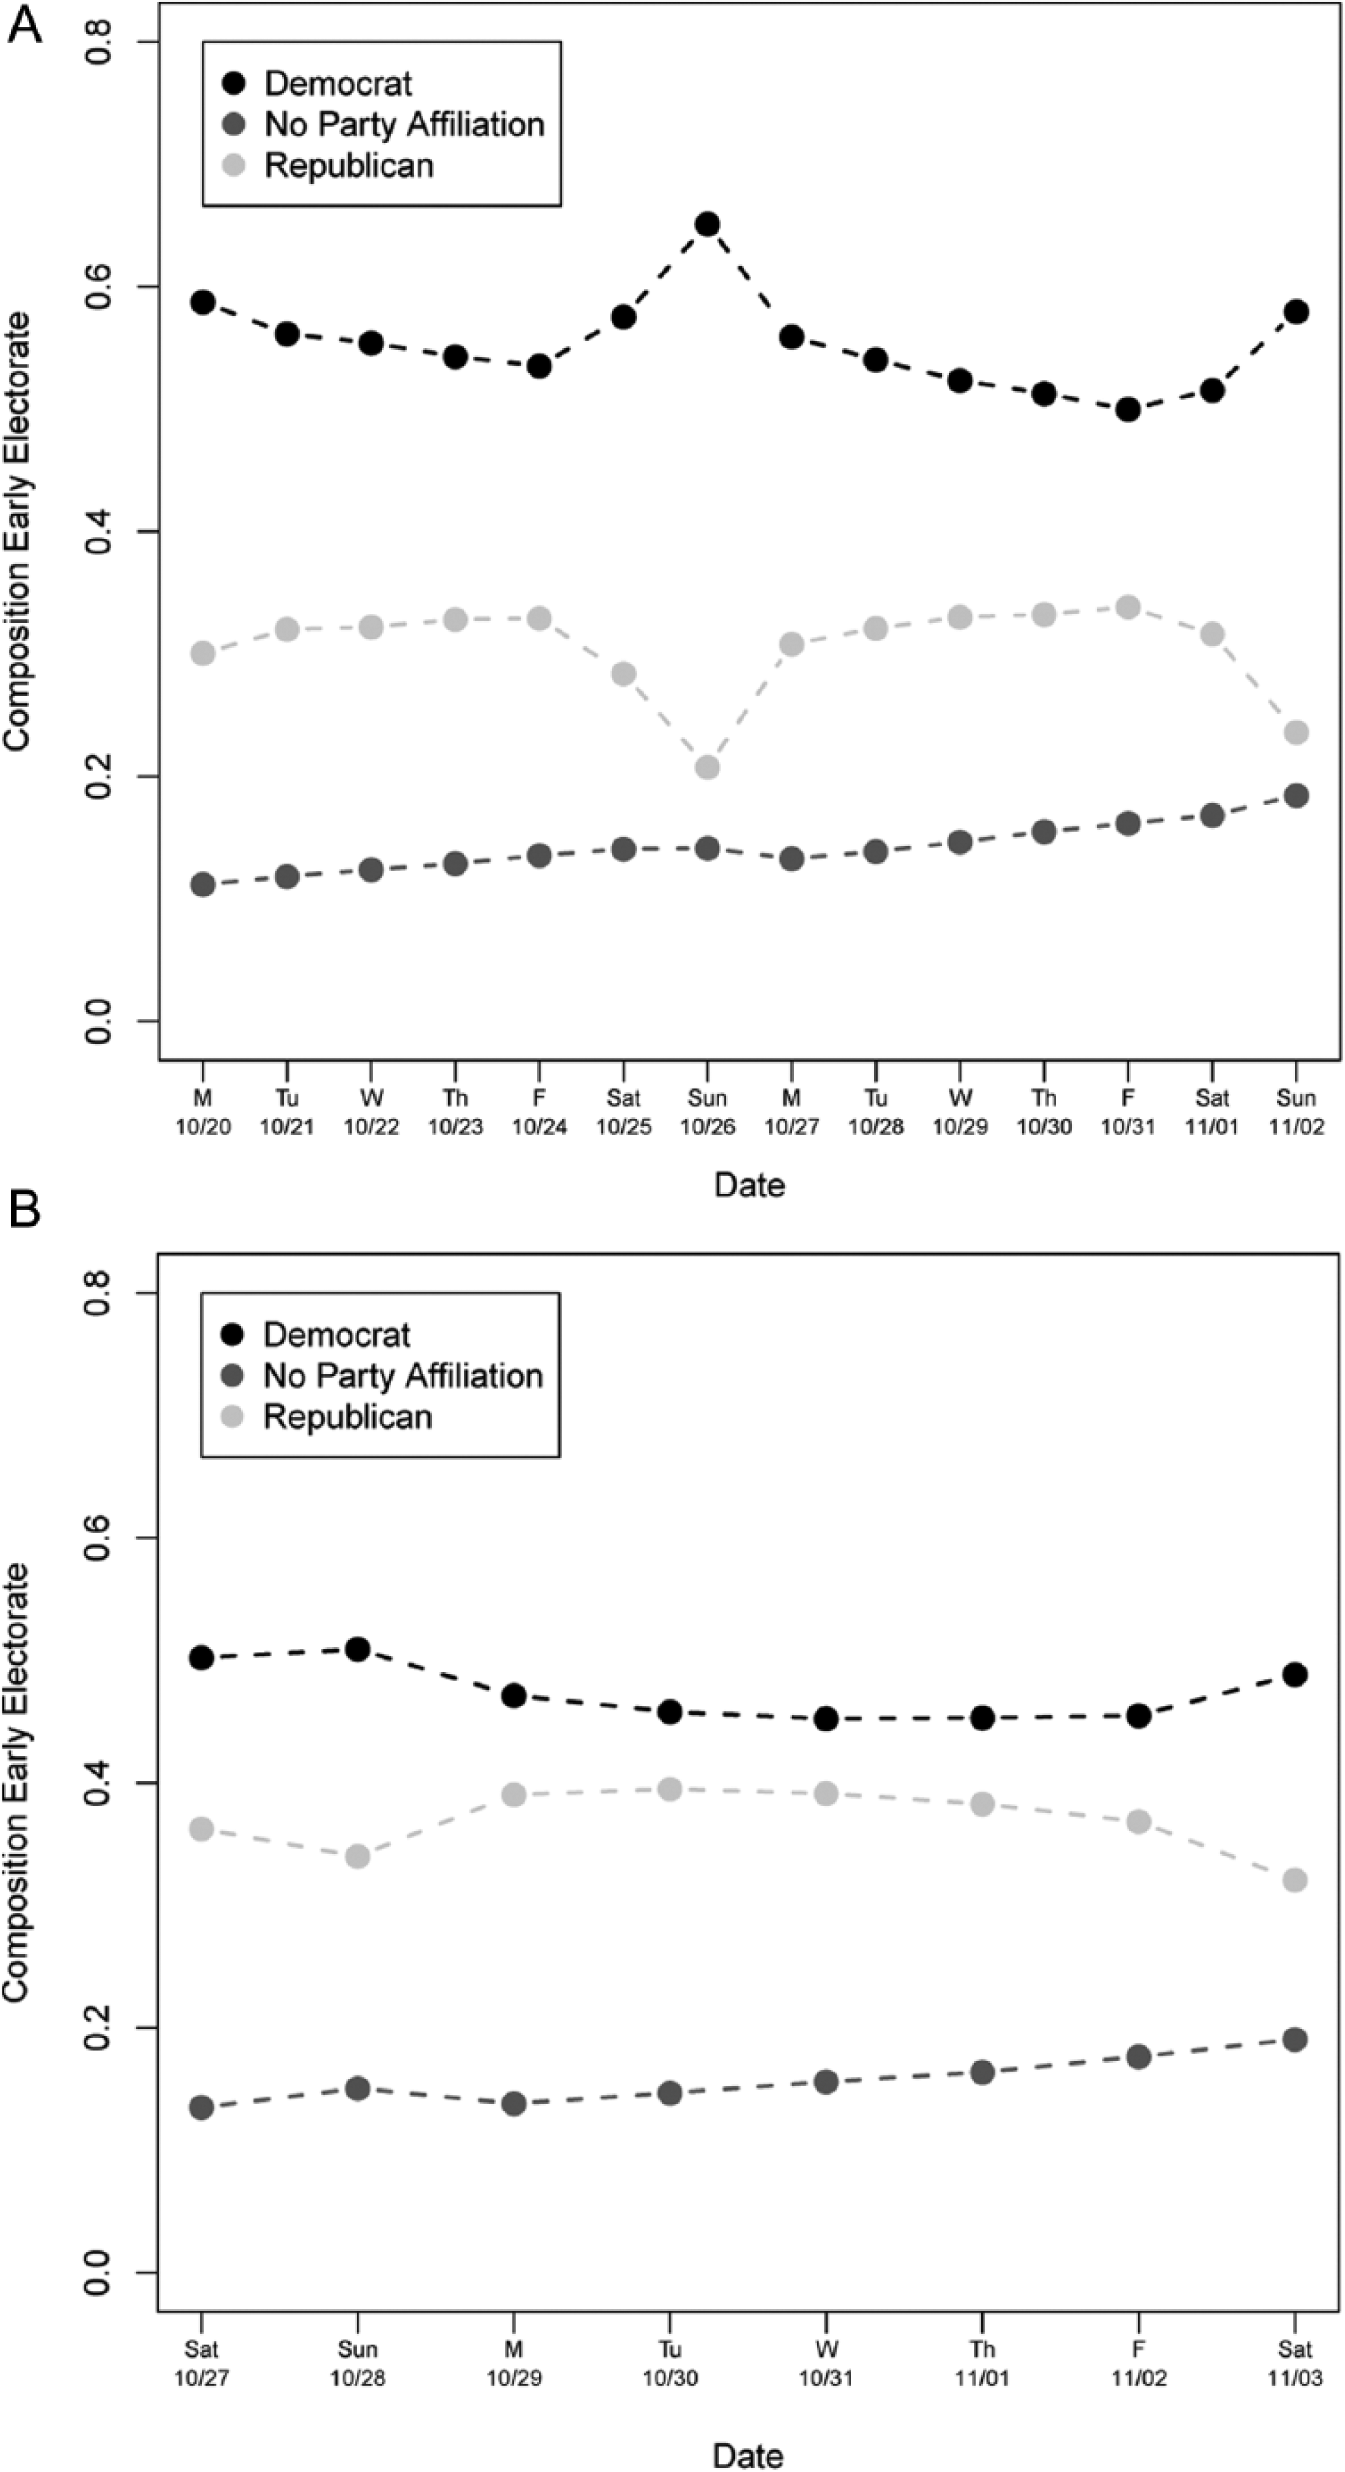
Early voter partisanship by day, (A) 2008 and (B) 2012 general elections.
First, we see that registered Democrats in both 2008 and 2012 used early voting more frequently than Republicans. Note that the Democratic dots in both panels of Figure 5 are greater than 40 percent, which was approximately the fraction of Democrats in the Florida registered voter pool in 2008 and in 2012. Second, the figure shows that in both these years, the number of early voting Democrats increased on the last day of early voting while the number of Republicans decreased. Recall as discussed earlier that the last day of early voting in 2012 was associated with especially long lines; we know of no comparable reports from 2008. If excessive lines are problematic, then last day early voters in 2012, who tended to be registered Democratic, had disproportionately more problems than in 2008. A similar point can be made about NPA voters in Florida, but these voters did not have the same uptick in last day early voting participation compared with Democrats.
Did 2008 Early Voters Participate in the 2012 General Election?
We now explore the relationship between early voting in 2008 and participation in the 2012 General Election and in particular consider 2012 valid voting rates as they vary by date of early vote in 2008. We engage in such an exercise because it speaks to the possible consequences of truncating Florida’s early voting period and whether this truncation led some 2008 voters note to vote in 2012. We cannot know for certain whether some registered voters who did not vote in 2012 would have voted had the early voting period that year been longer. However, we can study the extent to which 2012 valid voting rates varied by day of early vote in 2008. To the extent that they varied, we argue that Florida’s shortened early voting period had differential effects on voters as characterized by individual levels of political engagement.
With this in mind, we merge 2008 early voting data and our 2012 General Election voter file, and the goal of this amalgamation is to understand whether 2008 early voters voted validly in 2012. We cannot account for 2008 early voters who, say, died between 2008 and 2012 or for some other reason were not in Florida’s registered voter pool as of late 2012; such voters are not listed in our 2012 General Election voter file. Overall our 2008 and 2012 merger has a coverage rate of approximately 94.7 percent (2,502,954 of 2,642,724 early voters, to be precise). The calculations that follow are based on the 94.7 percent sample of 2008 early voters.
A 2008 early voter is said to have cast a valid ballot in 2012 if he or she voted successfully on Election Day in 2012, voted an absentee ballot successfully, or voted early successfully. 14 We aggregate these three valid voting rates because we want the broadest measure of successful voting participation in 2012. Figure 6A breaks down 2012 valid voting rates by race/ethnicity and day of early voting in 2008, and it has two notable patterns. First, regarding levels, we see that Hispanic early voters in 2008 were less likely to cast valid ballots in 2012 compared with Black and White early voters; this regularity holds on every early voting day in 2008 and is evident in the lower levels of dark gray dots in Figure 6A. Black early voters in 2008 were more likely than White early voters in 2008 to vote validly in 2012, and the magnitude of the Black–White gap varies dramatically by early voting day in 2008. Second, Figure 6A contains what look like distinct weekend patterns where these effects vary based on the first weekend of early voting (October 25 and 26) and second weekend of early voting (November 1 and 2). For all three racial/ethnic groups pictured in Figure 6A, first weekend early voters in 2008 had relatively high valid voting rates in 2012, but second weekend early voters in 2008 had relatively low valid voting rates in 2012. Moreover, and again for each racial/ethnic group, final Sunday early voters (November 2) had the lowest valid voting rates in 2012 compared with early voters across all of days of early voting in 2008.
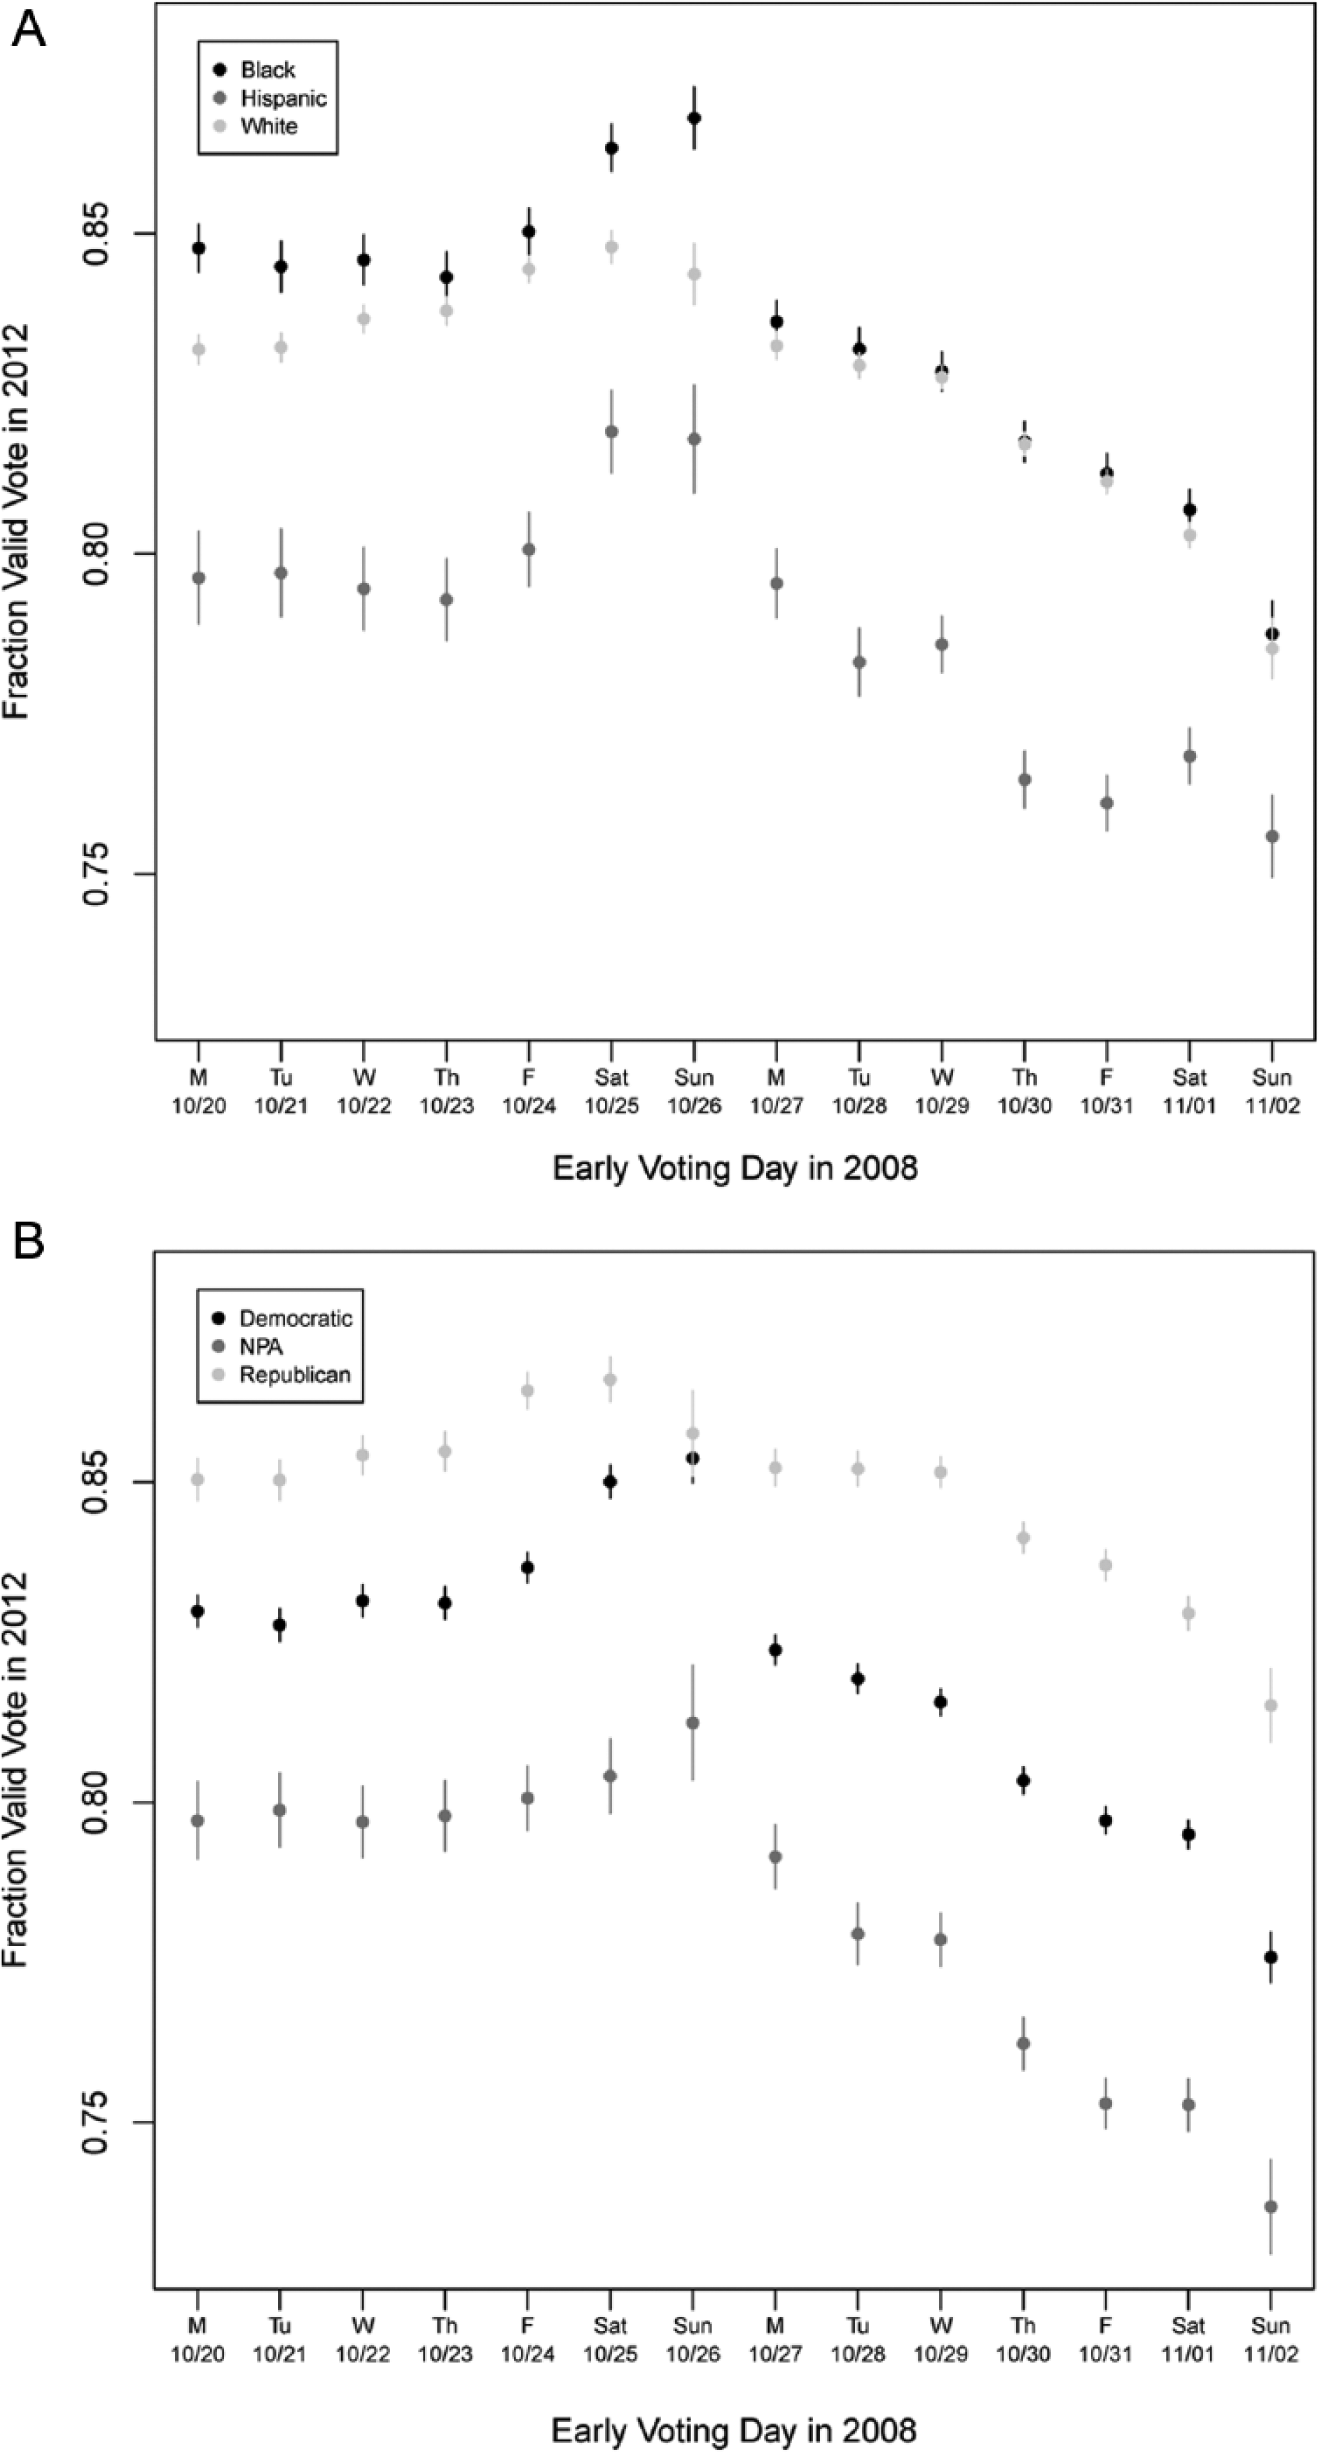
Valid voting in 2012 by race/ethnicity and partisanship of 2008 early vote: (A) race/ethnicity and (B) partisanship.
What might these findings mean? Assuming that valid voting in 2012 reflects political engagement, a natural interpretation of Figure 6A is that first weekend early voters in 2008 were relatively engaged individuals, second weekend early voters were relatively disengaged, and final Sunday early voters in 2008 were the least engaged individuals among all early voters. This interpretation suggests that truncating Florida’s early voting period may have had downstream effects on who voted in the 2012 General Election. That is to say, one could argue based on Figure 6A that the elimination of final Sunday early voting took away an opportunity for political expression from the types of voters who were not extremely engaged in the first place. This perspective suggests that a nontrivial fraction of final Sunday early voters in 2008 voted because they could do precisely this, that is, vote on the last Sunday before Election Day. We cannot know for certain whether the removal of final Sunday early voting literally caused 2008 final Sunday early voters not to vote at all in 2012, but Figure 6A is consistent with such an effect.
Figure 6B disaggregates 2012 valid voting rates based on political party affiliation and day of early voting in 2008, and its key implications are as follows. First, Republican early voters in 2008 participated most heavily in 2012 and, in accordance with the logic sketched above, were thus the most politically engaged partisan group among 2008 early voters. In addition, among 2008 early voting Democrats, valid voting rates in 2012 were between (relatively high) Republican valid voting rates and (relatively low) NPA valid voting rates. The ordering here—Republican greater than Democratic greater NPA—holds for each of the fourteen days of early voting in 2008.
Second, conditional on partisan group, there are clear temporal effects visible in Figure 6B. First Sunday (October 26) Republican early voters did not have relatively high valid voting rates in 2012, but the opposite was obtained for both Democrats and NPA early voters. Thus the levels of political engagement of voters attracted to the first Sunday of early voting in 2008 varied by party. For reasons that are beyond the scope of this article, the first Sunday of early voting in 2008 attracted very engaged Democrats and NPA affiliates and relatively disengaged Republicans. Last, 2008 early voters who cast their ballots on the second Sunday of early voting (November 2) had relatively low 2012 valid voting rates. It appears from Figure 6B that the elimination of the last Sunday of early voting removed a voting option for relatively disengaged individuals. Did this depress this group’s turnout in 2012? We cannot say for certain given the lack of a control group in this study, but Figure 6B is consistent with the idea that the least politically engaged individuals were the most affected by the decision in Florida to truncate early voting.
Discussion
In May, 2011, Florida Governor Rick Scott signed into law House Bill 1355, which among other things reduced in Florida the number of early voting prior to a General Election and eliminated the final Sunday of early voting. Supporters of this bill argued before its passage that the bill was necessary to reduce election fraud, but public revelations after the 2012 General Election imply that the primary intent of reducing Florida’s early voting period was almost certainly to diminish the early voting turnout rates of those inclined to support Democratic candidates.
Before being implemented, Florida’s law truncating early voting took a somewhat circuitous journey through the United States Department of Justice (USDOJ) and the federal court system. As five of Florida’s counties (Collier, Hardee, Hendry, Hillsborough, and Monroe) were prior to the Supreme Court’s decision in Shelby County v. Holder subject to Section 5 preclearance provisions of the Voting Rights Act (VRA), when Governor Scott signed House Bill 1355 into law it did not immediately apply statewide. The State of Florida at the time carried the burden of having to prove to the USDOJ that any changes to its voting laws would not have a retrogressive effect on minority voting rights. In an effort to expedite the said approval process, the State preemptively sought the permission of a federal district court and in so doing, then Florida Secretary of State Kurt Browning argued that
The purpose of [requesting federal court approval for House Bill 1355] is to ensure that the changes to Florida’s election law are judged on their merits by eliminating the risk of a ruling impacted by outside influence. . . . By asking a court to rule on certain aspects of [House Bill 1355], we are assured of a neutral evaluation based on the facts.
15
It was not until August, 2012, more than a year after House Bill 1355 went into effect in Florida’s 62 non-Section 5 counties, that a Washington, DC, panel of federal judges issued a unanimous ruling that temporarily halted in Florida’s preclearance counties the called-for reduction in the number of days and the elimination of the final Sunday of early voting. In its decision, the court wrote that the State of Florida “failed to satisfy its burden of proving that those changes will not have a retrogressive effect on minority voters,” noting that a reduction in early voting days might have a differential impact on the ability of racial and ethnic minorities to cast ballots in the 2012 General Election. The federal district court found as well that “minority voters will be disproportionately affected by the changes in early voting procedures [called for by House Bill 1355] because they disproportionately use early in-person voting.” 16
Although the court enjoined the implementation of House Bill 1355’s early voting provisions in five of Florida’s 67 counties, it signaled a willingness to compromise if the number of early voting hours in 2012 were sufficiently increased to ensure access to the polls. Indeed, the court wrote that it could be persuaded that the “negative effect of reducing the number of days from 12 [sic] to 8 would likely be offset by the ameliorative effects of adding non-working weekday hours, a Sunday, and additional weekend hours.” This is clear evidence that the court saw a tradeoff between days in an early voting period and total number of hours of early voting.
The judgment of the federal court provided FDOS with an opening to negotiate a settlement with the USDOJ, and as part of this settlement United States Attorney General Eric Holder agreed not to oppose judicial preclearance of Florida’s early voting plan as long as the five Section 5 counties in the state offered twelve hours of early voting for all eight early voting days. Even with this offer, for a brief moment in early September, 2012, it appeared that USDOJ’s willingness to sign off on the five counties’ extended hours would be stymied by Harry Sawyer, the independently elected Republican Supervisor of Elections of Monroe County. Sawyer, who from the start had opposed a reduction in Florida’s early voting period, testified on behalf of the USDOJ, saying he thought that shortening the number of early voting days “would lead to substantially increased lines, overcrowding, and confusion at the polls, which would in turn discourage some reasonable minority voters from waiting to cast their ballots.”
17
Moreover, in an August 31, 2012, declaration, Sawyer wrote that
the Florida Governor’s office publicly stated to the press that I may be removed from my elected office if I do not capitulate in my long held position and follow the Secretary of State’s proposed early voting plan of 7 a.m. to 7 p.m. each day over the 8 day period for the 2012 general election.
18
A week later and defiant until the end—telling the press, “I don’t think the governor has any business sticking his nose in elections,” and criticizing the extended daily hours as an “unfunded mandate”—Sawyer eventually succumbed and agreed to enforce the twelve hours of early voting over the reduced eight day period (Bousquet 2012b).
Our analysis provides considerable evidence that Sawyer and other critics of Florida’s plan to reduce its early voting period were substantially correct. Notwithstanding the fact that the aggregate number of early voting hours remained at ninety-six in many of Florida’s sixty-seven counties including its five Section 5 counties (Bousquet 2012a), the voting rights of racial and ethnic minorities appear to have been disproportionately hampered by the reduction in the number of early voting days and particularly the elimination of the final Sunday of early voting. Our comparison of early voting patterns in 2008 with 2012 reveals that racial and ethnic minorities as well as Democrats and unaffiliated voters were far disproportionately less likely to vote early in 2012 than in 2008. The cause of this drop is likely a combination of campaign effects and the reduction by approximately one-third in the number of early voting days in Florida in conjunction with the elimination of the final Sunday of voting. These changes by the Florida legislature clearly made early voting less convenient and less accessible for Florida voters with inflexible schedules, and this is consistent with our analysis that reveals that early voters who cast their ballots on the final Sunday of early voting in 2008 were considerably less likely to turn out to vote in 2012.
Footnotes
Acknowledgements
The authors thank Daniel Bowen, Lawrence Kenny, Brendan Nyhan, Caroline Tolbert, Harrison Weidner, and seminar participants at Laval University, the University of Montreal, and Middlebury College for comments on earlier drafts.
Authors’ Note
The first draft of this article was circulated on the Internet on November 6, 2012, and a previous version was presented at the 2013 Annual State Politics & Policy Conference at the University of Iowa.
Declaration of Conflicting Interests
The author(s) declared no potential conflicts of interest with respect to the research, authorship, and/or publication of this article.
Funding
The author(s) received no financial support for the research, authorship, and/or publication of this article.