
Abstract
State capture and corruption are widespread phenomena across the globe, but their empirical study still lacks sufficient analytical tools. This paper develops a new conceptual and analytical framework for gauging state capture based on microlevel contractual networks in public procurement. To this end, it establishes a novel measure of corruption risk in government contracting focusing on the behavior of individual organizations. Then, it identifies clusters of high-corruption-risk organizations in the full contractual network of procuring authorities and their suppliers using formal social network analysis. Densely connected clusters of high-corruption-risk organizations are denoted as the domain of state capture. The paper demonstrates the power of the new analytical framework by exploring how the radical centralization of the governing elite following the 2010 elections in Hungary affected centralization of state capture. Findings indicate the feasibility and usefulness of such microlevel approach to corruption and state capture. Better understanding the network structure of corruption and state capture opens new avenues for research and policy on anticorruption, budget deficit, market competition, and quality of democracy. Supporting further empirical studies of corruption, the data are made available at digiwhist.eu/resources/data.
Introduction
There has been intense scholarly interest in state capture across the globe, although virtually every study has had to rely either on qualitative data lacking sufficient breadth or on survey data lacking sufficient reliability. These methodological weaknesses have spawned a rich theoretical literature but relatively meager empirical material against which to evaluate it. With the recent availability of reliable microlevel data on corruption and favoritism in public procurement (Auriol, Flochel, and Straub 2011; Bandiera, Prat, and Valletti 2009; Klasnja 2016), scholars can begin to rigorously test theories of state capture, and investigate underlying actor networks and corrupt transactions.
It is our starting point that state capture is not just widespread corruption. Rather, its essence lies in a distinct network structure in which corrupt actors cluster around parts of the state allowing them to act collectively in pursuance of their private goals to the detriment of the public good. By analyzing the distribution of corrupt transactions and clustering of corrupt actors across organizations, it is possible to estimate the degree of state capture. For example, it becomes possible to distinguish between localized and systemic forms of state capture where in the first case, only some public and private organizations enter into a capture relationship, with their “islands” remaining relatively autonomous, whereas in the second case, captured organizations are linked to each other and controlled by a countrywide elite.
To bridge the gap between state capture theory and empirics, this paper develops a new conceptual and analytical framework for gauging state capture based on microlevel contractual networks in public procurement. The goal of this analytical framework is to determine precisely whether state capture took place in particular parts of the state, and, if so, to help uncover its degree and structure.
Identifying state capture in organizational networks rests on a novel measure of corruption risk in government contracting (Corruption Risk Index [CRI]). This measure captures the likelihood of corruption occurring in a given tender by screening a wide range of microlevel “red flags” such as a short deadline for submitting bids.
Establishing the structure and degree of state capture opens up many ways for analyzing its causes and effects. To demonstrate the usefulness of this novel approach, the association between the organizational structure of the governing elite and the structure of state capture is explored using the change of government in Hungary in 2009–2012, albeit no causal claim is made due to the multitude of intervening factors. This is a highly relevant question on its own, as, to take one example, many anticorruption efforts fail because they misdiagnose corruption as a principal-agent problem and miss the elite-driven character of state capture (Mills 1970; Persson, Rothstein, and Teorell 2013).
Pursuing these ends extends our current knowledge in at least two ways: first and most importantly, it gives a well-documented and widely deployable toolkit for scholars to measure state capture exploiting the microlevel structure of corruption. This, hopefully, will generate further scholarly interest in the empirical study of state capture. Second, it also provides a brief empirical test for the theories of state capture, in particular on how elite centralization affects state capture structure, using the example of Hungary in 2009–2012. This is a crucial question, as it has wide-ranging ramifications for many economic, social, and political factors.
Findings highlight the conceptual and empirical usefulness of the proposed approach to state capture. The proposed framework allows us to establish the risk of corruption, that is, the likelihood of corruption occurring, in government contracting at the transaction level, while also providing clear guidance on how to use such microlevel data and indicators to precisely identify the location, degree, and structure of state capture. The method claims general applicability to countries with regulated and transparent public procurement markets, including Organisation for Economic Co-operation and Development (OECD) countries and most middle-income countries (OECD 2015). Applying the framework to Hungary in 2009–2012 demonstrates the methodology’s research merits. It reveals that the Hungarian state was partially captured in 2009–2012, with high-corruption-risk organizations becoming more central, as a more centralized governing party took power in 2011–2012, which coincides with qualitative accounts of the events. Understanding how elites organize state capture in middle-income countries has wide-ranging ramifications for anticorruption interventions, management of budget deficits, market competition, and quality of democracy.
Even though the main focus of this analysis is public procurement corruption, findings also provide an indication of corruption in a more general sense, as public procurement represents one of the principal vehicles for rent extraction across the globe. This is reflected, for example, in corruption surveys where public procurement is systematically named as the most corrupt area of government activities (OECD 2007, 9). This is not surprising given the high degree of discretion inherent in public procurement decisions and the large portion of public spending involved: between 20 and 50 percent of OECD countries’ public budgets (OECD 2011, Table 40.2). Although robust evidence is lacking, corrupt rents earned through particularistic allocation of public procurement contracts are often directly linked to political party finances and democratic party competition (OECD 2014; Transparency International 2012).
The paper is structured as follows: it first sets out the conceptual framework. Second, it develops the novel measure of corruption risks in public procurement transactions focusing on binary contractual relationships between organizations. Third, it identifies organizational clusters based on their corruption level and network connections. Fourth, it systematically explores how the change in the internal composition of the governing elite (i.e., becoming more centralized) affects the network structure of corruption in public procurement.
Conceptual Framework and Hypotheses
Although there are many competing definitions of corruption (Johnston 1996), we adopt a broad approach that is adept at capturing high-level political corruption in situations where even some regulations could be enacted to serve rent extraction. Thus, in the context of public procurement, institutionalized grand corruption denotes the allocation and performance of public procurement contracts by bending prior explicit rules and principles of good public procurement such as public procurement laws to benefit a closed network while denying access to all others (for a related discussion, see Kaufmann and Vicente 2011; Mungiu-Pippidi 2006; OECD 2007). This definition of corruption beyond simple bribery in public administration is well fitted to the context of public procurement where political discretion is broad, and political and technocratic actors necessarily codetermine decision. Prior explicit rules and principles provide the benchmark for an impartial and universalistic allocation of public resources as opposed to partiality and particularism along friendship or kinship lines (Rothstein and Teorell 2008). In addition, prior explicit rules and principles mandate open access and fair competition for public procurement contracts, and must be violated by corrupt groups if they are to generate corrupt rents and allocate them to members of their network (North, Wallis, and Weingast 2009). Such a definition of corruption is directly measured by the CRI developed by earlier scholarship (Fazekas, Tóth, and King 2016).
Similar to corruption, there are many definitions of state capture, many of which focus on lawmaking instead of public spending (Hellman et al. 2000; Slinko, Yakovlev, and Zhuravskaya 2005). A range of scholars share the understanding that state capture is a group phenomenon whereby some members of the business and/or political elite appropriate some parts or functions of the state and use its resources to the benefit of the group while harming the public good (Grzymala-Busse 2008). This understanding of state capture does not imply whether it is business capturing the state, or the other way around, or both at the same time. In the context of public procurement, state capture most likely involves targeting public organizations that manage the distribution and performance of contracts, as these are the primary sources of rents to be extracted. When a public organization is captured by private interests, it loses its autonomy to act in furtherance of public goals, which manifests in its inability to contract competitively, achieving low price and high quality.
Hence, it is possible to link institutionalized grand corruption to state capture in the domain of public procurement by focusing attention on the distribution and clustering of corruption and network relations of key actors underlying collective action (Uribe 2014). On one hand, corruption without state capture in public procurement is understood as institutionalized grand corruption distributed across the organizational network randomly. Corruption arising randomly implies atomized and isolated breakdowns of institutional integrity without any elite group seizing control of the state. On the other hand, state capture in public procurement is defined as institutionalized grand corruption clustered on certain public organizations that cease to serve public goals and instead are used for the captor group’s own objectives. This implies that the simple quantitative characteristic—amount of corruption—does not automatically translate into state capture; rather, its particular distribution is what matters. Hence, varying distributional characteristics of corruption can lead to a qualitatively different state operational logic even given the same quantity of corruption. Clusters of high-corruption transactions can arise both at the level of an individual organization, implying that it is only that particular organization that is captured (local capture), and at the level of multiple organizations, implying that there is a larger part of the public sector captured (global capture). Theoretically, the extent of state capture can range from a single captured organization to the capture of every single organization.
To convincingly link institutionalized grand corruption to state capture by analyzing organizational networks, it is imperative to first establish a thorough understanding of what the networks truly represent. The network of organizations consists of public organizations (issuers of tenders) and private firms (winners of tenders) where each tie represents a contractual relationship between the two. Institutionalized grand corruption as measured by CRI is a characteristic of the contract linking public organizations to private firms. In this sense, a high-corruption-risk contract represents a corrupt bond between the decision makers in public and private organizations, creating a relationship based on trust, shared experience, and jointly extracted rent (della Porta and Vannucci 1999). The clustering of high-corruption-risk contracts among organizations signals that the involved public and private actors have formed a group based on regular interactions that can act collectively to seize control of government contracting in pursuance of their private-regarding goals. State capture is unlikely to arise without such clustering of transactions, as corrupt relationships are costly to set up and the threat of detection makes group membership turnover highly risky (Lambsdorff 2002). Hence, the degree and strength of such a clustering measure the extent of state capture, ranging from partially appropriated state to a near complete fusion of private interests and state functions (Wedel 2003).
The different distributions of corruption and state capture are depicted in Figure 1 in a simplified form to shed more light on our proposed link between corruption and state capture. Here, I1 to I4 represent four different issuers (public organizations), S1 to S4 represent four different suppliers (private organizations), the dashed arrows between them denote low-corruption-risk contracts, and the solid arrows indicate high-corruption-risk contracts. C1 and C2 are two clusters of contracting organizations. In panel A, a corruption-free state is depicted, consisting of two contractual clusters, each of which is largely free of corruption and hence also of state capture. In panel B, corruption displays a random pattern without being organized into clusters of corrupt organizations. As each cluster of contracting organizations has both high- and low-corruption links, no state capture occurs. Such a pattern suggests occasional weaknesses of the integrity framework without an extensive breakdown of institutional autonomy.
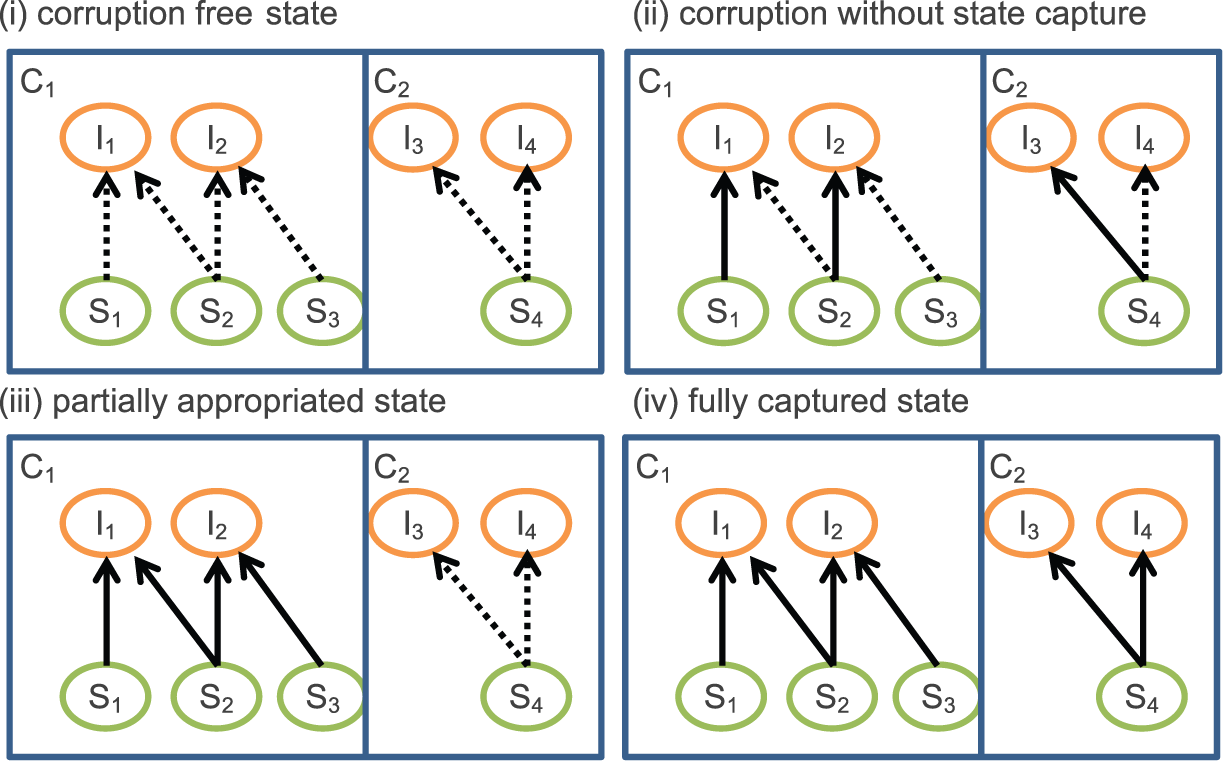
Typical network configurations of corruption and state capture: (A) corruption-free state, (B) corruption without state capture, (C) partially appropriated state, and (D) fully captured state.
In panel C, corruption is organized along the lines of clusters of contracting organizations, with one cluster (C1) containing only high-corruption contracts, whereas the other cluster (C2) contains only low-corruption contracts. In this situation, public organizations I1 and I2 are likely to have lost all of their institutional autonomy in disbursing public funds through public contracting, whereas I3 and I4 have managed to maintain their contracting autonomy. Because some public organizations are captured while others are not, this state can be denoted as a partially appropriated state (Wedel 2003). If cluster C1 had consisted of only one public organization, it could have been denoted as local capture. As the cluster already contains two public organizations, it represents a position somewhat removed from local capture and closer to global capture.
In panel D, every contract is of high corruption risk, rendering the state fully captured, or, to put it another way, the network exhibits global capture. As there are two separate contractual networks, the network configuration suggests an oligarchic structure whereby different captor groups target different sets of organizations. Nevertheless, this would need to be confirmed by analysis of the personal networks of key office holders in the clustered organizations. It is possible that the absence of a contractual link is the result of market and/or geographic separations, whereas personal ties assure a single captor group.
The above four types are of a highly simplified nature compared with the empirical data we analyze. There are three notable extensions to these models: first, clusters are unlikely to be completely separate, but rather are likely to be characterized by a dense network of intracluster contractual links, but some sparse relations among clusters. Second, clusters may only differ in the degree of corruption risk associated with their intracluster contractual relationships; that is, some clusters are expected to have dominantly high-corruption-risk contracts, whereas others have dominantly low-corruption-risk contracts. Third, our indicator of corruption risks (CRI) of contractual relations is not binary but rather a continuous measure, making the analysis much more fine-tuned than the simple binary categorization of contracts.
Using the above conceptualization of state capture, this article investigates the relationship between governing elite composition and the structure of state capture. The starting point is that in a typical case, captor groups have different degrees of centralization, some resemble a loose coalition of diverse actors (i.e., oligarchy) others a highly centralized group with a strict hierarchical structure (i.e., hierarchy). Internal organization determines the degree to which they are capable of collective action such as managing rent extraction. Hence, we can hypothesize that captor groups organize rent extraction in line with their internal composition. That is, decentralized captor groups would organize rent extraction in public procurement in a decentralized way. This is reflected in the organizational network consisting of multiple distinct clusters of high-corruption organizations. A centralized captor group would organize rent extraction in public procurement in a centralized way. This would be reflected in the organizational network as a tightly knit cluster occupying the center of the graph. As the composition of the elite in Hungary changed radically (i.e., became centralized) in 2010 following the landslide victory of the conservative party (Fidesz), this provides an appropriate testing ground for theory. In this context, the competing hypotheses to be tested are as follows:
The Data
Public Procurement Data from Hungary, 2009–2012
The database derives from Hungarian public procurement announcements from 2009 to 2012 (this database is referred to as PP henceforth). The data represent a complete database of all public procurement procedures conducted under Hungarian Public Procurement Law. PP contains variables appearing in (1) calls for tenders, (2) contract award notices, (3) contract modification notices, (4) contract completion announcements, and (5) administrative corrections notices. As not all of these kinds of announcements appear for each procedure, we only have the variables deriving from contract award notices consistently across every procedure. Comparable data sets exist or can be constructed from public records in most developed countries including every EU member state, Russia, and the United States at least since 2008.
These documents are published online in the Public Procurement Bulletin. 1 As there is no readily available database, we used a crawler algorithm 2 to capture the text of every announcement. Then, applying a complex automatic and manual text-mining strategy, we created a structured database that contains variables with clear meaning and well-defined categories. As the original texts available online contain a range of errors, inconsistencies, and omissions, we applied several correction measures to arrive at a database of sufficient quality for scientific research. For a full description of database development, see Fazekas and Tóth (2012). The database is downloadable at digiwhist.eu/resources/data.
A potential limitation of our database is that it only contains information on public procurement procedures administered under the Hungarian Public Procurement Law, as there is no central depository of other contracts. The law defines the minimum estimated contract value for its application depending on the type of announcing body and the kind of products or services to be procured (e.g., from January 1, 2012, classical issuers had to follow the national regulations if they procure services for more than 8 million HUF or 27,000 EUR). Hence, PP is a biased sample of total Hungarian public procurement, containing only the larger and more heavily regulated cases. This bias makes PP well suited for studying more costly and high-stakes corruption, as coverage is close to complete. In spite of any such limitations, a large amount of data are available: more than fifty-three thousand contracts awarded worth more than 11 billion EUR, amounting to more than 3 percent of total gross domestic product (GDP) in 2009–2012 (Table 1).
Main Statistics of the Analyzed Data—Contracts.
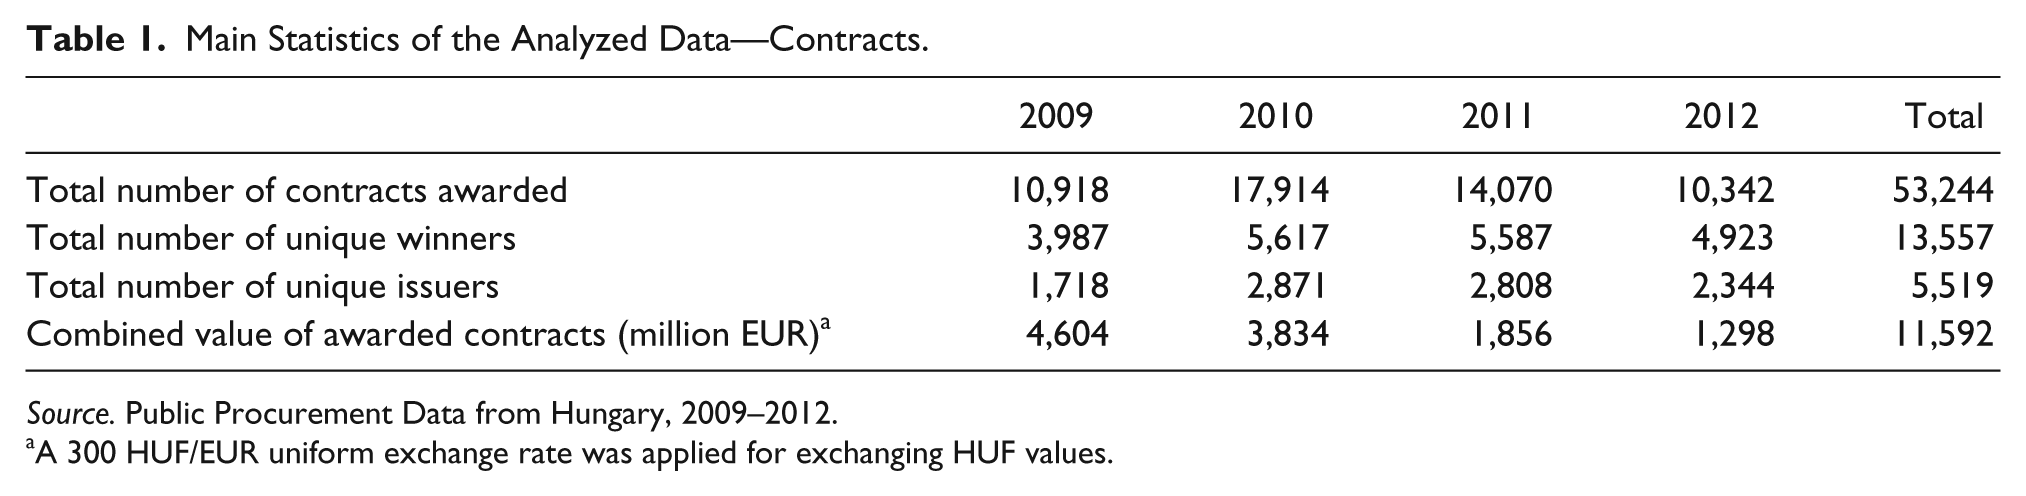
Source. Public Procurement Data from Hungary, 2009–2012.
A 300 HUF/EUR uniform exchange rate was applied for exchanging HUF values.
Network Data from Hungary, 2009–2012
This public procurement database allows for very detailed and complex network analyses, as there are at least three distinct actors recorded: (1) public organizations or issuers, (2) private organizations or suppliers/winners, and (3) procurement advisors or brokers. Networks can be constructed with contracts defining ties between actors, but other links are also possible, such as coparticipation in a bid or consortium, issuers procuring together, shared company ownership, or a shared set of managers or board members. The fact that the database records transactions on a daily basis opens up the possibility of a wide range of analyses.
To concentrate on the aspects of the available rich data set most relevant to research goals, a subset of actors and relationships between them (edges or ties) was selected for analysis (Table 2). First, only two types of actors were selected resulting in a two-mode or bipartite network structure: issuers and winners. Although there has been a lot of scientific discussion about the crucial role of informality and the consequent secondary importance of formal structures, public as well as private organizations still represent specific investments into means of rent extraction for corrupt groups. By implication, network analysis focusing on organizational networks is capable of capturing the most relevant means and structure of high-level rent extraction and corruption. Second, the analyzed database only records contracts of at least 1 million HUF (or roughly 3,300 EUR). 3 Below this threshold, contracts are considered to be too small for high-level politics to interfere (though this does not mean that there is no corruption involved in their award). Third, only those organizations that have at least three contracts awarded in at least one of the two observation periods are analyzed, as the market behavior of organizations with less than three contracts in a roughly one-and-a-half-year period is generally too erratic, creating random noise that inhibits pattern identification. The same sample selection was applied for calculating the CRI on the contract level, by implication network data and corruption measurement both refer to the same sample.
Descriptive Statistics of Network Sizes of the Two Periods 2009–2010 and 2011–2012.
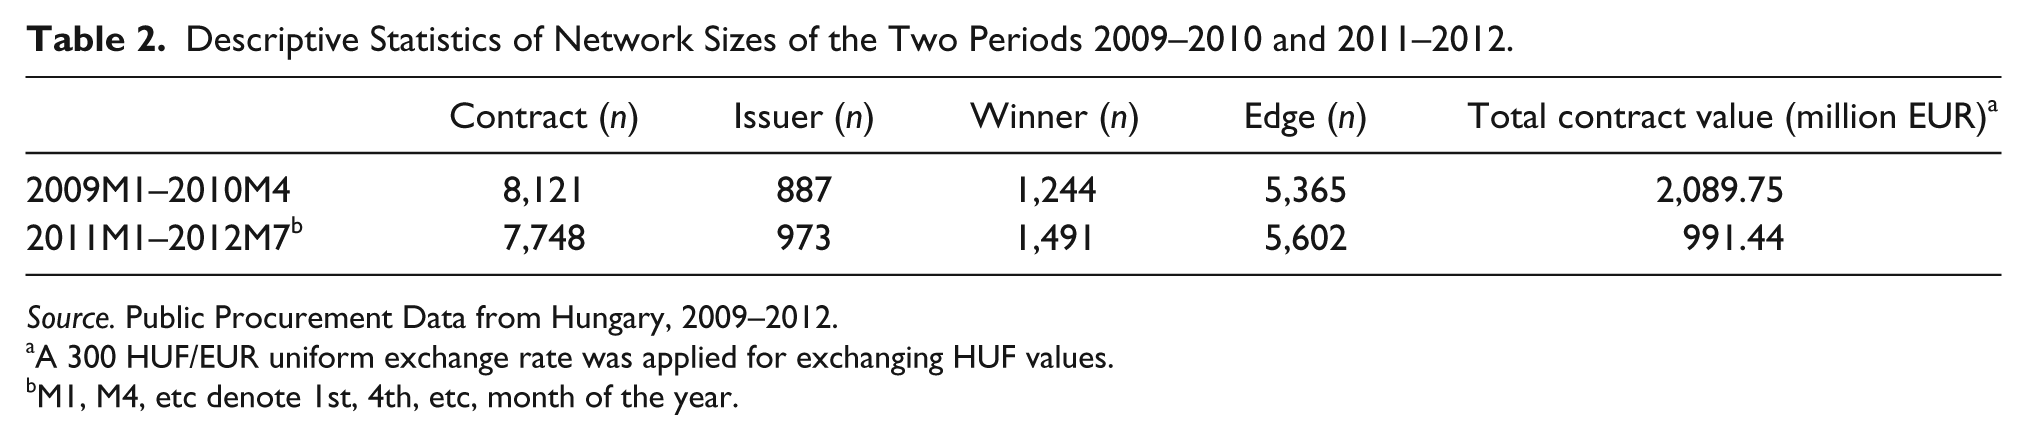
Source. Public Procurement Data from Hungary, 2009–2012.
A 300 HUF/EUR uniform exchange rate was applied for exchanging HUF values.
M1, M4, etc denote 1st, 4th, etc, month of the year.
To harness the changing elite configuration resulting from the change of government in May 2010, two roughly equal time periods were selected: January 1, 2009 to April 31, 2010, capturing the socialist government’s almost one-and-a-half years in office, and January 1, 2011 to July 31, 2012, capturing the first roughly one-and-a-half years of the conservative government in office. Note that the immediate period after the change of government (May 1, 2010 to December 31, 2010) is excluded from the analysis, as it is considered to be transitory. This is because public procurement tenders often have around a half-year time span between launch and final contract award, and incoming governments typically take a few months to establish their new regime in public procurement, such as implementing new rules and appointing new officials to key posts.
In Table 2, the number of edges is lower than the number of contracts, as any pair of organizations could have concluded more than one contract in each period. Multiple contracts between the same two actors within each period were aggregated to represent one edge per period, that is, a single relationship between actors.
The two networks are, by and large, of the same size, with the network representing the 2011–2012 period, containing somewhat more edges and actors but much smaller total contract value. This is because public procurement spending greatly decreased after the 2010 elections, reflecting budget cuts across the whole public sector.
The two periods are treated as two distinct networks not only because the underlying governing elites have almost completely changed but also because the organizational actors and their positions changed fundamentally. Only about one-third of organizations are present in both networks (Online Appendix Table A1 at http://prq.sagepub.com/supplemental/), with suppliers displaying a particularly low level of overlap between the two periods. These statistics are broadly in line with interview evidence pointing at a wholesale restructuring of the public procurement market under the new conservative government. In addition, the network position of organizations present in both networks changed considerably.
We can claim that elite configuration under the two periods is fundamentally different as both the governing parties have different internal organization, and the public administration structures they created are very different. The socialist governments between 2002 and 2010 consisted of a coalition of the socialist party (Magyar Szocialista Párt [MSzP]) and the liberal party (Szabad Demokraták Szövetsége [SzDSz]), with three different prime ministers in the period. The party leadership has also changed on multiple occasions in this period. The conservative party (Fidesz) formed a government de facto on its own in 2010 commanding two-thirds parliamentary majority, while the party has always been led by three-time prime minister Viktor Orbán. Although party and government leadership turnover and coalition governments are far from the only indicators of governing elite centralization, they both point in the same direction. The socialist governing elite was a more decentralized elite group than the conservative governing elite.
This picture is further strengthened by the centralization of the public administration under the conservative government. There was a strong centralizing push in public services in 2010–2012 through the reallocation of many locally managed services, such as primary and secondary education, and associated spending, to the center (OECD 2011, 2015). In a similar vein, most local public services, such as issuing permits, which had previously been managed by municipalities were transferred to regional or national centers. Finally, the central government was reorganized into only eight ministries with three “top” ministries managing most substantial areas. This move was openly praised by top government officials as a means to effective governance. Even though reorganizing the state serves only as a proxy for elite configuration and elite preferences, it clearly points at a more centralized direction under the conservative government when compared with the previous socialist government.
Measuring Institutionalized Grand Corruption: Focusing on the Contracts between Two Organizations
The starting point for identifying state capture is to develop a robust measure of institutionalized grand corruption at a dyadic level, that is, by looking at the relationship between any pair of issuers and winners. The approach follows closely the composite indicator–building methodology developed and tested by earlier scholarship making use of a wide range of public procurement “red flags” (Charron et al. 2016; Fazekas, Tóth, and King 2016).
The measurement approach exploits the fact that for institutionalized grand corruption to work, procurement contracts have to be awarded recurrently to companies belonging to the corrupt network. This can only be achieved if legally prescribed rules of fair competition and open access to public resources are circumvented. By implication, it is possible to identify the input side of the corruption process, that is, techniques used for limiting competition (e.g., leaving too little time for bidders to submit their bids), and also the output side of corruption, that is, signs of limited competition: single bid received and recurrent contract award to the same company. By measuring the degree of unfair restriction of competition in public procurement, a proxy indicator of corruption can be obtained. This indicator, which we call the CRI, represents the probability of particularistic contract award and delivery in public procurement falling between 0 and 1 (minimal and maximal corruption risk, respectively). Based on qualitative interviews of corruption in the public procurement process in Hungary as well as a review of the literature (OECD 2007; PricewaterhouseCoopers 2013; World Bank 2009), we identified the components of the CRI, that is, “red flags” indicating corruption risks in public procurement (Table 3).
Summary of Corruption Inputs (Higher Score Indicates Greater Likelihood of Corruption).
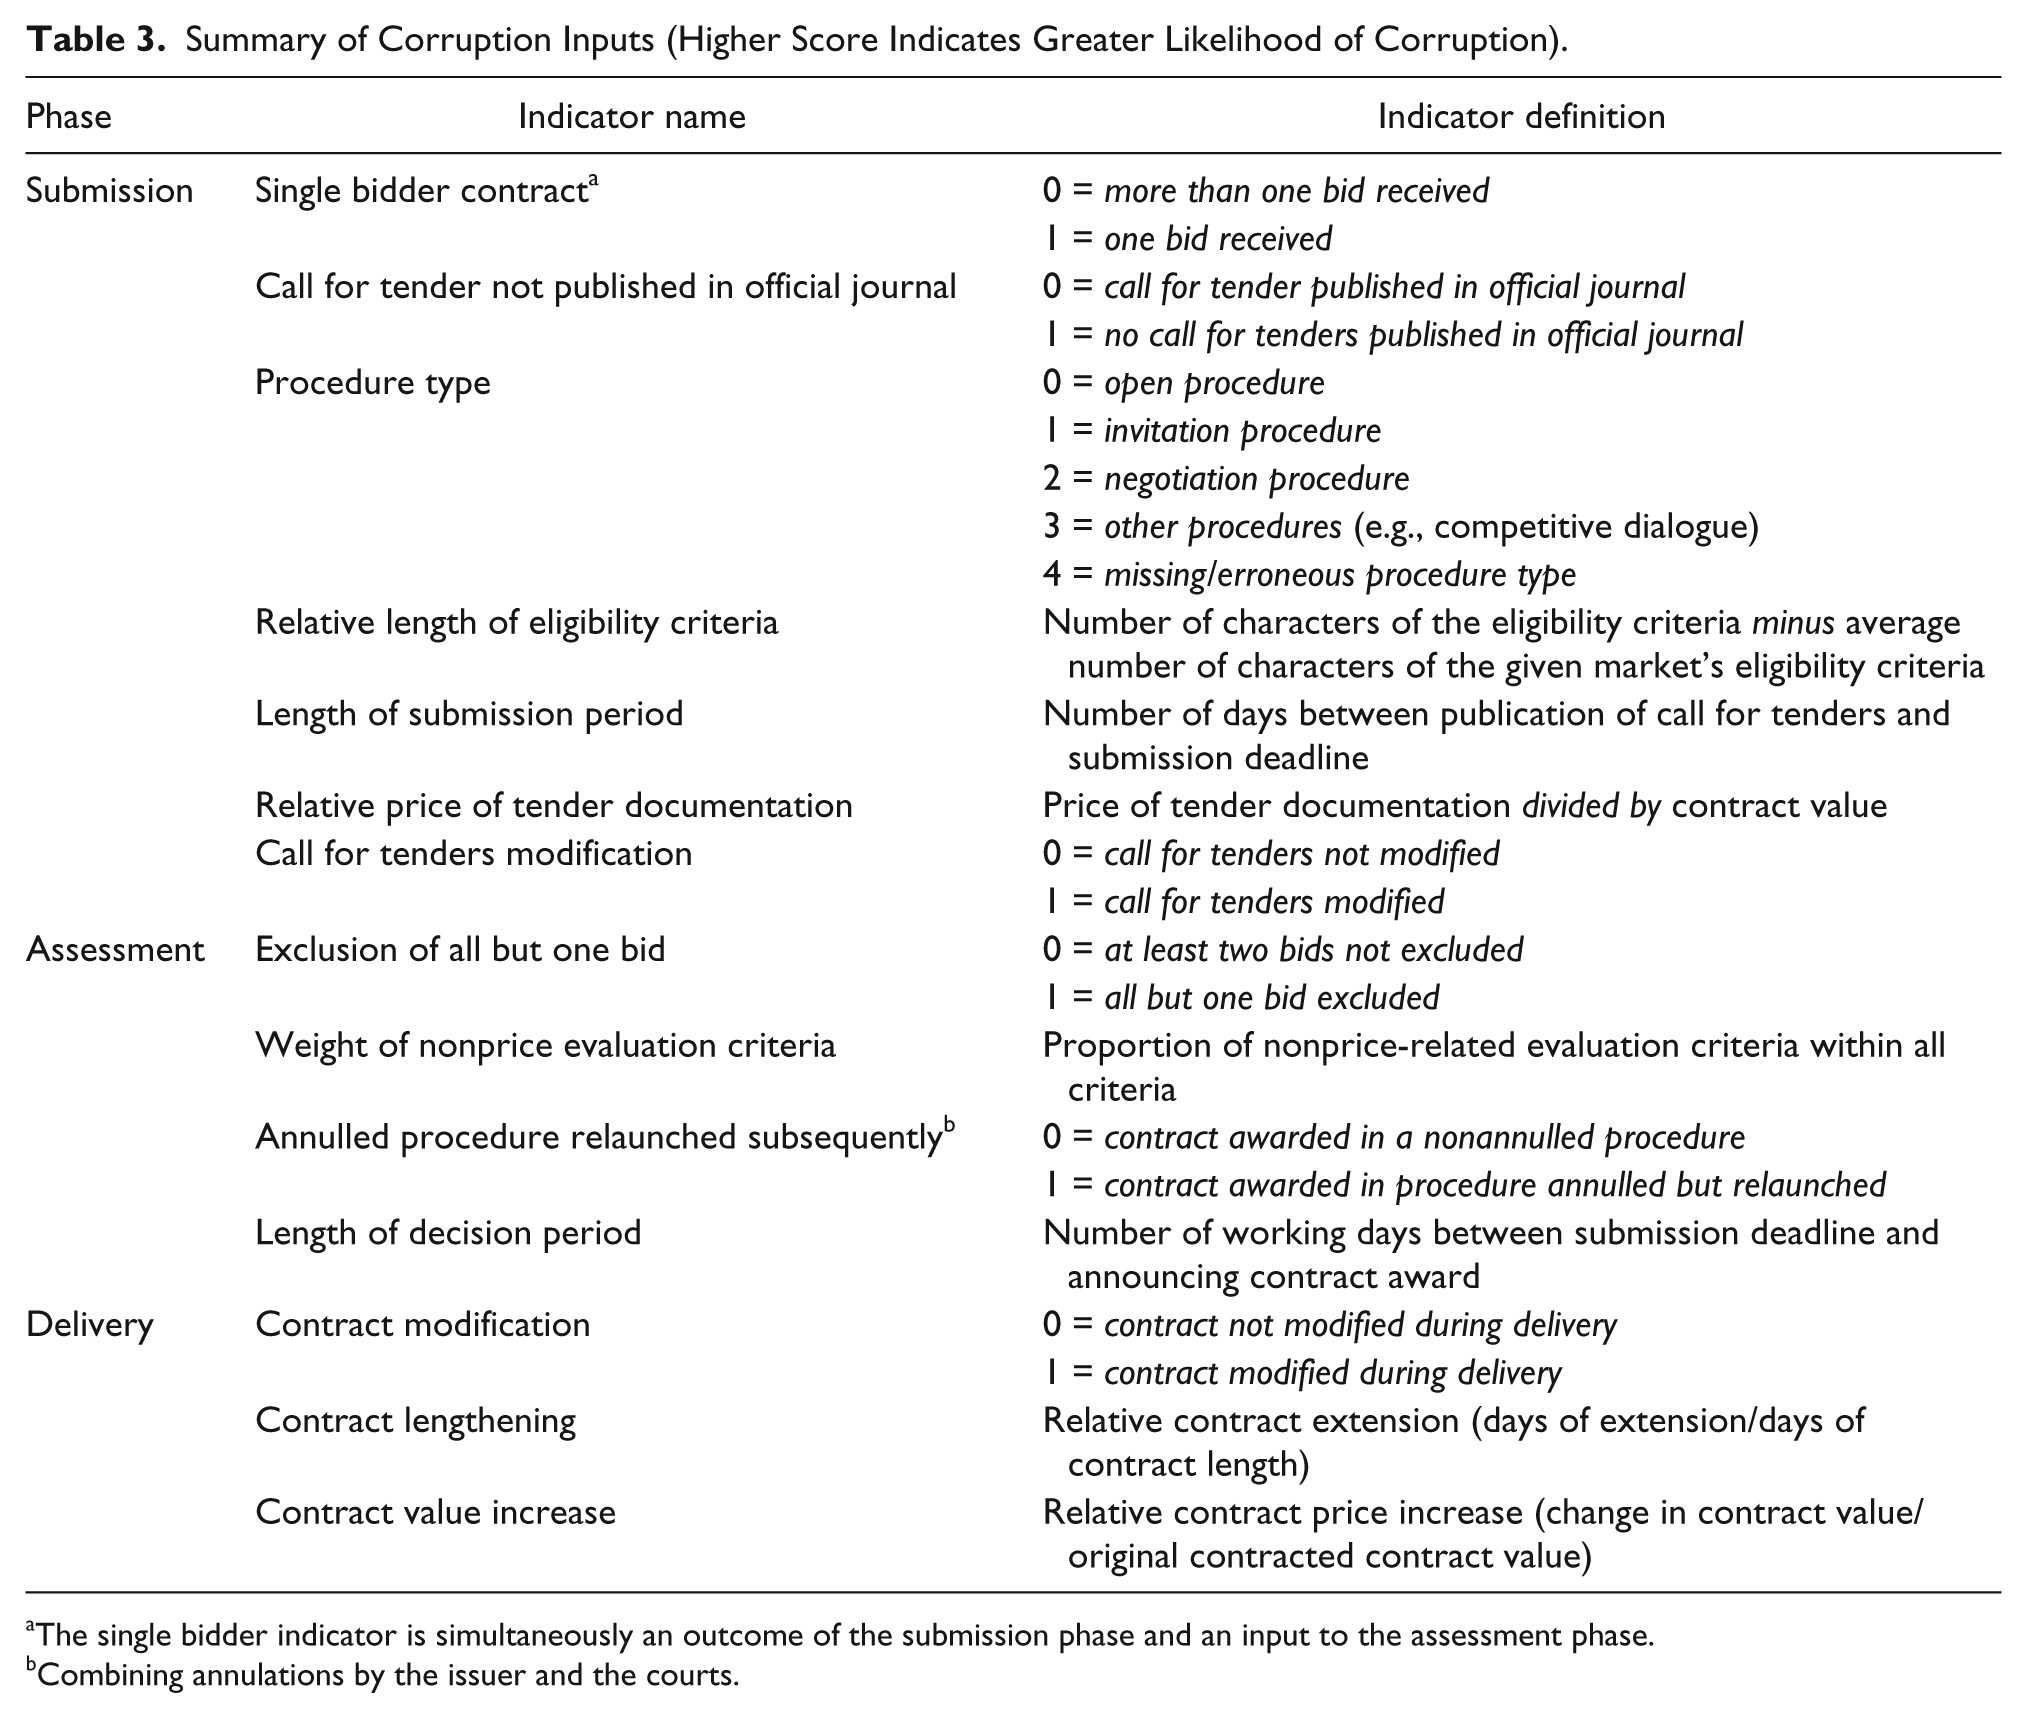
The single bidder indicator is simultaneously an outcome of the submission phase and an input to the assessment phase.
Combining annulations by the issuer and the courts.
Each of these is discussed briefly here:
One of the most straightforward “red flags” of corruption is that only a single bid is submitted. As we are only examining competitive markets, the apparent lack of competition allows for awarding contracts above market price and extracting corrupt rents.
A simple way to fix tenders is to avoid the publication of the call for tenders in the official public procurement journal, as this makes it harder for competitors to learn about business opportunities and hence to prepare a bid.
Although open competition is relatively hard to avoid in some tendering procedure types, such as open tender, others, such as invitation tenders, are by default less competitive; hence, the selection of a less open and transparent procedure type can also indicate the deliberate limiting of competition and hence corruption risks.
Eligibility criteria define which companies are allowed to bid. Tailoring the conditions to a single company is one of the most widely quoted means for corruptly limiting competition. Overly complex, hence lengthy, criteria are a typical sign that criteria were “overspecified,” most likely excluding competitors.
If the submission period, that is, the number of days between advertising a tender and the submission deadline, is too short for preparing an adequate bid, it can serve corrupt purposes whereby the issuer informally tells the well-connected company about the opportunity much earlier.
To prepare bids, bidders need to access the full tender documentation for which they are sometimes required to pay a fee. Excessively expensive tender documentation can be used for corrupt purposes, as it can deter otherwise competitive bidders, especially smaller ones reluctant to take larger risks.
“Call-for-tender” announcements provide the key document for bidding firms on which to base their bids. However, changes—once or multiple times—to the bidding conditions, such as technical content or eligibility criteria, may signal corruption risk, as this creates uncertainty and may deter bidders.
Although receiving more than one bid indicates lower risk of corruption in public procurement, abusing administrative rules for excluding bidders can still serve corrupt purposes, especially when all but one bidder is excluded. Typically, the reasons for such exclusions are insubstantive, such as missing page numbers or the absence of an official stamp on an auxiliary document.
Different types of evaluation criteria are prone to fiddling to different degrees. Subjective, hard-to-quantify criteria often accompany rigged assessment procedures, as these create room for discretion and inhibit accountability mechanisms.
When the size and sector of the contract mandate an open procedure, a widely used corruption technique avoids open competition by deliberately derailing the first open procedure and relaunching the tender under an accelerated, less open procedure type, citing the urgency of purchase and the time lost in the unsuccessful first open tender.
If the time used for deciding on the submitted bids is excessively short or lengthened by legal challenge, it can also signal corruption risks. Snap decisions may reflect premediated assessment, whereas legal challenge and the corresponding long decision period suggest outright violation of laws.
Most “red flags” of corruption in public procurement concentrate on the bidding process; however, the contract implementation phase is even more prone to corruption due to frequent lack of attention and clear information. Modifications to contract conditions signal the risk of unfair competition and corruption (i.e., nonconnected bidders could not have foreseen the loosening of contract conditions when bidding). Increasing the contract value and postponing delivery dates are two particularly high-risk signals.
On competitive markets, it is unlikely to have the same company winning all the contracts of a given issuer; hence, the share of the winning company within all the contracts awarded by the issuer can indicate rigged competition.
Single bidder and winner’s contract share are two outcomes of the competitive process that closely match the concept of institutionalized grand corruption in addition to having been identified as the most reliable “red flags” in the literature. However, under the strict rules of open competition dictated by public procurement laws, the rules of the game have to be rigged to favor well-connected bidders. This gives rise to “red flags” of the tendering process in conjunction with high-risk tendering outcomes.
For continuous variables above, such as the length of submission period, thresholds had to be identified to reflect the nonlinear character of corruption. This is because most values of continuous variables can be considered as reflections of diverse market practices (e.g., twenty or more days for bidders to prepare their bids), whereas some domains of outlier values are more associated with corruption (e.g., only allowing five days for bid submission). Thresholds were identified using regression analysis, in particular analyzing residual distributions.
We restricted the sample to experienced issuers of tenders on competitive markets to minimize the chances that we are measuring honest errors or inexperience rather than corrupt practices. Thus, we only examine tenders in markets with at least three unique winners throughout 2009–2012, where markets are defined by product type (Common Procurement Vocabulary [CPV] 4 Level 3) and location (Nomenclature of Territorial Units for Statistics [NUTS] 5 Level 1), and issuers that have awarded at least three contracts in the twelve-month period prior to the contract award in question.
In addition to the identification of thresholds in continuous variables, regression analysis was used to ensure that “red flags” measure corruption, and to make the indicators comparable across different sectors and regions (where different corruption techniques might be used). In this analysis, we consider “red flags” as indicating corruption only if they predict (1) single bidder contracts and (2) winner contract share in the twelve months prior to contract award. We control for a number of likely confounders in these regressions. These controls are as follows: (1) administrative capacity measured by number of employees of the issuer, 6 (2) institutional endowments measured by type of issuer (e.g., municipal, national), (3) product market and technological specificities measured by CPV division of products procured, (4) number of competitors on the market measured by the number of unique winners throughout 2009–2012 on CPV Level-3 product group and NUTS-1 geographic region, (5) contract size and length, and (6) regulatory regime as proxied by year of contract award.
Some examples show the logic of analysis and our approach to interpretation (for full details, see Fazekas, Tóth, and King 2016). Failing to publish the call for tenders in the official journal increases the average probability of single received and valid bids by 12.1 to 14.0 percent, and it also increases the winner contract share in all contracts awarded by the issuer in the previous twelve months by 3.9 percent. These results suggest that avoiding the transparent and easily accessible publication of a new tender can typically be used for limiting competition to recurrently benefit a particular company. This implies that a call for tenders not being published in the official journal should be included in CRI. Similarly, leaving only five or fewer days, including the weekend, for bidders to submit their bids is associated with a 21.2 percent higher probability of a single bidder contract and with a 7.7 percent higher winner’s contract share, compared with submission periods longer than twenty calendar days. These coefficients indicate that extremely short submission periods are often used for limiting competition and awarding contracts recurrently to the same company. They provide sufficient grounds for including the submission period component in the CRI.
Following from the regression analysis, each valid “red flag” of corruption is identified and included in CRI. In addition to the outcome variables of the two regressions (single bidder and winner contract share), all those variables are included in CRI that are in line with a rent extraction logic, hence proven to be significant and powerful predictors in both regressions.
Once the list of elementary corruption risk indicators is determined with the help of regression analysis, each of the variables and their categories receive a component weight (Table A2). As we lack the detailed knowledge of which elementary corruption technique is a necessary or sufficient condition for corruption to occur, we assign equal weight to each variable, and the sizes of regression coefficients are only used to determine the weights of categories within variables. For example, if there are four significant categories of a variable, then they are weighted 1, 0.75, 0.5, and 0.25, reflecting category ranking according to coefficient size. The component weights are normed, so that the observed CRI falls between 0 and 1.
As CRI is defined on the level of individual public procurement tenders, it is most appropriately used as the edge weight in the organizational contractual network. As any two organizations can have more than one contract linking them within the same period, edge weights were calculated as the unweighted arithmetic average of the contracts constituting the edge between the actors in the period considered.
To establish that CRI proxies corruption rather than other phenomena such as low administrative capacity, its covariation with five different external indicators is explored (Fazekas, Tóth, and King 2016). All the performed tests are confirmatory: significant, substantial size, and point in the expected direction (Table 4). Winning companies with the highest profit margins have 0.024 higher CRI than low-profit-margin-winning firms. Expensive purchases display a 0.071 higher CRI than the cheapest purchases. Both of these suggest that CRI captures institutionalized corrupt rent extraction resulting in higher profits from above market procurement prices. Companies with direct political connections have 0.011 higher CRI than companies without such ties, similarly companies whose market success is fundamentally altered by the change of government display 0.011 higher CRI than companies whose success was unaffected by the government change. Although the difference of 0.011 CRI is of moderate magnitude, it indicates that high-level politics is associated with corruption risks measured by CRI. Public-procurement-winning firms that are registered in tax havens as measured by the Financial Secrecy Index (FSI; Tax Justice Network 2013) have 0.02 higher CRI than companies registered in transparent jurisdictions.
Summary of Validity Tests Using External Indicators, Significant Relationships (p < .001).
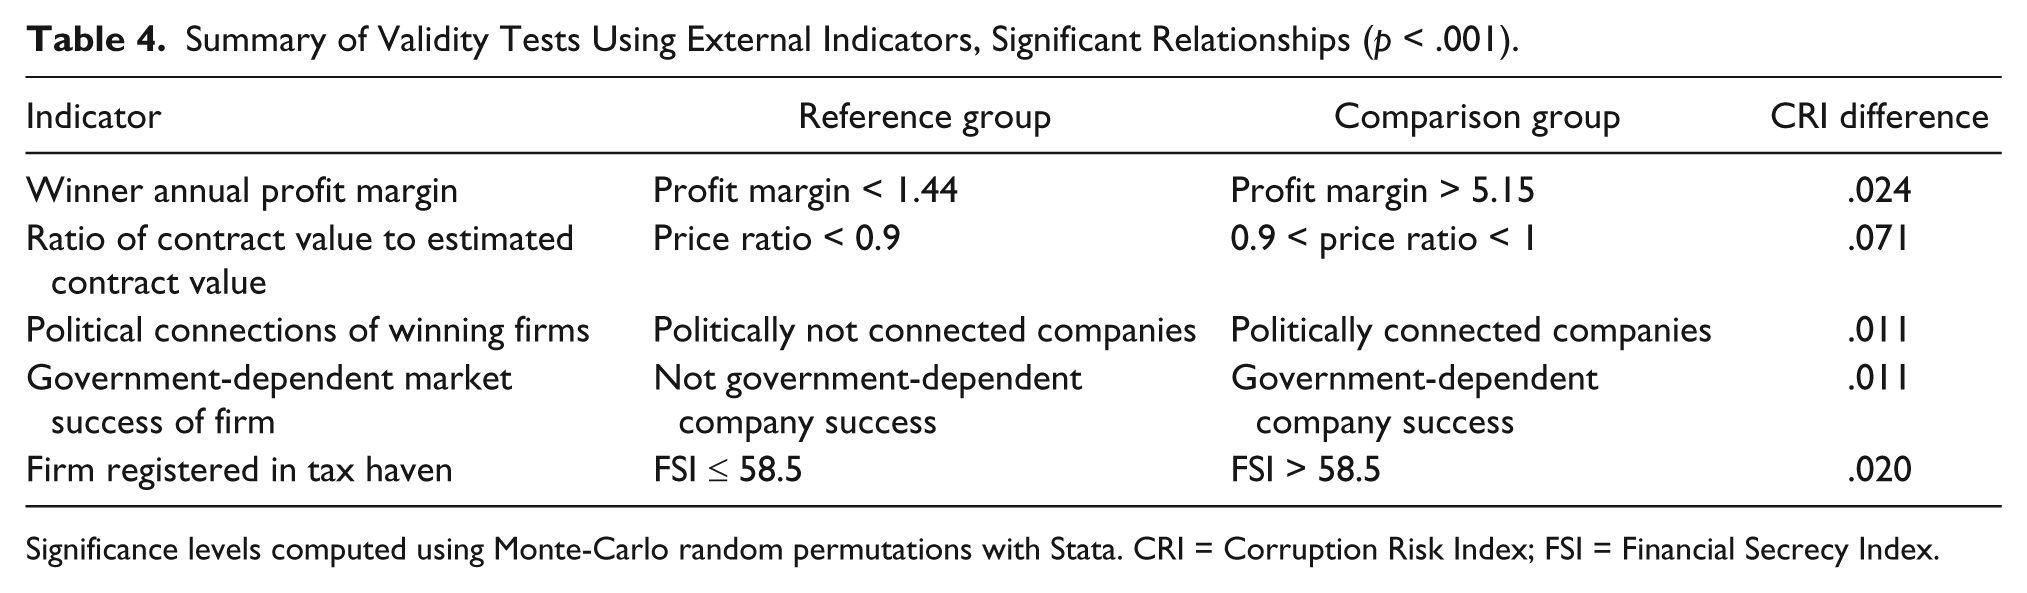
Significance levels computed using Monte-Carlo random permutations with Stata. CRI = Corruption Risk Index; FSI = Financial Secrecy Index.
Identifying State Capture Patterns: Focusing on Contractual Networks
This section makes the leap from corruption in binary contractual relationships to state capture defined by organizational clusters underpinning collective action by captor groups. This entails, first, exploring the total contractual network to establish stylized facts in line with the hypothesized network formations (Figure 1); second, performing a cluster analysis using the corruption risks present in organizations’ ego networks (i.e., immediate neighbors in the network); and third, mapping the network position of captured and clean organizations identified by the prior cluster analysis. Network analysis and visualization were conducted using R’s igraph package, Python’s NetworkX library, and Gephi.
The contractual networks of both periods are fundamentally similar with no substantive difference in elementary network summary statistics (Table A3). For example, network density, that is, the proportion of observed ties compared with all possible ties, is 0.004 for 2009–2010 and 0.003 for 2011–2012, hardly any change. This underlines the continuity of government contracting in spite of radical change in the structure of government since 2010.
To directly project the stylized network configurations onto the empirical data, high- and low-corruption-risk contracts were denoted as those with the highest 20 percent CRI scores and those with the lowest 20 percent CRI scores, respectively. The contracts with CRI scores around the mean were excluded from the representation. The resulting graph for the 2009–2010 period is in Figure 2. Red vertices represent suppliers, and green vertices denote issuers. Node size reflects degree centrality (i.e., total number of direct relations a node has, taking weights into account), and node location is a function of network closeness using the Fruchterman–Reingold layout function. Edge width reflects corruption risks (CRI) of the contracts underlying each edge (average CRI edges, although excluded from the representation, were still used for calculating network distance). Underpinning the hypothesized network formations, there are a few clusters of organizations that tend to be linked either by low- or high-corruption-risk edges, whereas many more have mixed relationships, both high and low CRI. This simple visualization motivates the formal cluster analysis of organizational ego networks to identify clean as well as mixed cases of capture.
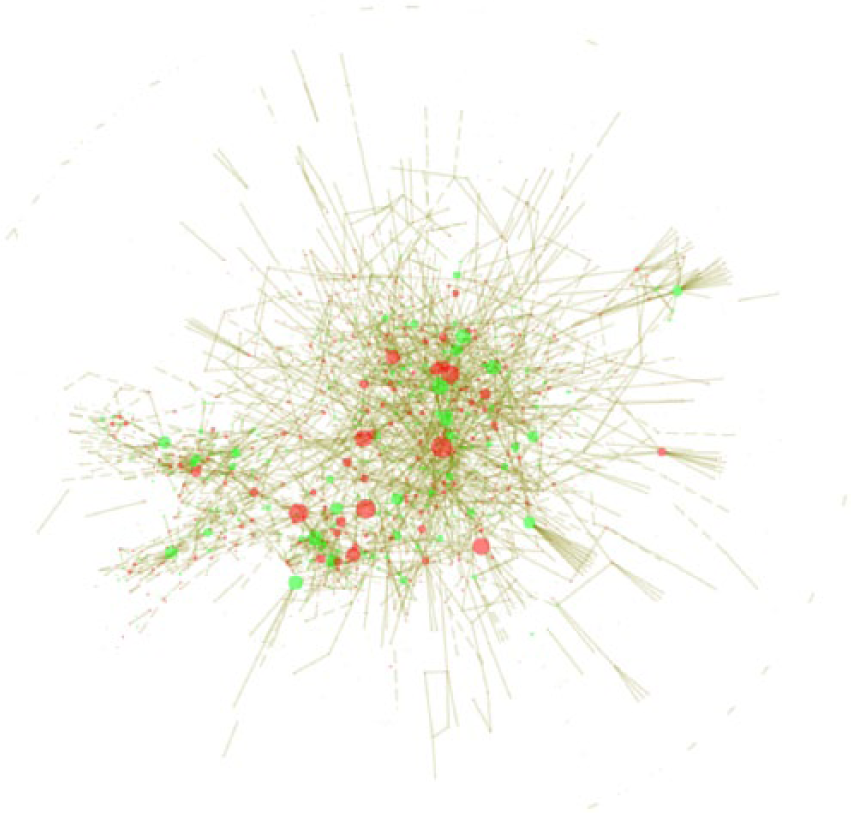
Contractual network using low- and high-CRI contracts only, Hungary, 2009M1–2010M4.
We clustered supplier and issuer organizations based on each organization’s average CRI and the relative standard deviation of CRI (clustering procedures carried out with Stata 12.0 cluster command). The first clustering variable captures the overall level of corruption risks in an organization, whereas the second indicates how consistently the organization behaves. Thus, clustering based on these two variables allowed to capture the degree to which each organization’s ego network fits the homogeneous or heterogeneous corruption patterns hypothesized. Although the above theory suggested clean, fully captured, and mixed clusters, the clustering algorithms 7 instead revealed four groups with two intermediate cases instead of one 8 (Table 5):
Clean organizations: low average corruption with low variability of performance
Occasionally corrupt organizations: low average corruption with highly variable performance indicating that there are occasional deviations from the low-corruption-standard contracting practice
Partial capture: high average corruption with high variability indicating that there are still low-corruption contracts that, nevertheless, represent the deviation from a high-corruption norm
Full capture: high average corruption with low variability of performance indicating that corrupt exchanges represent the norm in the organization’s contracting practice
Clusters’ Mean Value of the Clustering Variables, Hungary, 2009–2012.
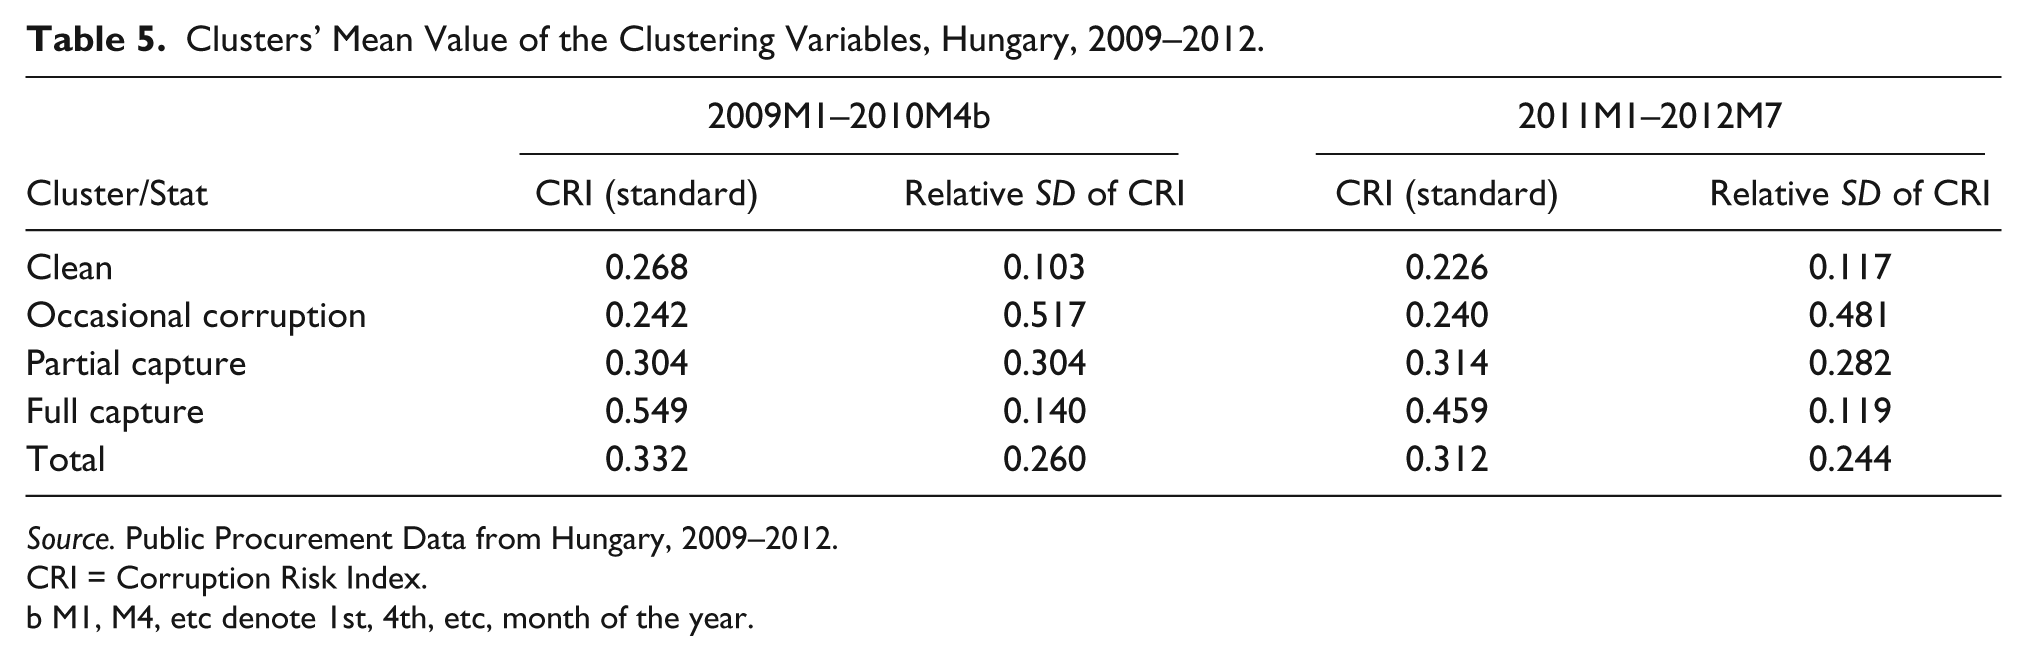
Source. Public Procurement Data from Hungary, 2009–2012.
CRI = Corruption Risk Index.
M1, M4, etc denote 1st, 4th, etc, month of the year.
Comparing the two periods, there is no considerable difference in terms of proportions of each group: about 60 percent of organizations are partially or fully captured in Hungary (Table A4). This is a surprisingly high figure, but it also signals that the Hungarian state is not fully captured but rather that there is a range of organizations with mixed track records. This indicates that the norm of ethical universalism is only partially established and there are organizations where opposing norms conflict.
After establishing that there is a considerable degree of organization-level capture in Hungary, the final step is to gauge the degree of state capture at the interorganizational level. Hence, we search for communities or cohesive subgroups in the whole network that denote groups of contracting entities and winning firms that are more densely connected to each other than to the rest of the network. To identify such communities, we use a so-called modularity measure that measures how good a given community definition is by comparing the number of links within each community against the expectation of a random but comparable network. 9 The more links stay within the community relative to the outside world, the greater the modularity (and the more separated various communities are in the graph). This approach applied to the public procurement contracting network of Hungary (2009–2010) highlights the existence of distinct cohesive subgroups (Figure 3).
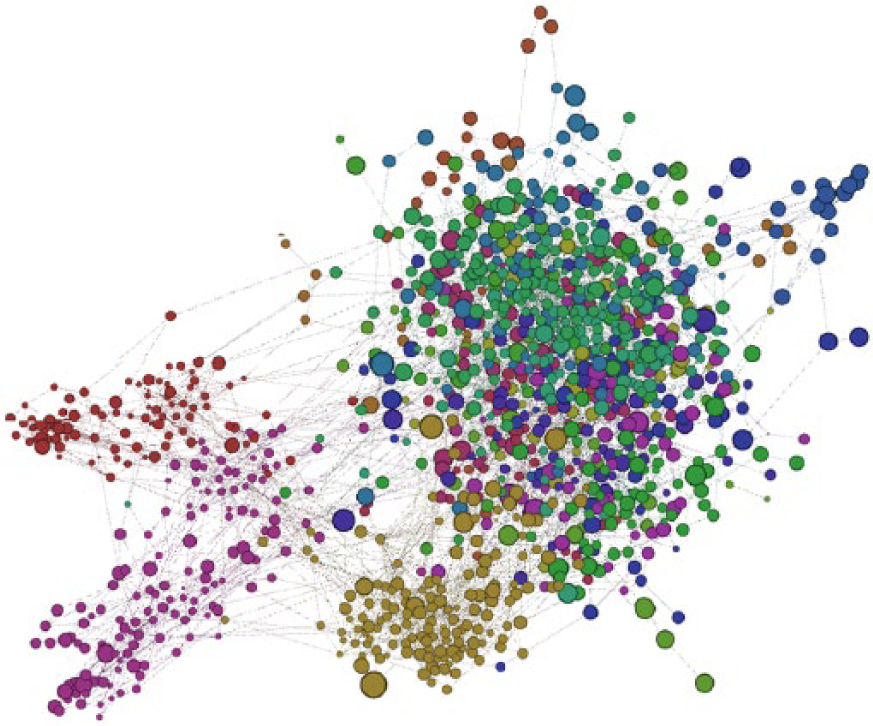
Contractual network of organizations highlighting cohesive subgroups with highest modularity, Hungary, 2009M1–2010M4.
The existence of some cohesive subgroups is not a surprise given the strong geographical and market-driven patterns in government contracting. However, what is surprising and points heavily toward state capture at the level of communities is that there are a number of communities that predominantly consist of organizations earlier denoted as partially or fully captured (in 2009–2010, 32% of organizations belong to a community where captured organizations make up more than two-thirds). These are organizations that are not only captured based on the corruption risks in their own contracting activities but they also extensively contract among themselves rather than with organizations outside their captured community. Formal tests confirm that community membership and belonging to the captured or noncaptured organization types are significantly associated (for 2009–2010, Pearson’s chi-square and likelihood ratio chi-square tests are significant at the .001 level, Cramer’s V = 0.2).
In Hungary, where some degree of state capture is expected (Innes 2014), the proposed methodology identified and precisely located this phenomenon on the organizational level as well as in relation to groups of organizations. The findings reveal a graduated and dynamic picture instead of traditional, rather monolithic, approaches to state capture: there are varying degrees of capture at the organizational level, there are different network formations of captured organizations with some forming densely connected communities, and these fundamental patterns of state capture dynamically change from 2009–2010 to 2011–2012 when a new government comes to power.
Linking State Capture Patterns to Elite Configuration
Whereas the previous section demonstrated the logic of measuring state capture in government contracting based on the network structure of corrupt transactions and actors, here we apply the framework to explore a simple hypothesis: the elite centralization of 2011–2012 in Hungary made captured organizations more central in the network (H1). The aim is merely to demonstrate the capacity of the proposed approach to contribute to hypothesis testing.
To formally test the centralization hypothesis, we look at how network position is associated with corruption risks as well as how organizational clusters are located at different network positions in the two periods. We use two intuitive concepts to gauge network position: closeness centrality and local clustering coefficient (Borgatti, Everett, and Johnson 2013; Opsahl 2013). Closeness centrality captures how far a given node is from all other nodes, as a node in the center of a graph is the one with the shortest distance from the rest of the graph. Local clustering captures the density of connections in any given node’s immediate network.
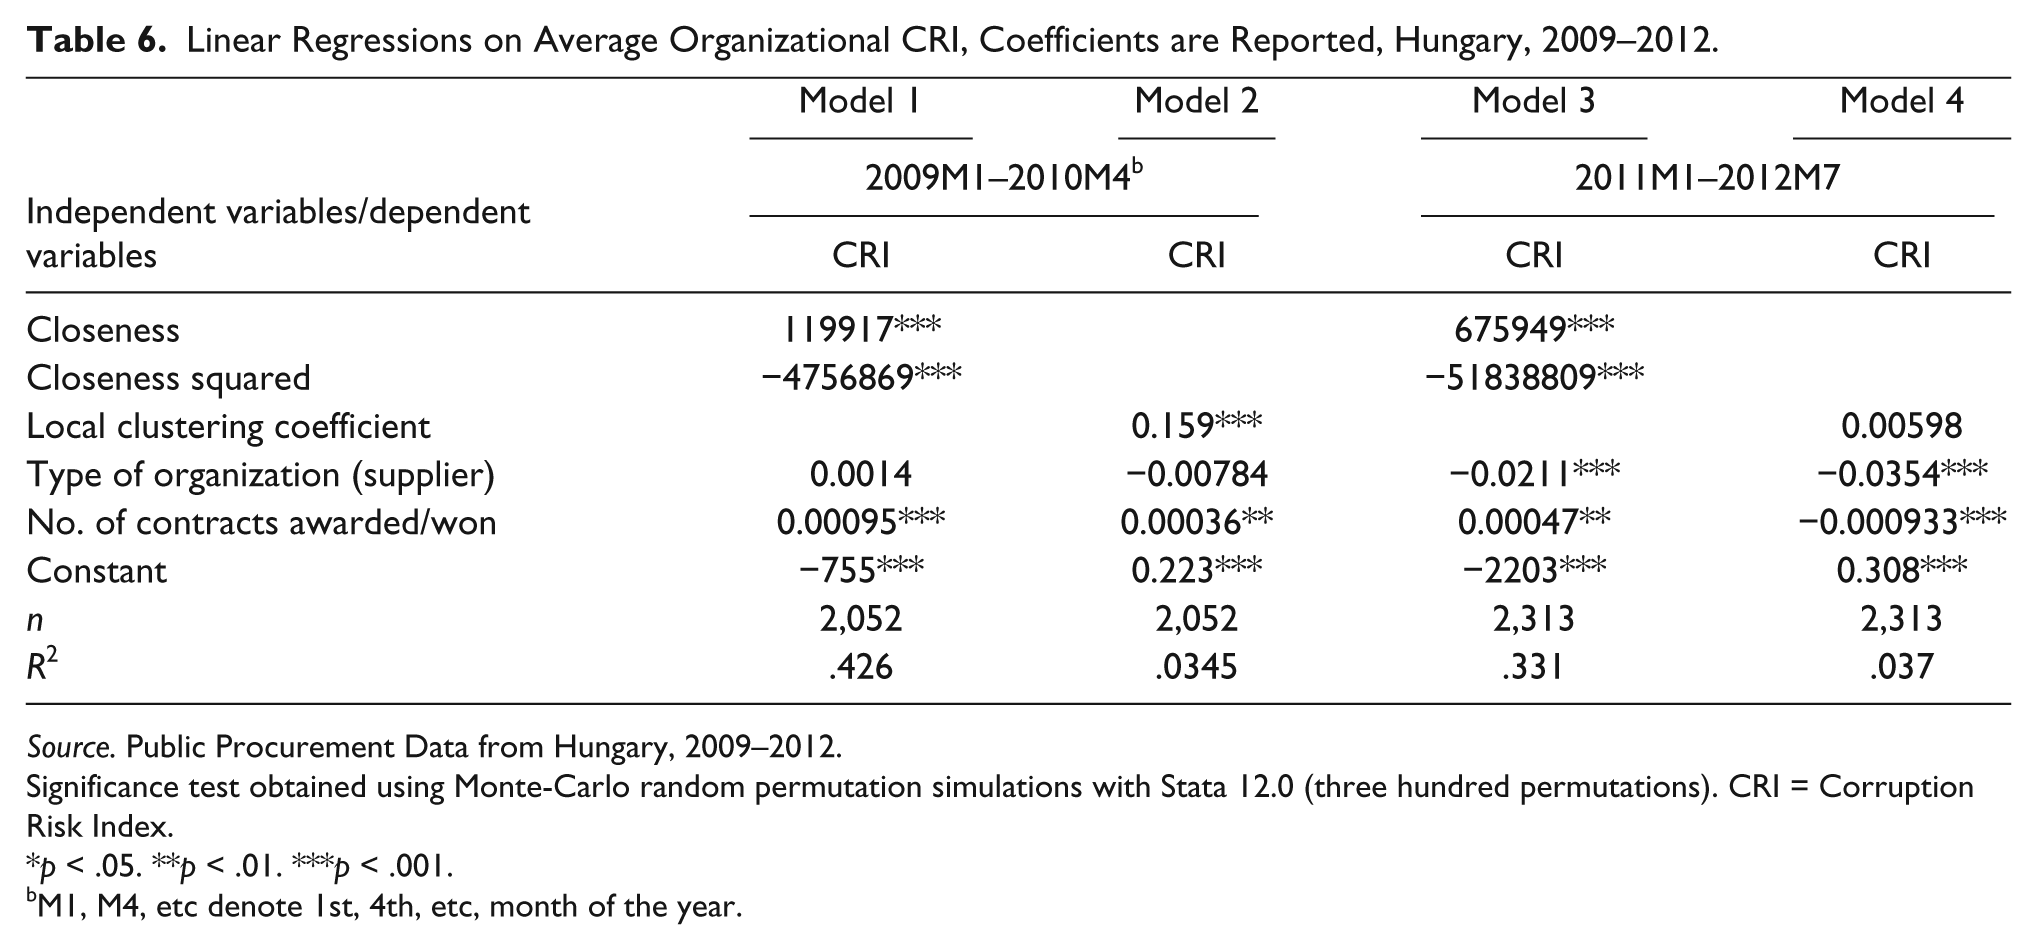
First, we regressed closeness 10 and local clustering on CRI while controlling for organization type and number of contracts awarded or received (Table 6). 11 Results point at the nonlinear and changing relationship over time between closeness centrality and corruption risks (Models 1 and 3). Closeness became a stronger predictor of CRI in 2011–2012 than in 2009–2010, with the upward sloping linear component becoming more than five times larger and the negative quadratic component also increasing in magnitude (see Online Appendix C for graphical representations of these changing nonlinear relationships). The association between local clustering and CRI changes even more distinctively: while the relationship is significant positive and strong in 2009–2010, it turns into very weak and insignificant in 2011–2012. Taken together, 12 the change of government changed the relationship between network position and corruption risks. On one hand, 2009–2010 was characterized by densely connected subcenters being the most corrupt, with central nodes being less corrupt. On the other hand, 2011–2012 was characterized by subcenters without any distinct corruption-risk level and central nodes becoming relatively more corrupt even though they remained less corrupt than the periphery. These associations, although very elementary and explaining only some of the total variance, lend some support to H1 with centralization and the break-up of local corruption clusters when the government changes. They also coincide with qualitative accounts of how the prime minister entering office in 2010 increasingly centralized decisions over government contracts, carefully sharing all major projects among two or three of his closest associates.
Linear Regressions on Average Organizational CRI, Coefficients are Reported, Hungary, 2009–2012.
Source. Public Procurement Data from Hungary, 2009–2012.
Significance test obtained using Monte-Carlo random permutation simulations with Stata 12.0 (three hundred permutations). CRI = Corruption Risk Index.
p < .05. **p < .01. ***p < .001.
M1, M4, etc denote 1st, 4th, etc, month of the year.
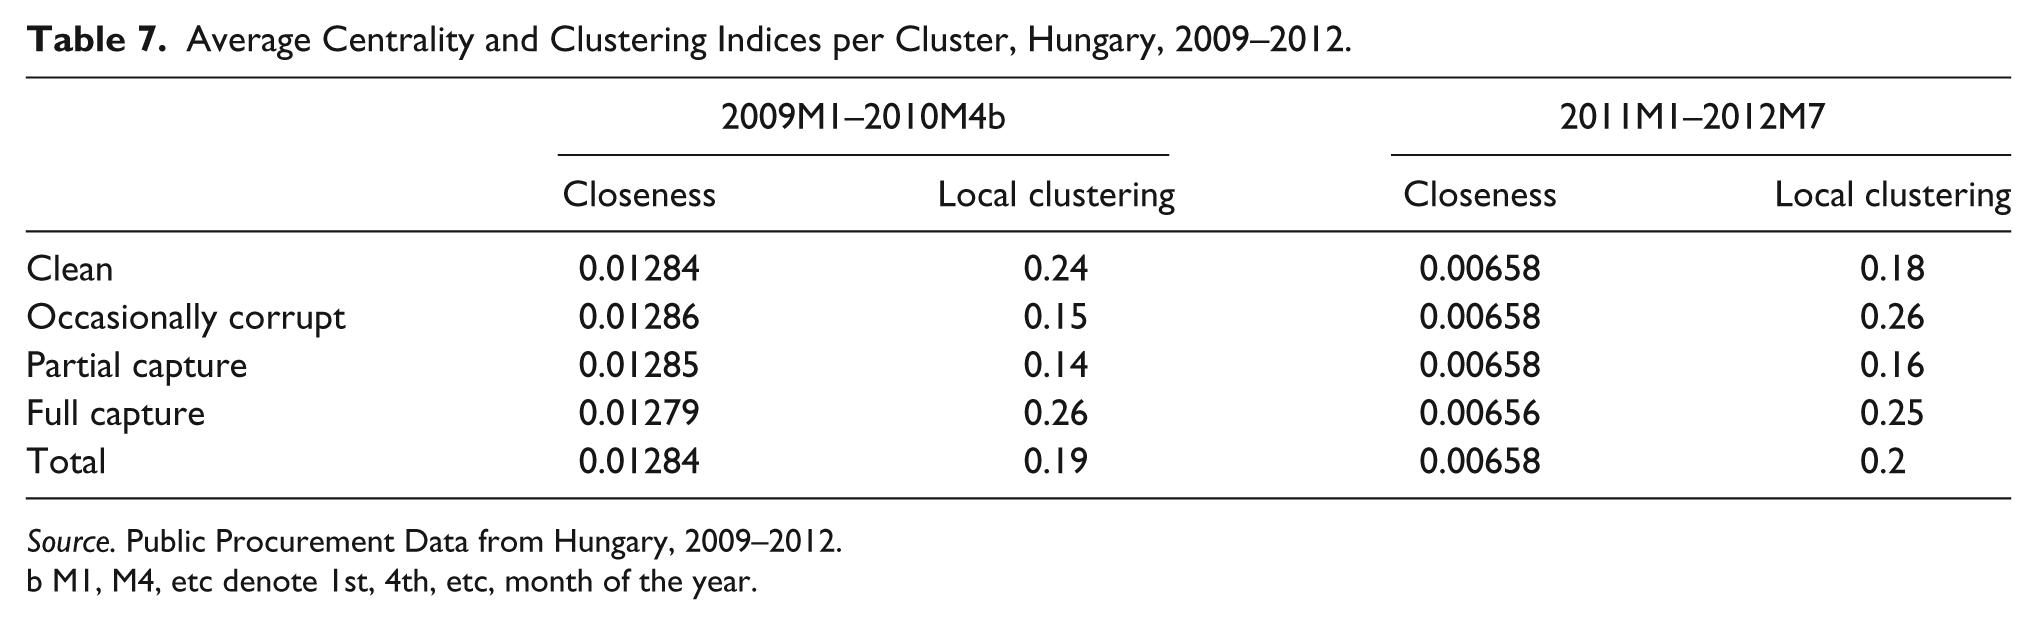
Second, we directly use the identified state capture formations by mapping organizational clusters’ average network position (Table 7). The above arguments in favor of H1 are further underpinned by the decreasing local clustering of the clean organization type, that is, noncaptured organizations became more dispersed across the whole network. Average closeness decreased markedly from 2009–2010 to 2011–2012, with fully captured organizations decreasing in their average closeness the least, that is, in terms of their relative position in the network, they became more central.
Average Centrality and Clustering Indices per Cluster, Hungary, 2009–2012.
Source. Public Procurement Data from Hungary, 2009–2012.
M1, M4, etc denote 1st, 4th, etc, month of the year.
Conclusions and Further Work
The discussion and analysis so far have pointed out the feasibility and usefulness of measuring corruption using transaction-level public procurement data and linking this corruption indicator to state capture. Further validating work should shed more light on the reliability and validity of this approach. Applying the measurement framework to a straightforward research problem provided further evidence for its relevance, although it was not possible to extensively test the centralization hypothesis.
Regarding the causal link between elite composition and the structure of state capture, there is a crucial limitation. It is unclear to what degree the centralization of corruption and state capture is the function of the reorganization of the public administration or the governing elite structure. These two events would have equivalent consequences in network terms, and they happened at the same time. However, differentiating the two causal pathways is irrelevant as long as the main concern is the change in state capture and the consequences it has for the society. In addition, as CRI primarily measures outright corruption and lack of competition, more sophisticated, organized forms of corruption remain largely undetected. If the structure of state capture and network position of corrupt transactions are related to the sophistication of corruption techniques, our results are likely to be biased.
State capture is established daily practice in approximately 60 percent of public sector organizations conducting public procurement in a relatively well-governed middle-income country, Hungary. Providing large amounts of external funding such as EU funds in such a governance context is likely to further increase rents extracted and captor groups’ capacity to compromise good governance (Fazekas, Chvalkovská, Skuhrovec, Tóth, and King, 2014). The systemic and networked nature of political corruption makes any administrative fixes to corruption likely to fail. Instead, a big-bang approach to anticorruption, that is, simultaneous reforms in every major policy area, may be a more realistic strategy (Rothstein 2011).
Footnotes
Acknowledgements
The authors would like to thank Johannes Wachs for research assistance, Tamás Uhrin for his database management work, and numerous colleagues commenting on earlier versions of this paper, in particular Alexander Kentikelenis, András Vörös, Ádám Szeidl, Elizabeth David-Barrett, Luciana Cingolani, Károly Takács, Lawrence Peter King, Martin Everett, and Silvia Ioana Neamtu.
Declaration of Conflicting Interests
The author(s) declared no potential conflicts of interest with respect to the research, authorship, and/or publication of this article.
Funding
The authors would like to express their gratitude for two EU funded projects at the Budapest Corvinus University (TAMOP 4.2.2.B and ANTICORRP (Grant agreement no: 290529)) which contributed to creating the database underlying this research.
Notes
References
Supplementary Material
Please find the following supplemental material available below.
For Open Access articles published under a Creative Commons License, all supplemental material carries the same license as the article it is associated with.
For non-Open Access articles published, all supplemental material carries a non-exclusive license, and permission requests for re-use of supplemental material or any part of supplemental material shall be sent directly to the copyright owner as specified in the copyright notice associated with the article.