
Abstract
Existing studies on the contemporary U.S. urban-rural divide have neglected its potential role in non-voting political participation. Theoretically, there are mixed expectations: for example, higher social capital in rural areas, alongside a generally older population, suggest rural areas should have greater political participation. Conversely, lower socioeconomic indicators and more physical distance barriers suggest the opposite. Using nationally stratified survey data from the 2018 CCES (N = 61,000) and 2020 CES (N = 60,000), we find that specific participation behaviors do not consistently vary across the urban-rural spectrum, controlling for demographic variables. The few consistently significant differences relate to the nature of location-based access. For instance, using 2020 and 2021 ACLED data, we find that an activity where non-rural residents participate more—protesting—occurs less often in rural areas, thus stymieing participation opportunities for rural and small-town residents. Alternatively, rural and small-town residents are consistently more likely to put up a sign, which may reflect a greater incidence of living in houses with yards compared to urban residents. Social media political participation behaviors do not yield urban-rural differences, further suggesting that once geographic access-related barriers are removed, participation rates are essentially similar across the urban-rural spectrum.
The vast majority of recent work on American urban-rural political differences focuses on voting patterns, partisanship, and political attitudes (Cramer Walsh 2012; Gimpel et al. 2020; Johnson and Scala 2020; Lunz Trujillo 2022; Lyons and Utych 2021; McKee 2008; Mummolo and Nall 2017; Munis 2020; Nelsen and Petsko 2021; Parker et al. 2018; Scala and Johnson 2017). This work points to rural areas being more right-wing or anti-establishment in nature, compared to non-rural areas. There is, however, a gap in understanding whether urban-rural differences in various forms of political participation exist, particularly among non-voting political behaviors. If there are indeed urban-rural variations in participation, this could impact to what extent urban-rural divisions in preferences are implemented. Such differences would also inform how disparate groups participate or not in politics, which could create group-based inequalities in representation. For instance, disproportionately high urban participation could edge out rural interests, or vice versa. How, then, does political participation in the contemporary United States differ across the urban-rural spectrum, if at all?
The theoretical expectations of urban-rural political participation suggest opposing effects. First, demographic differences (such as variation in age or education level across population density) may be driving urban-rural participation splits, though in different and sometimes countervailing ways. Second, rural areas tend to be higher in social capital—which is associated with increased political participation—compared to non-rural areas (Mazumdar et al. 2018; Putnam 2000, 205). Third, rural identity and rural resentment may impact rural participation, though it is unclear in which direction. Finally, there are differences in access to avenues of participation in rural versus non-rural areas based on location. For example, if protests tend to occur in urban centers, they would be much more accessible for a suburban or urban resident than for a rural resident, on average.
Due to these countervailing pressures on political participation, then, it is unclear whether political participation should be more prevalent among rural or urban residents. Or, it is also reasonable to expect a lack of urban-rural differences in political behaviors because these differing expectations may cancel out one another. In addition, many political behaviors can be accomplished regardless of location due to online, phone, and mail-based modes of participation, thus promoting similar access across geographic space, especially as the increased “nationalization” of politics in the United States minimizes sub-national opportunities for political participation (Hopkins 2018).
Using two nationally representative surveys of American adults, the 2018 Cooperative Congressional Elections Study (CCES; N = 61,000) and the 2020 Cooperative Election Study (CES, N = 60,000), we find that there are often no consistent differences in how rural/small-town versus suburban and urban residents participate in specific behaviors, particularly after controlling for individual-level demographic variables. Measuring rurality in terms of self-categorization versus a Census-defined place of residence does not result in systematic differences in descriptive self-identified participation rates.
Further, the two areas where there are consistent urban-rural differences are those where physical location comes into play: protesting and putting up a political yard sign. Rural areas have higher levels of residence in houses versus apartments, compared to non-rural areas (Mazur 2017); since rural residents are more likely to have a yard, there are more opportunities to put up a sign. Similarly, using data from the Armed Conflict Location and Event Data (ACLED) Project, we find that protests are moderately correlated with urbanicity in 2020 and 2021, even controlling for left-leaning respondents. 1 This provides additional evidence to our overall argument that the underlying mechanism for the few urban-rural non-voting behavioral differences relate to geographic location itself.
In other words, we find access to be key. Since many political behaviors can be done using the internet, phones, or mail, inherent differences in population density-related access are removed in nearly all political behaviors examined. The few differences that are robust to year (and controlling for other factors) relate to participation behaviors that still vary in access determined by physical location. In line with these results, we also find that there is no consistent difference in urban-rural political behaviors on social media once other factors are controlled for, at least among the mostly online samples used. In other words, once urban-rural differences in internet access and demographics are accounted for, political participation on social media does not vary across the urban-rural spectrum suggesting that there is no inherent difference once access to the internet is available.
Urban-Rural Differences in Voting Behavior and Partisanship
The most researched and discussed urban-rural political differences in the U.S. are vote choice and political affiliation. The U.S. urban-rural divide in vote choice has existed for quite some time—in the 1960s, there was approximately a 15-point difference in presidential vote share between the most and least population dense areas (Rodden 2019, 6)—though this division has especially widened since the mid-2000s (Gimpel et al. 2020; McKee 2008; Scala and Johnson 2017). In other words, there has been a longstanding and increasing trend of less population dense areas being more Republican and supporting right-wing candidates, while more population dense areas tend to support left-wing candidates and identify as Democrats (Gimpel et al. 2020).
Why is there an urban-rural difference in vote choice and partisanship? Typical explanations either posit demographic sorting, economic differences across the urban-rural spectrum, or deep-seated sociocultural differences and values. The first of these—demographic sorting—attributes the urban-rural divide to certain demographic groups being more prevalent in population sparse areas, while other groups tend to live in more population dense areas. Younger and more educated individuals are increasingly finding jobs in cities, and whites (especially older individuals) have been moving out of city centers or have remained in rural America (Kaufman 2019b; Rodden 2019). In other words, demographic groups disproportionate to rural areas also align neatly onto the Republican base, which tends to be, among others, whiter, male, lower in education level, more evangelical Christian, and so on. According to this line of thinking, then, the urban-rural divide results from geographic demographic sorting, with right-wing sympathizers increasingly moving to (or remaining in) rural areas, and left-wing supporters concentrating in urban areas (Bishop and Cushing 2009; Brown and Enos 2021). Though urban-rural political divisions to some extent are accounted for by differences in demographic makeup across population density, it is also worth noting that the prevalence of geographic sorting has been challenged empirically by different researchers (such as: Abrams and Fiorina 2012; Darmofal and Strickler 2016; Gimpel and Karnes 2006; Mummolo and Nall 2017).
The urban-rural divide may also be based on economic differences. An out-migration of educated workers alongside a poor recovery since the Great Recession in terms of county job, wage, and GDP growth (Pender et al. 2019) has caused some rural areas to experience flagging economic conditions (Kaufman 2019b; Wuthnow 2018) relative to non-rural areas. Rural-specific sectors, such as agriculture, manufacturing, and mining have been hit particularly hard after the Recession due to a commodity price drop, as well as long-term sector decline (Pender et al. 2019; Rodden 2019). Skills training and higher education could help mitigate some of these effects and diversify the economy. Unfortunately, the cost of getting a post-secondary education is high and especially difficult for people living in economically distressed zip codes, which are disproportionately rural. Economic distress has additional implications for politics. Recent economic trends help determine vote choice, particularly for swing voters (Achen and Bartels 2016). Although the overall economy had been doing better in the 2010s, this recovery was uneven and rural areas may have been voting according to more local economic conditions rather than national ones. For instance, Scala and col-leagues find that poorer and/or farming-dependent communities voted more conservatively, while amenity- or recreation-based rural economies voted more left-wing in the 2012 and 2016 elections (Scala and Johnson 2017; Scala et al. 2015).
Differences in values and culture also play a role in the urban-rural divide. Neighbors and friends influence one another’s political participation (Foos et al. 2021) and attitudes, and this may particularly be the case if people are in geographically isolated communities that tend to be demographically homogeneous (such as many rural areas and small towns) (Gimpel et al. 2020; Tam Cho and Gimpel 2012). Thus, geographic sorting may work alongside social influence to reinforce norms and values within communities. Rural residents tend to see urban residents as having different values from their own, and vice versa (Parker et al., 2018). For example, scholars have pointed to moral traditionalism, hard work, and common sense or anti-intellectualism as examples of these perceived value differences across the urban-rural spectrum in the United States, as well as cosmopolitanism outside the United States (Cramer Walsh 2012; Gimpel et al. 2020; Lunz Trujillo 2022; Lunz Trujillo and Crowley 2022; Maxwell 2020).
Such norms and values coalesce around a shared rural identity, or a psychological affiliation with rural areas. Recent work has argued that rural identity is based on resentment of urban centers and other out-groups, also known as rural resentment (Cramer Walsh 2012; Cramer 2016; Lyons and Utych 2021). Cramer’s (2016) work in particular finds that rural residents in Wisconsin feel that rural areas are forgotten by decision-makers and urban centers, that rural areas do not get their fair share of resources, and that rural areas are disrespected by others in society, all of which describe the concept of rural consciousness. Other research has found that rural residents have negative implicit and explicit affect to-ward urbanites (Lyons and Utych 2021), and that this negative affect may be particularly focused on certain subgroups of urbanites, such as perceived experts (Lunz Trujillo 2022) or racial minorities (Nelsen and Petsko 2021) for some white rural residents. Previous research also finds that rural areas feel more general place-based identity and resentment (Munis 2020) compared to urban and suburban areas. This resentment as political implications, such as heightened support for right-wing candidates, especially those perceived to be out-siders or anti-establishment, as the left is seen as the party of urban coastal elites and experts (Cramer 2016; Lunz Trujillo 2022). Further, these elites are perceived to favor lower-status groups, such as immigrants and people of color, who “cut in line” ahead of rural areas who feel forgotten or left behind (Lunz Trujillo 2021; Nelsen and Petsko 2021; Wuthnow 2018).
Potential Differences in Urban-Rural Political Participation
Given that we have some clear notions of why rural areas tend to be more right-wing and populist, what about urban-rural differences in political behaviors? Once again, rural (or urban) attitudes would have less of an impact on politics if various elements of participation lag among that group. Although there is a gap in the literature comparing urban-rural participation rates in recent years, a few studies have looked at either urban-rural differences in political participation rates from over a decade ago (Kaufman, 2019a) or have focused on rural participation rates without controlling for other factors (Thompson, 2021). In the former study, participation rates of rural areas have been found to be lower than those of urban areas generally. The latter study focuses on rural participation in relation to local media; data from 2018 reveal rural participation to be lower than urban participation generally, though in some cases, rural participation is higher (such as attending a public meeting). However, it is unclear whether these differences are accounted for by political or demographic factors, as only mean differences were presented. Further, both studies were limited to one way of measuring the urban-rural spectrum; differences in measurement strategy (i.e., various objective measures versus subjective identification measures) have been found to impact the results of political analyses (Lunz Trujillo 2022; Nemerever and Rogers 2021; Onega et al. 2020).
We identify a few different reasons that might drive urban-rural differences in behavior. These different reasons may work in countervailing ways, which would nullify urban-rural differences. First, rural residents tend to be lower in socioeconomic status and education level, on average, compared to their non-rural counterparts (Gimpel and Karnes 2006). Individual-level participation in politics stems from various factors, including disposable re-sources, time availability, civic skills or political knowledge (Brady et al. 1995), a sense of civic duty (Brady et al. 1995; Gerber et al. 2008), and interest in politics or an issue (Schlozman et al. 2018). Therefore, people who are older, have more income, and who are more highly educated—demographic groups that vary across the urban-rural spectrum—tend to participate more in nearly all types of political behaviors. Further, certain individuals and groups in society face barriers to participation, such as a lack of voting rights for felons or other restrictions on voting and participation. These barriers tend to disproportionately affect non-whites, people lower in socioeconomic status, and people who live farther away from points of participation (such as voting booth locations) (Brady and McNulty 2011; Hajnal et al. 2017; Wang 2012). Given that these factors vary across the urban-rural spectrum, such limitations may impact political participation differences by population density.
In addition, stronger social identification and group consciousness motivates some group members to gain rights or benefits for that group (Fowler and Kam 2007; Jardina 2019; Mason 2018). Often emotion plays a role in political participation, with some emotions—such as anger and enthusiasm—motivating certain types of participation and other emotions—such as fear—demotivating certain types of participation (Valentino et al, 2011). Group identification, however, might also be detrimental to participation if membership and identification with that group promotes lower feelings of political efficacy and agency (Farhart 2017). Accordingly, rural identity and resentment could demotivate people to participate because they feel disillusioned with and alienated from government (Kaufman 2019a, 2019b).
Accordingly, many of the negative social and economic trends in rural America could further contribute to the sense of decline and a loss of efficacy. However, literature on social group identification asserts that group identity, paired with political grievances, can motivate political engagement on behalf of the group through collective action via group consciousness (Dawson 1994; Jardina 2019). Rural identity or place identity should work in a similar fashion, particularly if it is motivated by out-group anger. Other research has found that rural areas have stronger levels of place attachment (Munis 2020), which corresponds to higher levels of political participation, especially when residents feel that this place is threatened (Mesch and Manor 1998). Thus, rural social identification and consciousness may either motivate or demotivate political activity.
Political participation also has a highly social dimension; participation is more likely if there are social pressures to participate (Sinclair 2013), if an individual is a part of a strong civil society (Schlozman et al. 2018), if an individual is socialized to participate and care about politics (Neundorf and Smets 2017), and if they are part of recruitment networks (Schlozman et al. 2018). All of these social factors relate to social capital, or “the connections among individuals’ social networks and the norms of reciprocity and trustworthiness that arise from them,” (Putnam 2000, 19), which has been found to positively correspond with higher levels of political participation (La Due Lake and Huckfeldt 2002; Putnam 2000; Teney and Hanquinet 2012). Younger individuals, women, non-whites, and people lower in education level and socioeconomic status tend to be less likely to participate due to some of these reasons (Brady et al. 1995; Burns et al. 2001; Dalton 2017; Schlozman et al. 2018). Rural areas tend to be higher in social capital compared to non-rural areas (Mazumdar et al. 2018; Putnam 2000, 205), so rural residents should correspondingly participate in politics more. Finally, religiosity—especially evangelism—tends to be higher in rural areas, which also corresponds with higher rates of political participation and social capital (Putnam 2000; Putnam et al. 2010). That said, rural areas may be behind urban areas in terms of participation rates due to a declining local media market, which is a key component of civic engagement (Thompson 2021).
Given that there are various and countervailing expectations for urban-rural differences in participation, we employ a set of competing hypotheses, which are as follows: • • •
In the above hypotheses, we test different types of specific behaviors rather than general participation. Drivers of participation can vary by the type of behavior, although many of the factors determining participation in one realm (such as voting) carry over to other forms of participation (Brady et al. 1995; Sinclair, 2013). This should be the case for many of the above potential reasons for urban-rural differences: for instance, higher social capital should encourage increased rates of several different types of political participation. However, some behaviors have unique correlates of participation likelihood. For example, protesting tends to occur more among the ideological left (Barker et al. 2021) while the participants of certain forms of protesting—namely, unconventional protests—tend to be more politically alienated and less socially and economically advantaged (DiGrazia 2014).
In other words, if urban-rural differences are driven by nearly all factors discussed above like identity or social capital, there should be a fairly even urban-rural difference across most to all behaviors examined, and/or these differences should become nullified once demographic and other variables are controlled for. That said, if certain types of political participation behaviors vary by population density and others do not once other variables are controlled for, then we postulate that the differences are driven by variations in physical access—the final major theoretical reasons for urban-rural variation discussed above. For instance, one would expect rural and small-town residents to be physically farther from organized protests (see Figure 9a), thus relating to diminished participation in protests among rural residents. Further, rural areas may slightly lag in internet access, which is potentially significant for certain specific behaviors over others given that campaign recruiting has moved online over time (Stern et al. 2011). That said, many types of online participation can be done through other means not dependent on physical location; contacting an elected official, for example, could occur online, over the phone, or by mail.
Data and Methods
To test our argument and hypotheses, we examine the political participation of rural/small town, suburban, and urban Americans using two large nationally stratified survey data sets of American adults: the Cooperative (Congressional) Elections Studies (C(C)ES) fielded in 2018 (N = 61,000) 2 and in 2020 (N = 60,000). 3 These data sets are part of a longstanding data collection initiative to study political attitudes and behaviors surrounding Congressional elections in the United States. Of the many questions that the survey asks of participants, we are interested in the political participation battery and place of residence, both based on the participant’s own description and as recorded by their zip code with which they are registered to vote. 4
The political participation battery includes a list of actions that often involve more time, money or civic skills than voting to expend or acquire. The actions that are captured by the C(C)ES data set include the following
5
: • Attend local political meetings • Put up a political sign • Work for a candidate or campaign • Attend a political protest, march, or demonstration • Contact a public official • Donate money to a candidate, campaign, or political organization • Donate blood • None of these
In addition, we examine the different options in the social media participation battery in both the 2018 and 2020 versions of the survey:
6
• Posted a story, photo, video, or link about politics • Posted a comment about politics • Followed a political event • Forwarded a story, photo, video, or link about politics to friends • Read a story or watched a video about politics
To establish a baseline, we also included a dichotomized variable to reflect voting in the November General or Midterm elections using the participant’s self-reported voting behavior. This variable, along with those in the political participation battery constitute our outcome variables for the statistical analyses. Specific question wordings can be found in Supplemental Appendix A.
For the independent variables, we consider place of residence using subjective (i.e., respondent self-identification) and objective measures, as previous literature finds wide variation in who is rural, suburban, or urban depending on the measure used (Nemerever and Rogers 2021; Onega et al. 2020). To measure place of residence subjectively, we use the self-reported description of a participant’s community as recorded in their C(C)ES response. For an objective measure, we borrow from the theoretical framework established by Nemerever and Rogers (2021) and Onega et al (2020) by using the Rural-Urban Commuting Area Codes (RUCA) as a measure of a participant’s objective place of residence. 7 We merge the C(C)ES response data with the RUCA codes based on the respondent’s zip code as recorded by the survey for vote validation. We collapse this continuous RUCA measure to a four-category score to resemble the levels of the self-reported place of residence deceptions in the survey.
To assess non-voting participatory behavior, we conduct logit regressions with each variable on the political participation battery along with the dichotomous voting variable as the dependent variable. Our main independent variable is self-reported place of residence. In each of the models, we control for several variables that, based on previous literature, relate to either rural political outcomes, or that potentially explain a link between rurality and political behavior. These control variables include racial resentment, partisanship, ideology, RUCA score, education, income, gender (female = 1), age, race, and church attendance. Each reported value reflects the odds ratio and standard error.
To provide evidence for our theoretical argument emphasizing the role of physical location and access—that urban versus rural residents vary in engagement across select major political participation opportunities on the basis of the geographic restraints in doing so—we leverage the Armed Conflict Location and Event Data (ACLED) Project data set on protests in the United States in 2020 and 2021 to see whether there are indeed fewer protests in the rural areas compared to the urban areas. 8 Since these data are geocoded, we use the provided latitude and longitude points to map onto county boundaries. 9 Here, we use the Rural Urban Continuum Codes (RUCC) to determine the actual number of protest opportunities available to people at reasonable distances from their place of residence.
Results
To test our hypotheses, we utilize descriptive statistics and logit regression models for both 2018 and 2020. The analyses and results for each year are provided separately, given that the type of election differs between years (midterm versus presidential), and that 2020 was idiosyncratic for several other reasons (such as factors relating to the pandemic). We first discuss the descriptive statistics and follow this with the results of the regressions.
First, we examine the proportions of respondents who participate in politics through each of the behaviors by data set (either the CCES 2018 or the CES 2020) and mode of measuring residency (self-described, RUCA codes). Figures 1a and 1b display this information for the 2020 data. Attending a protest, working on a campaign, and donating money are lower for rural residents compared to urban residents in both residency measures. Conversely, putting up a sign is consistently higher among rural residents, as is voting for self-described rural residents only. There are no meaningful or consistent urban-rural differences for attending a meeting, contacting a public official, donating blood (except in 2018, where rural participation is lower), and the “none of these” category. Descriptive Statistics for CCES 2020 General Participation.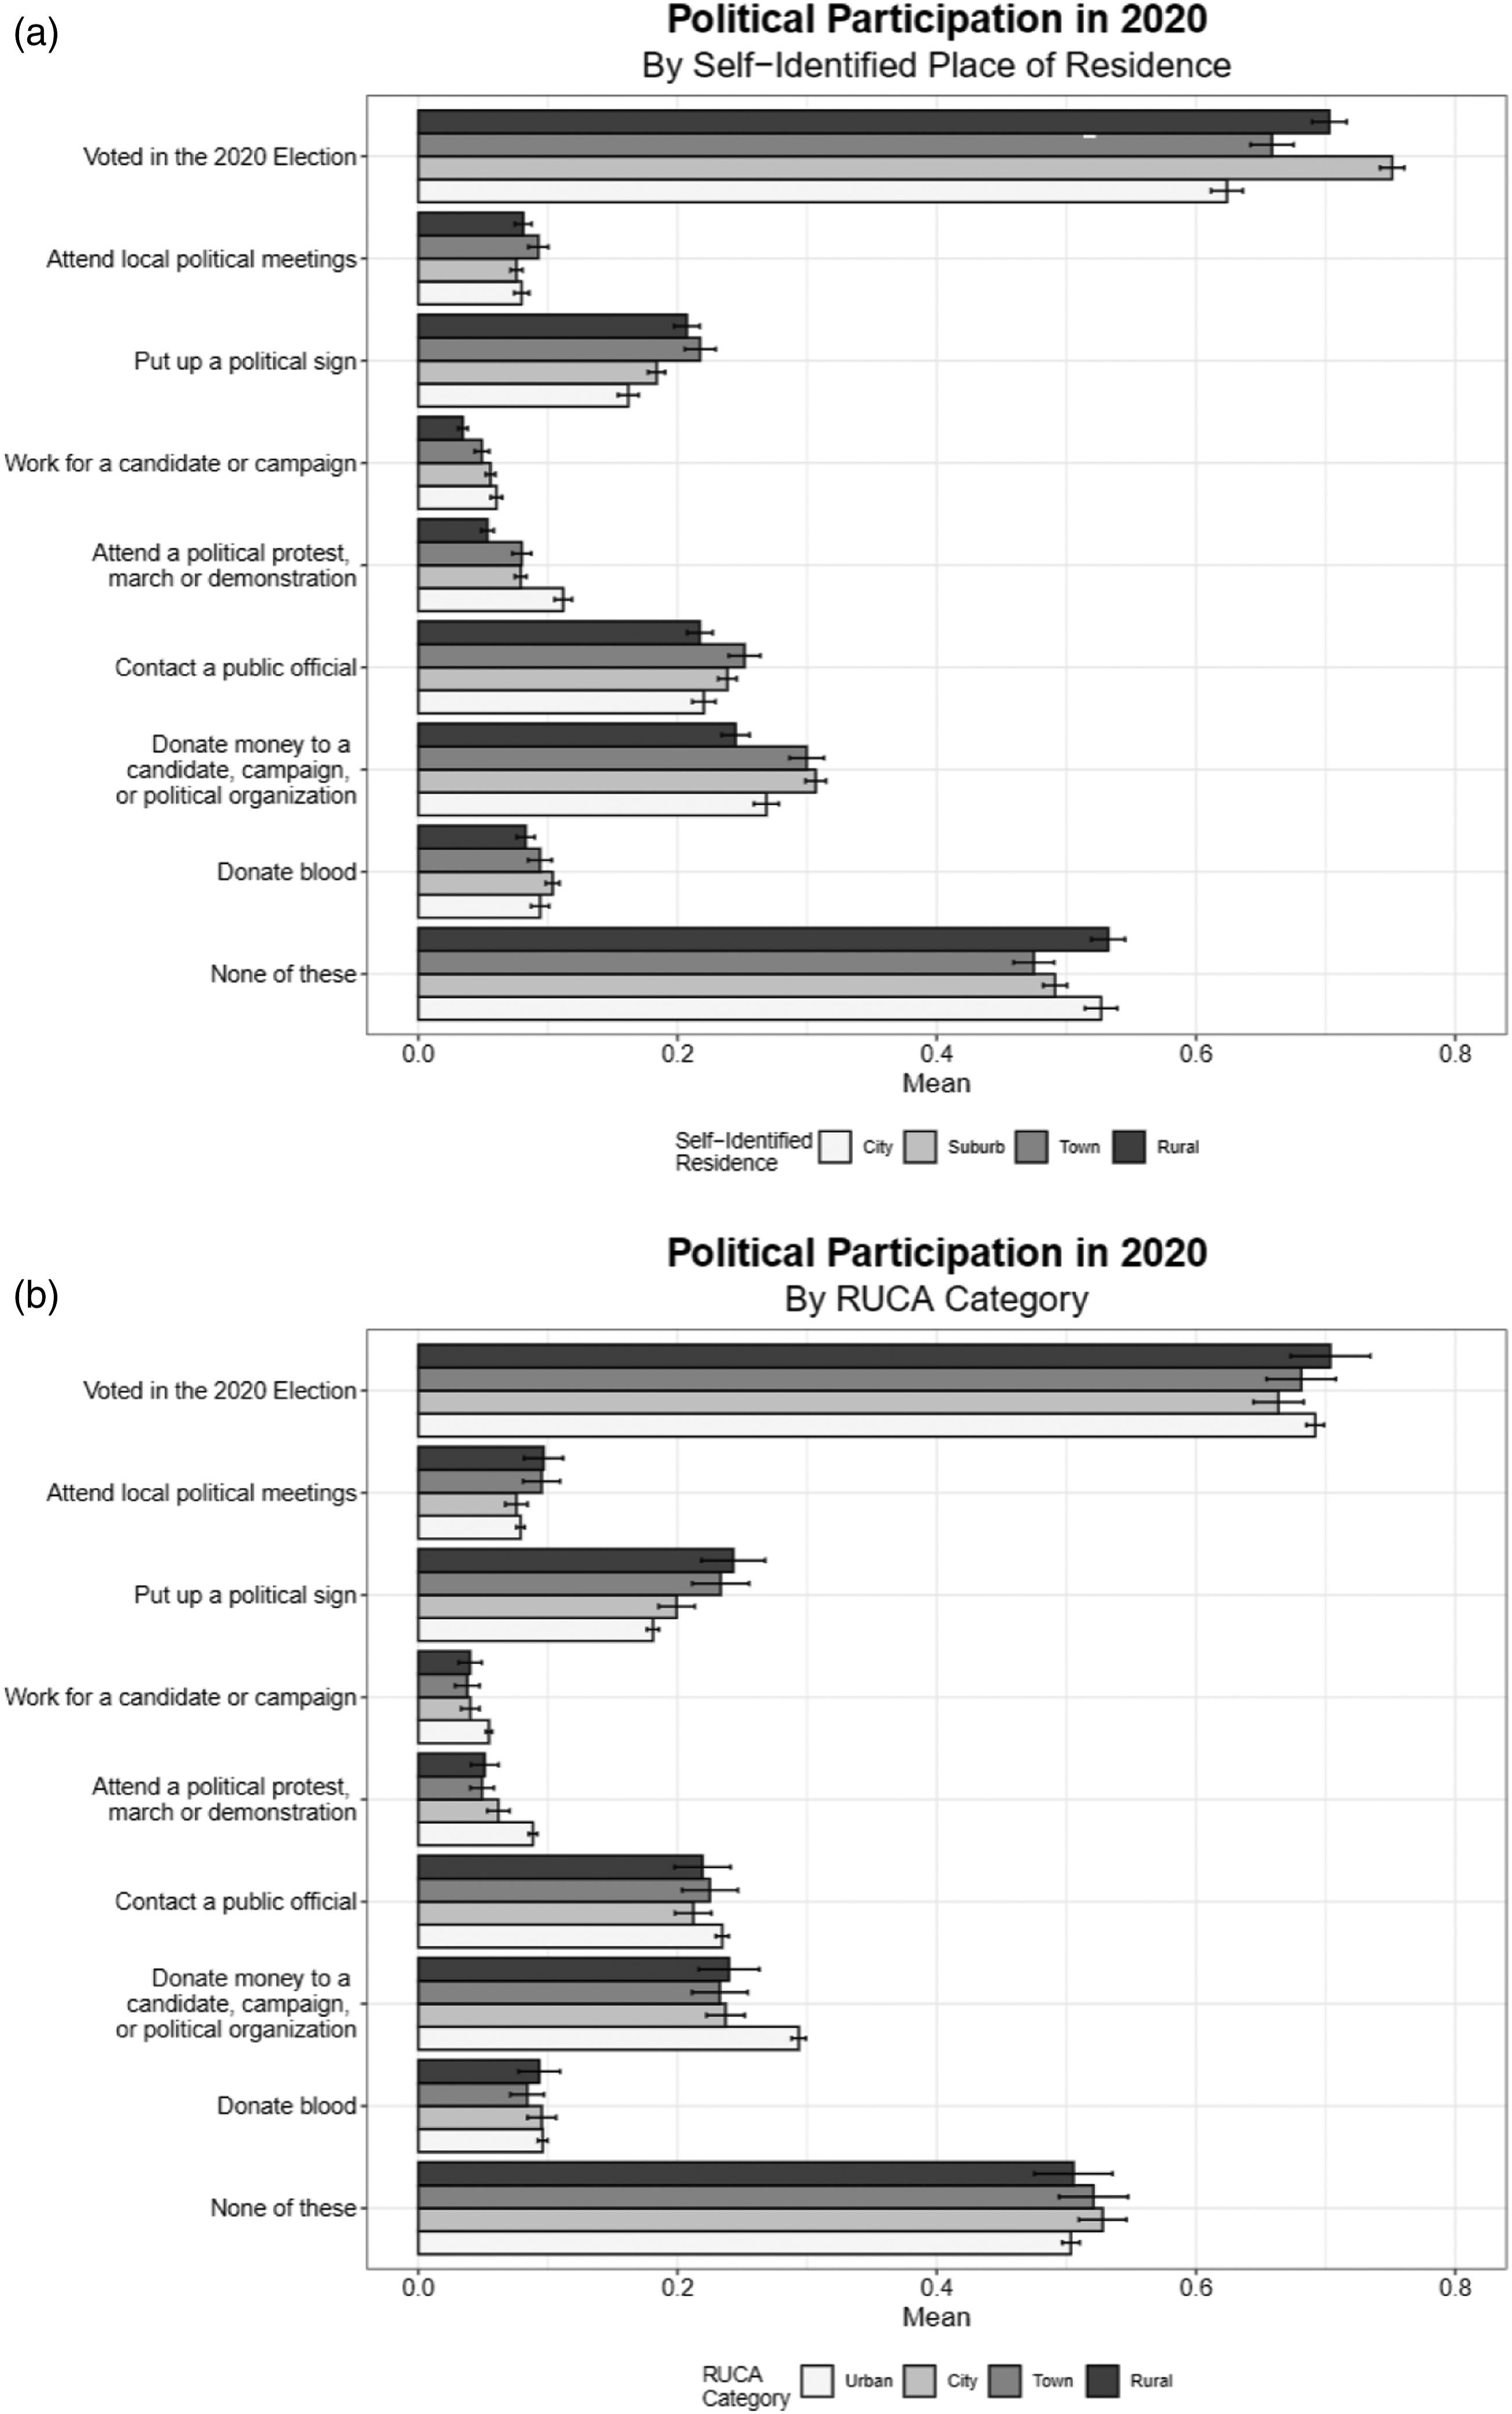
Turning to the social media behaviors in Figures 2a and 2b, compared to rural and/or small-town residents, urban residents are more likely to post media about politics (for self-identified residence only), post comments about politics (RUCA only), read a story or watch a video about politics (self-identified residence only), and follow a political event online. However, these differences are for the most part substantively small.
10
Descriptive Statistics for CCES 2020 Social Media Participation.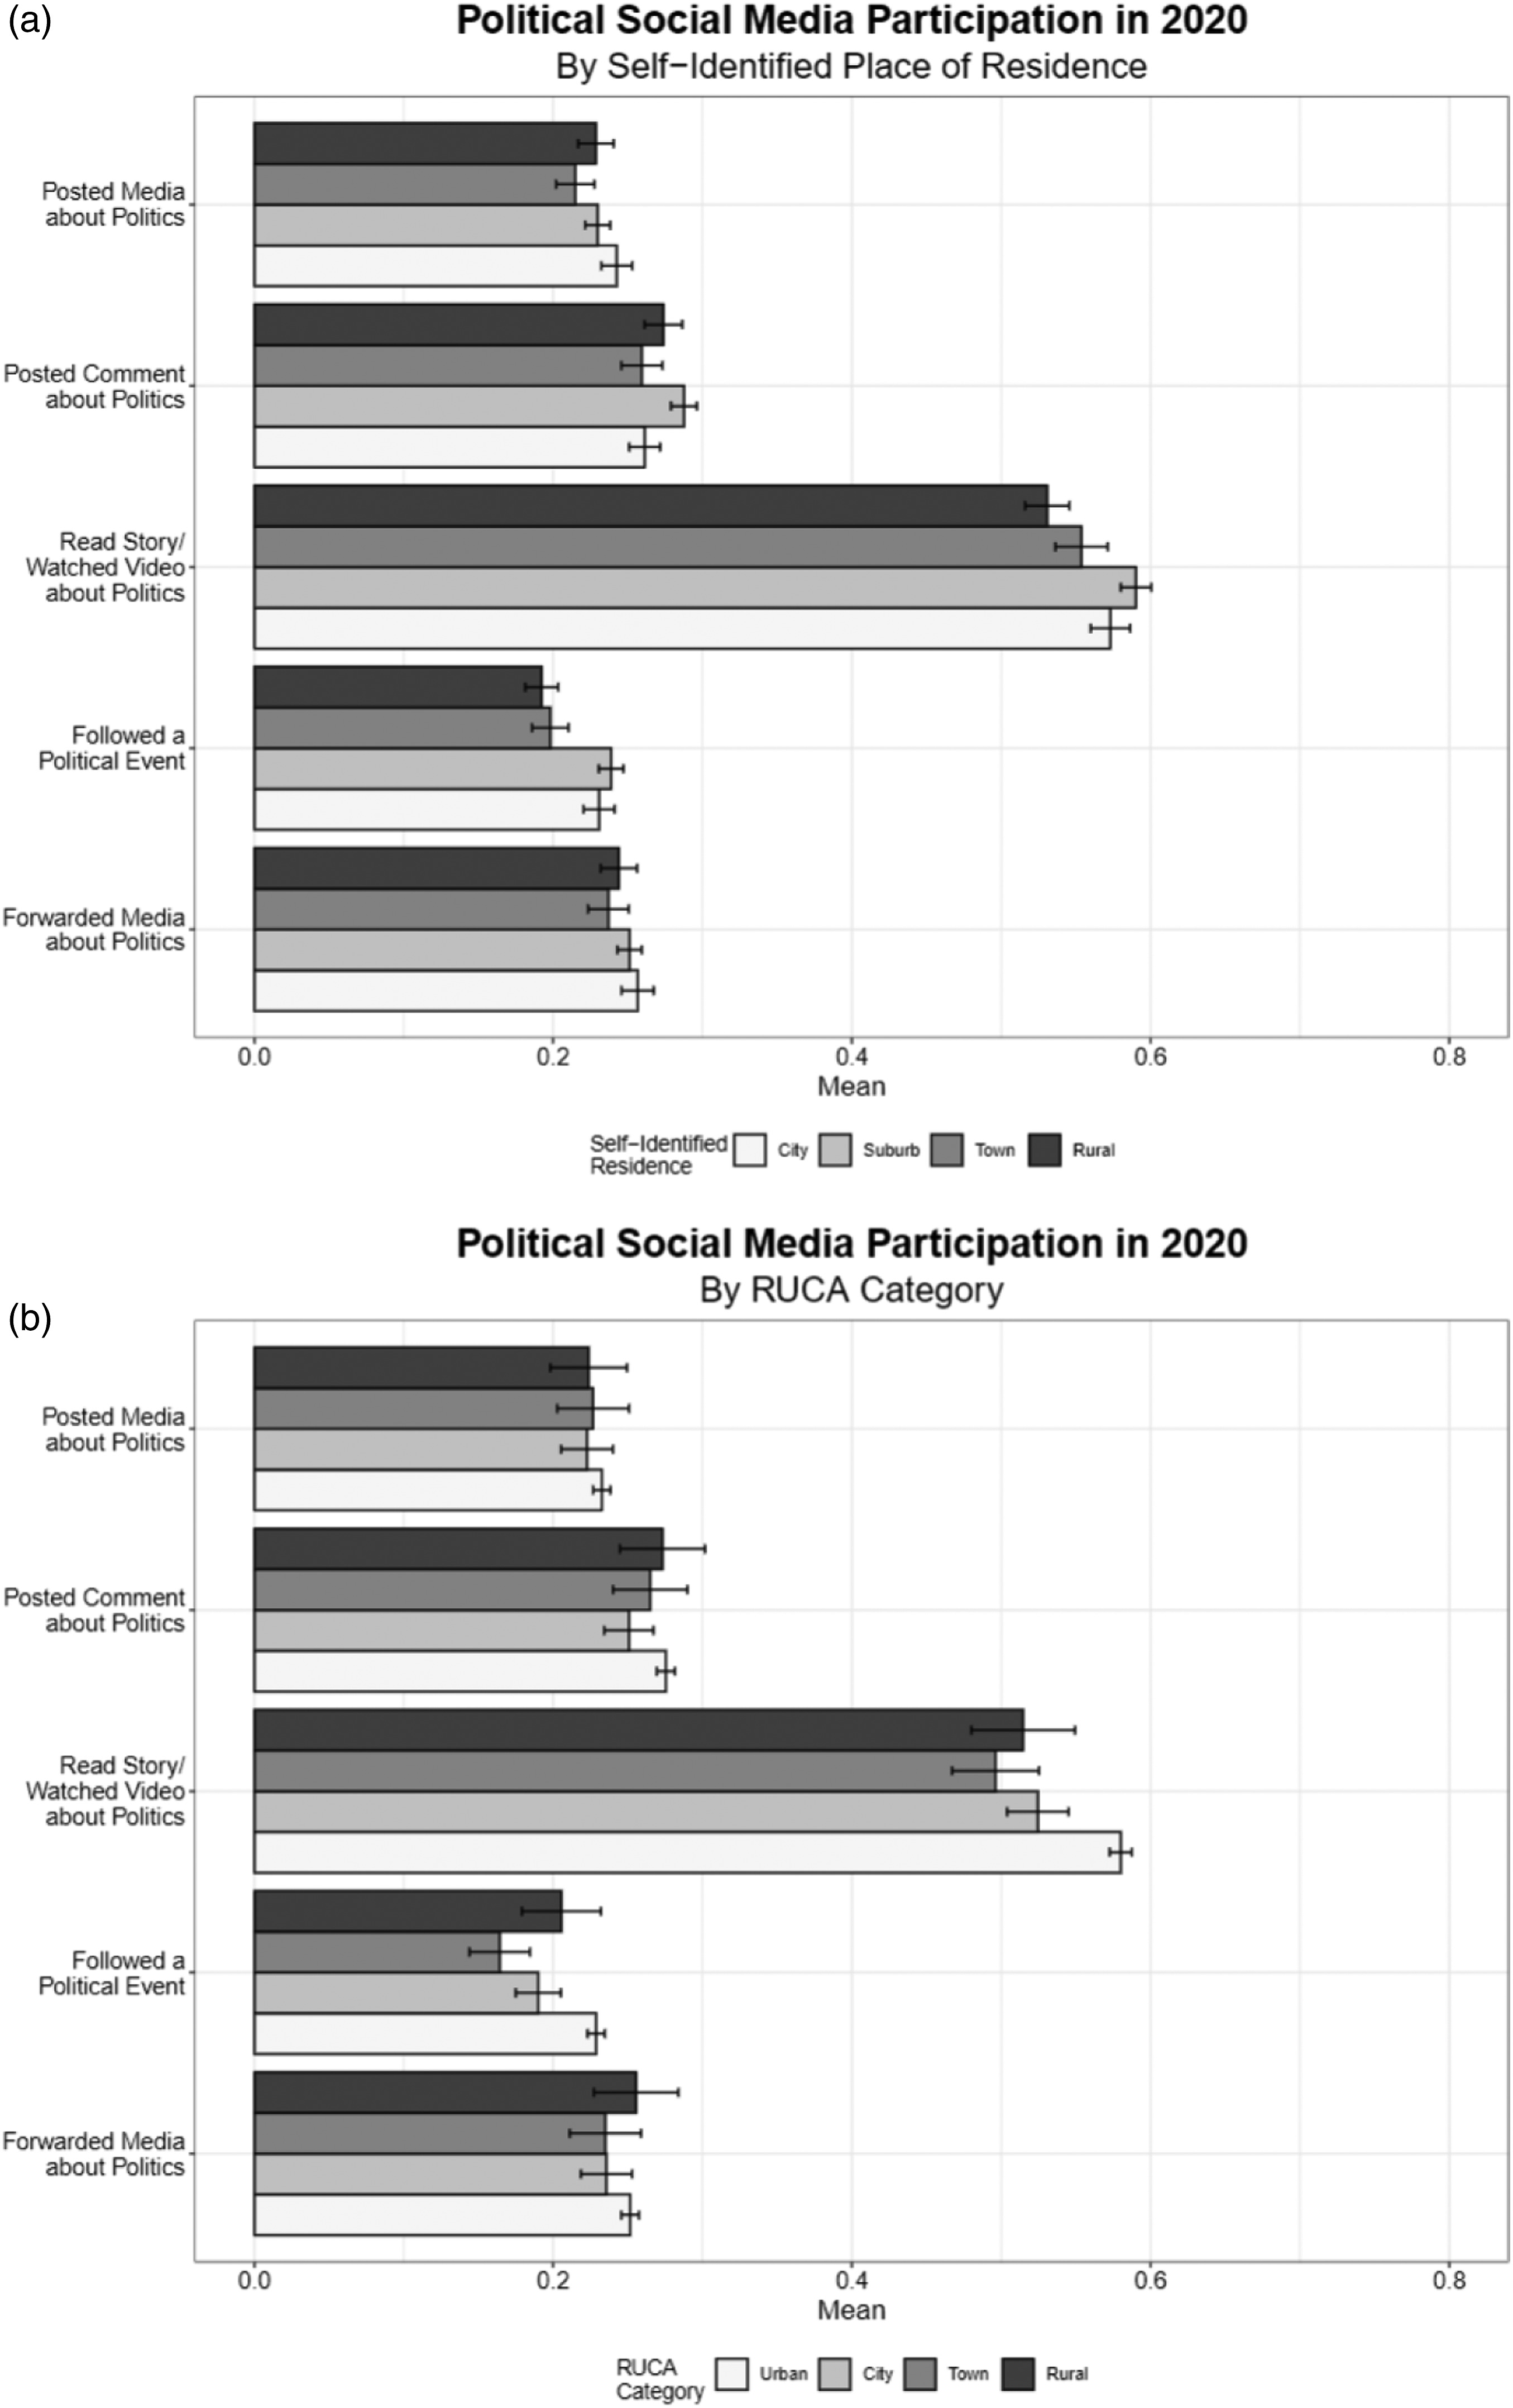
Next, we turn to the 2018 data. Figures 3a and 3b display the mean participation scores for the standard participation items, by urban-rural designations. Attending a protest, working on a campaign, and donating money are consistently lower for rural residents in both residency measures. Conversely, compared to urban residents, putting up a sign is consistently higher among rural residents, as is voting for self-described rural residents only (though it is higher for RUCA-designated small-town residents). There are no meaningful or consistent urban-rural differences for attending a meeting, contacting a public official, donating blood, and the “none of these” category. Descriptive Statistics for CCES 2018 General Participation.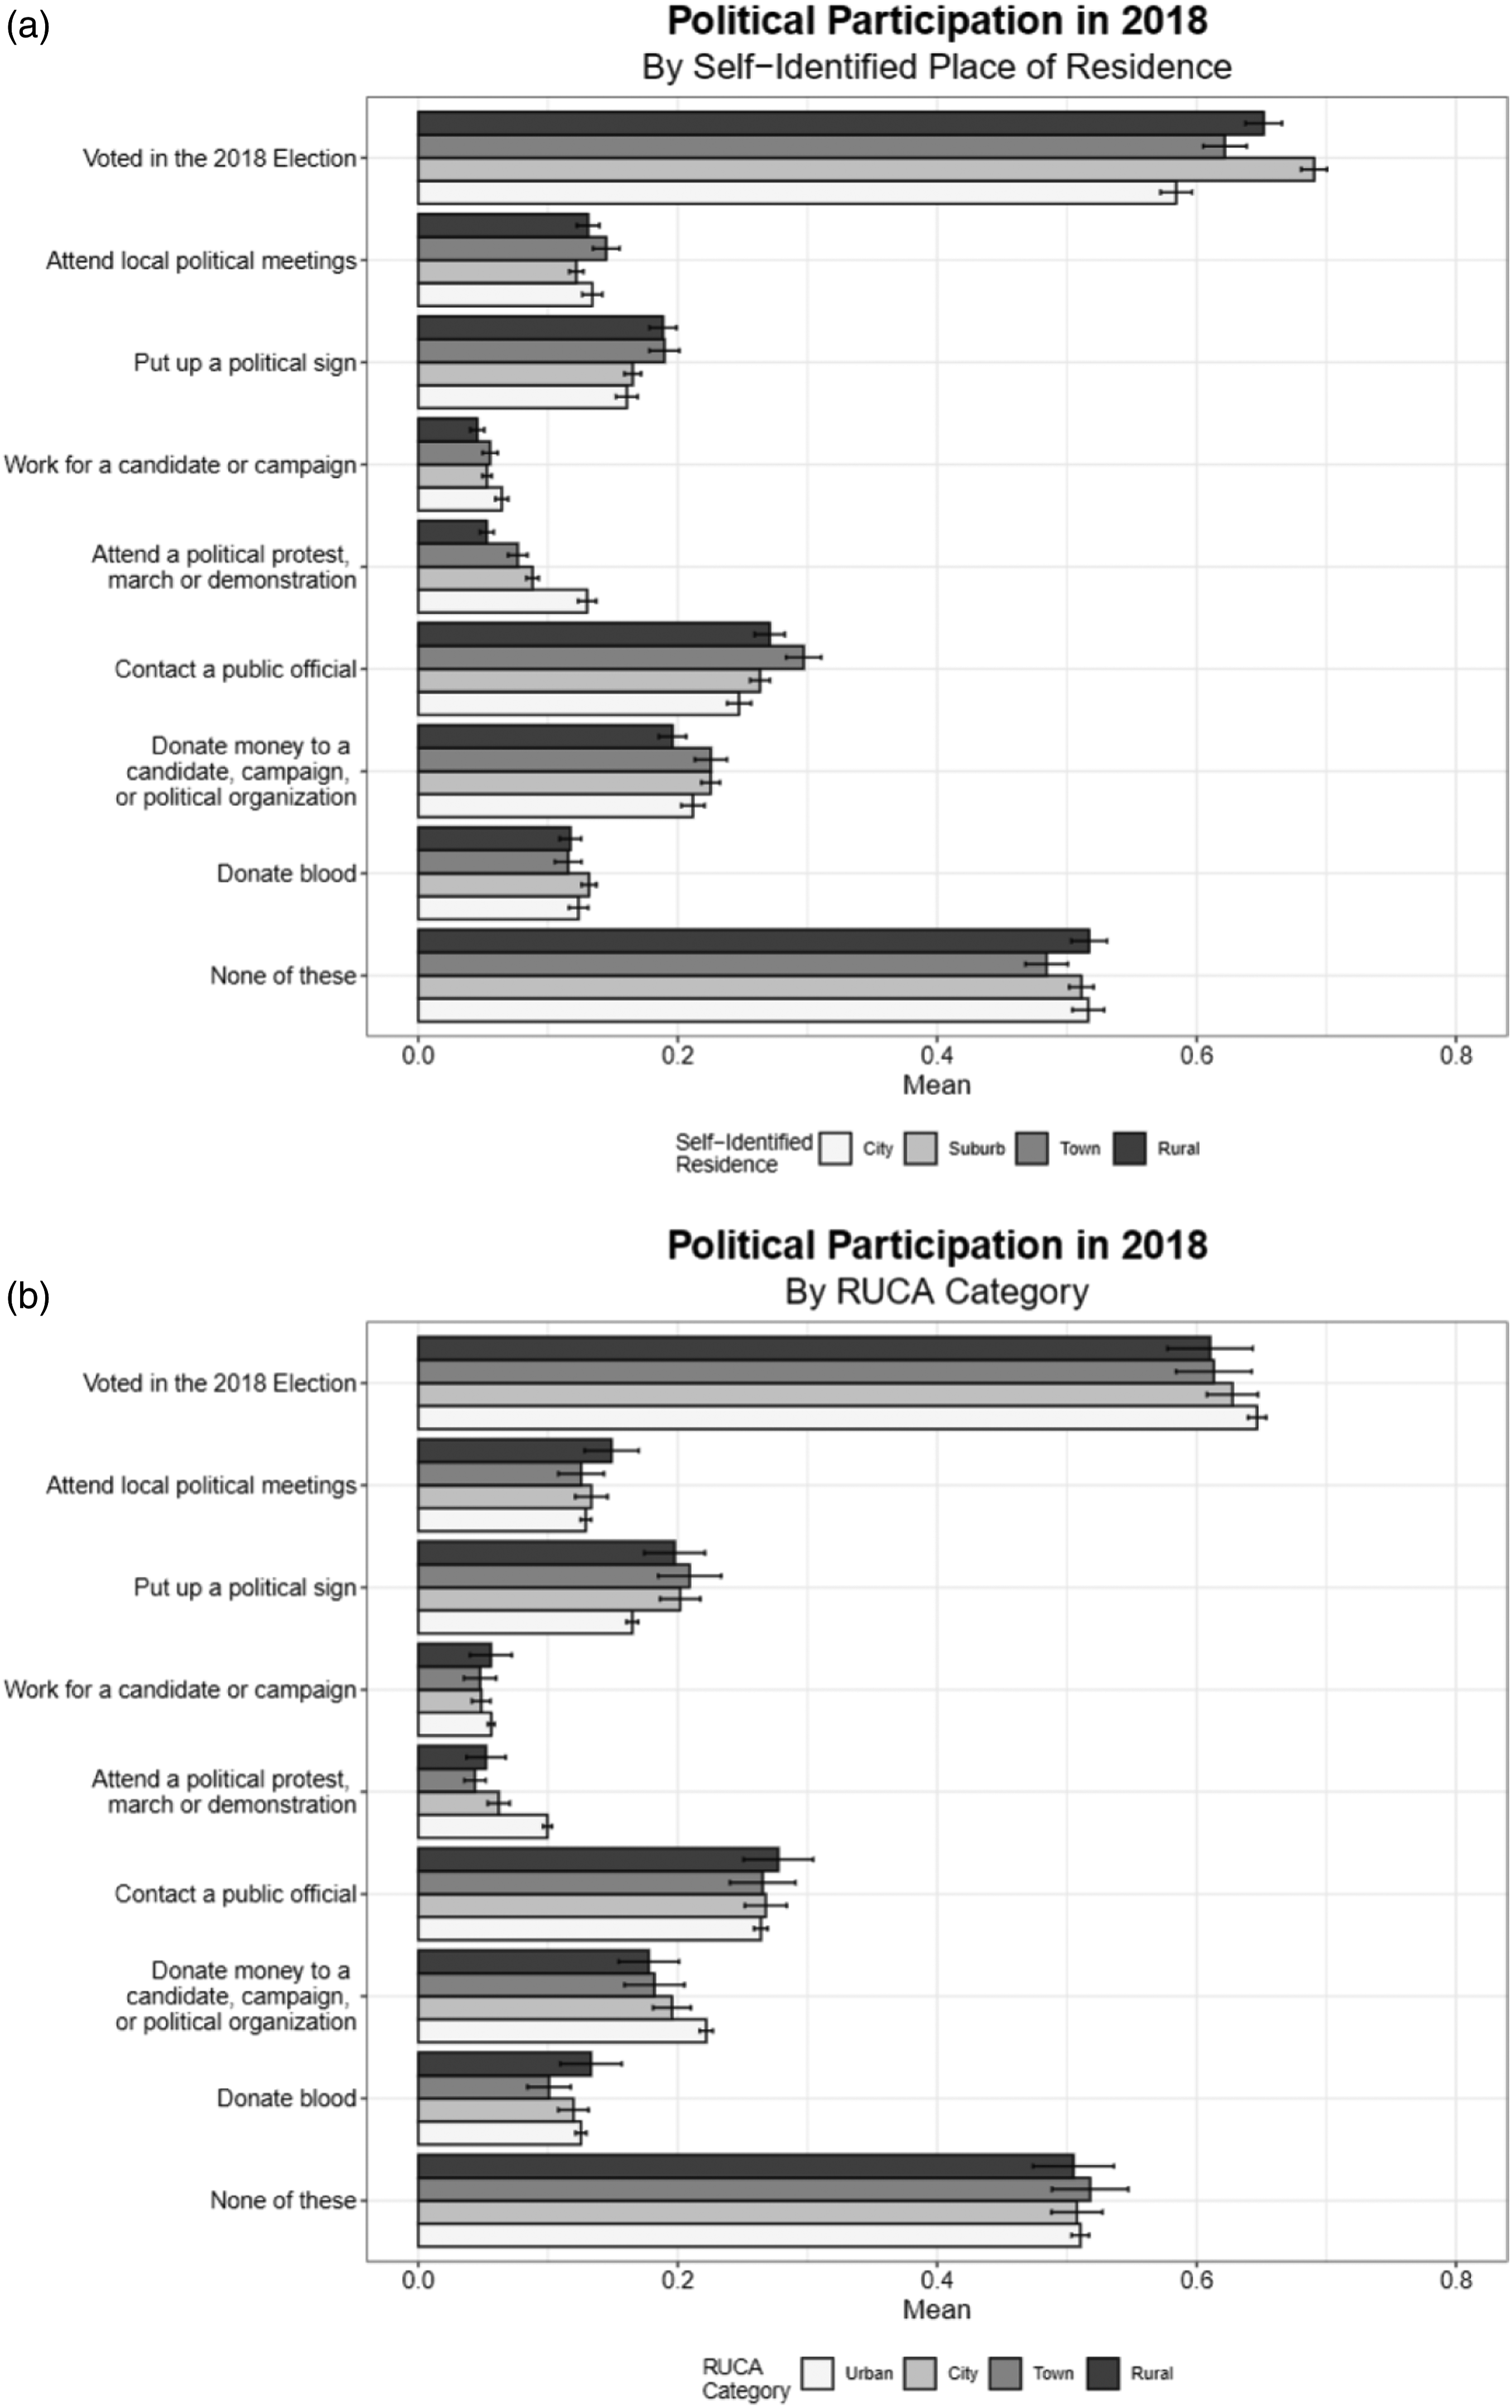
Figures 4a and 4b show the mean participation scores for social media or online political behaviors by urban-rural designation. Rural residents were less likely to have read a story or watched a video about politics compared to urban residents. Descriptive Statistics for CCES 2018 Social Media Participation.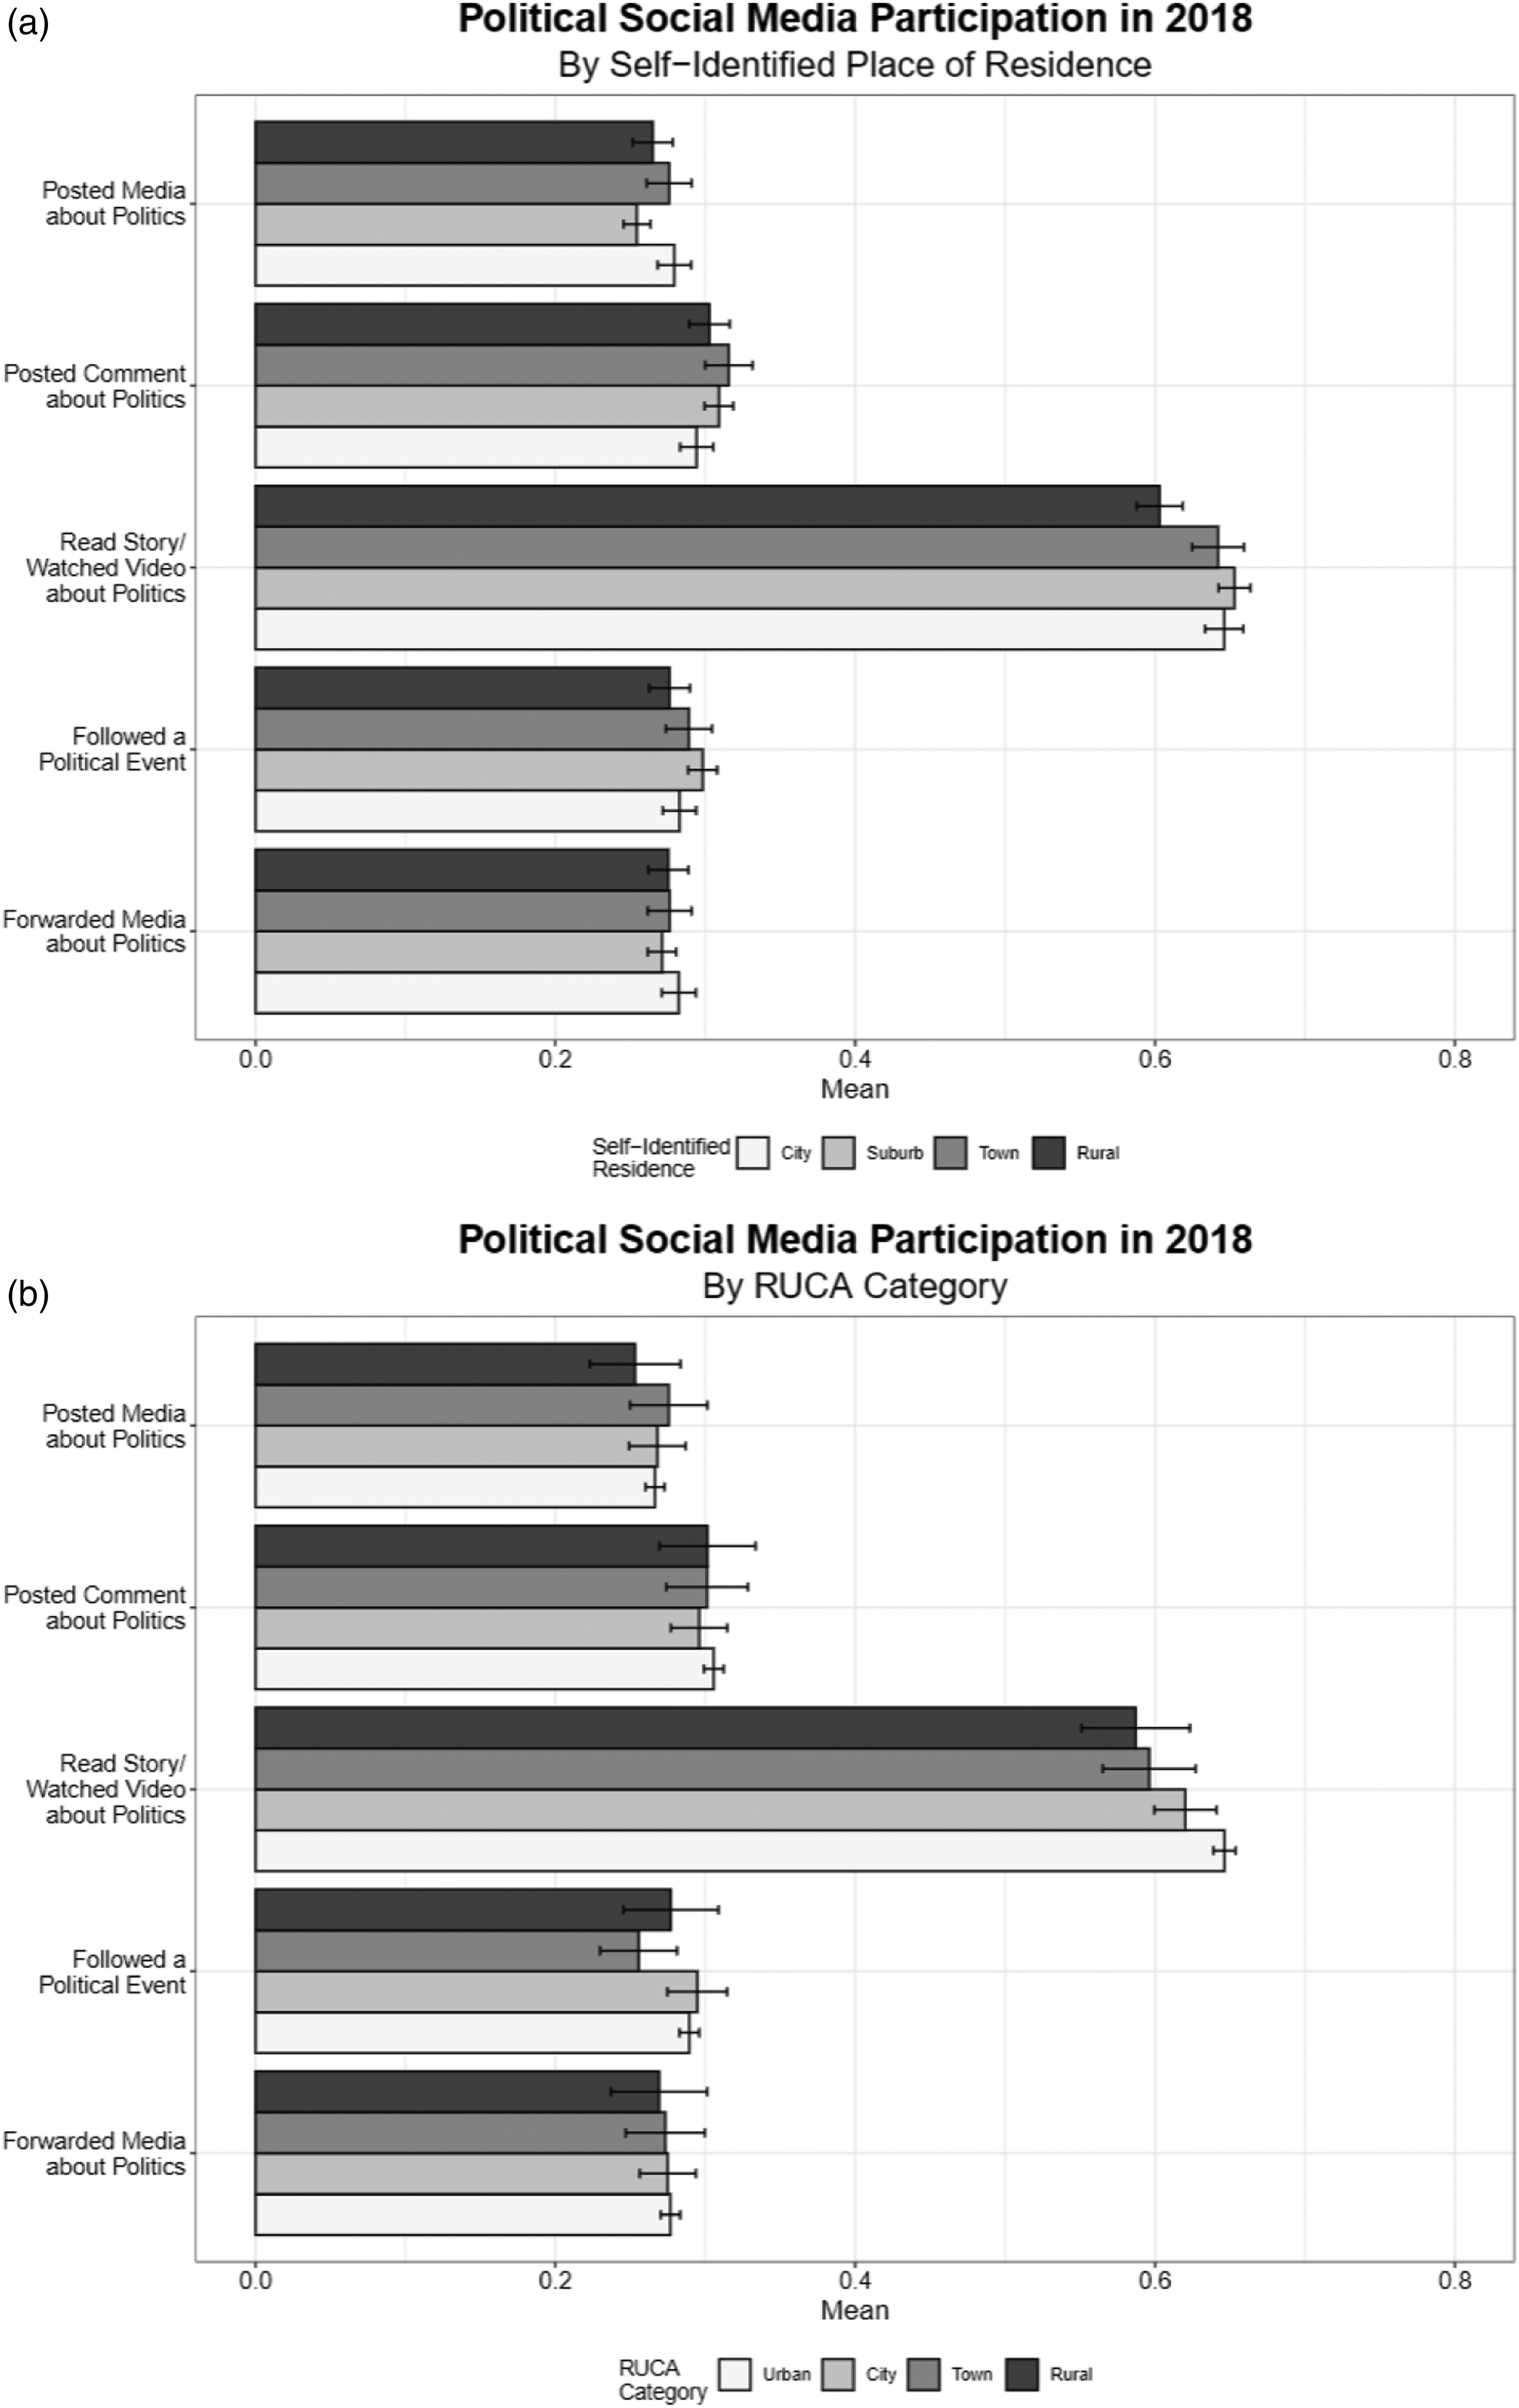
Then, we determine whether any of these differences hold controlling for demographic or social factors that differ across the urban-rural spectrum, and that could account for differences in participation (such as age, income level, etc.). We introduce logit regression models to understand the relationships between residence and political participation.
11
Figure 5 shows these results for the standard political participation items in the 2020 CES data. Here, rural or small-town residency does not significantly differ from urban or suburban residents in predicting voting or contacting elected officials. This suggests that the rural tendency to vote more (as per the descriptive statistics shown above) is accounted by the control variables. Rural residents or small-town residents are more likely to attend a meeting, put up a sign, or donate blood (RUCA only). They are significantly less likely to attend a protest (self-described only), work for a campaign (self-described only), or indicate that they have not participated in any of these political activities (self-described only)—that is, rural and small-town respondents are more likely to have done at least one activity compared to urban residents. Donating money varies by residency measure: rural and small-town identifiers are 1.1 times more likely to do so while small-town and rural individuals are less likely to do so (though the rural designation is not statistically significant while the small-town measure is). Odds Ratios for Logistic Regressions for Political Behaviors in 2020.
Figure 6 shows the logit regression results predicting participation in different political behaviors online or on social media for the 2020 CES data. We find that self-identified rural and small-town residents are significantly less likely to follow a political event, and self-identified rural residents are significantly more likely to have read a story or watched a video about politics (controlling for other factors). In addition, small-town residents (as defined by RUCA codes) are significantly less likely to have followed a political event on social media or to have read a story/watched a video about politics. Odds Ratios for Logistic Regressions for Social Media Political Behaviors in 2020.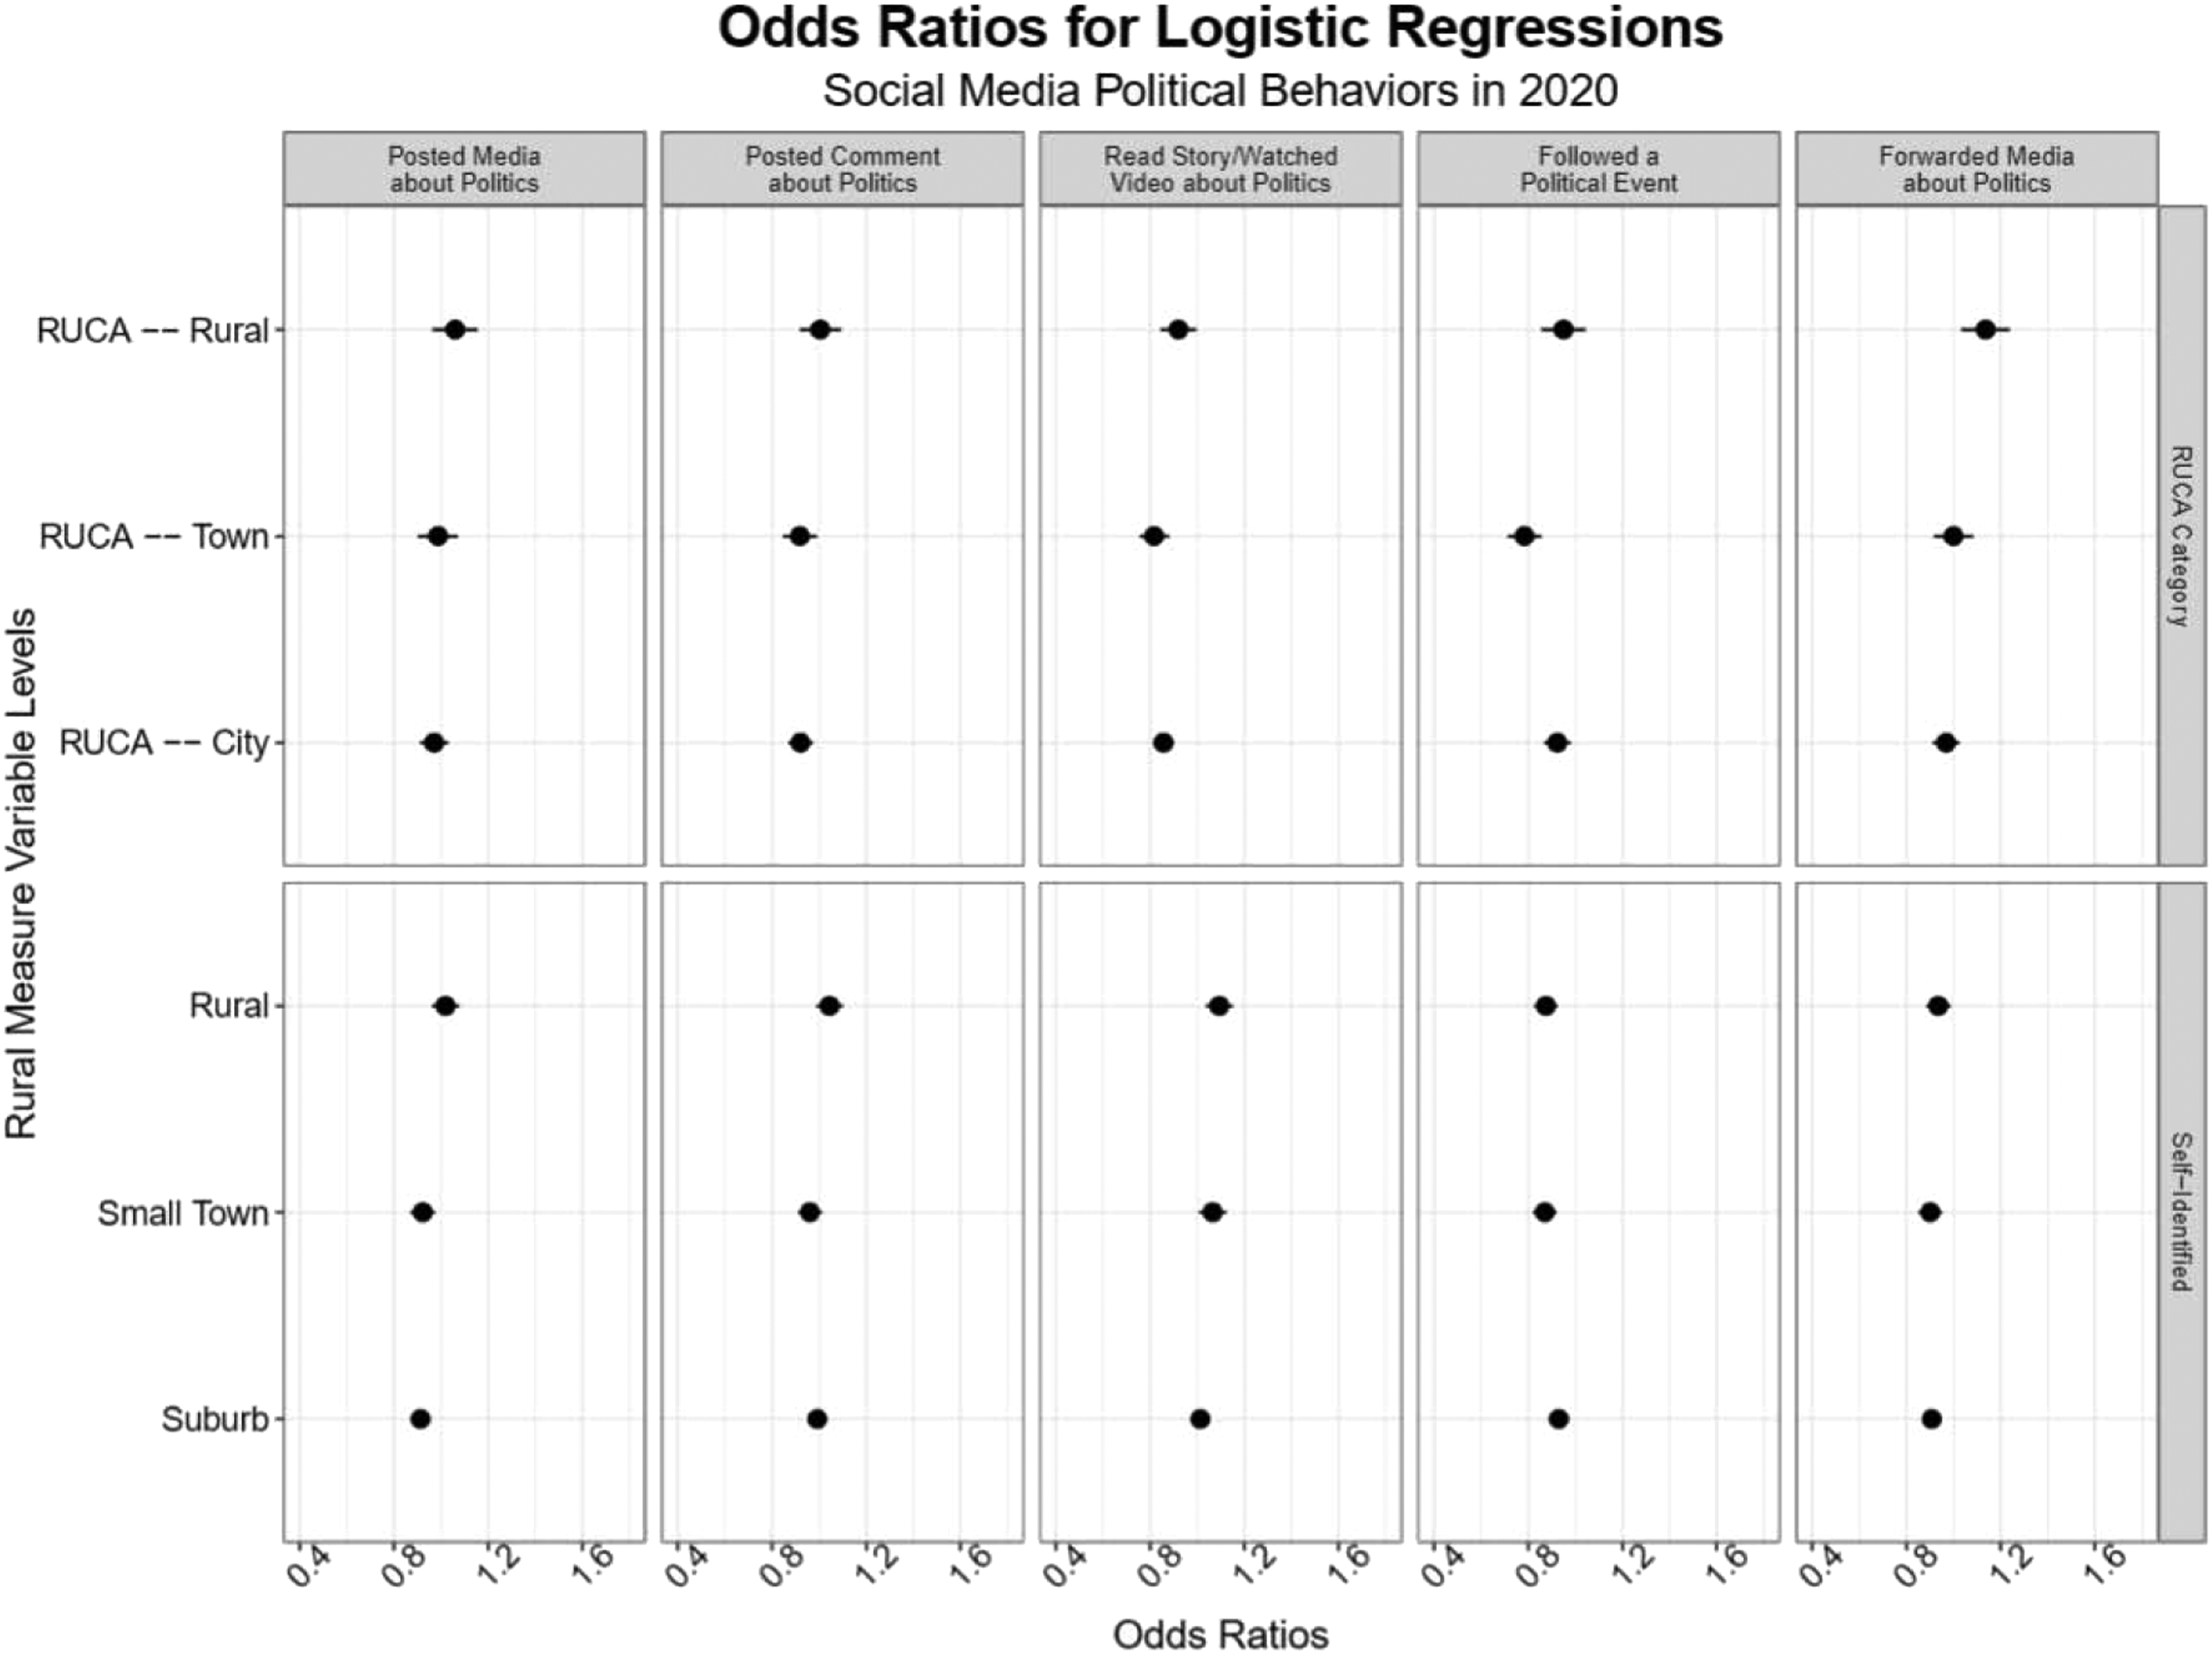
According to logit regression results with control variables included, rural residency does not significantly predict voting or working on a campaign (Figure 7). Rural or small-town residents are more likely to attend a meeting, put up a sign, and contact elected officials (self-described only). Conversely, rural or small-town residents are less likely to attend a protest, donate money (RUCA only), donate blood (RUCA only), or to say that they have not done any of the political activities (RUCA only). For the 2018 wave, it appears that self-identified rural residents were more active politically than rural residents according to RUCA measures. Odds Ratios for Logistic Regressions for Political Behaviors in 2018.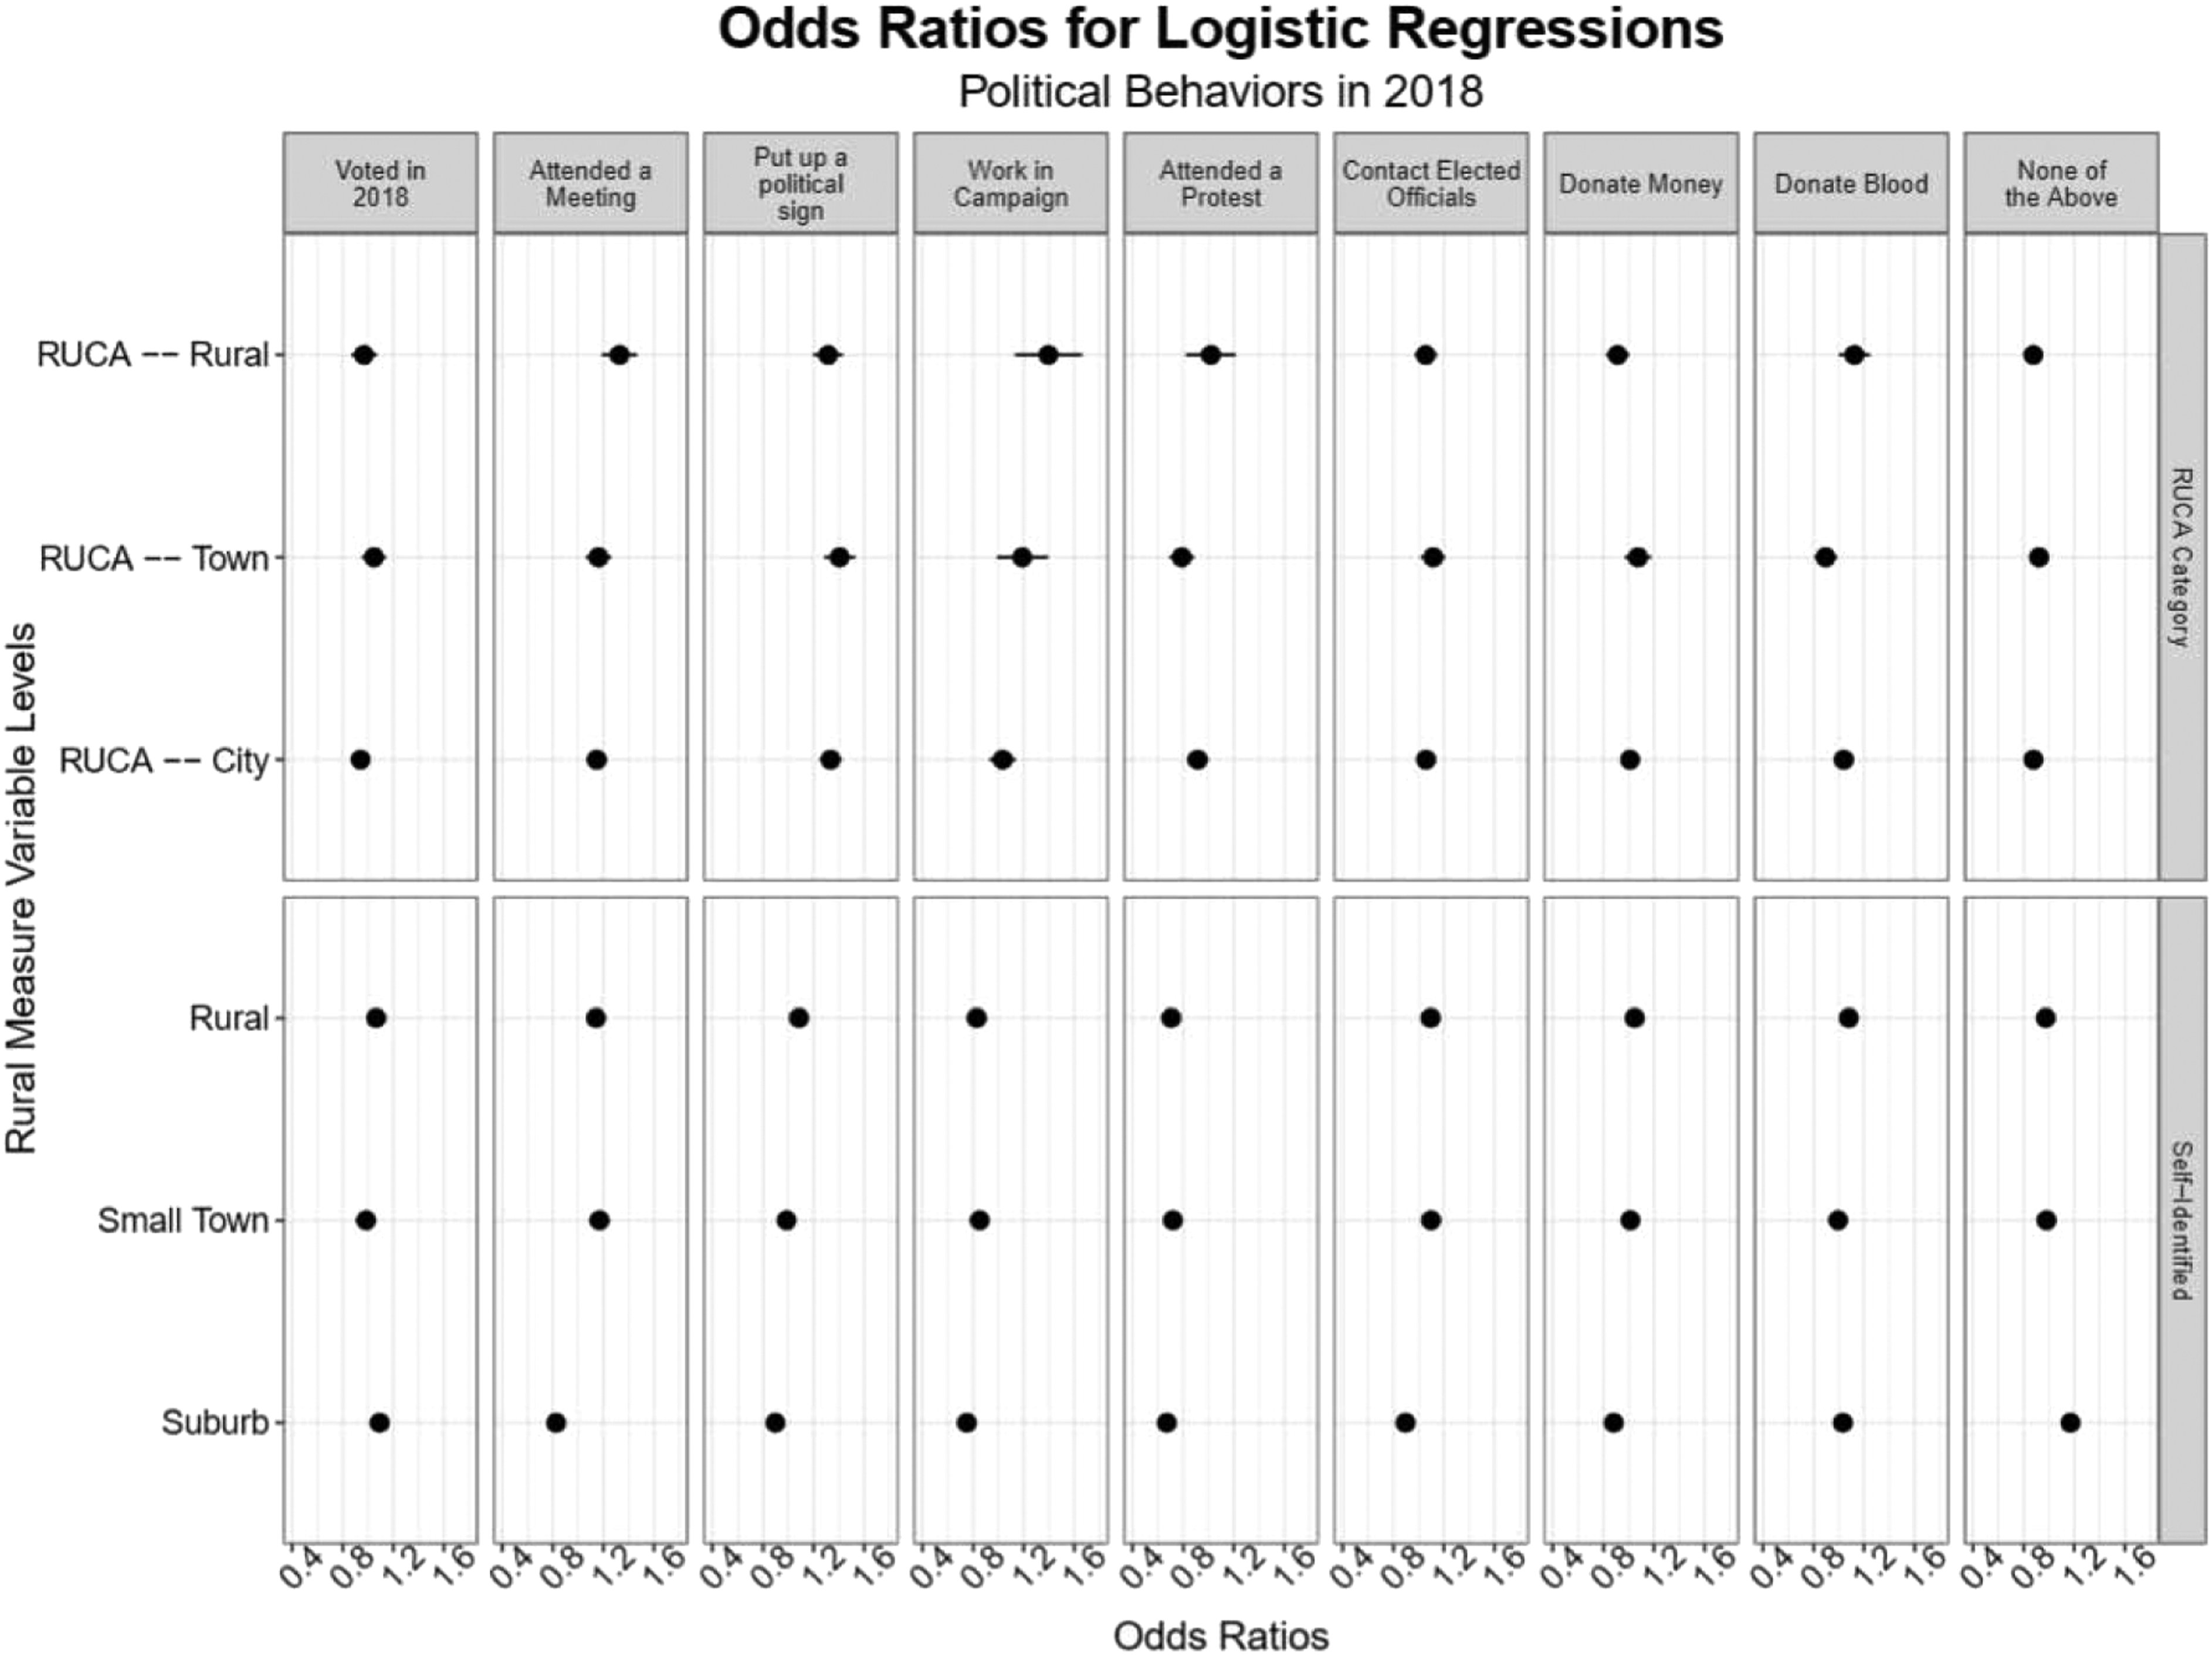
Figure 8 predicts the likelihood of participating in the online political activities by urban-rural designations in the 2018 data, controlling for other factors. Self-described rural and small-town residents are significantly less likely to have followed a political event compared to their urban counterparts. Self-described rural residents were also less likely to have forwarded media about politics. All other urban-rural differences did not reach statistical significance, controlling for other factors. Odds Ratios for Logistic Regressions for Social Media Political Behaviors in 2018.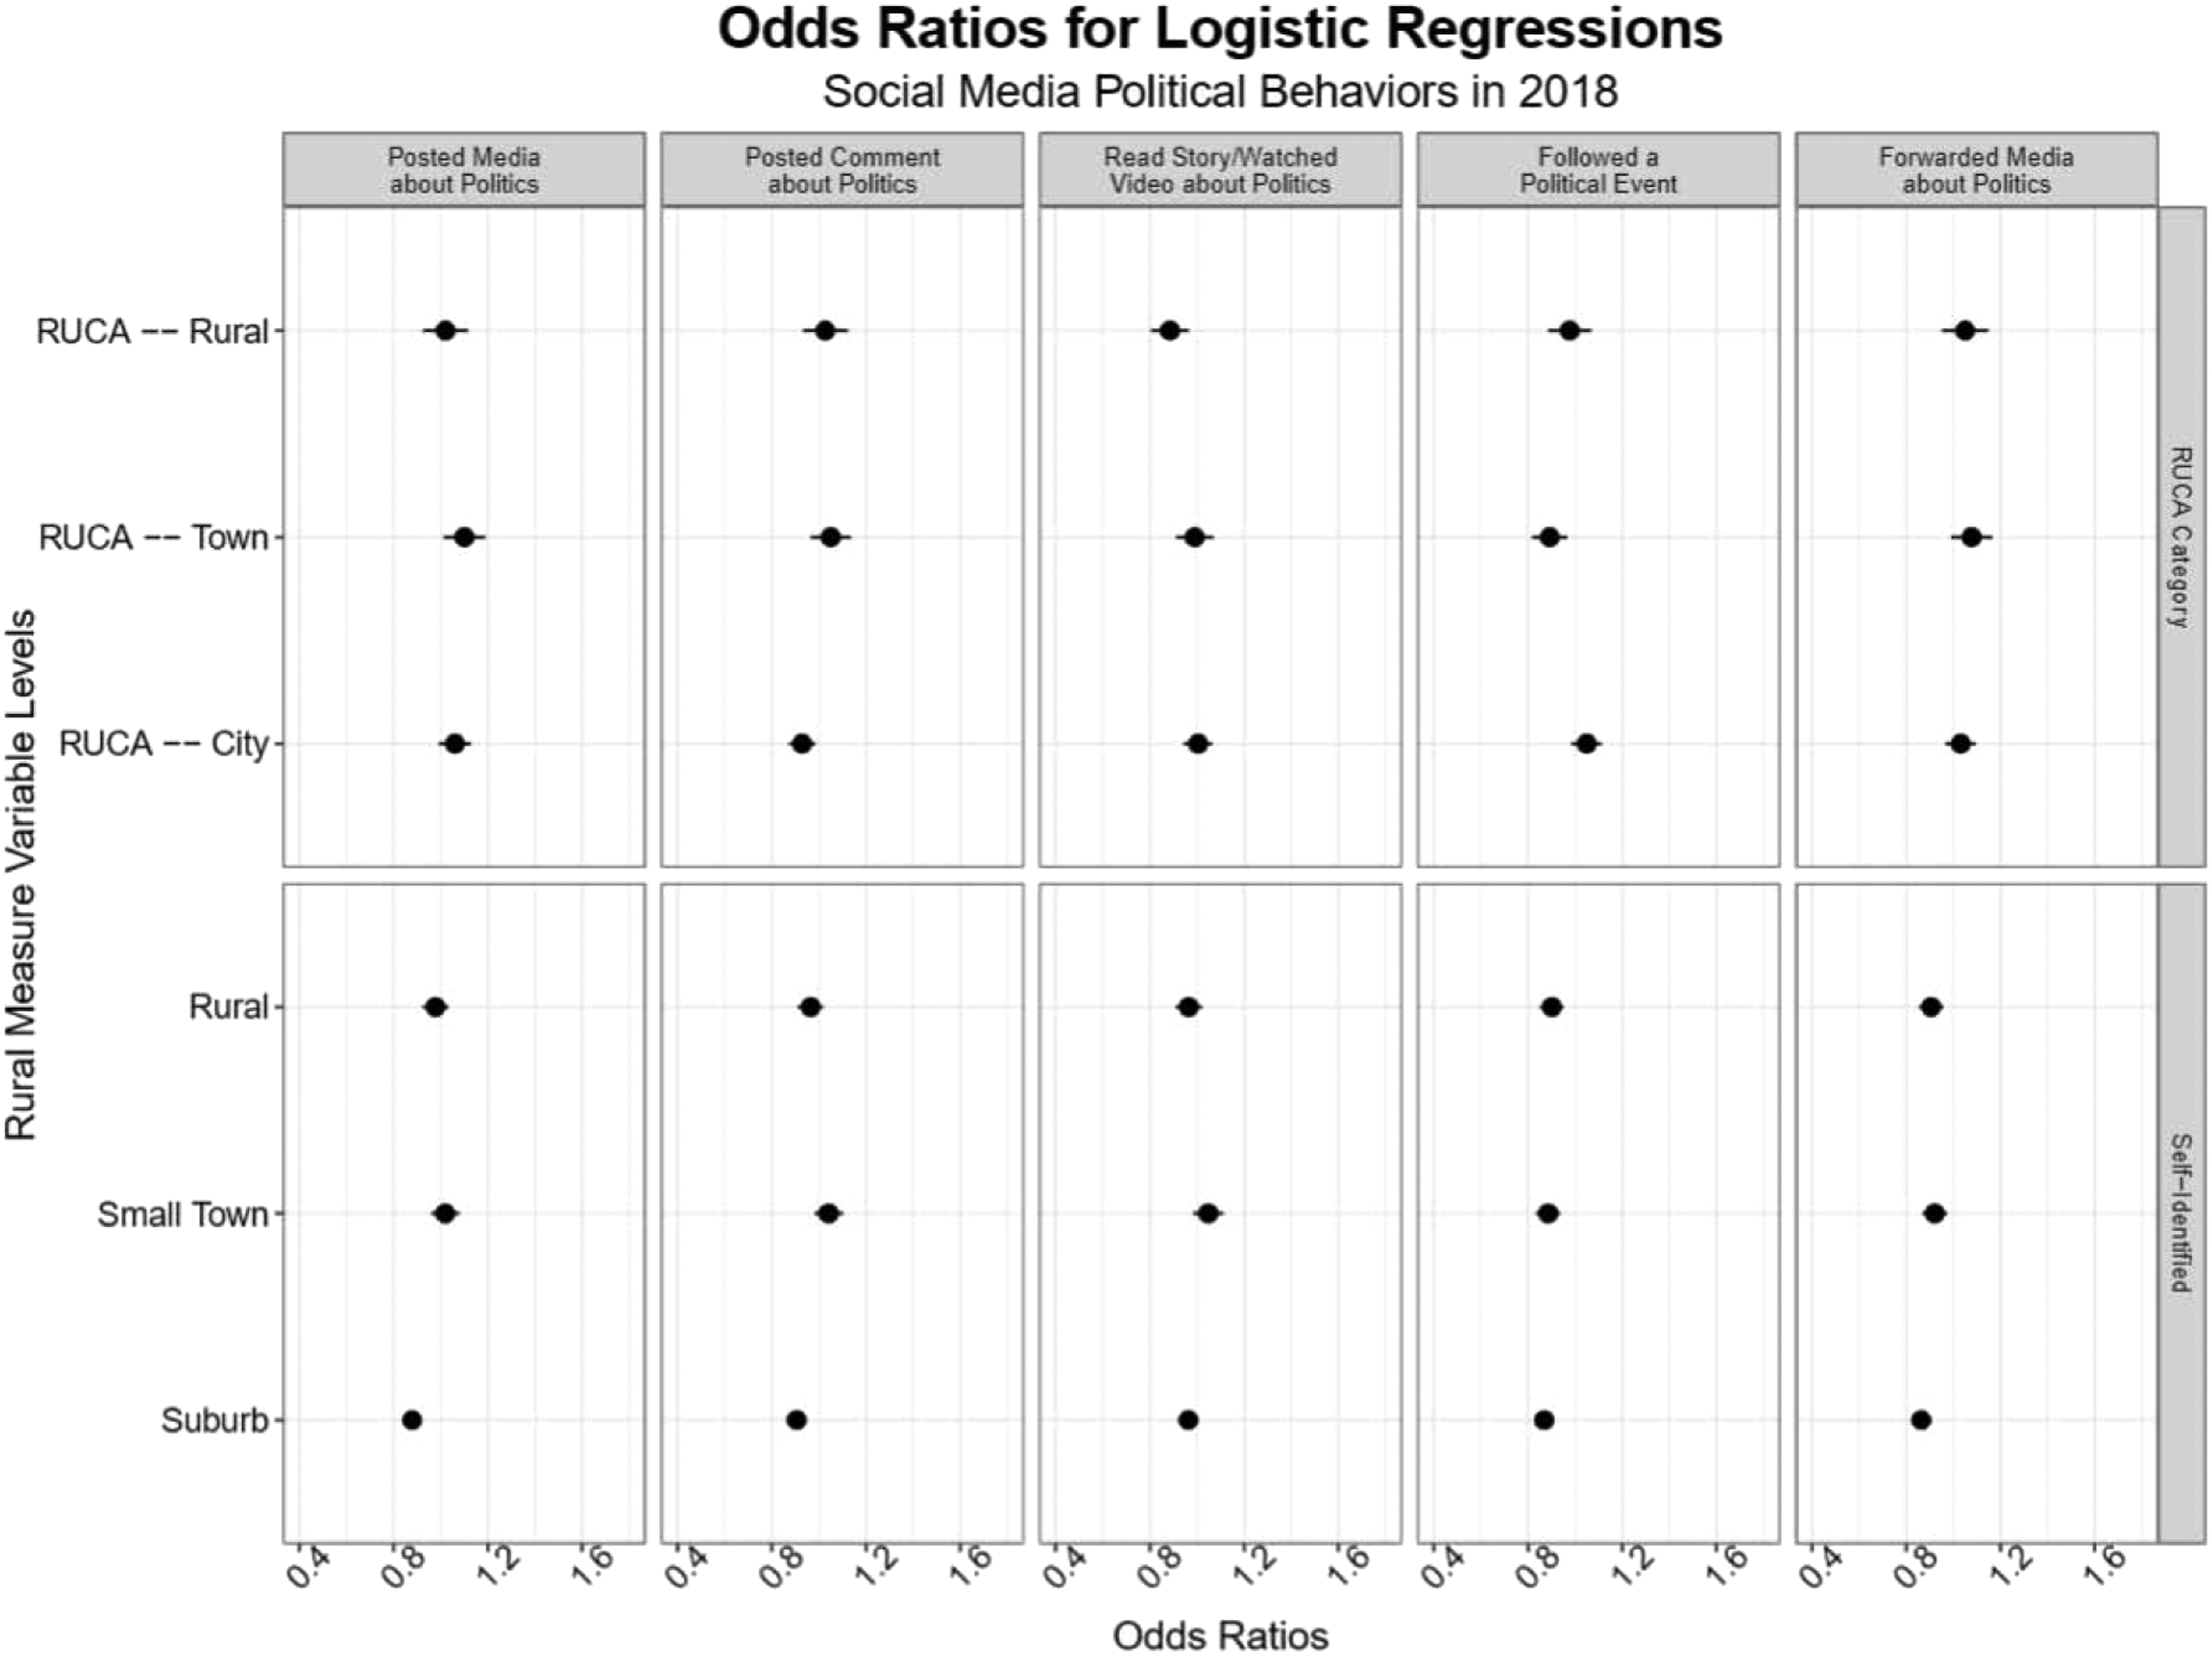
We also created an additive index of general political behaviors (attend a meeting, put up a sign, work in a campaign, attend a protest, contact officials, vote, donate blood, and donate money) and of social media political behaviors (post media about politics, post a comment about politics, read a story or watch a video about politics, follow a political event, and forward media about politics) for each year. These serve as additional dependent variables to assess whether overall participation is more or less likely across the urban-rural spectrum. Since these are count variables that follow a Poisson distribution rather than a normal distribution (see Supplemental Appendix C for distributions), we run similar models to those found above, except we employ Poisson regressions when using these additive indices as dependent variables.
The full results for these analyses can be found in Supplemental Appendix F. To summarize these results, for 2018, self-identified and RUCA-defined rural residency does not significantly predict likelihood of participating in more “traditional” behaviors, or more social media political participation. The one exception is that small-town residents (alongside suburban residents), according to RUCA codes, are slightly more likely to have participated in more general political behaviors, compared to urban residents. For 2020, self-identified small-town residents and RUCA-defined most rural residents are more likely to generally participate in more political behaviors compared to their urban counterparts. For greater social media political participation, small-town residents according to RUCA codes are significantly likely to have participated in less behaviors compared to urban residents. All other small-town and rural categories were not statistically significant predictors of these additive measures. Although a greater number of participation behaviors is somewhat more likely among rural residents, many of these effects are substantively quite small, with rurality only predicting a greater likelihood of participation by a few percentage points.
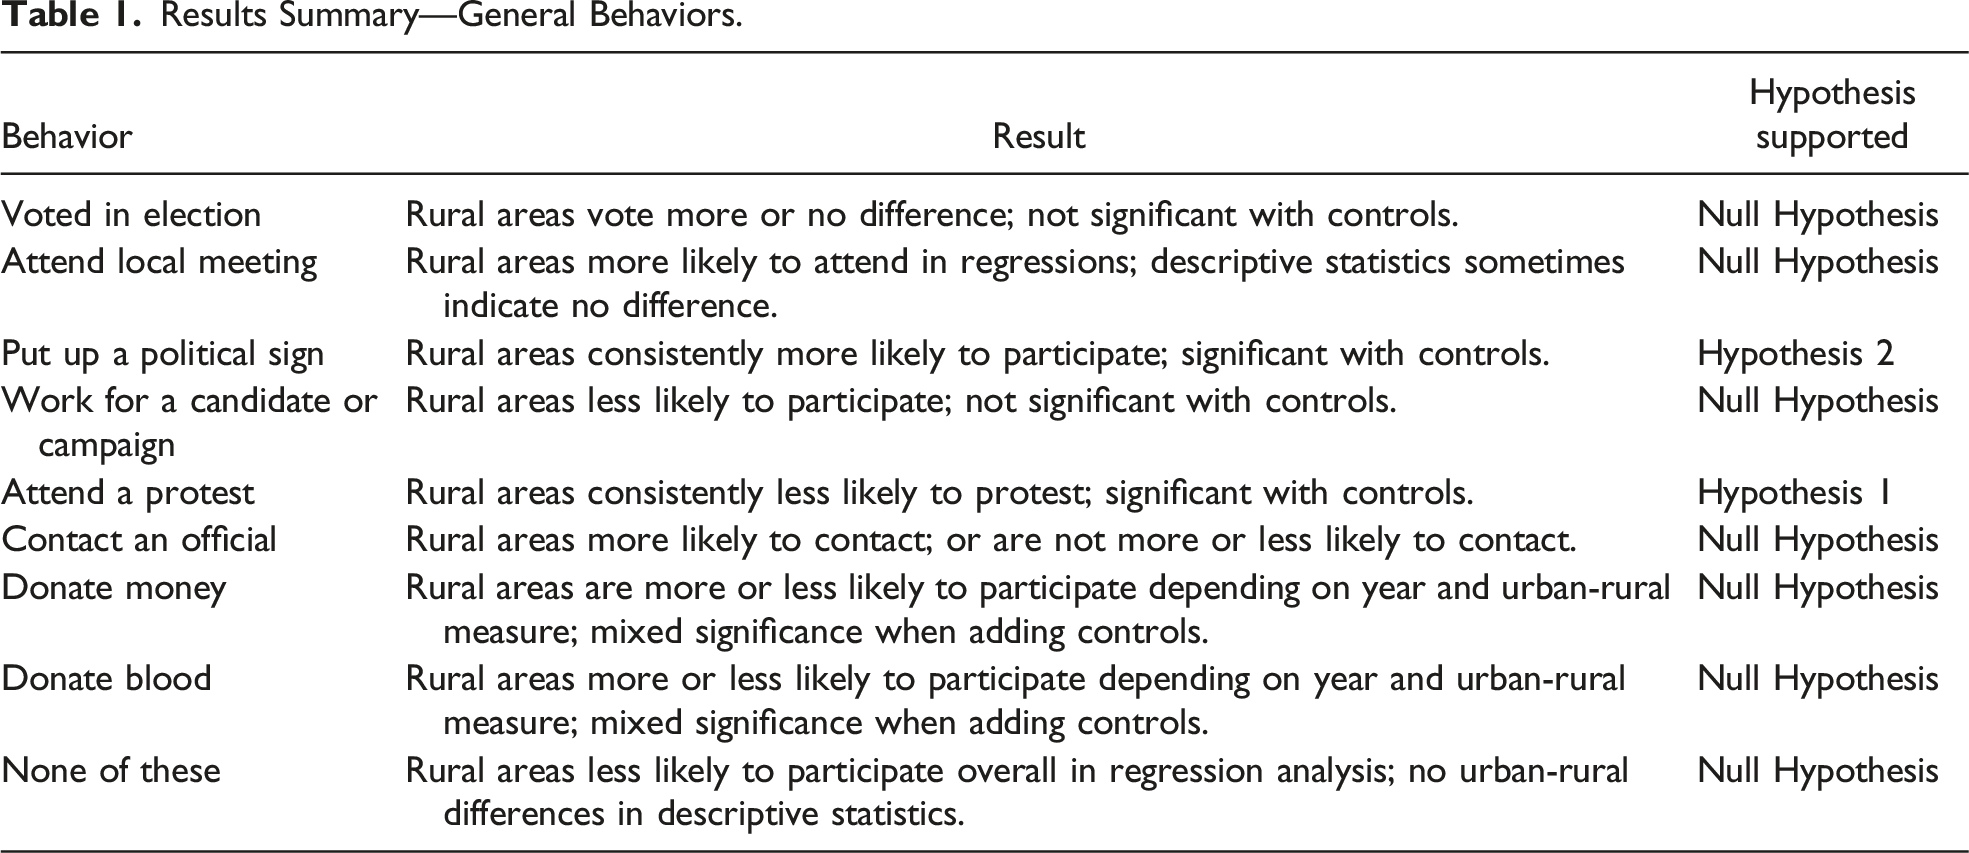
Across these two data sets, then, rural and small-town residents are consistently more likely to put up a sign, both in terms of descriptive means and controlling for other factors in logit regression models. Rural and small-town residents also tend to be more likely to donate blood or attend a meeting, though these are less consistent. Conversely, rural and small-town residents are consistently less likely to protest or say they have done none of the political activities measured. Voting has no urban-rural difference once other factors are accounted for. Urban-rural differences in contacting elected officials, donating money, and working in a campaign shift depending on the year. Finally, the likelihood of participating in more traditional political behaviors is slightly higher among rural and small-town residents, though statistical significance on this point it somewhat inconsistent and the substantive significance is small.
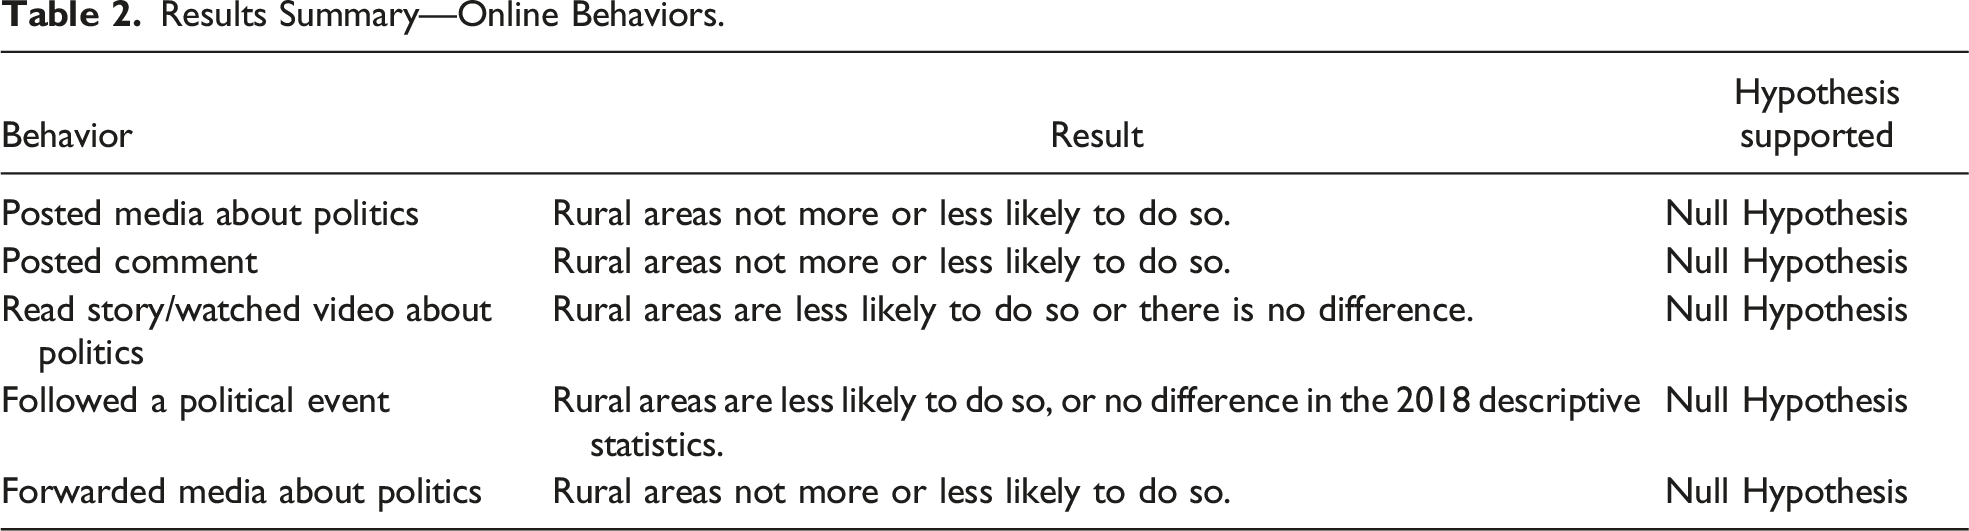
For online behaviors, rural and small-town residents are mostly similar in their likelihood to engage in political activities. Sometimes reading or watching a video about politics is less likely among rural and small-town respondents, as is following a political event, but these differences are not robust between years. Or, these differences hold in descriptive statistics but not when controlling for other factors (or vice versa). In terms of likelihood to participate in social media behaviors generally, there is no consistent urban-rural difference.
To better understand why rural and small-town residents are less likely to report participating in a protest or other political demonstration, we consider the availability of such events within a reasonable radius from where the respondent lives. To do this, we match geocoded protest data from ACLED to Census GEOID codes and plot the number of events by county in Figure 9a for 2020 and Figure 9b for 2021.
12
Political Protests in the United States. (a) Political protests in the United States in 2020 by County (b) Political protests in the United States in 2021 by County.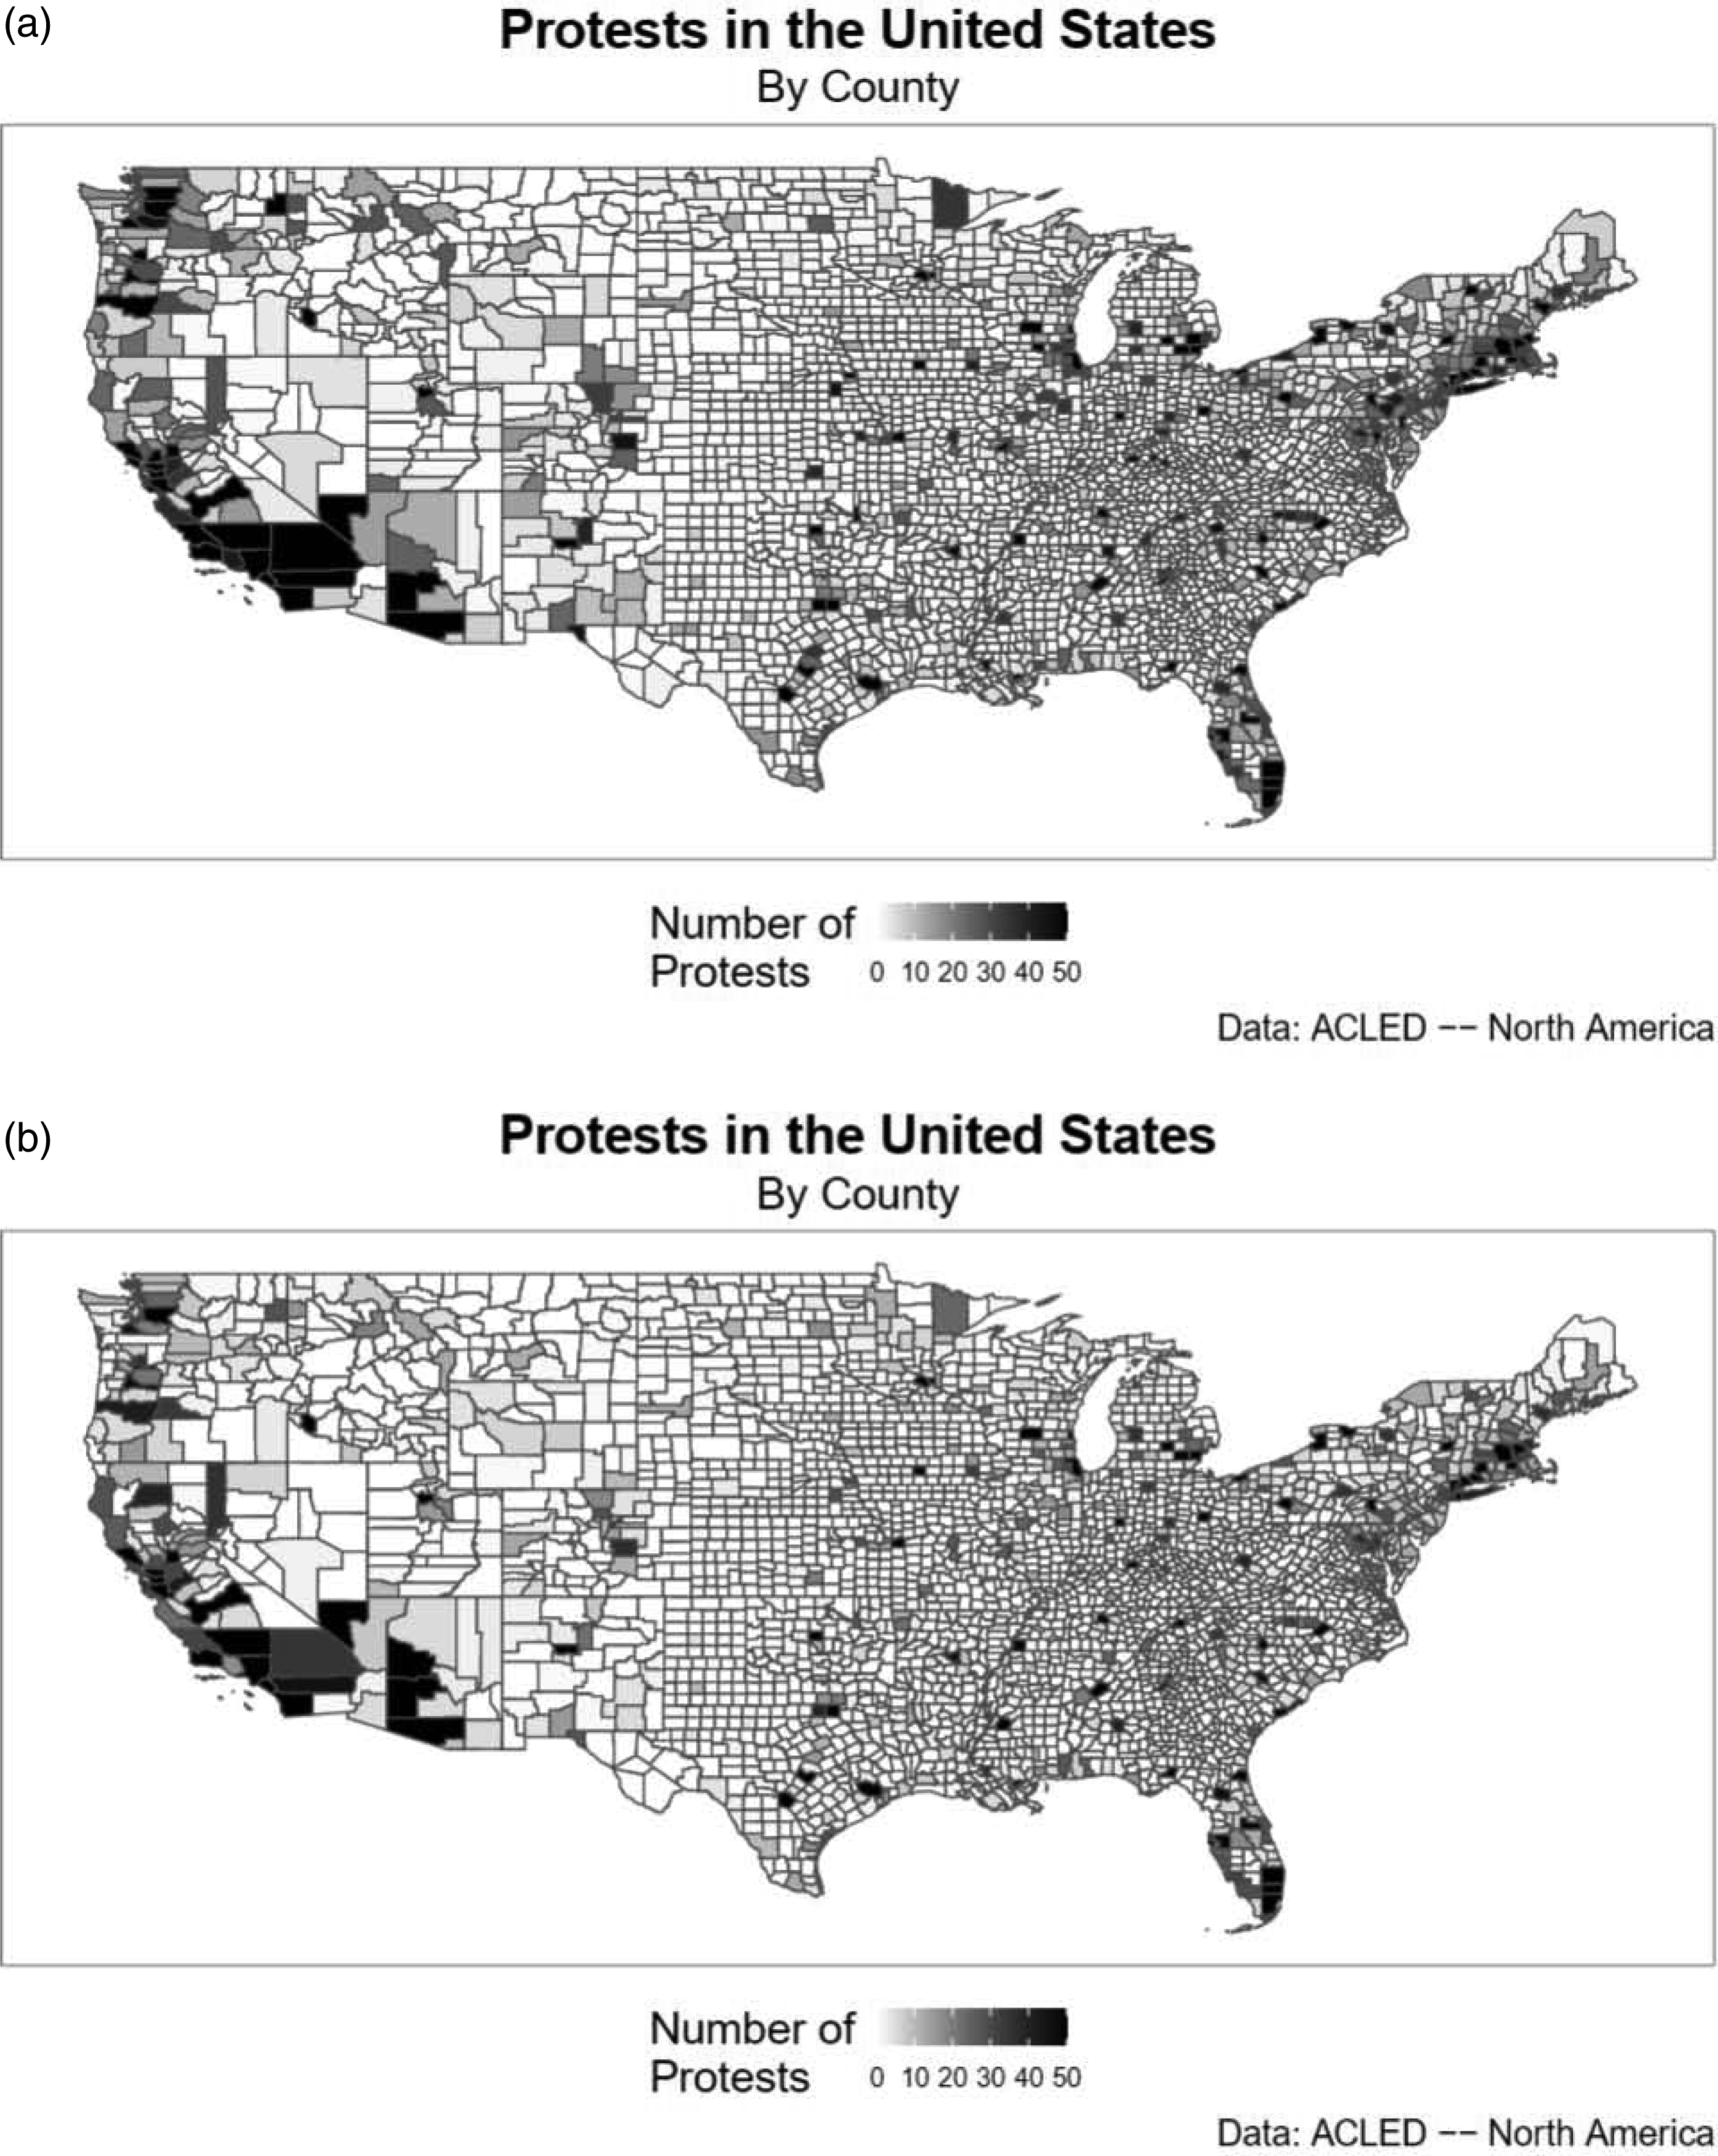
According to the map, we can easily identify large urban areas in the contiguous United States, such as Los Angeles County in California, Miami-Dade County in Florida, and Cook County in Illinois. These counties are home to the cities with the largest number protests in the country during 2020, including Los Angeles, Miami and Chicago. On the contrary, counties in areas that are more rural in nature tend to have fewer protest activities (See Urban-Rural county map in the Supplemental Appendix G). The correlation between RUCC score and the number of protests is –0.33 for 2020 and –0.26 in 2021, which suggests that as the county becomes more rural, there is a moderate negative correlation between rural classification and protest opportunities. This information provides some context for why protesting is reported less among rural residents, even when controlling for demographic variables and political identification: they are physically far away from them.
Discussion and Conclusion
Results Summary—General Behaviors.
Results Summary—Online Behaviors.
In other words, there are few urban-rural differences in political participation rates for most specific behaviors, in contrast to there being urban-rural differences in other political outcomes at the mass level. The two consistently significant tendencies hold when control-ling for political and socio-demographic factors, which suggests participation differences do not stem from socio-economic, demographic, or age-related differences. Further, descriptive differences in participation rates do not widely differ according to the objective RUCA codes versus the subjective respondent-identified residency measure—though 2018 may be different here compared to 2020—suggesting that rural identity may have a nuanced or minimal difference in a general election year. Finally, urban-rural differences, according to expectations surrounding social capital, should vary uniformly across different modes of participation. However, we find this is not always the case.
We thus believe the outstanding differences for these two behaviors relate at least in part to inherent variation in access across the urban-rural spectrum. Rural residents are less likely to protest because they are less likely to live near a protest, for instance. Or, due to lower home prices and lower numbers of yardless apartments, rural residents are more likely to have access to a yard (Mazur 2017); since they are more likely to have a yard, rural residents would be more likely to put up a sign that has been transported to them. Rural areas also tend to be less likely to work on a campaign (though this at times was not a statistically significant difference when controlling for other factors) because campaign offices or volunteer centers may be far away, while other factors—contacting officials, donating money—can be done through means unrelated to physical location (such as via phone, mail, internet, etc.). This latter point is further suggested by the null results pertaining to online and social media behaviors; political participation on social media does not vary across the urban-rural spectrum among internet users, particularly once control variables were included. In other words, if internet access is equal across the urban-rural spectrum, then the online behaviors tend to be similar. These results are summarized in Table 2. Though the tendency is for rural and small-town residents to be slightly less likely to participate, these differences are either not statistically significant, or they are not consistent across years or between descriptive statistic results and regression results. This again echoes our argument that other behaviors dependent on non-physical factors do not vary across the urban-rural divide once other factors are accounted for.
Like any study, ours has some limitations. Since this study aims to find recent general differences in political participation by population density (real or perceived), we do not have the space to thoroughly discuss the potential impact of the idiosyncrasies of the 2018 and 2020 elections at length. We chose these two years because of their recency, and because they encompass both a general election and a midterm election. That said, in 2020 especially, there were many specific factors that could have changed general trends, including the COVID-19 pandemic, the Black Lives Matter protests, the nature of the 2020 election, more widespread absentee and mail-in ballots, and so on. Given the highly unique nature of 2020, then, it is even more striking that we find some consistencies in urban-rural political participation across the two years examined.
We also do not look at subgroup differences within urban and rural areas, such as by race, age, etc. Though we control for these factors, there may be differences in participation when looking between such subgroups of rural versus urban areas. Another limitation is that we were constrained by what political participation items were on the C(C)ES surveys. There are some political participation activities not examined, which could be further examined across the urban-rural spectrum.
Finally, we do not fully test the explanation of social capital and rural identity. Though we approximate rural identity through the self-identification question, this differs from recent standard measures of rural identity (such as Lyons and Utych 2021; Lunz Trujillo 2022). Social capital is approximated by demographic variables, and church attendance also indicates greater social capital to some extent, but these are noisy measures. The absence of a reliable indicator of social capital, however, does not necessarily discount our geographic variation in access argument, as social capital should uniformly predict greater participation across the board. Future studies should delve into testing these explanations further.
These limitations aside, we hope that this study clarifies how population density relates to political participation. There is little difference in specific behaviors, though rural and small-town residents overall tend to be slightly more inclined to participate in more behaviors, even controlling for other factors. That said, there are a few variations in how they tend to participate, which likely relate to inherent characteristics of place and access.
Supplemental Material
Supplemental Material—Urban-Rural Differences in Non-Voting Political Behaviors
Supplemental Material for Urban-Rural Differences in Non-Voting Political Behaviors by Jennifer Lin and Kristin Lunz Trujillo in Political Research Quarterly
Footnotes
Declaration of Conflicting Interests
The author(s) declared no potential conflicts of interest with respect to the research, authorship, and/or publication of this article.
Funding
The author(s) received no financial support for the research, authorship, and/or publication of this article.
Informed Consent and IRB Approval
Data Availability
Supplemental Material
Supplemental material for this article is available online.
Notes
References
Supplementary Material
Please find the following supplemental material available below.
For Open Access articles published under a Creative Commons License, all supplemental material carries the same license as the article it is associated with.
For non-Open Access articles published, all supplemental material carries a non-exclusive license, and permission requests for re-use of supplemental material or any part of supplemental material shall be sent directly to the copyright owner as specified in the copyright notice associated with the article.