
Abstract
This study explored the impact of income status (low-income vs. non-low-income) on family functioning, social support, and quality of life in a community sample of 125 families. The sample identified themselves as 17% Black or African American, 7% Latino, 4% Asian, and 66% White. The mean age of participants was 37 years. The study used a self-report measure of perceived family functioning, the Family Assessment Device (FAD). Results demonstrated that low-income status was associated with less satisfaction with several areas of family functioning, and that the effect of having a family member with a psychiatric disorder on family functioning depended on income status, with low-income families with a psychiatric disorder endorsing much greater dissatisfaction with family functioning than non-low-income families with a psychiatric disorder. Low-income families also had significantly lower social support and quality of life scores than non-low-income families. Low-income status appears to put stress on families in general and to compound the effects of having a psychiatric disorder on family functioning. Non-low-income status, by contrast, appears to offer a buffer from the effects of having a psychiatric disorder on family functioning. These findings suggest the importance of providing family-based interventions to low-income families in which one or more members has an identified psychiatric disorder.
Research has suggested that poverty is associated with multiple variables, including quality of life, marital satisfaction, maternal sensitivity and effectiveness, violence, and physical and mental illnesses. For example, research from the National Institute of Child Health and Human Development (NICHD; Mistry, Biesanz, Taylor, Burchinal, & Cox, 2004) suggests that the relationship between income and family and child well-being is strongest in the lowest income bracket and weakens as family income exceeds the federal poverty level. Such research has found lower maternal sensitivity and more ineffective maternal control in low-income families than in families above the poverty level (Mistry, Lowe, Renner, & Chien, 2008).
In a similar vein, research on family stress models (Elder, Eccles, Arelt, & Lord, 1995) has documented that economic stress impacts child outcomes by creating distress in parents, which in turn creates marital distress, interpersonal withdrawal, less attuned parenting, and poorer child outcomes (Donnellan, Conger, McAdams, & Neppl, 2009; Kiser, 2007; Riley et al., 2009; Schoon, Jones, Cheng, & Maughan, 2011; Seccombe, 2002). Research on family stress models has also found that economic stress is associated with more marital conflict and distress (Conger, Rueter, & Elder, 1999; Dew & Yorgason, 2010; Karney & Bradbury, 2005). Although research on family stress models has explored the impact of economic stress on individual level variables such as depression and maternal sensitivity (Barnett, 2008; Kiser, 2007; Riley et al., 2009), and on marital level variables such as marital distress and marital support (Conger et al., 1999; Dew & Yorgason, 2010; Karney & Bradbury, 2005), little research has explored the relationship between perceived family functioning and income.
Epidemiological research in Canada has explored the relationship between family functioning and income using the Family Assessment Device (FAD; Growing Up in Canada: National Longitudinal Survey of Children and Youth, 1996), but results of that study were methodologically limited. Specifically, the investigators did not use the FAD’s established scoring procedures to score and interpret results. In addition, that research used only the General Functioning scale to evaluate the relationship between income and family functioning and only had one adult family member complete the assessment. Conversely, in accordance with the FAD’s standard scoring procedures, the current study used the General Functioning scale and all six dimensions of the McMaster model and had all family members age 12 and above complete the assessment (Ryan, Epstein, Keitner, Miller, & Bishop, 2005). More and more families are experiencing economic hardship, and there is a need for research addressing the effects of financial hardship on family functioning.
Another variable that may affect family functioning is family constellation. Much attention has focused on whether single parent families have more problematic functioning compared to two parent families. Prior research has suggested that single parent households are associated with greater risks of numerous problems including poverty (Norton & Glick, 1986), child behavioral problems (Nelson, Clark, & Acs, 2001), inconsistent discipline practices (Hall, Gurley, Sachs, & Kryscio, 1991), inappropriate affective involvement between mother and child (i.e., blurring of intergenerational boundaries; Glenwick & Mowrey, 1986), greater distress for the single parent (McLanahan & Adams, 1987; McLanahan & Booth, 1989), and less time availability for affective involvement within the family (Whitehead, 1993). However, other studies have suggested that it is not the family structure but rather the presence or absence of key factors related to family well-being, including strong support systems, established rules and structure in the household, communication, and problem-solving skills that determine family functioning (Gladow & Ray, 1986; Green & Crooks, 1988; Hanson, 1986; Hetherington, 1989). In addition, the results of another study suggested that socioeconomic status was more related to adverse outcomes than family structure (Acock & Kiecolt, 1989). Given these disparate findings, the present study evaluated whether single-parent status compounded the impact of low-income on family functioning.
Having a family member with a psychiatric disorder has been associated with impaired family functioning (Keitner, Ryan, & Heru, 2005; Kuipers & Bebbington, 2005; Leff, 2005). Friedmann et al. (1997) found that families of patients with psychiatric disorders were more likely to have difficulty with communication, problem solving, role division, appropriate experience and expression of emotions, and being involved with each others’ lives in ways that are comfortable for all involved (Friedmann et al., 1997). Similarly, Warren et al. (1986) found that spouses in which at least one partner had a psychiatric disorder reported more problems with conflict resolution, affection, and compatibility than nonclinical couples (Waring, Patton, Neron, & Linker, 1986). Given the impact of psychiatric disorder on family functioning and the well-documented disparity in access to mental health resources in low-income families, we evaluated whether having at least one family member in the household with a psychiatric disorder compounded the impact of low-income status on family functioning.
For the purpose of this study, we defined family functioning as a family’s ability to accomplish tasks that are important for its well-being, to adapt to changing circumstances, and to balance the needs of individual family members with that of the family system (Keitner, Heru, & Glick, 2010). To date, no research on income and family functioning has used a well-validated, multidimensional, self-report measure to evaluate how families perceive their functioning. The FAD (Epstein, Baldwin, & Bishop, 1983) is a self-report measure of family functioning that allows researchers to assess how families perceive their functioning in the six dimensions of the McMaster model of family functioning, upon which Keitner, Heru, and Glick’s (2010) definition of family functioning is based. The FAD is both time and cost efficient, and has been well validated (Miller, Epstein, Bishop, & Keitner, 1985).
The purpose of the present study was to use the FAD to explore perceptions of family functioning in two income groups: non-low-income families and low-income families. We defined non-low-income families as those with annual incomes above 133% of the United States poverty guidelines, and low-income families defined as those with incomes at or under 133% of the U.S. poverty guidelines. We chose to use 133% of the federal poverty level to define income groups for this study because this is the threshold identified by the Health Reform Law of 2010 for Medicaid eligibility (Summary of the new health reform law, 2011). Medicaid eligibility has been used to distinguish non-low-income from low-income in prior studies examining the impact of low-income (Klinnert, Price, Liu, & Robinson, 2003). The federal poverty level is determined by both family income and family size. Families in the low-income group in this study were struggling economically.
The present study explored whether low-income families endorsed equivalent levels of satisfaction with family functioning as non-low-income families on all of the dimensions of family functioning identified by the McMaster model of family functioning (Ryan et al., 2005), and whether low-income families endorsed equivalent levels of social support and quality of life as did non-low-income families. In addition, the present study explored whether having a family member with a psychiatric disorder or being a single-parent family compounded the effects of low-income status to lessen satisfaction with family functioning.
Method
Sample and Participant Selection
This study was conducted at Rhode Island Hospital, at the Family Research Center. Data were collected at the Family Research Center and at recruitment drives at various places in the community (e.g., libraries, swim meets). A research assistant was available to families completing questionnaires regardless of location, and checked all participants’ measures for missed pages or missed items. Once checked for completeness, data were entered into a secure database and hard copies of questionnaires were stored in a locked file cabinet in the Family Research Center.
Families were recruited through advertisements in local newspapers, local cable television, social media websites, and flyers posted on community bulletin boards throughout the community. Inclusion criteria were two or more family members living in the same household, at least one of whom was an adult aged 18 or older, and ability to read and write English. Participating family members were given a study information sheet and they provided verbal consent. Adult family members completed self-report assessments of their social support, family functioning, quality of life, physical health, mental health, and sociodemographic information including income. Children 12–17 years of age completed only the FAD and basic sociodemographic information. Participants were compensated for their time, which was generally less than 1 hr.
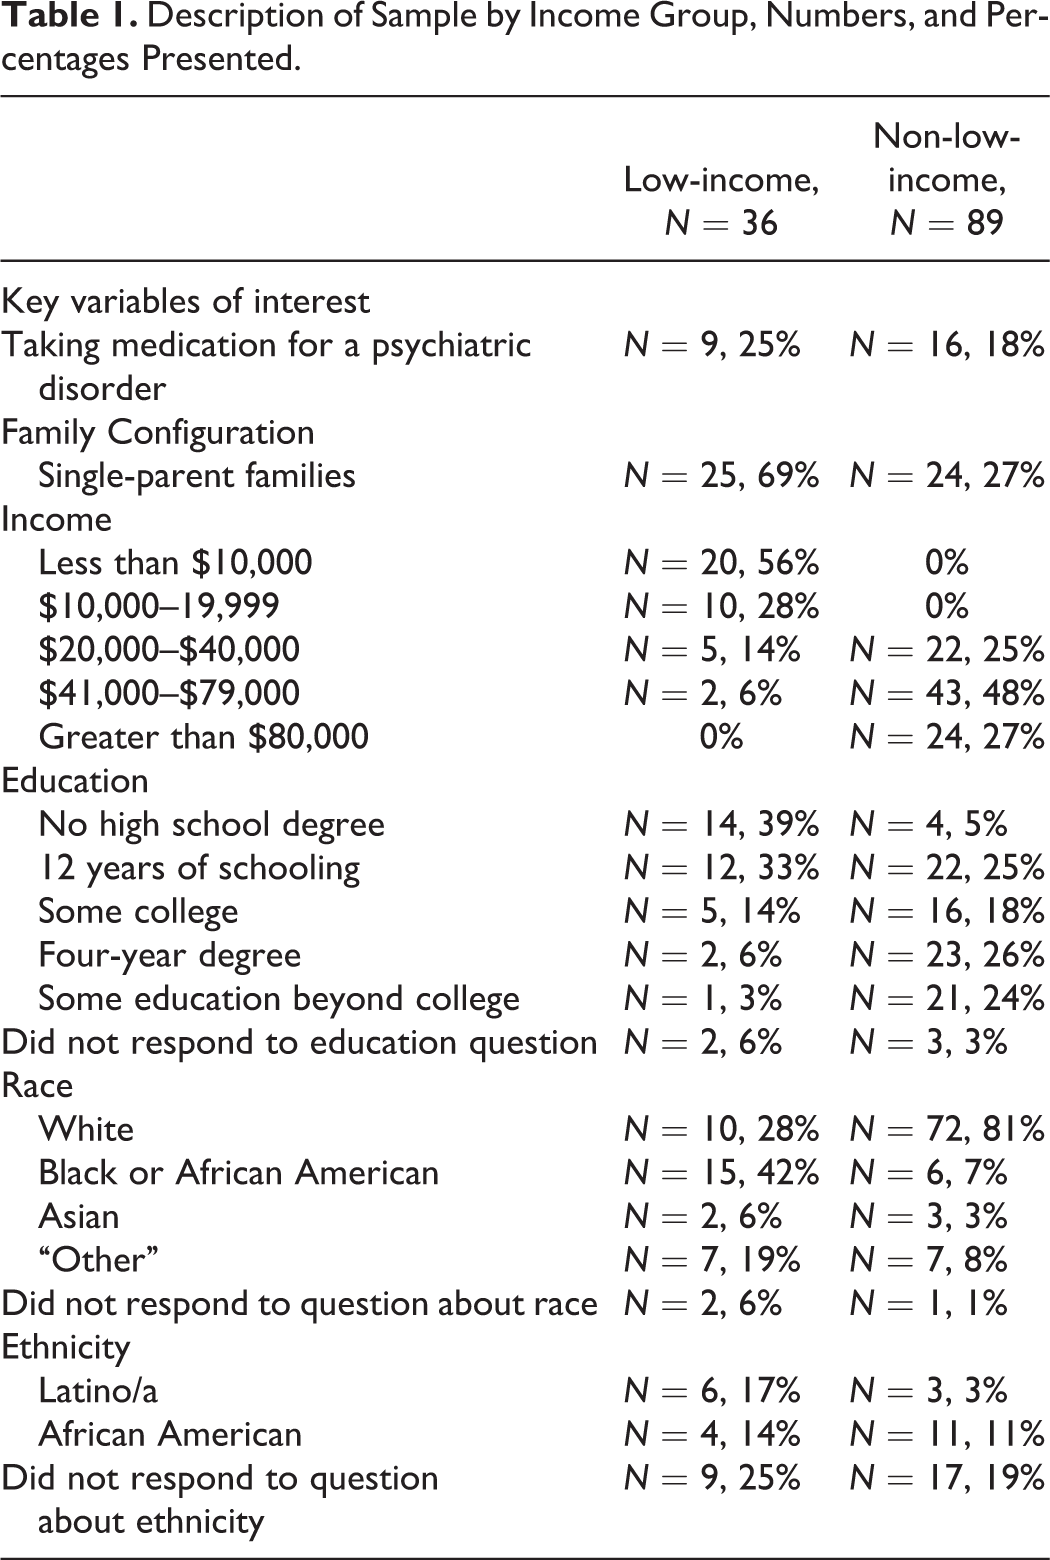
The sample consisted of 125 families living in Southern New England. The mean age of participants was 37. Families were divided into two groups: non-low-income families with incomes above 133% of the federal poverty level and low-income families with incomes at or below 133% of the federal poverty level. There were 36 families in the low-income group and 89 families in non-low-income group. Data on family income levels are presented in Table 1. Data on the number and proportion of participants in each income group that were taking medication for a psychiatric disorder, were married or cohabitating, or were single-parent families are also presented in Table 1. In addition, Table 1 describes the sample in terms of education, race, and ethnicity. Questions about race and ethnicity were open-ended. A difference between proportions test revealed that there were significantly more single parent families in the low-income group than in the non-low-income group (p < .01). The proportion of participants with psychiatric diagnoses did not significantly differ between income groups.
Description of Sample by Income Group, Numbers, and Percentages Presented.
Measures
Family functioning
The FAD (Miller et al., 1985) was used to measure family functioning. It is a 60-item questionnaire that is completed by all family members who are living together and are 12 years old or older. It is comprised of seven scales: a general functioning scale, and six subscales designed to tap different facets of family functioning. The subscales include problem solving (the family’s ability to resolve problems), communication (the verbal exchange of information between family members), roles (the way that family members fulfill family functions and responsibilities), affective responsiveness (whether family members are able to respond to various situations with the full spectrum of emotions, and whether the emotion experienced is appropriate for the context in which it occurs), affective involvement (family members’ ability to be involved and connected with each other, and the quality of this involvement), behavior control (how a family establishes standards of behavior, handles behavior that is dangerous, or handles behavior that expresses a psychobiological need such as eating, sleeping, eliminating and aggression), and general functioning, which serves as a summary of how well the family is functioning overall.
Previous research on the FAD indicates that its subscales possess adequate internal consistency (αs range from .72 to .92; Epstein et al., 1983) and that it possesses good concurrent validity with other measures of family functioning (Miller, 1994; Miller et al., 1985). Coefficient α for FAD scales from the present study ranged from .69 (Behavior Control ) to .89 (General Functioning), with all other scales between .70 and .77. Coefficient α for all 60 items was .95. Research also indicates that the FAD demonstrates significant agreement with the McMaster Clinical Rating scale, an interview-based objective assessment of family functioning that uses the same dimensions and model of family functioning as the FAD (Barney, 2005; Miller, 1994; Stevenson-Hinde, 1995).
With regard to scoring, individual family member’s FAD scores are averaged to create a family mean for each dimension, for each family. Healthy/unhealthy cutoff scores have been developed for each dimension of the FAD (Miller et al., 1985), and they indicate the degree to which family members are satisfied with their functioning in each domain. Cutoff scores are based on the theoretical premise that a mean score of 2 or lower indicates that the majority of items were endorsed in a healthy direction, while a score above 2 indicates that the majority of items were scored in an unhealthy direction. Actual cut scores are based on means from clinical unhealthy families, which ranged from 1.85 to 2.11 (Miller et al., 1985). A score at or above the cutoff indicates dissatisfaction with the dimension.
Psychiatric history
Psychiatric history was assessed using a questionnaire developed for this study that asked adult participants whether they were currently taking any medication for a psychiatric condition. Any family in which one or more adult members were taking medication for a psychiatric disorder, were counted as having a psychiatric diagnosis for the purpose of data analysis.
Social support
The Multidimensional Scale of Perceived Social Support (MSPSS; Zimet, Dahlem, Zimet, & Farley, 1988) is a 12-item self-report measure containing three subscales that assess participants’ perceptions of social support from family, friends, and significant others. Each subscale is comprised of four statements and participants respond on a 7-point Likert-type scale ranging from 1 (very strongly agree) to 7 (very strongly disagree) with lower scores signifying greater perceived social support. The sum of the three subscales comprises the total scale score. Total scores were used for this study. Chronbach’s α for the total score for the present study was .95.
Quality of life
The general activities section of Quality of Life-Enjoyment and Satisfaction Questionnaire (Q-LES-Q; Endicott, 1993). The general activities section of the Q-LES-Q is a 16-item self-report instrument that assesses participants' satisfaction and enjoyment with 14 areas of daily functioning (Hope, Page, & Hooke, 2009). Two additional items, not included in the score, assess participants’ satisfaction with their medication and their overall life satisfaction (Hope et al., 2009). Each item is rated between 0 (very poor satisfaction) and 4 (very good satisfaction). The 14 scored items on the Q-LES-Q are reported to have high test–retest reliability (interclass correlation coefficient .86) and high internal consistency (Cronbach’s α = .90; Rapaport, Clary, Fayyad, & Endicott, 2005). Total scores were used for this study. Chronbach’s α for the items that comprise the total score was .91.
Family income
Family income was measured using a self-report question that asked adult family members to identify which income bracket best represented their total family income for the past year. Adult participants chose from 10 income brackets; the first 8 income brackets are demarcated by $10,000 dollar increments ranging from $0–$79,000 and the last 2 income brackets include “$80,000–$99,999” and “$100,000+.” Existing research uses a variety of methods to analyze the impact of income on various well-being outcomes. Many studies use the federal poverty level, which is determined by income and family size, and other studies use an income to needs ratio. For the purposes of this study, families were divided into two groups: non-low-income families with incomes above 133% of the federal poverty level and low-income families with incomes below 133% of the federal poverty level, which is the criterion used to determine eligibility for Medicaid (Summary of the new health reform law, 2011). Self-reported income combined with family size was used to determine whether families were above or below 133% of the federal poverty level.
Results
Descriptive Statistics
Data analysis began with factorial analyses of variance (ANOVAs) for each dependent variable. Dependent variables were each of the FAD dimensions, the social support score, and the quality of life score. ANOVAS were as follows: 2 (low-income vs. non-low-income) × 2 (single-parent families vs. all other family constellations) × 2 (family has one or more members taking medication for a psychiatric disorder vs. not). Analyses were performed with the General Linear model (GLM) procedure in Statistical Analysis Software (SAS). The GLM procedure is preferable when group sizes are unequal, as is the case in the present study.
Descriptive statistics on the sample are presented by income group in Table 1. Means on all dependent variables are listed by income group in Table 2. Table 2 also lists the established cutoff score for unhealthy functioning on the FAD. Scores equal to or above the cutoff are in the unhealthy range. As the figures in Table 2 demonstrate, mean scores in the group of non-low-income families were all in the healthy range. In the low-income group, only Roles and Affective Responsiveness were in the unhealthy range. Factorial ANOVA models were significant for the following dependent variables: FAD Roles, F(7, 117) = 4.52, MS error = .09, p = .0001, FAD Affective Responsiveness, F(7, 117) = 4.06, MS error = .18 , p = .0005, FAD Behavior Control, F(7, 117) = 3.53, MS error = .09, p = .002, FAD General Functioning, F(7, 117) = 2.65, MS error = .16, p = .01, Quality of Life, F(7, 117) = 9.03, MS error = 49.65, p < .0001, and Social, Support, F(7, 117) = 9.94, MS error = 1.25, p < .0001. Each of the ANOVA models will be addressed in turn, with attention to significant main effects and interactions.
FAD Health/Pathology Cutoff Scores, Means, and Standard Deviation by Income and Social Support and Quality of Life by Income.
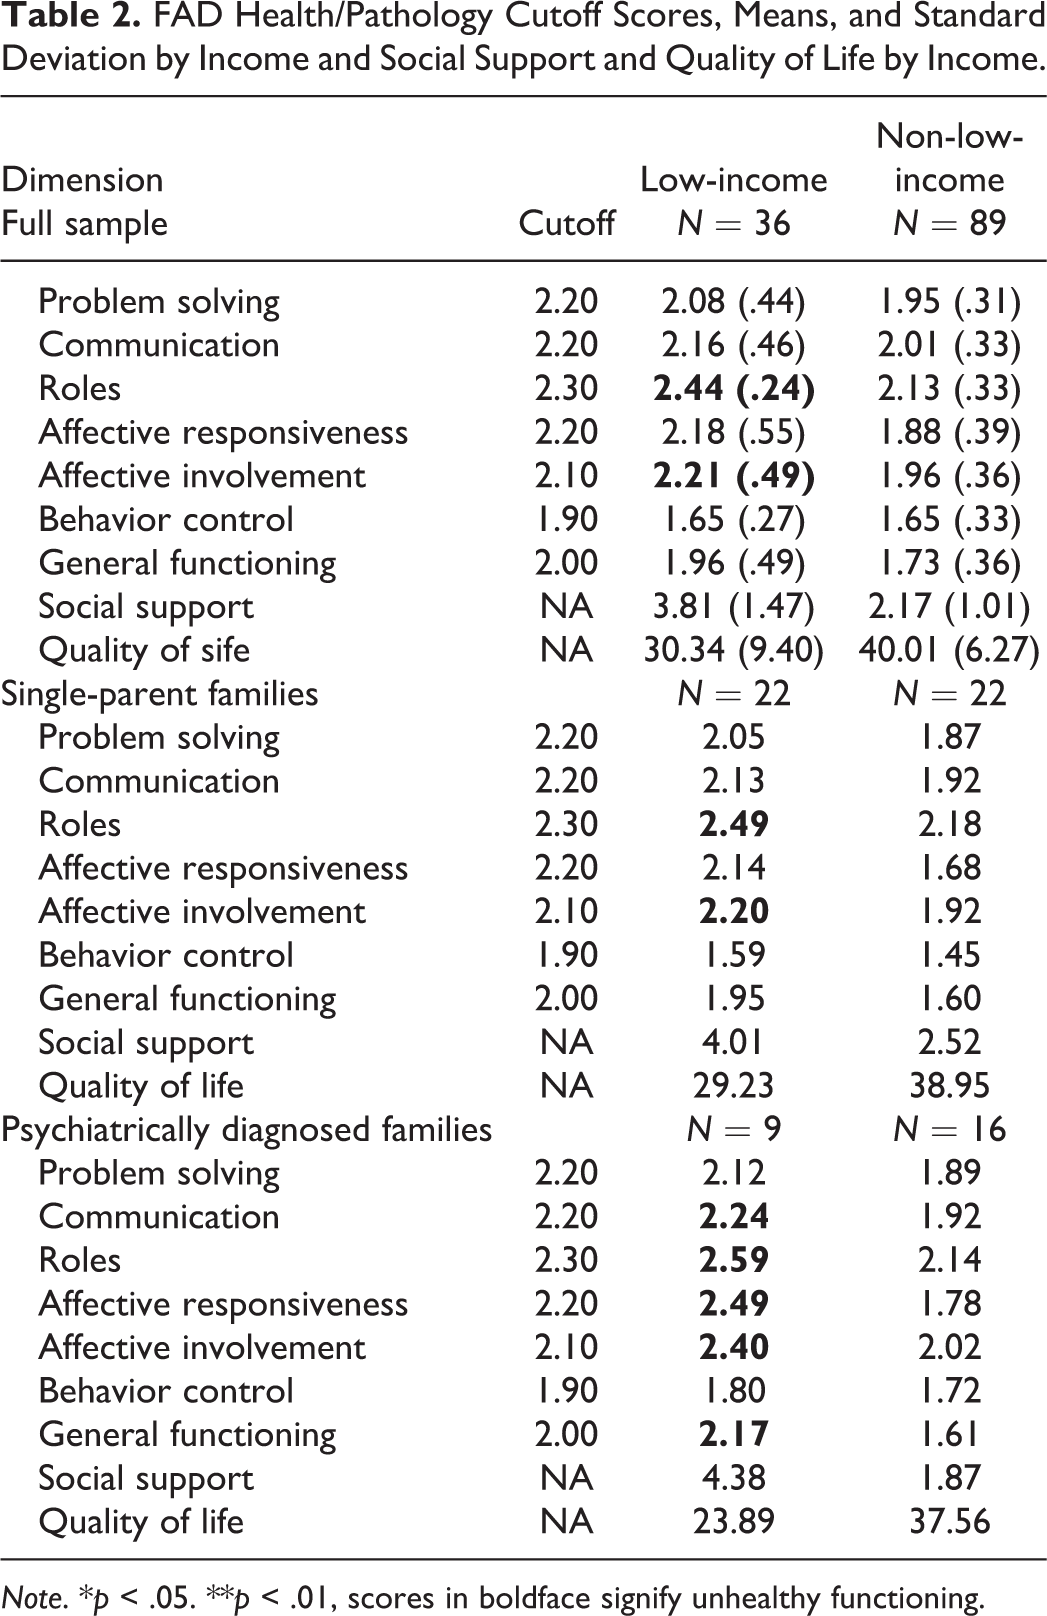
Note. *p < .05. **p < .01, scores in boldface signify unhealthy functioning.
General functioning
There was a main effect for income, F(1,=124) = 16.07, MS error = 2.53, p = .0001 indicating that low-income families endorsed less satisfaction with their general family functioning than did non-low-income families. There was no main effect for single-parent status or for psychiatric disorder status. However, there was a significant income by psychiatric diagnosis interaction, indicating that the relationship between psychiatric diagnosis and satisfaction with general family functioning depends on income level, F(1, 124) = 6.08, MS error = .96, p = .02. Figure 1 depicts this interaction and shows lower levels of satisfaction with general family functioning among low-income families with a psychiatric disorder than among non-low-income families with a psychiatric disorder. Non-low-income families with a psychiatric disorder had a mean score in the healthy range on the General Functioning scale. However, low-income families in which there was a psychiatric disorder (n = 9) had a mean General Functioning score that was in the unhealthy range (M = 2.17, SD = .31). Single-parent families in the non-low-income group endorsed more satisfaction with family functioning than did non-single parent families in this income group, but mean scores for all family constellations were in the healthy range.
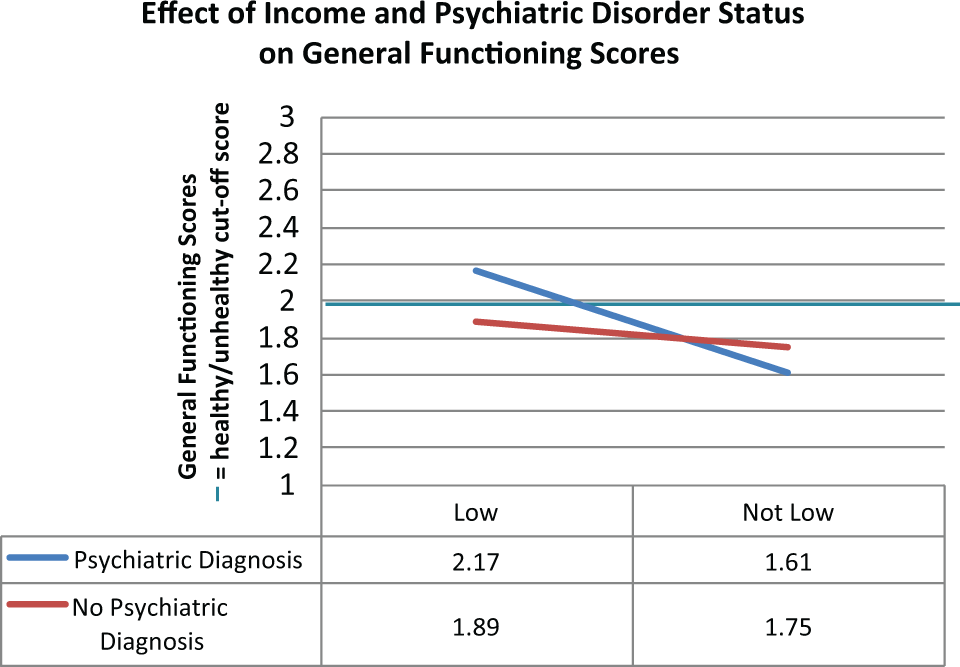
Effect of income and psychiatric disorder on general family functioning.
Roles
There was a main effect for income, F(1, 124) = 10.95, MS error = 1.03, p = .0012, indicating that low-income families endorsed less satisfaction with the way they allocated roles and responsibilities than did non-low-income families. As Table 2 indicates, the mean score for low-income families on the Roles dimension was in the unhealthy range. There were no main effects for single-parent status or for psychiatric disorder, and there were no significant interaction effects.
Affective responsiveness
There was a main effect for income F(1, 124) = 21.60, MS error = 3.88, p < .0001, indicating that low-income families endorsed less satisfaction with their capacity to experience and respond to a wide range of emotions in a way that is satisfactory to everyone in the family. The mean score for low-income families with a psychiatric disorder on this dimension was in the unhealthy range, whereas the mean score for non-low-income families with a psychiatric disorder was in the healthy range. There were no main effects for single-parent status or psychiatric disorder status. There was a significant interaction between income status and psychiatric diagnosis, indicating that the relationship between psychiatric disorder status and Affective Responsiveness depends on income. Single-parent families endorsed more satisfaction with Affective Responsiveness than did other family constellations, and all family constellations in both income groups were in the healthy range on this dimension.
Affective involvement
The overall 2×2×2 ANOVA model was not significant, F(7, 117) = 2.09, MS error = 16, p = .0500. Since the model only approached significance, we did not explore main effects or interactions. Interestingly, mean scores for all low-income groups were in the unhealthy range, whereas mean scores for all non-low-income groups were in the healthy range. This finding is depicted in Figure 2.
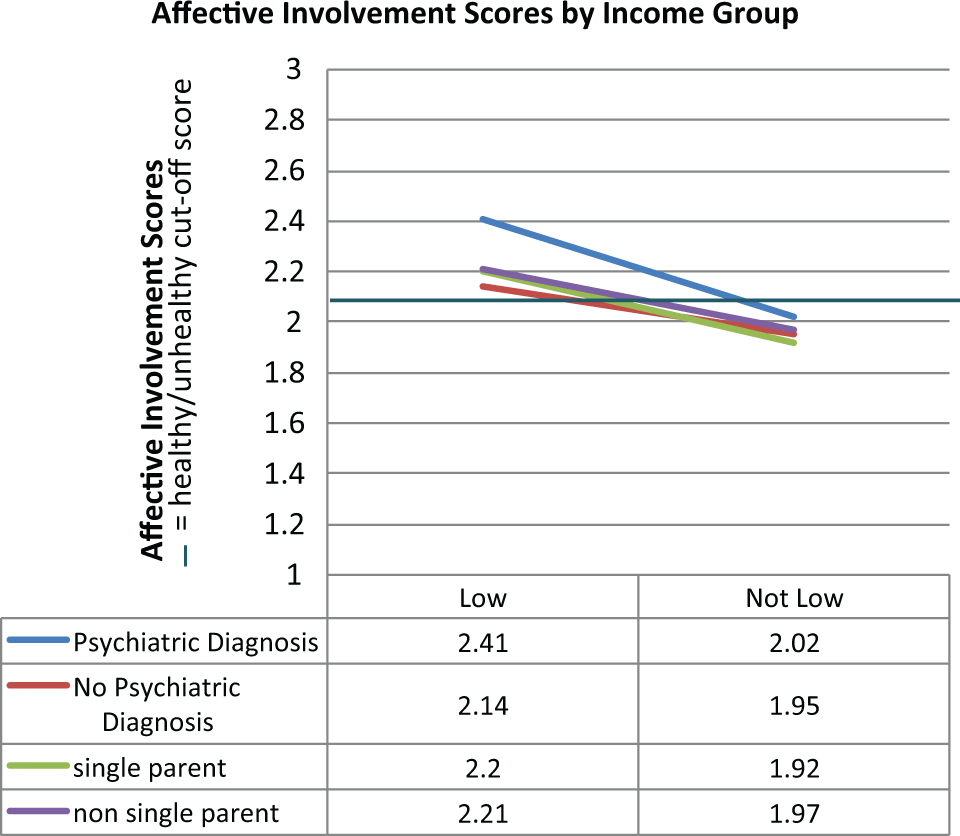
Affective involvement scores by income group.
Behavior control
Interestingly, there was not a main effect for income on this dimension. All FAD means were in the healthy range on this dimension, indicating that regardless of income, psychiatric disorder status, and single-parent status, all families reported satisfaction with their ability to identify standards of behavior, cope with dangerous behavior, and handle behavior that expresses a psychobiological need.
Social support
There was a main effect for income, F(1, 124) = 35.31, MS error = 44.30, p < .0001, indicating that low-income families were less satisfied with the levels of social support they receive, as is illustrated in Figure 3. Lower scores indicate better social support. The interaction between psychiatric disorder and income was not significant, F(1, 124) = 4.02, MS error = 5.04, p = .0473.
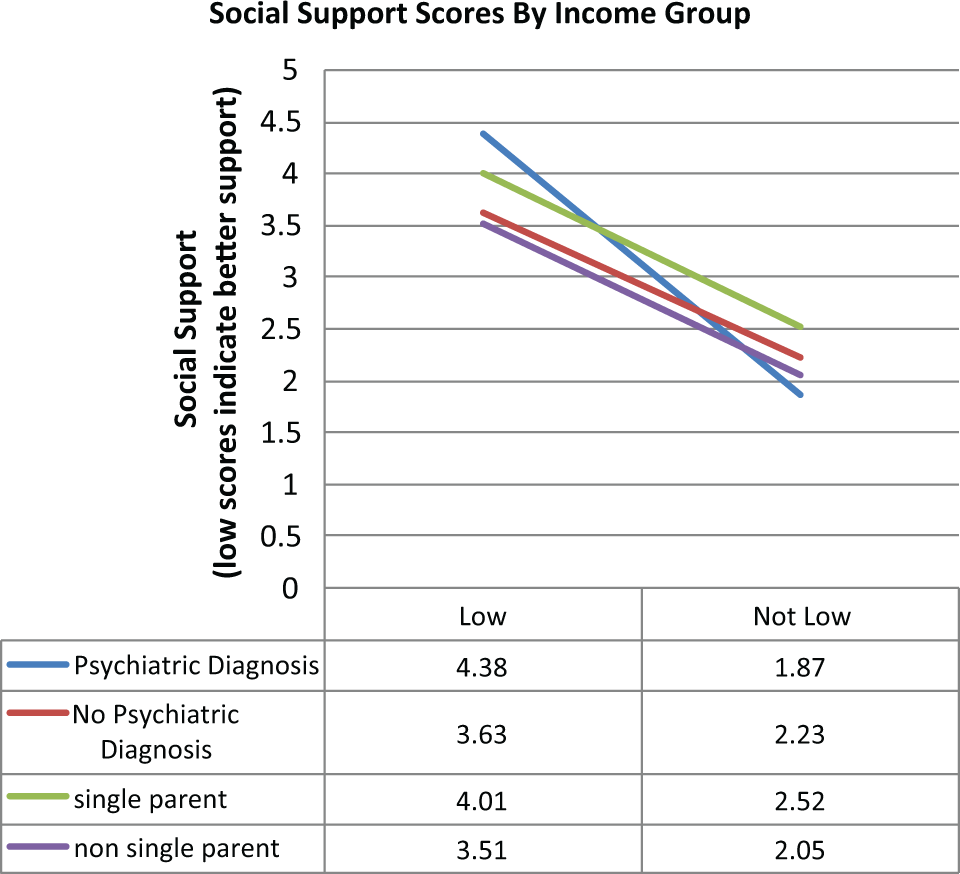
Social support scores by income.
Quality of life
There was a main effect for income, indicating that low-income families reported less life satisfaction than did non-low-income families, F(1, 124) = 26.20, MS = 1300.83, p < .0001. There was also a main effect for psychiatric disorder status, F(1, 124) = 6.64, MS = 329.55, p = .0112 , indicating that families with one or more members taking medication for a psychiatric disorder endorsed less life satisfaction than did families without anyone in the household taking medication for a psychiatric disorder. There were no significant interactions. These findings are illustrated in Figure 4.
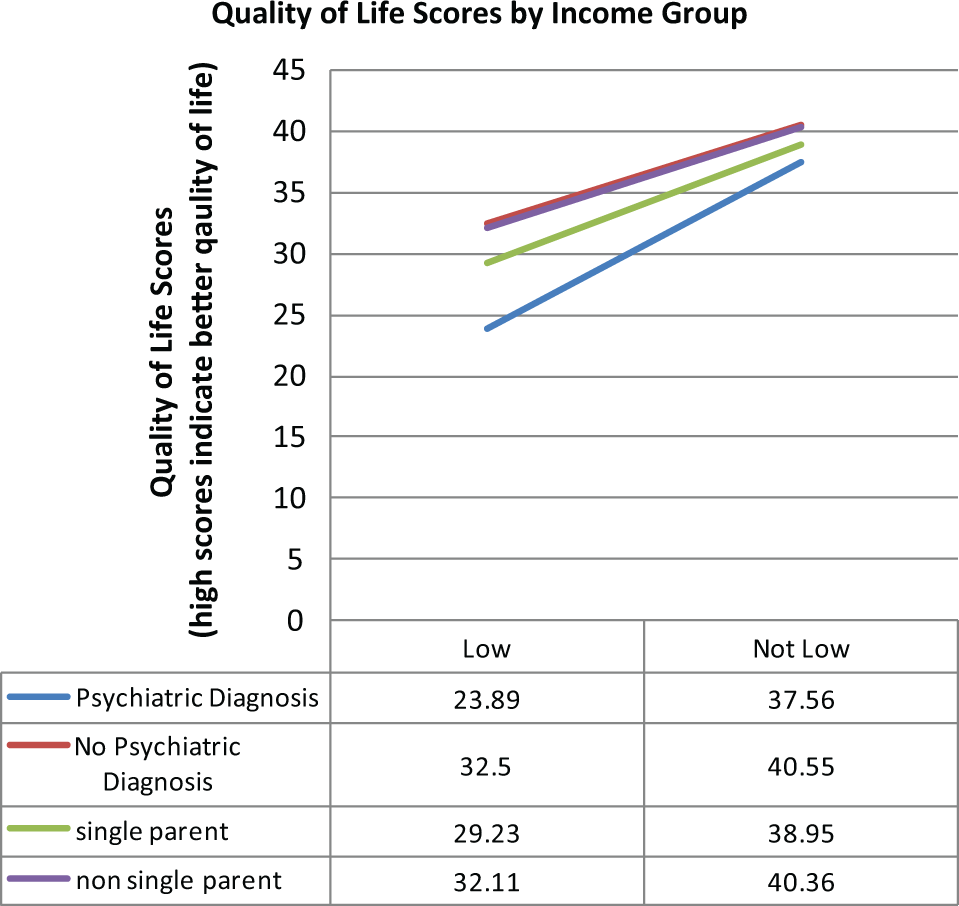
Quality of life scores by income.
Discussion
Findings from the present study have important implications for how clinicians conceptualize single-parent families, low-income families, and families in which one or more members is being treated for a psychiatric disorder. The present study suggests that these variables, by themselves, are not associated with poor satisfaction with overall family functioning.
Contrary to conventional wisdom, single-parent families endorsed greater satisfaction than did non-single-parent families on both General Functioning and Affective Responsiveness. These findings run counter to conventional wisdom, which suggests that single-parent families are in some way less happy than non-single-parent family constellations. Our data suggest that single-parent family constellations are as satisfied if not more satisfied with their family functioning than are non-single-parent family configurations.
These findings are consistent with studies that have found comparable rates of functioning between single-parent and two-parent families (Hanson, 1986; Hetherington, 1989; McFarlane, Bellissimo, & Norman, 1995). For instance, Hanson (1986) study of healthy single-parent and joint custody families found that single-parent families were able to function well and that the quality of parent to child communication and the presence of social support were both significantly related to single parents’ and their children’s physical and mental health. Similarly, McFarlane, Bellissimo, and Norman (1995) found that family configuration did not predict family functioning or well-being but that parenting style including appropriate rules, structure, and affective involvement predicted family functioning. Hetherington (1989), a 6-year longitudinal study of comparing child adjustment and well-being in remarried families, a non-remarried, mother-custody families, and non-divorced families, revealed that the impact of divorce on child well-being depended in part on a variety of factors included the child's temperament, parenting style, the presence or absence of structure, and social support outside of the immediate family. Therefore, although it may be true that single-parent households are at a greater risk of negative outcomes, single parenthood in itself may be a less accurate predictor of familial well-being than parenting style, affective involvement, social support, and temperament.
Our findings indicate that mean scores for low-income families were in the healthy range on all dimensions of family functioning except Roles and Affective Involvement. Perhaps when material resources are severely limited, it is more difficult to allocate roles and responsibilities, and to find satisfying ways for family members to be emotionally involved with each other. In a similar vein, low-income status was related to less satisfaction with social support and quality of life. Clinicians may be more effective in their work with low-income families by being sensitive to these issues.
Previous research has also documented that psychiatric diagnoses are associated with worse family functioning (Friedmann et al., 1997; Hooley & Teasdale, 1989; Keitner et al., 2009, 1987; Keitner et al., 2010; Uebelacker et al., 2006; Weinstock, Keitner, Ryan, Solomon, & Miller, 2006), findings from the present study highlight the compounding effect of income and psychiatric disorder status on family functioning. These data suggest that low-income status worsens the effect of psychiatric disorder status on general functioning and affective responsiveness. This finding suggests that low-income status and presence of a psychiatric disorder in the family act as a “double jeopardy,” and together, lead to greater dissatisfaction with family functioning than would either variable alone. In light of this, such families may benefit from services aimed at providing extra support to the family, and helping family members to support each other. Several studies have found that financial barriers are a salient barrier to mental health care and low income greatly increased the odds of receiving inadequate or no treatment (Sareen et al., 2007; Wang et al., 2005). However, present findings underscore the importance of allocating clinical resources that focus on family functioning to low-income families in which one or more members has an identified psychiatric disorder, even when clinical resources are limited.
Limitations
Limitations of the present study include the small size of the low-income subgroup, the way in which income was reported in $10,000 dollar increments ranging from $0–$79,000, $80,000–$99,999, and $100,000+ and the self-selecting nature of our sample. Families had to have a high enough level of functioning to respond to a community advertisement, coordinate scheduling among family members and travel to our clinic. Similarly, families had to agree to participate together. Due to these requirements, the sample may underrepresent families in the community with significantly impaired family functioning. Also, low-income and non-low-income groups differed in proportions of families from racial and ethnic minorities. However, data on poverty in Southern New England cities suggest similar overrepresentation of racial minorities in low-income groups (Poverty Rate by Race/Ethnicity, states (2008-2009), U.S. (2009), 2009).
Statistical power may have been hampered by the small sample size; however, our significant findings suggest that it is worthwhile and important to further explore the questions addressed in this study in a larger sample. Likewise, the FAD is designed to be reported as an aggregate score of all the family members within a household. However, in single-parent families with children under 12 years of age, we had to rely solely on the single-parent’s score.
Implications for Future Research
Future research should attempt to replicate the findings presented here in a larger sample, using an income to needs ratio to measure economic hardship, which may be a more precise indicator of economic hardship and include lower functioning families. In addition, a more rigorous assessment of psychiatric history would be helpful.
Research focusing on resiliency factors for low-income families indicates that familial cohesion, affective involvement and devotion are salient buffers against poverty's negative effects (Patterson, 2002; Santiago, Etter, Wadsworth, & Raviv, 2011; Schoon et al., 2011; Seccombe, 2002). Further literature suggests that meaningful family interactions, rituals, standards of behavior, and familial warmth decrease the risk of psychiatric disorders in children (Barnett, 2008; Kiser, 2007). Conversely, family dysfunction, punitive or neglectful parenting practices, and parental psychopathology have been associated with socio-emotional and psychological dysfunction and the subsequent development of psychopathology in children (Barnett, 2008; DeCarlo Santiago, Wadsworth, & Stump, 2011; Wadsworth et al., 2008). In light of such research, it is important to identify and offer services to families who are dissatisfied with their family functioning. Doing so may lessen the impact of psychiatric disorders and other socio-emotional dysfunction in children. Administering the FAD may be an expedient and cost effective way to assess satisfaction with family functioning and to determine the need for targeted interventions to improve functioning in areas that families identify as problematic. More research in this vein is needed and can hopefully build upon the results of the present study.
Footnotes
Declaration of Conflicting Interests
The author(s) declared no potential conflicts of interest with respect to the research, authorship, and/or publication of this article.
Funding
The author(s) disclosed receipt of the following financial support for the research, authorship, and/or publication of this article: This research was supported by a grant from The Firan Foundation.