
Abstract
The aim of the study was to explore the influence of gender, income, and religious beliefs on life satisfaction through affect and stress in families with and without mental illness. We examined variations depending on the presence of mental illness and minority status. Results indicated that the influence of gender, income, and religion on life satisfaction through affect and stress varied between families. Males with a family member with mental illness showed significant negative affect, while those without a family member with mental illness did not show gender differences in negative affect. Results also indicated that higher income did not significantly reduce negative affect in individuals with a family member with mental illness, regardless of minority status. Gender, income, and religious beliefs were not indirectly related to life satisfaction through affect and stress for individuals who had a family member with mental illness. These results are discussed, and clinical implications are offered.
Mental illness (MI) affects not only the person diagnosed but also the family of the individual (Crowe & Lyness, 2014). Having a family member with an MI has been recognized as a concern because it can influence overall family functioning, distress, family relationships, parenting, as well as custody arrangements (Crowe & Lyness, 2014, 2015; Perra et al., 2014; Savvidou et al., 2003). Therefore, studies have investigated family support systems for persons with MI and the complexity of family relationships within families where MI is present (Crowe & Lyness, 2014, 2015; Perra et al., 2014). Family support may be compromised when a mother has severe MI (Perra et al., 2014). Additionally, families experience distress related to MI and are less likely to have overall positive family functioning, communication, and satisfaction (Crowe & Lyness, 2014). On the other hand, authors have uncovered positive outcomes from families with MI. For example, mothers with MI have shared perspectives on parenting and family relationships, empowering parents with MI to cope and maintain a positive family life (Savvidou et al., 2003).
Recognizing the stress of families with MI, some studies have investigated the relationship among individual factors, mental health, and quality of life of those with a family member with MI (Caqueo-Urizar Gutierrez-Maldonado & Miranda-Castillo, 2009; Ennis & Bunting, 2013). However, there is a dearth of literature on how personal and sociodemographic factors could relate to life satisfaction through psychological factors between families with a family member with MI and those without. Understanding how families with and without MI experience emotional states, stress, and life satisfaction would be helpful for counselors and researchers to gain a deeper understanding of the relationship between personal factors and life satisfaction of families with MI.
Furthermore, it has been reported that minority populations tend to have more negative perspectives toward MI and are less likely to seek mental health services (Wong et al., 2017). For example, African Americans use mental health services at about half the rate of White and Asian Americans (Substance Abuse and Mental Health Services Administration [SAMHSA] 2015); however, in many instances, African Americans are at higher risk of MI. Researchers have explored the topic of the treatment gap (defined as the difference between those who need mental health services and those who seek mental health services), in order to understand what factors might impact it, particularly among racial and ethnic minorities (Crowe et al., 2016; Crumb et al., 2019; Dua, 1993; McGuire & Miranda, 2008; Wong et al., 2017). Although this literature has taken a beginning look at MI stigma among racial and ethnic minority members, less is known about families and MI among racial and ethnic minorities.
Because of the more negative perspectives toward MI and the stigma that exists toward seeking treatment for a mental health concern, people in minority statuses might experience more stress and negative emotional states and less life satisfaction when they have a family member with MI when compared to the White American population. Therefore, in this study, we were interested in how gender, income, and religious beliefs influence life satisfaction through positive and negative affect and stress between individuals with and without a family member with MI. We explored how minority status could play a role in the influence of gender, income, and religious beliefs on life satisfaction through affect and stress of individuals with a family member with mental health concerns and those who do not. In the next sections, we discuss literature on families, MI, and ethnicity.
Family With a Person With Mental Health Concerns
For decades, challenges of caregiving for a family member with MI have been recognized (Backer & Richardson, 1989; Thompson & Doll, 1982). Accordingly, it has been suggested that there should be practical supports for caregivers (Backer & Richardson, 1989). Earlier studies had investigated the family’s emotional, physical, and financial burdens when a member with MI returned home from institutions (Thompson & Doll, 1982). More specifically, Thompson and Doll (1982) reported that the majority of families (73% of those who participated in the study) responded that they were negatively affected, and around half of the participants indicated embarrassment or stigma. Also, most participants reported feeling overwhelmed by taking care of the family member (Thompson & Doll, 1982). Similarly, according to Corrigan and Watson (2007), family members tend to hide the person with MI in their family because of shame, blame, and stigma associated with it.
In the 1980s and 1990s, most likely because of deinstitutionalization issues, research on families who needed to care for their returning family member with MI received much attention. However, relative to those days, there has been a lack of attention on understanding stress, affect, and life satisfaction of families who have a family member with MI despite the fact that 46.6 million Americans in 2017 were living with MI (National Institute of Mental Health, 2019). Furthermore, it was reported that in developing countries, the economic burden was one of the significant factors that influenced caregivers of schizophrenia (Caqueo-Urizar Gutierrez-Maldonado & Miranda-Castillo, 2009).
Although numerous studies exist on how a family can support a family member with MI (Altshuler, 2001; Kohn-Wood & Wilson, 2005), there has been a lack of understanding on stress and emotional states that the rest of family members experience while living with a member with MI (Perra, Short, & Fernbacher, 2014). Overall distress has been measured in family caregivers, as well as family functioning and coping (Crowe & Lyness, 2014, 2015). It is also clear that families with a member who has mental health concerns worry about perceived public stigmas from others (Karnielli-Miller et al., 2013) and struggle with what has been referred to as stigma by association (Larson & Corrigan, 2008). Due to the unique stressors and disparities that racial/ethnic minority members face, as well as the decreased rate of seeking treatment and support, it is important to consider the impact of MI among these families.
Ethnicity and Perspectives Toward MI
It has been suggested that perceptions about MI should be viewed through a cultural lens (Papadopoulos et al., 2012). For example, in a more collective society, people tend to perceive MI as more stigmatizing because people in a collective community have less tolerance for diversity and pursue the norm (Papadopoulos et al., 2012). Thus, attitudes and stigma should be interpreted in the context of the culture from which the person comes (Corrigan & Watson, 2007). Overall, it has been reported that minority groups have negative perspectives toward MI and are less likely to seek help because of the stigma associated with it (Wong et al., 2017). According to Corrigan and Watson (2007), non-White participants have endorsed more stigma toward persons with mental health illness and their families. Also, in more recent findings, Asian Americans held more self-stigma and believed that people with MI were less likely to positively contribute to society (Wong et al., 2017). On the other hand, there have been mixed results related to the use of overall health care systems, including mental health treatment of African Americans (Schnittaker et al., 2005). According to Schnittaker and colleagues (2005), African Americans might be more willing to seek treatment with higher expectations when they have psychological issues compared to White American participants.
As well, families from non-majority race and ethnic groups may also face societal and other stressors such as discrimination, racism, and health disparities (SAMHSA, 2015) that can impact overall family functioning, stress, affect, and satisfaction. Accordingly, stress levels and affect could be different across cultures for those families with persons with MI. Although there is a beginning literature base on these topics as they relate to families with mental health concerns, there remains a lack of understanding on affect, stress, and life satisfaction that families with persons with MI experience, and how affect, stress and life satisfaction could be different, depending on ethnicity.
Therefore, the purpose of this study was to investigate affect, stress, and life satisfaction among families with or without MI, looking particularly at ethnicity to explore any differences. The following research questions framed the study: (1) It is hypothesized that gender, income, and religion influence differently life satisfaction through affect and stress between families with and without MI. (2) It is also hypothesized that influence of gender, income, and religious beliefs on life satisfaction through affect and stress would vary by family condition and minority status together. In the following section, we describe the research in detail.
Method
Participants and Procedures
Prior to conducting the research, institutional review board approval was granted. Using an electronic survey, a total of 2,749 respondents received the survey through a Qualtrics Panel. A total of 632 participants completed it, for a response rate of approximately 23%. Respondents were recruited from the general population and received a small amount of compensation (e.g., points toward a gift card, sky mileage) for participating. Several measures were taken to ensure fidelity of self-report responses including soft launch of the survey (n = 50) to determine the median length (11 min) of time for completion. Next, we examined the soft launch data to identify any cases where a participant had not answered thoughtfully (e.g., open-ended questions, including unreadable responses), removing three cases. Participants who completed the survey in less than one third of the median completion time were automatically terminated, resulting in 76 of the 2,749 cases being dropped.
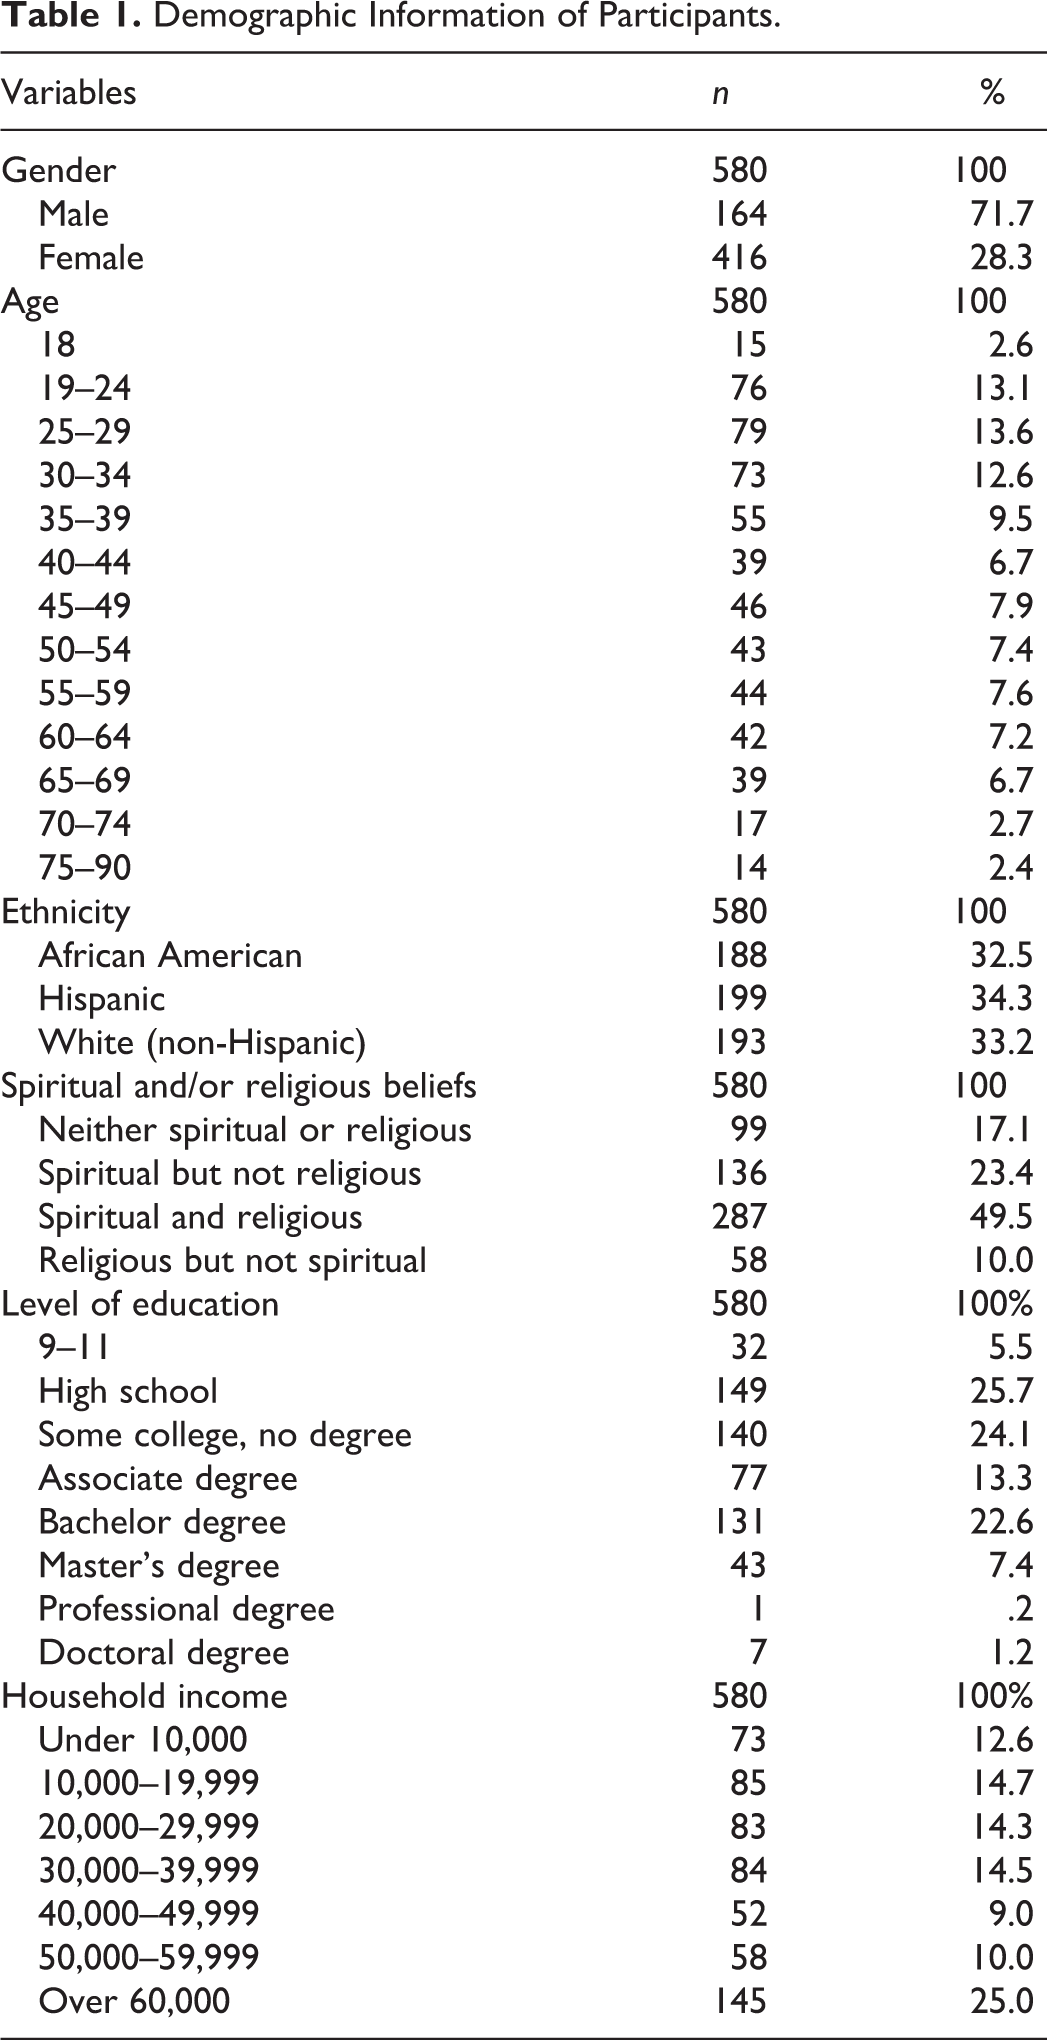
Data from two groups who clearly indicated whether they had family members who sought mental health treatment (or not) were analyzed. Therefore, among the 632 respondents, 254 of the participants chose “yes” to the question “Has anyone in your family ever sought treatment (e.g., counseling, therapy, or medication) for a mental health concern?” and 355 of the participants chose “no” to the question. Twenty-three of the participants chose “not sure,” and these cases were removed. Among these 609 participants, 29 who chose “don’t know,” “rather not say,” or “other” to household income question were not included. Table 1 includes sample characteristics.
Demographic Information of Participants.
Measures
Instruments used in this study included the Perceived Stress Scale (PSS; Cohen et al., 1983), the Satisfaction With Life Scale (SLS; Diener et al., 1985), and the Positive and Negative Affect Scale (PANAS; Watson et al., 1988). In addition to these formal measures, a demographic form was created to gather data on characteristics (e.g., gender, age, and ethnicity) and experience with mental health treatment (e.g., type of mental health concern, treatment, how much treatment was received, and whether this experience was positive or negative). The following section describes each instrument.
PSS
The PSS (Cohen et al., 1983) was used to measure stress. The PSS is a 10-item, one-dimensional self-report measure that assesses an individual’s degree of perceived stress. Participants rated the frequency for which they had experienced stress over the previous 30 days on a scale from 0 (never) to 4 (very often). Sample items included “In the last month, how often have you felt that things were going your way” (reverse coded), and “In the last month, how often have you been able to control irritations in your life?” Total scores were calculated by reversing Items 4, 5, 7, and 8 and summing the items. Average scores were found by dividing the total score by 10 with higher scores on the PSS indicating a higher degree of stress. The reliability of participants’ scores on the PSS has been shown to be good in prior research, with Cronbach’s α values ranging from .84 to .91 (Chao, 2011; Cohen et al., 1983; Daire et al., 2014). The Cronbach’s α for this investigation was .84, which indicated good internal consistency reliability.
SLS
The SLS (Diener et al., 1985) measured individuals’ satisfaction with life. The SLS is a five-item, one-dimensional self-report measure in which participants indicate level of agreement on a scale of 1 (strongly disagree) to 7 (strongly agree). Sample items include “I am satisfied with life” and “The conditions of my life are excellent.” Total scores were calculated by summing each item. Average scores are obtained by summing each item and dividing total scores by the total number of items. Higher scores suggest greater general satisfaction with life. The reliability of participants’ scores on the SLS has been good in prior research with a Cronbach’s α value of .83 (Vera et al., 2011; Wei et al., 2012). The Cronbach’s α for this investigation was .90, providing evidence of good internal consistency reliability.
PANAS
PANAS (Watson et al., 1988) is a 20-item scale designed to measure positive affect (10 items; e.g., enthusiastic, interested, determined) and negative affect (10 items; e.g., guilty, irritable, hostile) on a 5-point Likert-type scale ranging from very slightly or not at all to extremely. Twenty mood adjectives are listed, and participants indicate the extent to which they have felt any of these at the moment, in the past few hours, in the past few days, in the past few weeks, in the past year, or in general. In the original research, Watson and colleagues found that internal consistencies were strong for all time intervals for both positive and negative affect scales (see Watson et al., 1988). For the past few hours stem (which is what the current study used), α levels for the positive subscale were .92 and negative .94, suggesting very good internal consistency reliability.
Statistical Analysis
First, descriptive statistics for the total sample and independent t tests for two different groups, families with and without MI were conducted and then one-way analyses of variance (ANOVAs) for four groups were run. The purpose of the study was to investigate the difference between the two groups on the influence of gender, income, and religion on life satisfaction through affect and stress. Therefore, a multiple group path analysis was conducted using Mplus Version 7 to investigate the moderating role of family conditions. First, the model for the entire sample was tested to ensure the fit of the model before conducting multiple group path analyses (Figure 1). Then, multiple group path analysis was conducted to investigate how gender, income, and religion influenced life satisfaction through affect and stress differently between families with and without MI (Figure 2). The same model was tested to investigate the moderating effect of family condition and minority status combined (Figure 3).
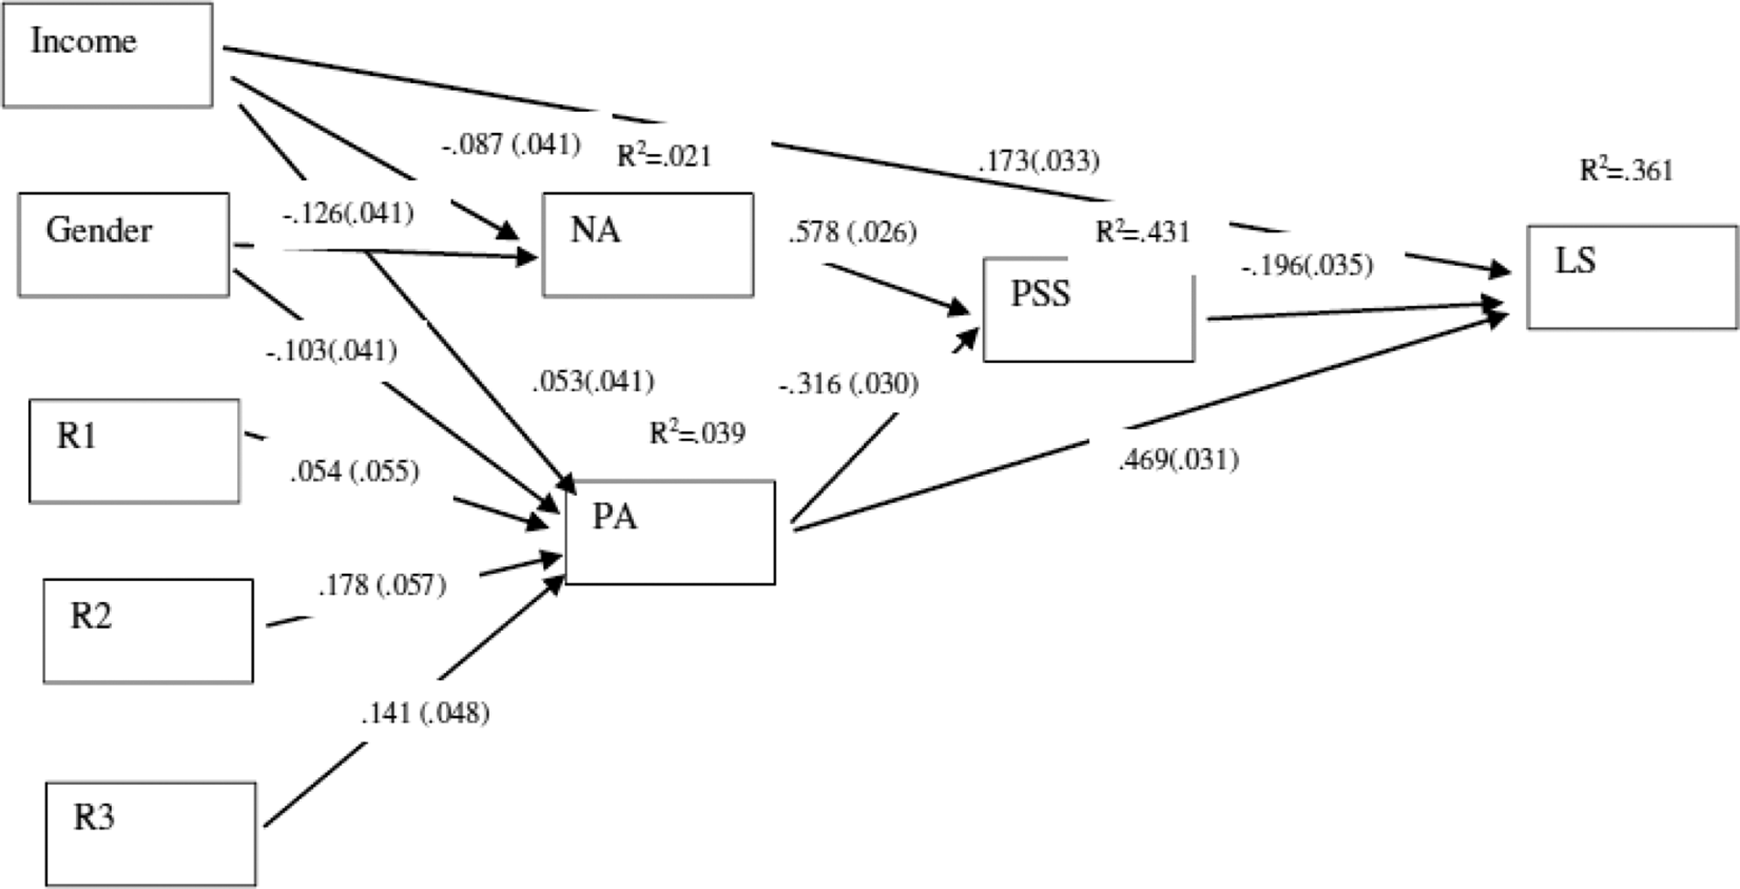
Path model for the total sample. Note. Standardized estimates are used with standard error in parentheses.
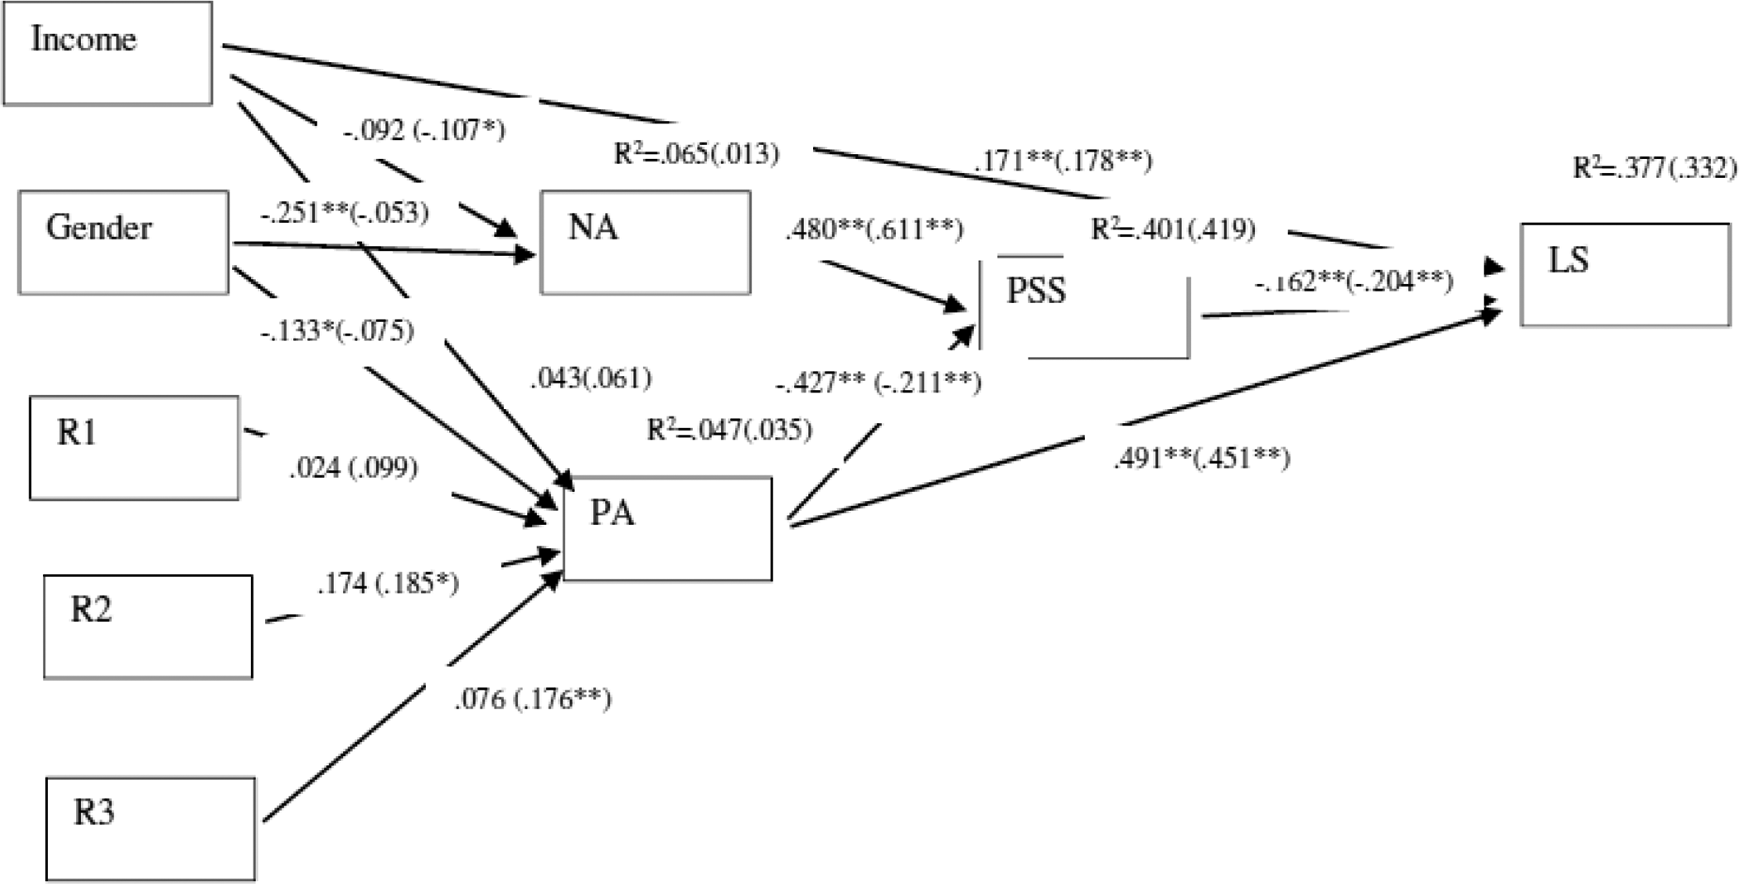
Unconstrained path model for families with and without mental illness (MI). Note. Standardized estimates for families with MI are outside parentheses, and standardized estimates for families without MI are within parentheses.
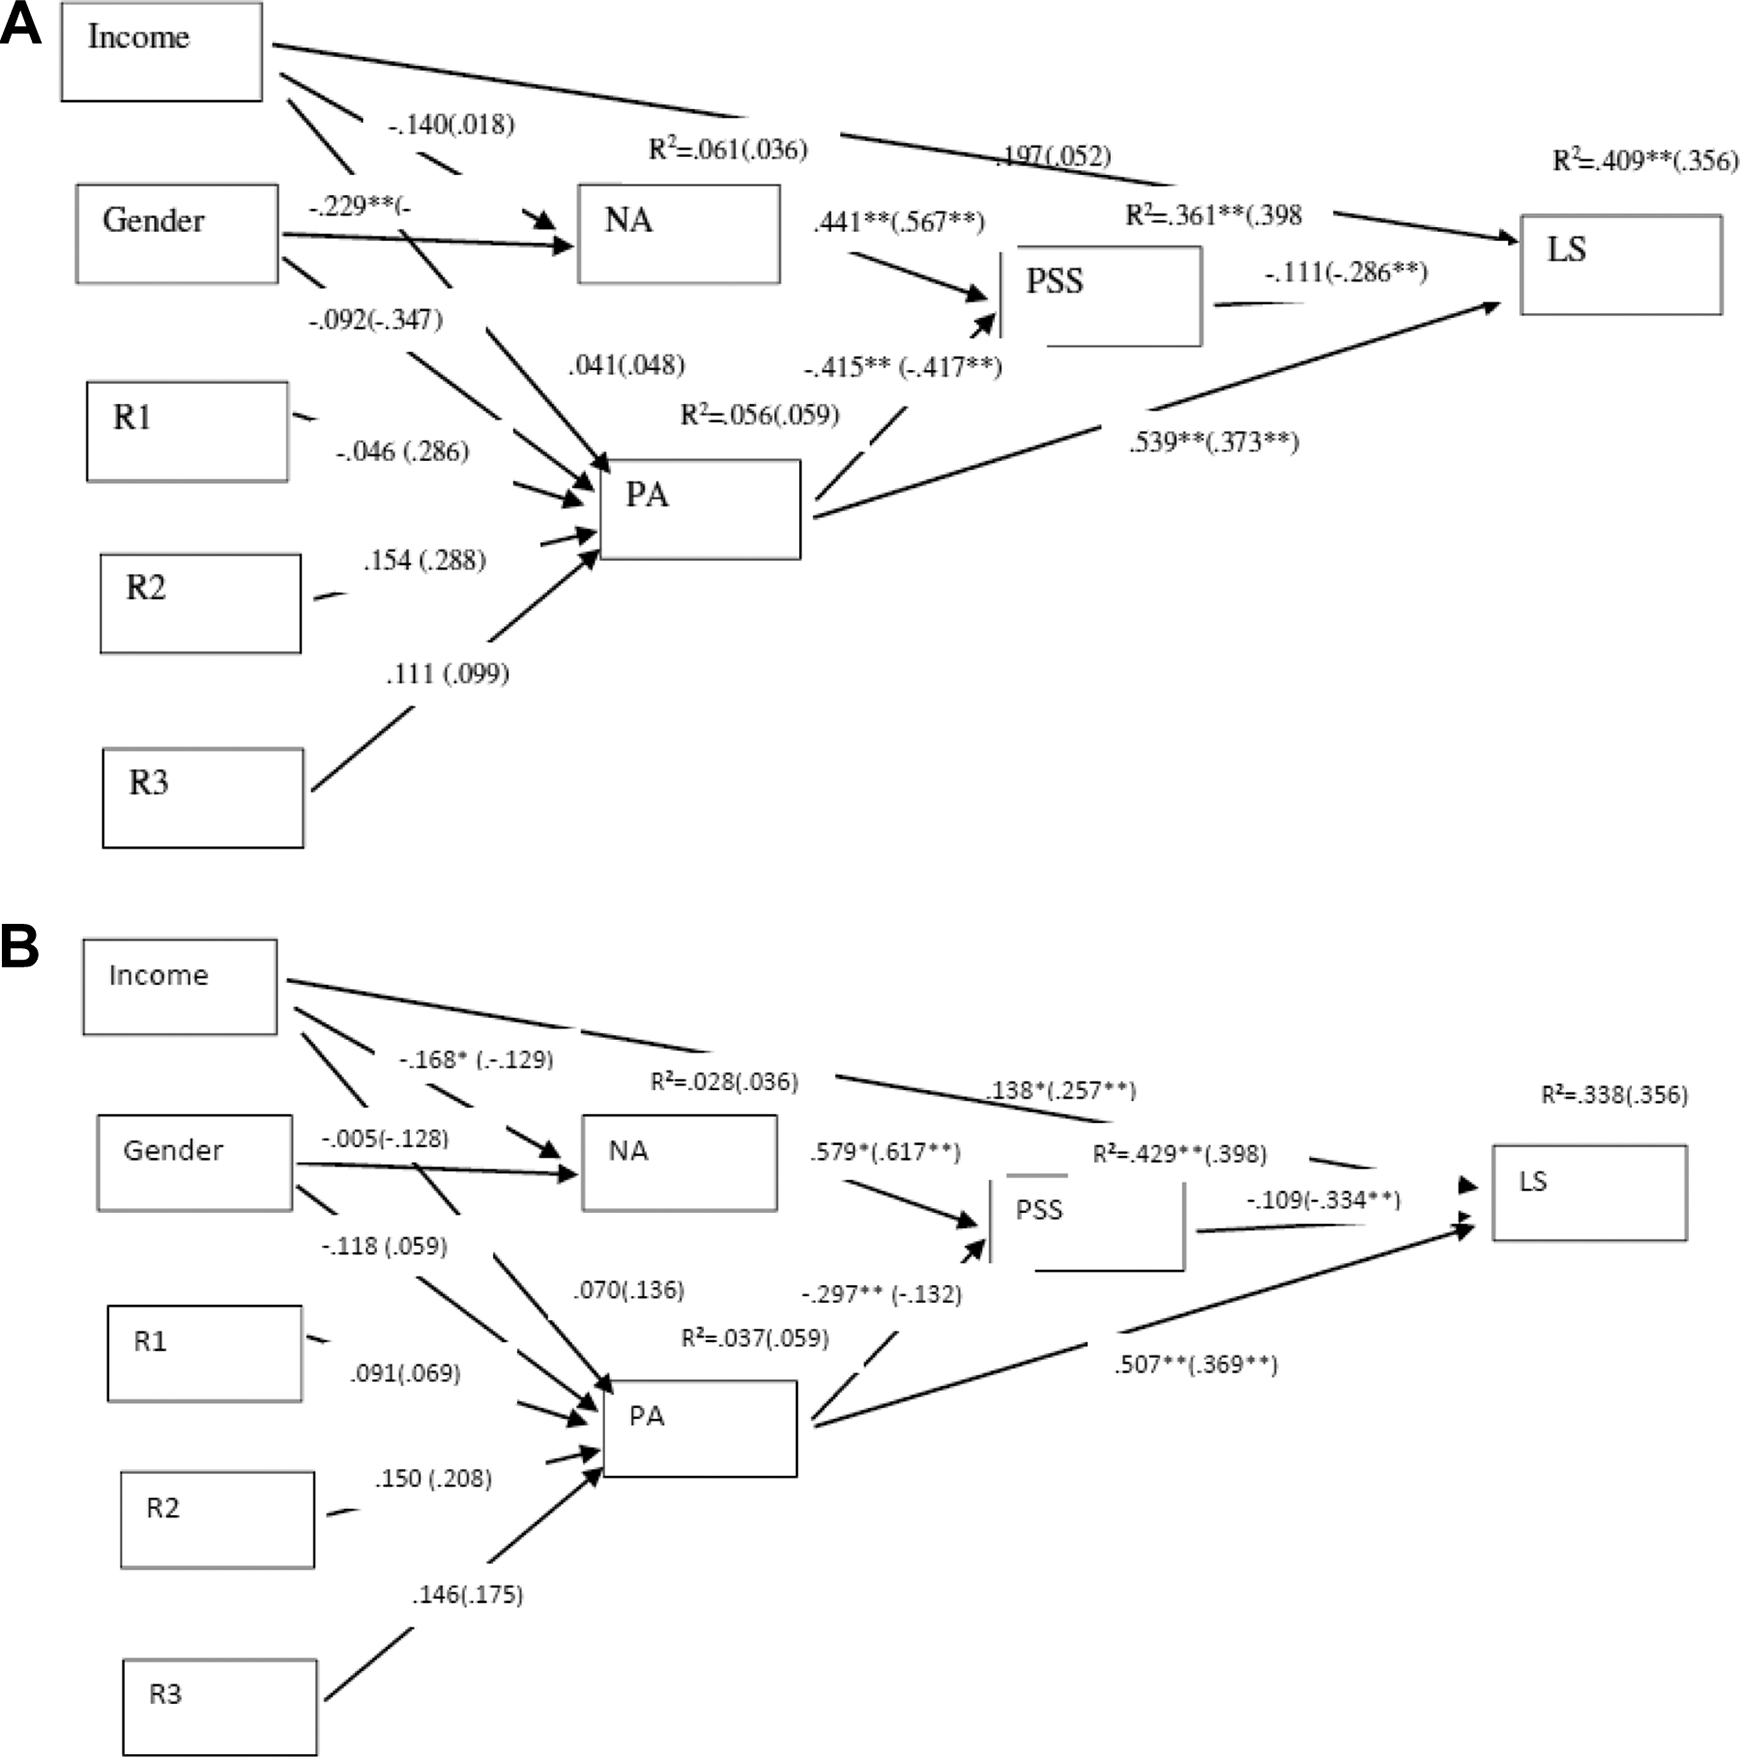
(A) Unconstrained path model for minority and White families with mental illness (MI). Note. Standardized estimates for minority families with MI are outside parentheses, and the standardized estimates for White families with MI are within parentheses. (B) Unconstrained path model for minority and White families without MI. Note. Standardized estimates for minority families without MI are outside parentheses, and the standardized estimates for White families without MI are within parentheses.
Results
Preliminary Analysis
Descriptive statistics are in Table 2. For the first hypothesis, independent t tests indicated statistically significant differences between the two groups across life satisfaction, t(477.59) = −2.58, p = .01; positive affect, t(482.18) = −2.38, p = .02; negative affect, t(471.46) = −6.76, p < .01; and stress (578) = −8.33, p < .01. Families with MI had higher negative affect (M = 2.33, SD = 1.07), higher stress (M = 2.11, SD = 0.72), lower positive affect (M = 2.99, SD = 1.06), and lower life satisfaction (M = 4.22, SD = 1.64) compared to families without MI. Families without MI showed lower negative affect (M = 1.74, SD = 0.92), lower stress (M = 1.60, SD = 0.76), higher life satisfaction (M = 4.55, SD = 1.43) and higher positive affect (M = 3.18, SD = 0.94).
Means and Standard Deviation of Predictors and Outcome Variables, Reliability Coefficients, and Correlations Between Scale Scores.
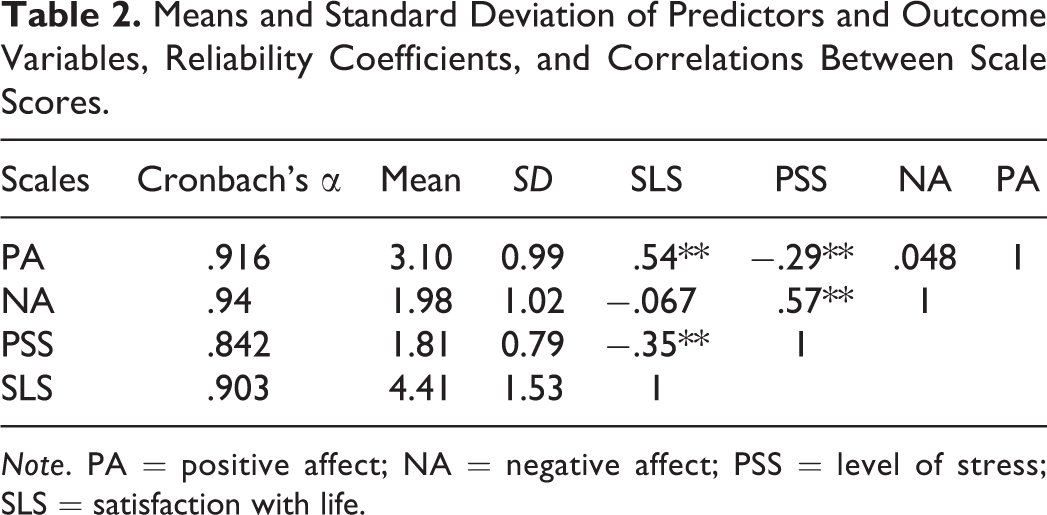
Note. PA = positive affect; NA = negative affect; PSS = level of stress; SLS = satisfaction with life.
For the second hypothesis, four groups were compared. According to one-way ANOVAs, there were significant differences across positive affect, F(3, 576) = 7.48, p < .001; negative affect, F(3, 576) = 20.43, p < .001; and stress, F(3, 576) = 28.85, p < .001, but not in life satisfaction, F(3, 576) = 2.62, p = .05 among four groups. The effect sizes of the one-way independent ANOVA, partial eta squared (
According to the results of Tukey’s post hoc tests, ethnic minority families with MI had significantly higher positive affect than White families with MI present (p = .018), and ethnic minority families without MI showed statistically higher positive affect than White families without MI (p = .025). On the other hand, ethnic minority families with MI had significantly higher negative affect than ethnic minority families without a member with MI (p < .001) and White Americans without an MI member (p < .001). However, there was no significant difference between ethnic minority families with MI and White Americans with MI in negative affect (p = .269). In line with negative affect, ethnic minority families with MI had significantly higher stress than ethnic minority without MI (p < .001) and White Americans without an MI family member (p < .001). However, there was no significant difference in stress between ethnic minority families with MI and White Americans with MI in regard to stress (p = .99).
Main Analysis
Model testing for total sample
First, for the total sample, the path model was tested for the model fit. The results showed an excellent fit for the data, χ2(14) = 18.680, p = .177; root mean square error of approximation [RMSEA] = 0.024 with p = .952, standardized root mean residual [SRMR] = 0.021, comparative fit index [CFI] = .992, Tucker–Lewis index [TLI] = .986; see Figure 1. Therefore, we retained the model and used it for subsequent multigroup path analyses. First, we found that gender was indirectly related to life satisfaction through both negative (standardized indirect effect = .014, SE = .005, p = .008) and positive affect (standardized indirect effect = −.006, SE = .003, p = .025). Gender was negatively associated with negative affect (β = −.126, p = .002), and negative affect was positively associated with stress (β = .578, p < 001). Then, stress was negatively related to life satisfaction (β = −.196, p < 001). Also, gender was negatively associated with positive affect (β = −.103, p = .012), and positive affect was negatively associated with stress (β = −.316, p < 001). Then, stress was negatively related to life satisfaction (β = −.196, p < 001).
Secondly, income did not have statistically significant indirect relationship with life satisfaction through negative affect and stress (standardized indirect effect = .010, SE = .005, p = .050), though the p value was at the significance level of .05. Third, we also found that religious beliefs were significantly indirectly related to life satisfaction through positive affect and stress when families were spiritual and religious (standardized indirect effect = .011, SE = .004, p = .008) and religious and not spiritual (standardized indirect effect = .009, SE = .003, p = .012) compared to those who were neither spiritual nor religious. More specifically, those who were spiritual and religious showed higher scores in positive affect (β = .178, p = .002), and those who were religious and not spiritual also showed higher scores in positive affect (β = .141, p = .003) compared to those who were neither spiritual nor religious.
Positive affect was negatively associated with stress (β = −.316, p < 001). Lastly, stress was negatively related to life satisfaction (β = −.196, p < 001). Overall, for the total sample, the model explained 36.1% (p < .001) of the variance in life satisfaction, 3.9% (p = .013) of the variance in positive affect, and 43.1% (p < .001) of the variance in stress for the total sample. Meanwhile, negative affect was not significantly explained by the model, 2.1% (p = .077).
First, the unconstrained model was tested, and the model showed a very good fit, χ2(28) = 39.831, p = .0685; RMSEA = .038 with p = .755, SRMR = .035, CFI = .979, TLI = .962, see Figure 2. Second, a constrained model was examined to investigate moderation of the group effect, and the model indicated an appropriate fit, χ2(40) = 70.491, p = .0021; RMSEA = .051, SRMR = .051, CFI = .947, TLI = .931. Then, the difference between the two models using the χ2 difference test (χ2 diff) was tested, resulting in a statistically significant difference, χ2 diff (12) = 30.66, p = .002. Therefore, it indicated that the influence of gender, income, and religion on life satisfaction through affect and stress varied by families with and without MI. Furthermore, each path was unconstrained in examining the difference between the two groups. The path from gender to negative affect was different between the two groups. Gender had a negative effect on negative affect (β = −.251, p < .001) for a family with MI; meanwhile, gender did not affect negative affect (β = −.053, p = .333) for families without MI. Also, the path from affect to stress was different between the two groups. Negative affect had a positive effect on stress (β = .476, p < .001) for a family with MI, and negative affect also had a higher positive effect on stress (β = .603, p < .001) for a family without MI. Also, the path from positive affect to stress was different between the two groups. Positive affect had a higher negative effect on stress (β = −.412, p < .001) for a family with MI than a negative effect on stress (β = −.224, p < .001) for the family without MI.
Also, the unconstrained model showed that gender was indirectly related to life satisfaction through negative affect and stress (standardized indirect effect = .019, SE = .009, p = .022) for a family with a mentally ill member. Gender was negatively associated with negative affect (β = −.251, p < .001), and negative affect was positively associated with stress (β = .480, p < 001). Then, stress was negatively related to life satisfaction (β = −.162, p = 003) for a family with MI. However, regarding religious beliefs, only families without MI showed a significant indirect relationship between religious belief and life satisfaction through positive affect and stress. Compared to those who were neither spiritual nor religious, those who were spiritual and religious (standardized indirect effect = .009, SE = .004, p = .043) had higher positive affect (β = .185, p = .012), and those who were religious and not spiritual (standardized indirect effect = .008, SE = .004, p = .034) also had higher positive affect (β = .176, p = .006).
For the family with MI, the unconstrained model explained 37.7% of the variance in life satisfaction, 6.5% of the variance in negative affect, and 40.1% of the variance in stress. On the other hand, the model accounts for 33.2% of the variance in life satisfaction and 41.9% of the variance in stress for the family without MI.
The same model was examined across four different groups: ethnic minority families with MI (n = 174), ethnic minority families without MI (n = 231), White families with MI (n = 80), and White families without MI (n = 124). First, the unconstrained model was tested, and the model showed a good fit, χ2(56) = 74.358, p = .0509; RMSEA = .046 with p = .562, SRMR = .050, CFI = .969, TLI = .943; Figure 3. Second, the constrained model for moderation of the group effect indicated less appropriate fit, χ2(92) = 134.641, p = .0025; RMSEA = .055 with p = .323, SRMR = .073, CFI = .928, TLI = .919. Then, the significant difference between the two models using the χ2 difference test was examined, and it showed a statistically significant difference, χ2 diff (36) = 60.283, p = .006. It indicated that the influence of gender, income, and religion on life satisfaction through affect and stress varied by the integration of family condition and minority status. First, the path from gender to negative affect was different among the four groups. Gender had a negative effect on negative affect (β = −.217, p = .003) for ethnic minority families with MI; meanwhile, gender had no effect on negative affect (β = −.010, p = .889) for ethnic minority families without MI. Also, for White Americans, gender had a negative effect on negative affect (β = −.290, p = .006) for a family with MI; meanwhile, gender did not affect negative affect (β = −.143, p = .111) for White families without MI.
Second, the path from income to negative affect was different among the four groups. Income did not have a significant negative effect on negative affect (β = −.122, p = .108) for ethnic minority families with MI, but income had a significant negative effect on negative affect (β = −.184, p = .005) for ethnic minority families without MI. For White Americans, income had no statistically significant effect on negative affect (β = −.058, p = .610) for a family with MI as well as for family without (β = .129, p = .151). Third, the path from positive affect to stress was not statistically different among the four groups, though, the p value was at the significance level of .05. Fourth, the path from negative affect to stress was different among the four groups. Negative affect had a positive effect on stress (β = .429, p < .001) for ethnic minority families with MI, and negative affect has also a positive effect on stress (β = .580, p < .001) for ethnic minority family without MI. For White Americans, negative affect also has a positive effect on stress (β = .580, p < .001) for a family with MI and without (β = .576, p < .001).
The unconstrained model suggested that there were no indirect associations between gender, income, and religious beliefs and life satisfaction through negative affect and stress for the four groups. However, the unconstrained model explained 40.9% of the variance in life satisfaction and 36.1% of the variance in stress for ethnic minority families with MI and explained 33.8% of the variance in life satisfaction and 42.9% of the variance in stress for the ethnic minority family without MI. For White groups, the model explained 32.2% of the variance in life satisfaction and 47.7% of the variance in stress for the family with MI and explained 35.6% of the variance in life satisfaction and 39.7% of the variance in stress for the family without MI.
Discussion
It is well-documented that MI influences not only the person diagnosed but also the family (Crowe & Lyness, 2014, 2015). Our study extends previous research by investigating the underlying mechanism of the relationship between gender, income, religious belief, and life satisfaction through affect and stress between families with and without MI. Furthermore, we examined whether gender, income, and religious beliefs influence life satisfaction through affect and stress differently depending on family condition (MI or not) and minority status combined. We discuss the results below and offer implications related to mental health and families in the following sections.
First, among the total sample, as hypothesized, our path analysis results suggested that gender and religious beliefs were indirectly related to life satisfaction. In the case of gender, in the present study, interestingly, males endorsed more negative as well as positive affect than females, which significantly influenced stress, which eventually related to life satisfaction. Even though, in general, females are found to be more emotionally expressive and have more frequent emotions (Kelly & Hutson-Comeaux, 1999), this study showed a more complex picture of affect according to gender. There have been studies that show the complex mechanism of differences in emotions between genders. Experience and expressiveness of emotions could be context-specific (Kelly & Hutson-Comeaux, 1999), and males and females may experience internal feelings similarly but express them differently (Johnson & Shulman, 1988). However, it is still intriguing and worthy of more investigation as to why male participants in this study showed increased positive and negative affect. Regarding religious beliefs, comparing those who were neither spiritual nor religious, people who were spiritual and religious and people who were religious but not spiritual seem to benefit from religious beliefs, which positively influences their positive affect, and in turn negatively influences their level of stress, which eventually influences life satisfaction. The present study is in line with previous studies that show the positive impact of religion and spirituality on mental health and life satisfaction (Koenig, 2012).
The influence of gender, income, and religions on life satisfaction through affect and stress would be different between families with and without MI.
We were interested in the moderating effect of family condition, whether or not MI was present in the family, assuming that personal variables such as gender, income, and religion influence life satisfaction through affect and stress differently. In the present study, individuals who had a family member with MI showed higher negative affect and stress as well as less life satisfaction and positive affect compared to those families without MI. Results of the path model showed a more complex and interesting mechanism underlying the relationship between gender, income, religious belief, and life satisfaction through affect and stress. The relationship between gender and negative affect, and the relationship between negative and positive affect and stress level were different between the two groups. In the case of gender, among families with MI present, males showed more negative affect than females. In contrast, males and females did not show significantly different negative emotions when they did not have a family member with MI. Based on these findings, it might be interpreted that for families living with a family member with MI, males might experience negative emotions as much as or even more than females, although they are less expressive of these feelings. This is in line with previous research that suggests that males and females experience similar feelings, but adult males are less expressive of their emotions because of internalized gender stereotypes (Kelly & Hutson-Comeaux, 1999). Also, because of gender stereotypes, males might feel more comfortable showing negative emotions (Kelly & Hutson-Comeaux, 1999).
Furthermore, individuals who do not have a family member with MI seem to be more easily stressed when they feel negative feelings than those who have family members with MI; however, both groups’ stress levels were significantly influenced by their negative feelings. It could be interpreted that families with MI are used to having negative affect and more likely to internalize these emotions. Also, for individuals who have a family member with MI, positive emotions much more strongly reduced the level of stress than for those without a family member with MI. This might indicate the importance of feeling positive emotions for the family with MI present. They might have been more used to negative feelings, and even small positive feelings could assist with stress and life satisfaction. Earlier studies reported that families who caregive for a family member with MI at home showed a significant level of stress (Crowe & Brinkley, 2015; Thompson & Doll, 1982), specifically in families that spend a significant amount of time caregiving with a family member with more serious mental health symptoms. On the other hand, positive affect has been found to have a buffering effect when individuals experience negative affect (Lankarani & Assari, 2017). Therefore, it is vital to pay attention and support individuals and families with a member with MI to lessen these types of psychological concerns that may be present.
The influence of gender and income on life satisfaction through affect and stress would vary by family condition and minority status together.
Furthermore, we were interested in how family condition and minority status influenced gender, income, and religion on life satisfaction through affect and stress differently. In terms of gender, regardless of minority status, in families with MI, males experienced more negative feelings, while males and females who do not have a family member with MI did not show a difference in negative feelings. It could be interpreted that it is not important whether they are racial/ethnic minorities or not. When individuals have a family member with MI, they can’t avoid negative emotions, and interestingly, males experience negative emotions even higher than females. As stated previously, it would be essential to pay attention to male family members and understand how they cope with their negative emotions. However, in the case of income, results suggested a more complex picture of the relationship between income and negative affect. Interestingly, only people in the ethnic minority group who do not have a family member with MI showed more negative affect when they also had less income. On the other hand, for White Americans, regardless of family condition, income did not have a significant impact on negative affect. White Americans might have different factors that have a more substantial impact on negative affect. There have been studies that support these findings related to the differences among ethnic/racial groups on positive and negative affect (Lankarani & Assari, 2017). Overall, it seems that higher income doesn’t significantly influence negative feelings for individuals who have a family member with MI. This might indicate there are more important factors such as social support that reduce negative affect and eventually stress for families with MI. For instance, studies have suggested the importance of education and systems of care for family caregivers (Burland, 1998).
More recently (Crowe & Brinkley, 2015), income was examined to see how it might impact the overall mental health in family caregivers for someone with an MI, and income did not appear to affect depression or family discord in caregivers for a family member with serious mental illness (SMI). It is noteworthy, however, that money shortages were an important variable in looking at overall distress that families with MI experienced, and authors suggested that further investigation was warranted. Thus, the current study extended this line of inquiry but revealed complex results.
On the other hand, across all groups, the level of influence of the negative impact of stress seems similar across four groups, but the results showed a more complex understanding of their negative emotions. Regardless of the minority status, individuals who do not have a family member with MI seem to feel more easily stressed when they experience negative affect.
Implications for Research and Practice
The following study includes implications for both research and practice as it relates to families from ethnic minority groups, particularly those who have a family member diagnosed with MI. First, those families who have a member with MI may experience higher stress, negative affect, and less life satisfaction. Importantly, regardless of minority status, males of those families who have a member with MI showed more negative affect, which in turn influenced stress and eventually life satisfaction. Furthermore, regardless of minority status, there seem to be more critical factors than income, which could significantly reduce the level of stress for individuals who have a family member with MI, and it would be essential to investigate those buffering factors that influence their affect and lead to life satisfaction. Counselors who work with families with MI present should pay particular attention to these factors and ask families about their levels of stress, negative affect, life satisfaction, and how these might be improved through family counseling and other therapeutical modalities. Psychoeducation related to how caregiving and coping with MI can impact these factors might be helpful so that families begin to understand the impacts of MI and address how to improve these when warranted. Counselors may consider ways to also address possible stigma or shame that the family may be feeling and normalize mental health so that these stigmas can be decreased. As well, family counselors are urged to consider discussing demographic characteristics such as gender, racial/ethnic status, income, and religious beliefs and how these may or may not impact the family with MI, particularly thinking about interventions that target emotions since this study looked at affect, specifically. Individual assessments as well as measures that look at the overall family’s distress and well-being might be helpful for family counselors to use when working with family caregivers. Perhaps measuring this at the beginning and end of the counseling relationship will assist families in observing any changes over the course of treatment. Family counselors might pay particular attention to male family members and inquire about negative affect, stress, satisfaction, and similar factors since these may be less visible but more impactful.
Future research might look more closely at what factors might be impacting these challenges within families. It would be imperative to explore what factors might reduce negative affect among families with MI, meanwhile increasing positive affect to reduce stress and eventually lead to greater life satisfaction. Qualitative designs may assist researchers with uncovering perceptions and experiences of families with MI and provide helpful insight into how to impact these outcomes in the future. Along these lines, qualitative inquiries with African American, Hispanic, and White American families may also uncover some of the specific experiences related to majority/minority status in the United States for families with MI. These studies may include questions related to affect, stress, and satisfaction—potentially exploring relationships between these and demographic characteristics to better understand the experiences of families with a member who is diagnosed. For mental health clinicians, it seems important to consider topics such as stress, affect, and satisfaction when MI is present in the family. MI appears to impact the family, perhaps differently according to race/ethnicity as well, suggesting that clinicians contemplate this as well.
Limitations
As with all research, our study is not without limitations. One limitation of the current study relates to the three racial/ethnic groups we sampled, and sample size for each group for multiple group path analysis, where two minority groups were combined. Future researchers should gather data from other racial/ethnic populations such as Asian Americans to better understand the interaction between family conditions and ethnicity. Also, in the future, it would be essential to investigate what factors influence stress levels of individuals who have a family member with MI to find support systems that could moderate stress and life satisfaction to lessen these and promote life satisfaction. It also may be important to further explore different types of internal and personal variables that explain some of the differences we found among participants. We used a convenience sample using a Qualtrics survey panel, so future research might include participants without access to a computer in order to ensure that results are generalizable.
Conclusion
Gender, income, and religion influenced life satisfaction through affect and stress; however, differences existed in processing negative and positive affect in families with and without MI. Males of all ethnicities with a family member with MI experienced more negative emotions than females. Counselors might pay attention to male family members even if they don’t express negative affect openly. We focused on individual factors so external factors that influence emotions of the family with MI seem important to investigate. These factors could buffer against stress, affect, and life satisfaction in families with MI.
Footnotes
Declaration of Conflicting Interests
The author(s) declared no potential conflicts of interest with respect to the research, authorship, and/or publication of this article.
Funding
The author(s) received no financial support for the research, authorship, and/or publication of this article.