
Abstract
Myxofibrosarcomas (MFS) present as slowly enlarging superficial masses in elderly patients. Even though these tumors fail to exhibit a distinct immunophenotype, diagnosis is straightforward when they present in subcutaneous tissue. Intramuscular MFS, however, are more challenging to diagnose as the differential also includes dedifferentiated liposarcoma with myxoid features. The vast majority of dedifferentiated liposarcomas show MDM2 amplification, whereas limited data exists as to the MDM2 status of MFS. We sought to explore the rate of MDM2 amplification in cases of classic MFS. Our archives were searched for MFS; only subcutaneous well-sampled resections were included. FISH for MDM2 amplification was performed on each tumor. A cohort of myxoid dedifferentiated liposarcoma resections was studied for comparison. Twenty-two MFS arose in patients aged 44 to 85 years. All tumors contained an infiltrative population of atypical cells embedded in a myxoid stroma with curvilinear blood vessels. MDM2 amplification by FISH was identified in 3 (of 22; 14%) tumors. Available follow up on 17 patients (range 1-96 months; median 13 months) revealed 6 patients with local recurrence and 1 with distant metastasis. Of 3 patients with MDM2- amplified MFS, 1 experienced recurrence and died of unrelated causes, while the second was alive without disease 12 months after diagnosis. Even though the rate of MDM2 amplification by FISH in MFS appears to be low, a subset of cases may show this genetic alteration, which pathologists should be aware of to avoid misclassification as myxoid dedifferentiated liposarcomas. Further studies are necessary to determine if amplification status adds prognostic value.
Introduction
Myxofibrosarcomas (MFS) are locally aggressive and potentially metastasizing sarcomas that classically present as slowly enlarging masses in elderly patients and consist of variably atypical spindled cells in an at least focally myxomatous stroma. Most MFS occur in dermal/subcutaneous tissue of the proximal extremities and diagnosis is relatively straightforward in this setting. However, up to one third may arise below the fascia or intramuscularly in the extremity; in this setting the differential diagnoses include dedifferentiated liposarcoma with myxoid features.1,2 The vast majority of dedifferentiated liposarcomas show MDM2 amplification, whereas limited data exists as to the MDM2 amplification status of MFS.3–10 Therefore, we sought to explore the rate of MDM2 amplification in cases of classic MFS to determine its utility in this diagnostic setting.
Methods
The Institutional Review Board of the Mayo Clinic approved this study. Institutional and personal consultation (KJF) archives were searched for cases of primary MFS and myxoid dedifferentiated liposarcoma resection specimens without prior treatment. To be included in this study, tumors needed to be well sampled (at least 1 section/cm). Only superficial (above the fascia) MFS cases were included. Cases of dedifferentiated liposarcoma required histologic confirmation of both well-differentiated and dedifferentiated components. Clinical and follow-up information was obtained from medical records and referring institutions.
Interphase Enumeration FISH Method
Each tumor was analyzed for MDM2 copy number using an enumeration strategy. Abbott Molecular CEP 12 (D12Z3) labeled in Spectrum Green and Abbott Molecular MDM2 (12q15) labeled in Spectrum Orange was mixed with LSI/WCP hybridization buffer. Slides were placed in a 90 °C oven for 15 min. Slides were then deparaffinized with xylene (2 times, 15 minutes each) at room temperature (RT), dehydrated in 100% ethanol for 5 minutes at RT, and placed in 10 mM citric acid (pH 6.0) and microwaved for 10 minutes. Following this, the slides were immersed in 2× standard saline citrate (SSC) for 5 minutes at 37 °C followed by digestion in 0.2% pepsin working solution (1.2 g pepsin/600 mL 0.9% NaCl pH 1.5) at 37 °C for 12 minutes. Immediately after digestion, the slides were dehydrated using an ethanol series (70%, 85%, 100%) 2 minutes each at RT. The slide and probe were co-denatured and hybridized overnight. Slides were then washed and DAPI counterstain was applied as well as a glass coverslip. Visualization of the FISH signals was accomplished by use of a fluorescent microscope and images were captured using a FISH imaging system. Two reviewers each analyzed 30 nuclei with FISH signals per sample. For this study, a qualifying nucleus for scoring purposes must contain at least 1 red signal and 1 green signal. Results were determined by calculating the ratio of MDM2 (orange) copy number to CEP 12 (green) signals using an Excel Spreadsheet. A ratio of MDM2 to CEP 12 greater than 1.30 indicated additional copies of were MDM2 present. A ratio greater than 2.0, and the presence of >6 MDM2 signals per cell indicated MDM2 gene amplification. Over 30% of nuclei with 3 or more green signals were indicative of aneusomy 12. A ratio of less 0.80 demonstrated loss of MDM2 relative to CEP 12. Ratios between 0.80 and 1.30 were considered normal.
OncoScan Assay Method
The OncoScan® FFPE Assay Kit (Affymetrix; Santa Clara, CA) was applied to isolated DNA. The technicalities of the molecular inversion probe (MIP) assay have been previous described. 11 Briefly, a MIP targeting a unique SNP or base pair of interest anneals to isolated DNA and circularizes with its complementary nucleotide. Single stranded material is destroyed, and the circular probe is then released, cleaved, becomes inverted, and is amplified using universal primers. The biotinylated oligo is hybridized overnight to a microarray. Two microarray chips are used per sample and the entire process takes two-and-a-half days to complete. The genome-wide functional resolution of this array is approximately 500 kilobases for non-mosaic deletions and non-mosaic duplications. However, functional resolution of this array varies significantly dependent upon size of the abnormality, probe density in region, percentage of abnormal cells, and quality of the DNA obtained. Mosaic clonal abnormalities, especially those that are represented in a minor fraction of the sample, may not be detected. Deletions larger than 1 megabase, duplications larger than 2 megabases, and copy neutral loss of heterozygosity (cnLOH) larger than 10 megabases are generally reported. However, complex genomic alterations may be reported in aggregate, and well documented pathogenic constitutional and/or acquired abnormalities of any size may also be reported. All data were analyzed and reported using the February 2009 NCBI human genome build 37.1 (hg19). The genome coordinates described are best estimates and may not represent precise breakpoints, especially for abnormalities detected in a low percentage of cells.
Results
Myxofibrosarcoma
Overall, 22 resection specimens of MFS were evaluated and the clinicopathologic features of these tumors are summarized in Table 1. All tumors showed classic morphology of MFS including an infiltrative and multinodular growth pattern within subcutaneous fat, composed of variably atypical spindle cells admixed with curvilinear blood vessels (Figures 1 to 3). At least 1 low power field containing myxoid stroma was appreciated in each tumor. The patients’ age range was 44 to 85 years with a median of 70.5 years. The tumors occurred almost equally in men (n = 12) and women (n = 10). Tumor size ranged from 1.1 to 13.8 cm (median of 3.8 cm). Thirteen MFS occurred in the lower extremity (59%), 7 occurred in the upper extremity (32%), and 2 were located in the trunk (9%). Seventeen of 22 tumors were primary and 5 represented a local recurrence. The mitotic rate (per 10 high power fields) ranged between 0 and 73 (median of 12). The percentage of tumor necrosis per tumor was as follows: 0%, n = 11; 1% to 50%, n = 9; >50%, n = 2. Seven of 22 tumors were FNCLCC grade 1, 4 were FNCLCC grade 2, and 11 were FNCLCC grade 3. Of 17 patients with available follow-up information (1-96 months; median 13 months), 11 were alive with no evidence of disease and 6 patients experienced at least 1 recurrence. One patient developed distant pulmonary metastases. Three patients were deceased at the end of follow up, including the patient with distant metastases, who died of disease. FISH studies for MDM2 showed amplification in 3 of 22 tumors (MFS10, MFS18 and MFS 22 in Table 1; Figures 1 to 4). In MFS10, the MDM2/CEP 12 ratio was 3.19 (average number of MDM2 signals 17.5), in MFS18

Images from a classic myxofibrosarcoma (MFS10) located in subcutaneous soft tissue of the right forearm (A) which showed MDM2 amplification by FISH and OncoScan. The tumor showed a multinodular growth pattern with infiltrative tumor tentacles (B), curvilinear blood vessels (C), and atypical spindle cells with admixed pseudolipoblasts (D).
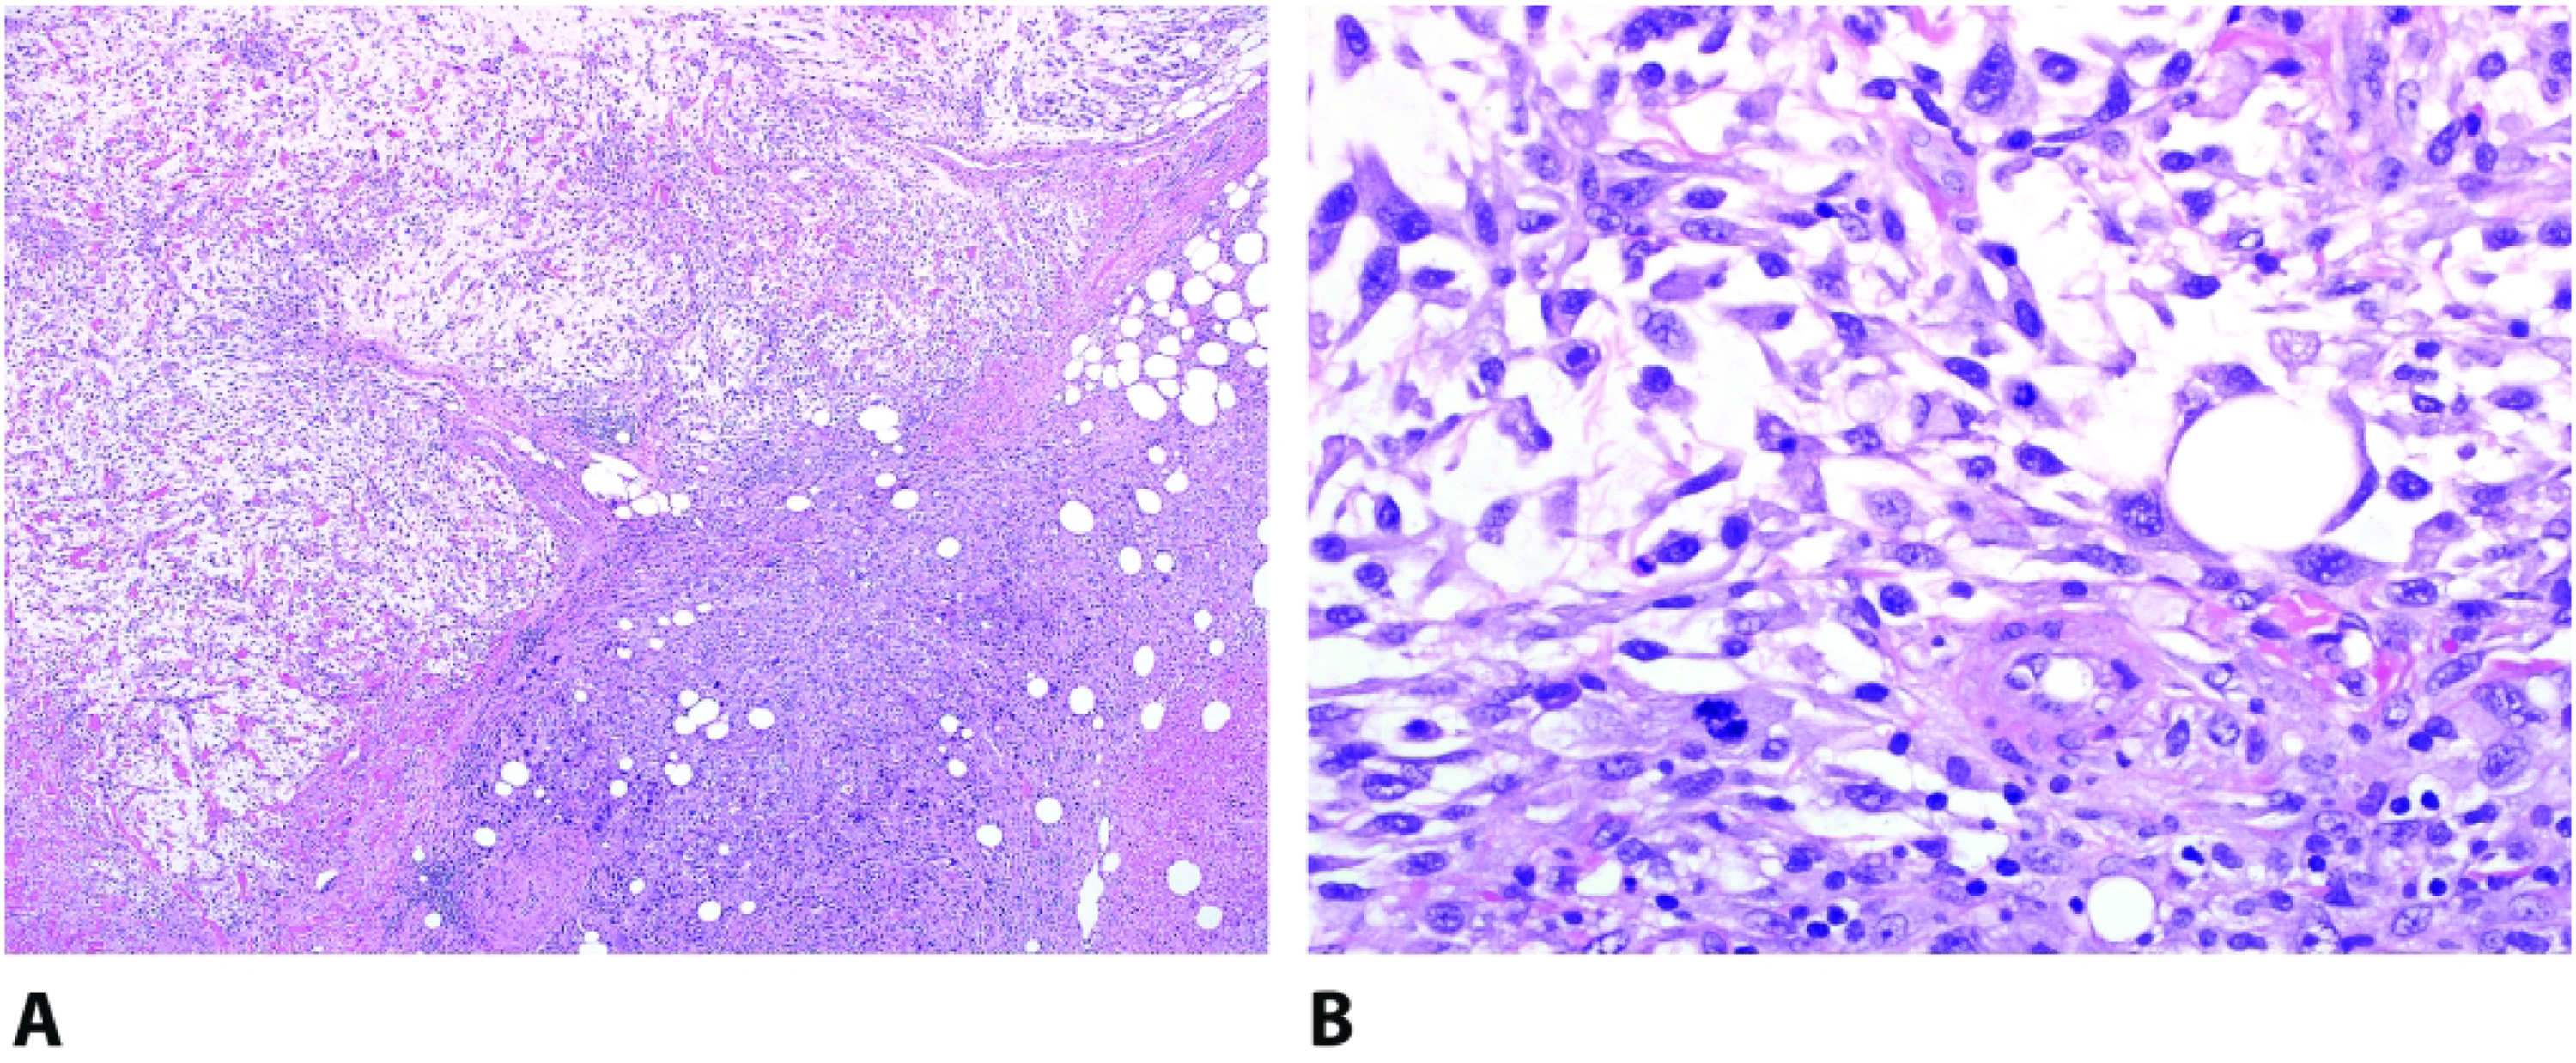
Histologic sections from a lower back myxofibrosarcoma (MFS18) showed a multinodular growth pattern with alternating hyper and hypocellular areas (A). Higher magnification illustrates hyperchromatic spindled cells with marked atypia (B). This tumor showed MDM2 amplification by FISH but not by OncoScan.

MFS22, which showed MDM2 amplification by FISH and OncoScan, arose in the superficial thigh and showed a necrotic high grade malignancy with surface ulceration (A). Medium power images demonstrate admixed myxoid and solid components (B). Closer inspection demonstrates plump malignant cells with occasional prominent nucleoli (C).
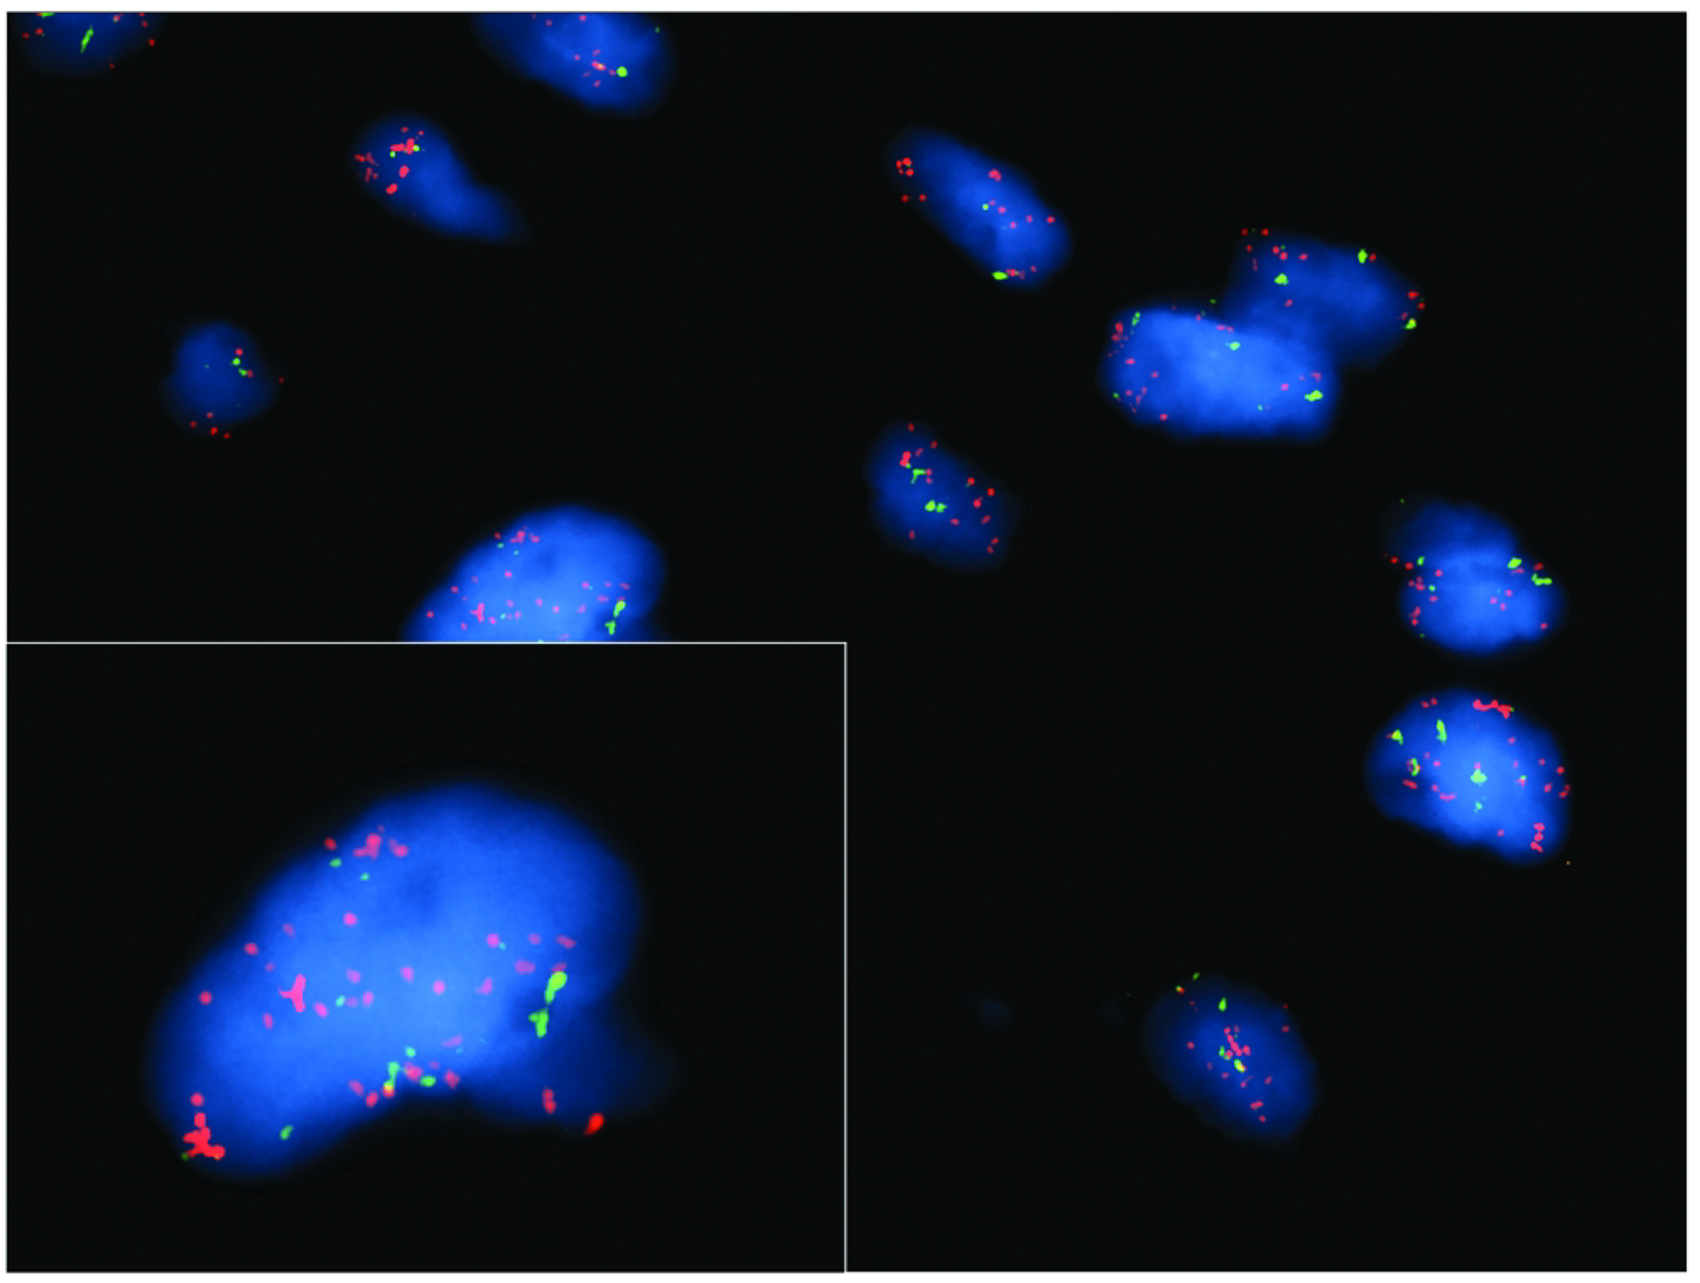
FISH (CEN 12(green)/MDM2(orange)[12q15]) from a myxofibrosarcoma with MDM2 amplification (MFS 10). Image indicates nuclei with 10–21 + orange and 2–8 green signal. Inset provides a closer look at signal amplification.
Myxofibrosarcoma Tumors, Clinicopathological Features: MFS 10, 18 and 22 Showed MDM2 Gene Amplification by FISH. MSF18 Did Not Show MDM2 Amplification by OncoScan Assay.
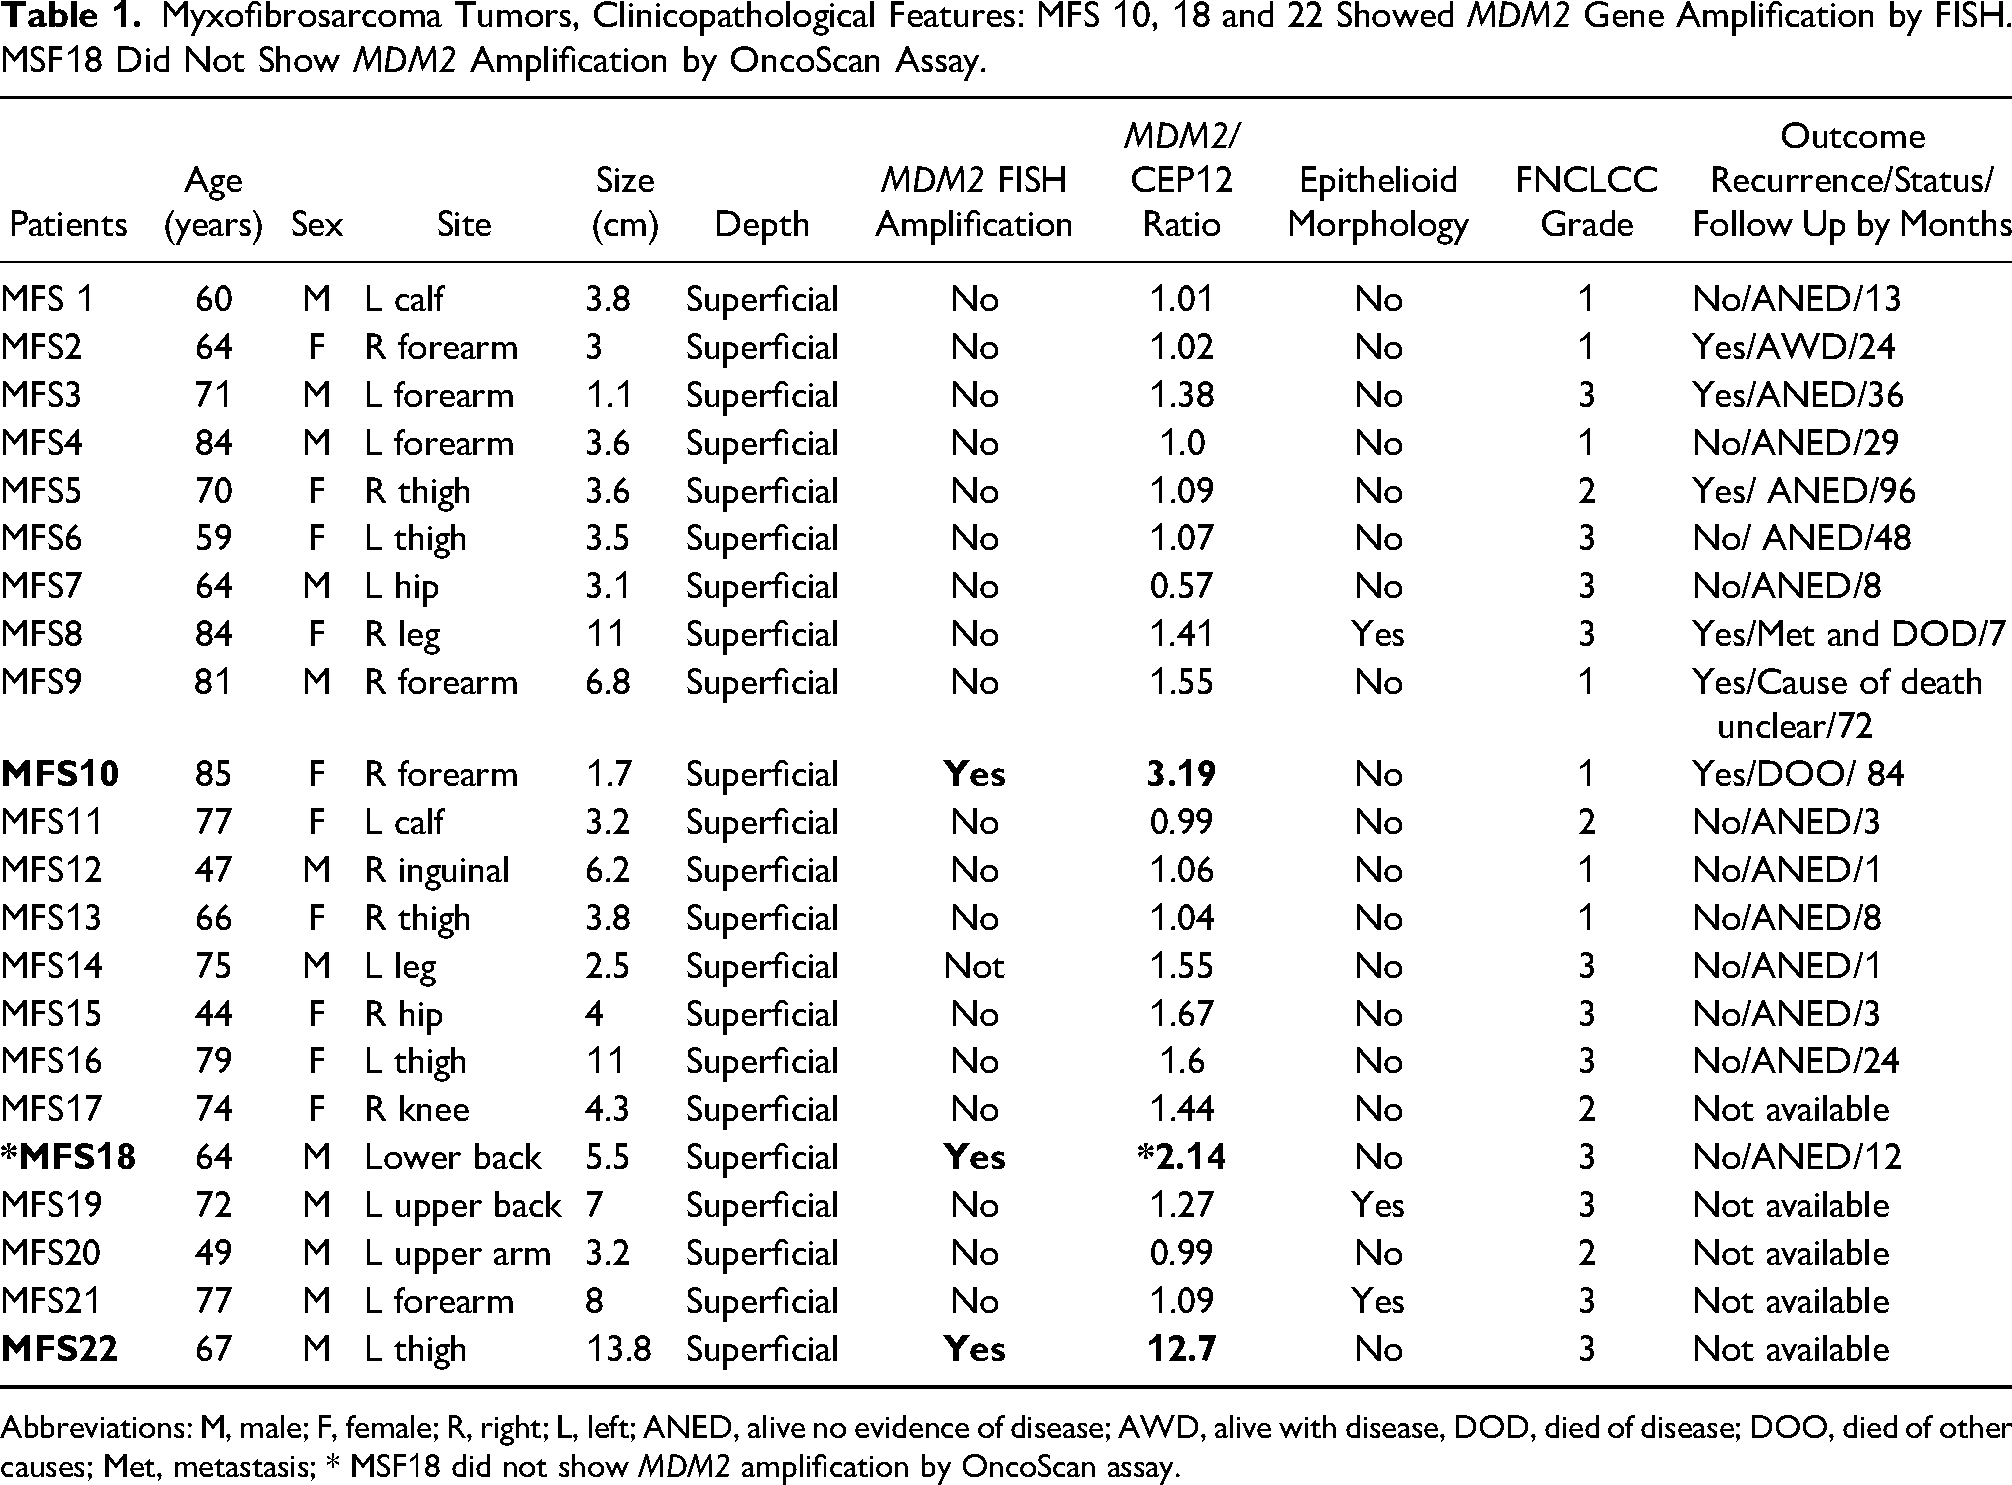
Abbreviations: M, male; F, female; R, right; L, left; ANED, alive no evidence of disease; AWD, alive with disease, DOD, died of disease; DOO, died of other causes; Met, metastasis; * MSF18 did not show MDM2 amplification by OncoScan assay.
OncoScan assay confirmed MDM2 amplification in MFS10 and MFS22, while MFS18 was negative for MDM2 amplification. Interestingly careful re-review of FISH images for MSF18 showed increased CEP12 signal as well, potentially indicating gains of chromosome 12 or co-amplification of the centromere probe in contrast to pure MDM2 amplification. Since OncoScan assay in MFS18 did not detect MDM2 amplification or 15 or greater copies of chromosome 12, the discordant results are best explained by heterogeneity in tumor nuclei scored by FISH and/or a low level subclone not detectable by chromosomal microarray. All 3 tumors additionally showed complex molecular karyotypes with subclonal gains and losses, including loss of RB1 (3/3) and CDKN2A and CDKN2B (2/3).
Dedifferentiated Liposarcoma
Eleven dedifferentiated liposarcoma with myxoid features (7 males, 4 females; age range: 36-85 years, median 71 years) were identified and investigated for comparison. The tumors were located in the retroperitoneum (n = 6), abdominal cavity (n = 4), and intramuscularly in the extremity (n = 1). Histologic review revealed biphasic tumors showing areas of well-differentiated liposarcoma juxtaposed to non-lipogenic foci composed of malignant spindle cells in a myxoid background (Figure 5). MDM2 amplification was identified by FISH in all specimens (11/11). In differentiated liposarcoma tumors with myxoid features (entire cohort, n = 11), the MDM2/CEP 12 ratio was between 5.7 and 12.9, while average number of MDM2 signals per cell ranged from 13 to 21.
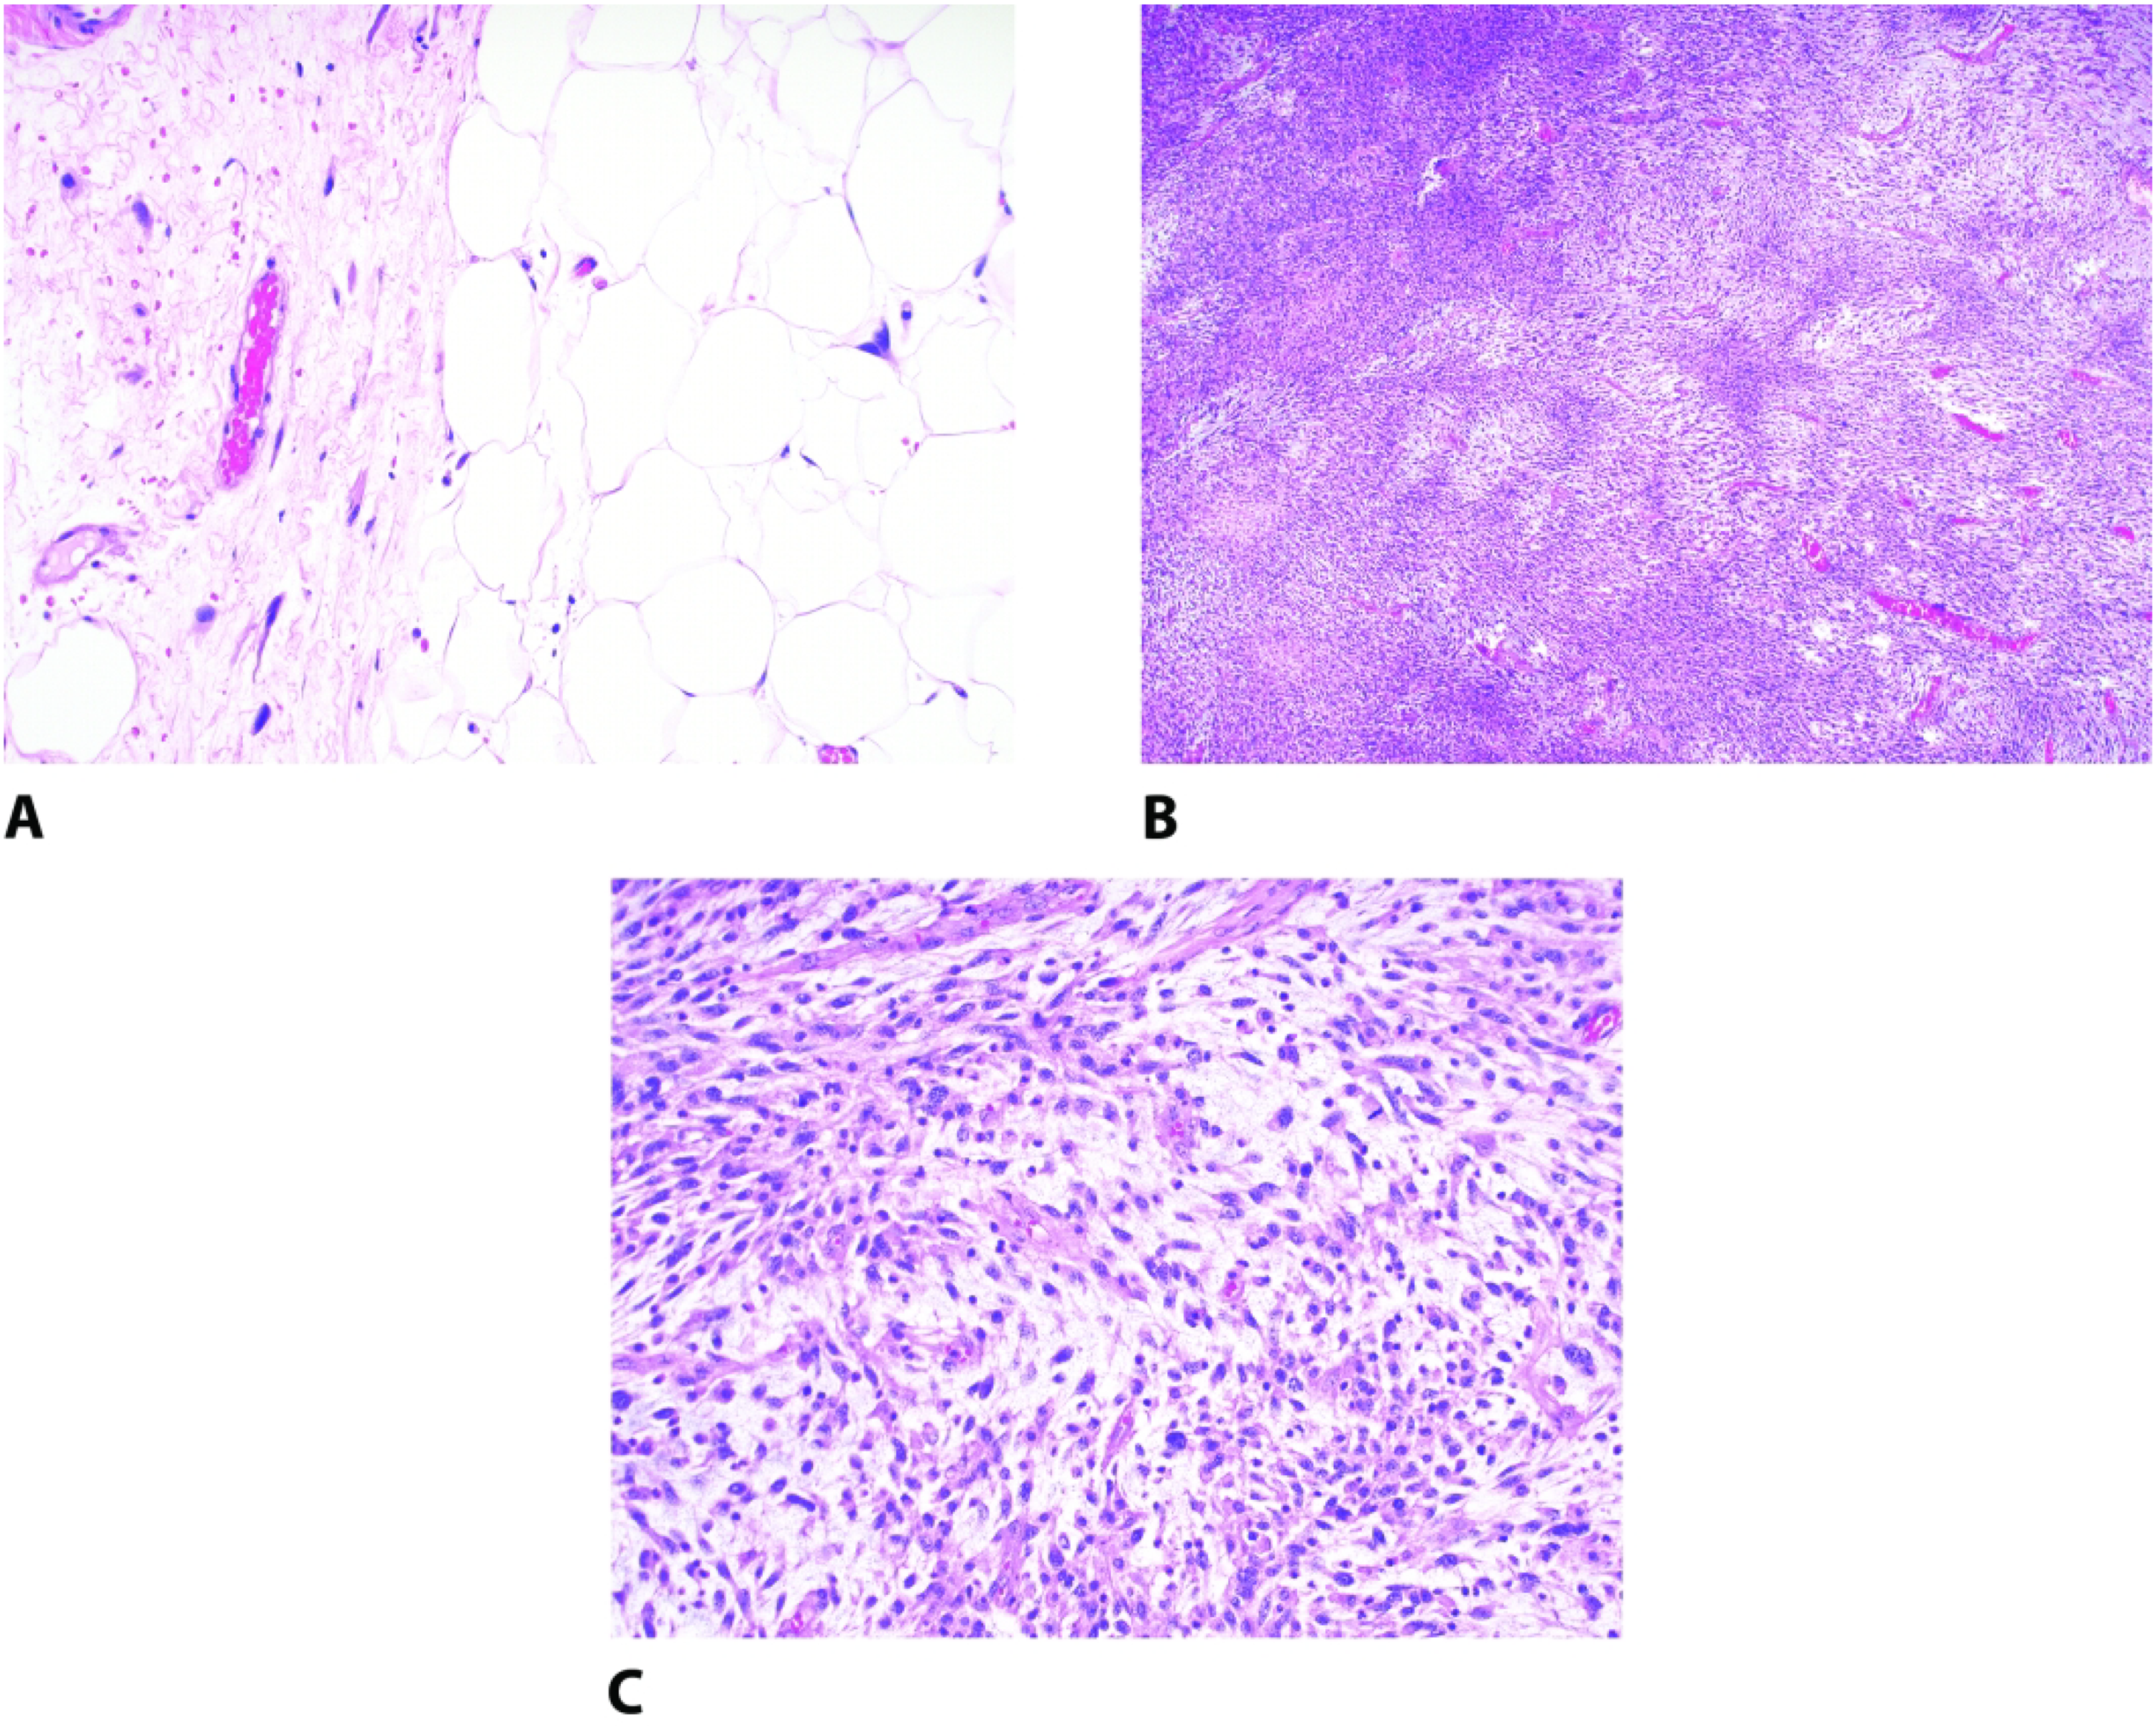
Example of a myxoid dedifferentiated liposarcoma which shows a biphasic appearance composed of mature adipose tissue with atypical hyperchromatic stromal cells (A) admixed with a high grade myxoid sarcoma (B). High power examination shows areas indistinguishable from myxofibrosarcoma with atypical hyperchromatic spindle cells in a myxomatous background with a prominent curvilinear vasculature (C).
Discussion
Pleomorphic sarcomas, including MFS, generally show complex molecular signatures.12–14 Alterations in genes in the p53 signaling, cell cycle regulators, and RTK-PI3K pathway appear to be shared among these sarcomas. By integrated genetic and epigenetic analysis, MFS show frequent alterations in p53 signaling and cell cycle check points including RB1 and CDKN2A/B.15–17 Dedifferentiated liposarcomas, on the other hand, consistently show MDM2 amplification.6,7,18,19 This finding is not entirely specific, though, and has also been described in other sarcomas including malignant peripheral nerve sheath tumor, 20 leiomyosarcoma, 21 intimal sarcoma,22,23 low grade central osteosarcoma,24,25 parosteal osteosarcoma 26 and endometrial stromal sarcoma.27,28 A handful of studies in the literature have shown that a small subset of MFS has MDM2 amplification, including, a comprehensive genetic report by Ogura et al which found 7 of 116 MFS to have this feature. 15 However, detail as to the degree of histologic sampling and/or depth of the lesions is lacking, leaving open the possibility that MDM2-amplified cases may actually represent the myxoid variant of dedifferentiated liposarcoma.8–10,15,29 In fact, in the study by Song et al, 1 MDM2-amplified retroperitoneal sarcoma initially classified as MFS was reclassified as dedifferentiated liposarcoma. 10 We aimed to further clarify the rate of MDM2 amplification in a series of well-characterized superficial MFS. To this end, we confirm that a minority of MFS do in fact show MDM2 amplification.
While numerous myxoid sarcomas have a distinct immunoprofile or characteristic genetic findings, MFS is still a diagnosis based on histologic examination. One of its closest morphologic mimics is myxoid dedifferentiated liposarcoma. Dedifferentiated liposarcoma rarely occurs above the fascia, and MFS is virtually nonexistent in deep central sites, so differentiating these entities becomes most critical at intramuscular sites in the extremities. We show that the presence of MDM2 amplification favors myxoid dedifferentiated liposarcoma over MFS; however, diligent sampling and careful search for a well-differentiated liposarcoma is also suggested as this feature is the only definitive way to differentiate these two entities. Additionally, on biopsy material, correlation with imaging regarding the presence of a lipomatous component may be helpful. If such clinical data is not available, one should be cautious about rendering a diagnosis of dedifferentiated liposarcoma, especially in a superficial location, based on the presence of MDM2 amplification. On the other hand, in deep-seated central sites (eg, retroperitoneum) where dedifferentiated liposarcomas far outnumber other sarcomas, MDM2 data is much more informative.
MDM2-amplified MFS in our cohort failed to show any clinical differences from their non-amplified counterparts. They occurred over a broad age range and arose in both the trunk and extremities. Furthermore, the behavior of this subset was variable. One patient experienced recurrence while another remained free of disease at 12 months; the third patient lacked follow-up.
In our study, we used OncoScan data to confirm the presence of MDM2 amplification. Interestingly, 2 of the 3 tumors showed concordant results, while MDM2 amplification was absent in the third one (MSF18). Re-review of FISH images for the discordant tumor showed additional MDM2 signal (>20) in the context of additional copy gain of centromere 12 (15-20). This finding indicated likely co-amplification of MDM2/CEP 12 with a ratio less than 2 (cut off >2.0), however; OncoScan assay did not detect MDM2 amplification or 15 or greater copies of chromosome 12 in the discordant tumor (MSF18). Signal heterogeneity with a subpopulation of tumor cells showing increased MDM2 signal on FISH may lead to false positive results. The subsequent increase in MDM2 signal and borderline MDM2/CEP 12 ratio should be interpreted with caution, triggering a confirmatory method such as OncoScan.
Genomic alterations including MDM2 amplification introduce new targets for potential treatment options.30,31 MDM2/CDK4 inhibitors such as nutlin, 32 siremadlin, 33 and ribociclib 34 offer therapeutic efficacy for well-differentiated and dedifferentiated liposarcomas. Given the similar underlying genetic alteration in MFS with MDM2 amplifications, such novel agents may potentially be beneficial for these patients as well.
Conclusion
We sought to evaluate the rate of MDM2 amplification in a group of well-characterized myxofibrosarcomas. While the rate of MDM2 amplification in our cohort was low, these tumors may rarely show this genetic alteration. Additional studies are necessary to determine if the presence of MDM2 amplification in myxofibrosarcoma has prognostic value.
Footnotes
Acknowledgment
The Authors are grateful to Mayo Cytogenetics Core Laboratory.
Author's Note
Nooshin K. Dashti is currently affiliated to the Department of Pathology and Laboratory Medicine, Dartmouth-Hitchcock Medical Center, Lebanon, NH and Geisel School of Medicine at Dartmouth College, Hanover, NH, USA.
Declaration of Conflicting Interests
The author(s) declared no potential conflicts of interest with respect to the research, authorship, and/or publication of this article.
Ethical Approval
This study was performed in accordance with current ethical guidelines of the Declaration of Helsinki and the requirements of the Institutional Review Board of Mayo Clinic, Rochester, MD, USA (Approval number IRB18-006968).
Funding
The author(s) received no financial support for the research, authorship, and/or publication of this article.