
Abstract
Aim. Although it is now accepted in the literature that tumour budding (TB) is a useful survival indicator in colon cancer (CC), there are still uncertainties about daily use. Here we methodologically examined the role of TB on survival in CC. Methods. In our study, we examined colon cancer patients who had surgery up to 15 years before presentation. TB was calculated separately using different comprehensive methodological methods. Results. We first investigated an optimal evaluation method. Relationship with prognostic factors was better (Venous invasion [p = .001], advanced pT [p = .003], perineural invasion [p = .040], MSS [p = .016], advanced size [p = .001], tumour obstruction [p = .005], margin involvement [p = .043], and nodal involvement [p = .028]) in Method-1. Similarly, with the same method, the success of the cut-off value, the correlation of TB data (r = .724), and the repeatability of the method (Κappa = .53–.75) were quite good (ROC = .816 [.707–.925]). Then, survival analysis was performed using the best three methods, including this method. In univariate analysis using Method-1, survival analyses were worse in high TB patients (RFS: 81%, p < .001; OS: 84%, p < .001). Multivariate analyses using the same method confirmed that high TB for RFS and OS was an independent poor prognostic parameter for survival (p = .002, Hazard ratio [HR]: 1.42 [1.13–1.80]) and OS (p = .014, HR: 1.38 [1.07–1.79]). Conclusions. With our study, we showed that tumour budding calculated by the standard method is a very valuable prognostic parameter in stage II CC and can contribute to the detection of patients with poor prognosis in stage II CC.
Introduction
Colon cancer (CC) is a very common tumour both in the Western world and throughout the world, with approximately one-third of patients presenting as an early-stage disease at the time of diagnosis. 1 Today, prognosis prediction in CC is determined by the TNM staging protocol based on clinicopathological data.1,2 This TNM staging protocol, which is easy to apply in daily practice and groups patients according to different risk factors, is the product of decades of experience.2,3 Unfortunately, it is very difficult to predict individual clinical courses even with this system. This feature is quite evident for patients with stage-II CC, whose 5-year prognosis is 70–80% but is prognostically non-homogeneous. 4 Today, there are many questions about which patients in this group will receive adjuvant chemotherapy. 5 To discern which patients may benefit from chemotherapy post-resection, additional prognostic features must be considered. One such factor is tumour budding. 5
Tumour budding (TB) is, by definition, the presence of small tumour cell foci or individual tumour cells at the margin where the tumour invades the surrounding tissue.6,7 Since TB is the first step in invading surrounding structures and forming metastatic accumulations in lymph nodes, it is thought to have an important role in the epithelial-mesenchymal transition in the invasive area.6,7 Numerous recent studies have shown that in many tumours, particularly in colon cancer, an increase in the number of tumour buds is associated with an increased risk of recurrence and metastasis (8–14). On the other hand, international consensus groups think that tumour budding should be among the high-risk factors in the staging of colon cancer. 8 Standardization in studies of tumour budding in the literature is quite low, and few studies have examined only stage-II colon cancer.9,10 Additionally, despite better interobserver reproducibility, studies investigating tumour budding in pan-keratin sections are sparse. 11
There are three main steps in pathological evaluation: block, area, and focus. The first step is to choose the appropriate block. There is some information about this stage in the literature. For example, Mesker et al recommended using the histological section at the highest pT stage, as they documented that it best represents the tumour. 9 The second step is to determine which areas need to be evaluated. Hynes et al evaluated tumours using ‘global’ and ‘focal’ methods. 12 The third step is which focus should be evaluated. There is very little information about this choice in the literature. For example, Galon et al made this selection as tumour center and invasive border. 8 As a result, standardization is a very important issue in microscopic examination.
In this study, we investigated the effect of tumour budding in identifying high-risk patients with stage II colon cancer with a comprehensive methodology. A different feature of this study is that it tries to standardize evaluation methods by using many different methods.
Materials and Methods
REMARK 13 was used in carrying out this research and is briefly summarized in Figure 1.
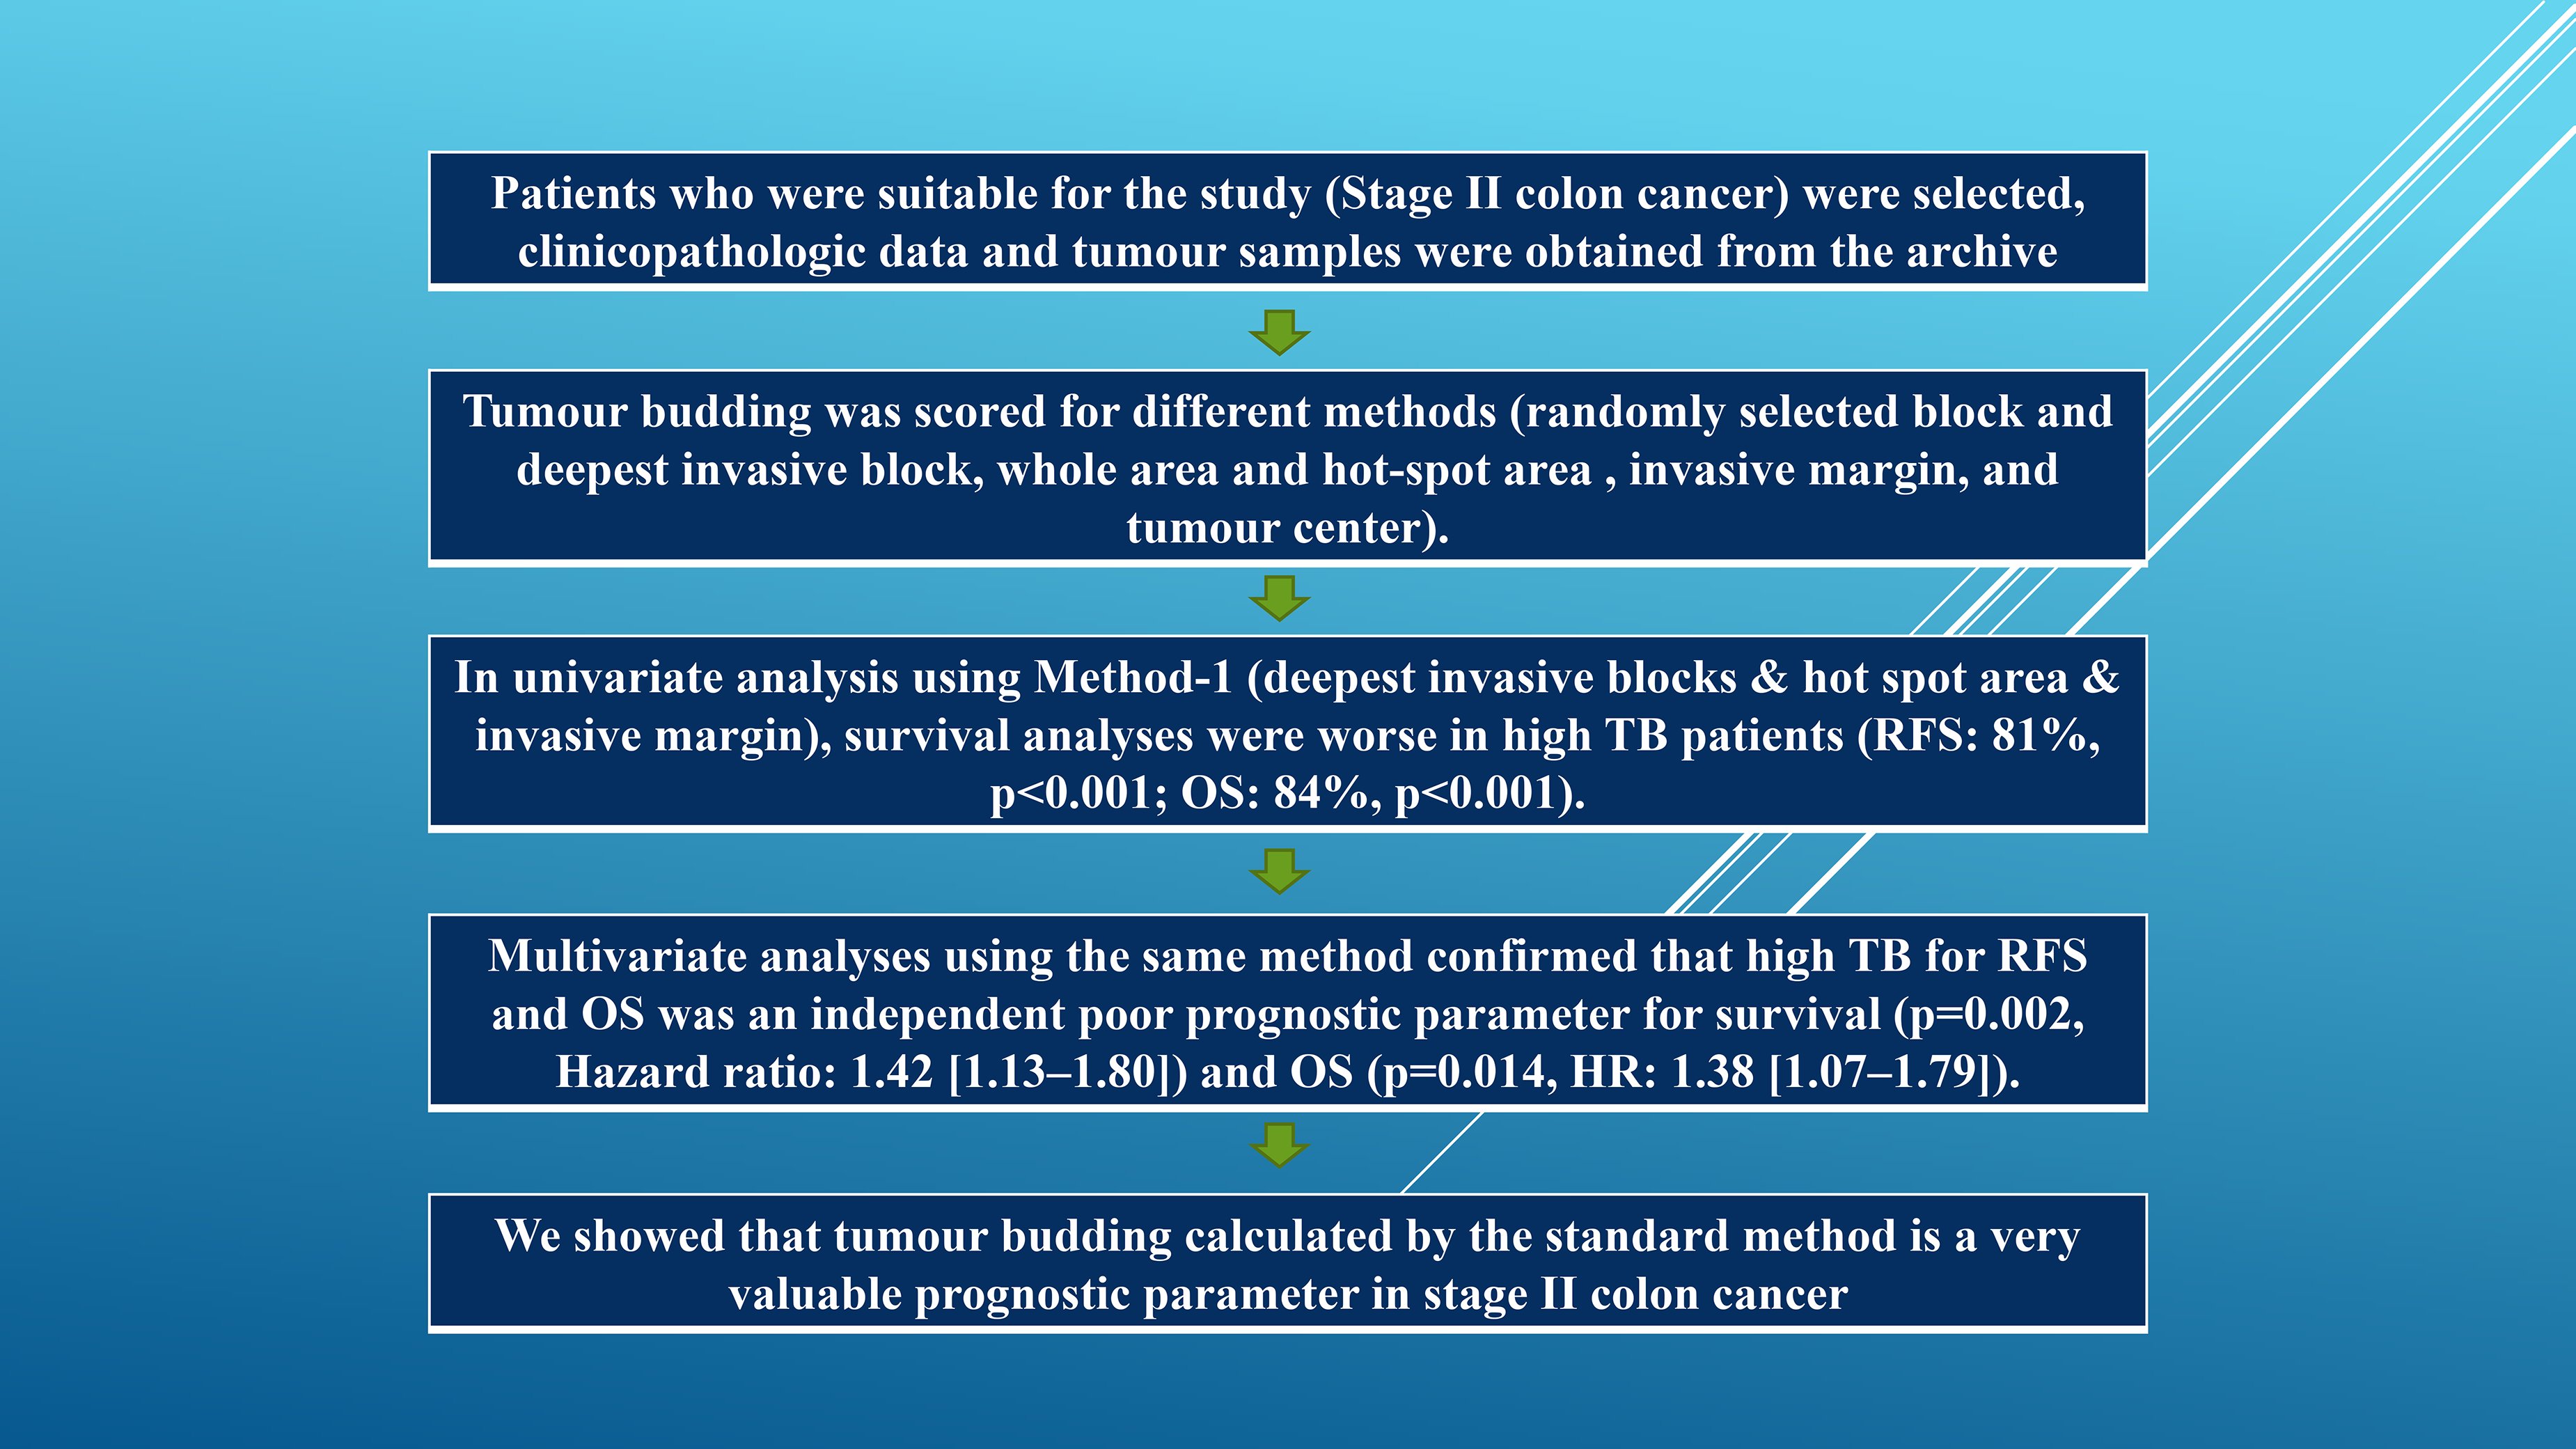
Flowchart of the research. Abbreviations: H&E, Hematoxylin and eosin; CC, colon cancer; HR, Hazard ratio; RFS, Relapse-free survival; OS, Overall survival; IHC, Immunohistochemistry.
Ethical Standards
Approval for our study was received from the National Health Research Ethics Committee. Informed consent was obtained from all individual participants included in the study. Additionally, all procedures were carried out in accordance with the Helsinki Protocol and national ethical standards.
Research Design
Our study was carried out in the Department of Pathology at a national independent medical school. One hundred forty-five patients who underwent surgery for colon cancer were included in our study.
Patients
Patients with distant metastases were excluded from this study (n = 4). Additionally, patients with different malignancies at the same time and patients who died/relapsed within the first month were excluded from the analysis (n = 5). Other exclusion criteria were: those without tumour blocks in the archives (n = 8), those diagnosed with other cancers before primary colon cancer (n = 2), those with insufficient tissue for examination (n = 2), those without Stage-II (n = 48), and those receiving adjuvant chemotherapy/radiotherapy (n = 9). After these patients were excluded, our population consisted of seventy-two patients.
Tissue
Tumour samples in the archives of the Department of Pathology were scanned. Two tumour blocks were used for each patient, one representing the most deeply invasive area and the other randomly selected. Tumour blocks containing normal colon tissue along with tumour tissue were selected for immunohistochemical (IHC) study. Two 4-micron thick sections were taken from each block. One of these sections was stained with pan-keratin (KRT) and the other with hematoxylin and eosin (H&E). All pathological evaluations were performed considering the AJCC, eighth edition. 14 All sections were evaluated by two independent pathologists, and the average of these observers determined the final TB.
Analysis for TB
When we examine the literature, it is seen that many different techniques were used in the evaluation of TB.6,7,9,11,15 Tumour budding was evaluated separately in two different blocks (randomly selected block [-r] and deepest invasive block [-d]), in two different areas (whole area [-w] and hot-spot area [-h]), and in two different focuses (invasive margin [-i] and tumour center [-c]). The bud has defined the bud as follows a single isolated adenocarcinoma cell or a small carcinoma cluster consisting of up to four tumour cells.16,17 A conventional light microscope, H&E, and IHC stained slides were used while noting the number of tumour buds. The evaluation was conducted semi-quantitatively.
Initially, all available slides were examined with the help of an ×10 lens to detect the TB density in the slides. An area containing the tumour budding was then selected across the entire field of view using an ×20 lens. Care was taken to ensure that TB was present on many edges of this selected image area. Finally, tumour budding was counted individually in different blocks, in different sections, and at different focuses using an ×20 lens (Nikon Eclipse E600; .40 mm field; 1.256 mm², Nikon AG Instruments, Switzerland), as mentioned above (Figure 2). Stainings without clearly defined hematoxylin-stained nuclei (eg, brown cytoplasmic fragments and artifacts) were excluded from adenocarcinoma cell counting. If the tumour area in the sections was small (less than 10 HPF), the buds in the entire available area were counted and the average number of buds was calculated based on these areas.

Examples of how to count Tumour budding (TB). We first scanned the sections at low magnification to determine the TB distribution. The image area containing TB on all edges was selected using an ×20 objective. Finally, it was counted on an ×20 objective.
Evaluation Method
Deciding on the appropriate method for the study is the first step in achieving successful results. An attempt was made to overcome this difficulty by determining the relationship of TB with prognostic factors, determining different TB estimates, and determining the optimal cut-off value. Survival analyses were then evaluated using the three methods with which we obtained the best results. The best cut-off value (the value with the highest true positive rate and lowest false positive rate) was determined by the ROC test. According to this value (10 buds), all patients were divided into two groups: low-intensity and high-intensity. Our test was also evaluated for usefulness by calculating the area under the ROC (AUC) curve (a larger area indicates a more useful test). 18
Reproducibility
In our study, the following two parameters were taken into consideration to evaluate reproducibility; tumour heterogeneity and interobserver agreement. Tumoural heterogeneity was analyzed by the Intra-Class Correlation (ICC) test. 19 The ratio of total variance between investigated tumours was considered ICC. Accordingly, if the difference is due to intra-tumoural variation (heterogeneity), the ICC will be close to zero; if it is due to inter-tumour variation (biological diversity), the ICC will be close to one. Interobserver agreement was investigated with the kappa value (K), which is a variance ratio. The K value was defined as excellent, moderate, and significant for values of .81–1, .61–.80, .41–.60, and, respectively, according to Landis et al. 20
Follow-up
In terms of outcome, survival and recurrence rates were analyzed in the study. The day of primary surgery was used as the event starting point. The follow-up period in all patients was determined as a minimum of 60 months (10.3–100.5 months). Relapse-free survival (RFS) was defined as follows; time from the day of primary operation to the day of recurrence. Overall survival (OS) was defined as follows; the period from the day of primary operation to the day of last follow-up or death from any cause. Clinical, pathological, and radiological recurrence of cancer is called disease recurrence. If this condition was limited to the treated area, it was considered local recurrence (LR), and if it appeared in another region, it was considered distant recurrence (DR). All events after the 60th month were evaluated as the 60th month.
Immunohistochemistry
For IHC, a 4 μm section (n = 216) was cut and mounted it on a platinum slide (K8020, Dako, Denmark). The heat-induced retrieval epitope was obtained with targeting solution (Dako), in 20 min at Ph 9 and 97 °C. Endogenous peroxidase activity was blocked with a peroxidase-blocking agent (Dako). Monoclonal AE1/AE3 (1:200, Mouse, clone M3010, Dako) was used as the primary antibody. Monoclonal MLH1 (1 : 100, Mouse, Dako, clone E05), monoclonal MSH2 (1 : 100, Mouse, clone MSVA-902 M, Dako), and monoclonal PMS2 (1 : 400, Mouse, clone A16-4, Dako,) antibodies were used for mismatch repair proteins. These antibodies were incubated at room temperature for 30 min and left at room temperature for 20 min for amplification (Dako). HRP reaction (Dako) was used to detect bound antibodies and DAB reaction was used to visualize it (Dako). Sections were counterstained with hematoxylin (Merck) and finally, slides were covered (Histolab).
Statistical Evaluation
SPSS 24.0 (North Castle, IBM Institute, USA) program was used to conduct the analyses. Frequencies, percentages, mean, ranges, and standard deviation (SD) were used for descriptive variables. The Chi-square test was used for the relationship between TB and clinicopathological features. Spearman correlation analysis was used for correlations between continuous variables and Wilcoxon signed rank test for differences between continuous variables. The Optimal cut-off value of TB was evaluated by ROC analysis. Differences between univariate survival groups were evaluated by the log-rank test. Survival curves were presented using the Kaplan-Meier method. Differences between multivariate survival groups were evaluated by the Cox regression test. The variability of the tumours was examined by the ICC test. The interobserver correlation was evaluated with the K test. P values below .05 were considered significant.
Results
General Features
We found the mean age and size to be 75.74 ± 10.66 (SD) (range: 40–88) and 5.38 ± 1.77 (range: 3–12), respectively. We found that 42 (58.3%) of the patients were men and 30 (41.7%) were women. We noted that 34 (47.2%) of the patients were poorly differentiated and 38 (52.8%) were low/moderately differentiated. We found that 24 (33.4%) of the patients had high pT (pT3/pT4) and 48 (66.6%) had low pT (pT1/pT2).
Analysis for TB
We scored TBs separately on different slides, areas, and foci according to the methodology described above. When the slides were scanned, we found that the distribution of TBs was relatively diverse. We selected two blocks from each specimen to represent TB. We found the median and mean number of TBs to be 7.5 and 7.87 ± 5.23 (range 0–21), respectively. When we analyzed the number of TBs separately, we obtained the following results; 5.8–10.4 for the randomly selected block and deepest invasive block, 5.6–10.3 for the whole area and hot-spot area, and 9.6–5.3 for the invasive margin and tumour center. We show representative images relevant to our analysis in Figure 2.
Evaluation Method
Three models with the best results in the study were; 1: deepest invasive blocks & hot spot area & invasive margin (Method 1), 2: deepest invasive blocks & whole area & tumour center (Method 2), 3: deepest invasive blocks & whole area & invasive margin (Method). 3). We performed survival analyses with these three methods, which yielded the best results. Among these three methods, we found that the relationship between Method 1 and poor prognostic parameters was better (perineural invasion [p = .040], venous invasion [p = .001], obstruction [p = .005], CNS [p = .016], advanced pT [p = .003], margin involvement [=.043], nodal involvement [p = .028], and advanced size [p = .001]) (Table 1). Using the same method, we found that the correlation between BB estimates was better and the difference was lower (p = .687, r = .724) (Table 2). We also obtained the most useful cut-off value with method 1 (ROC: 10.38; AUC = .816 [.707-.925]) (Figure 3). We accepted this value as 10 for ease of application and divided all patients into low and high groups according to this value.
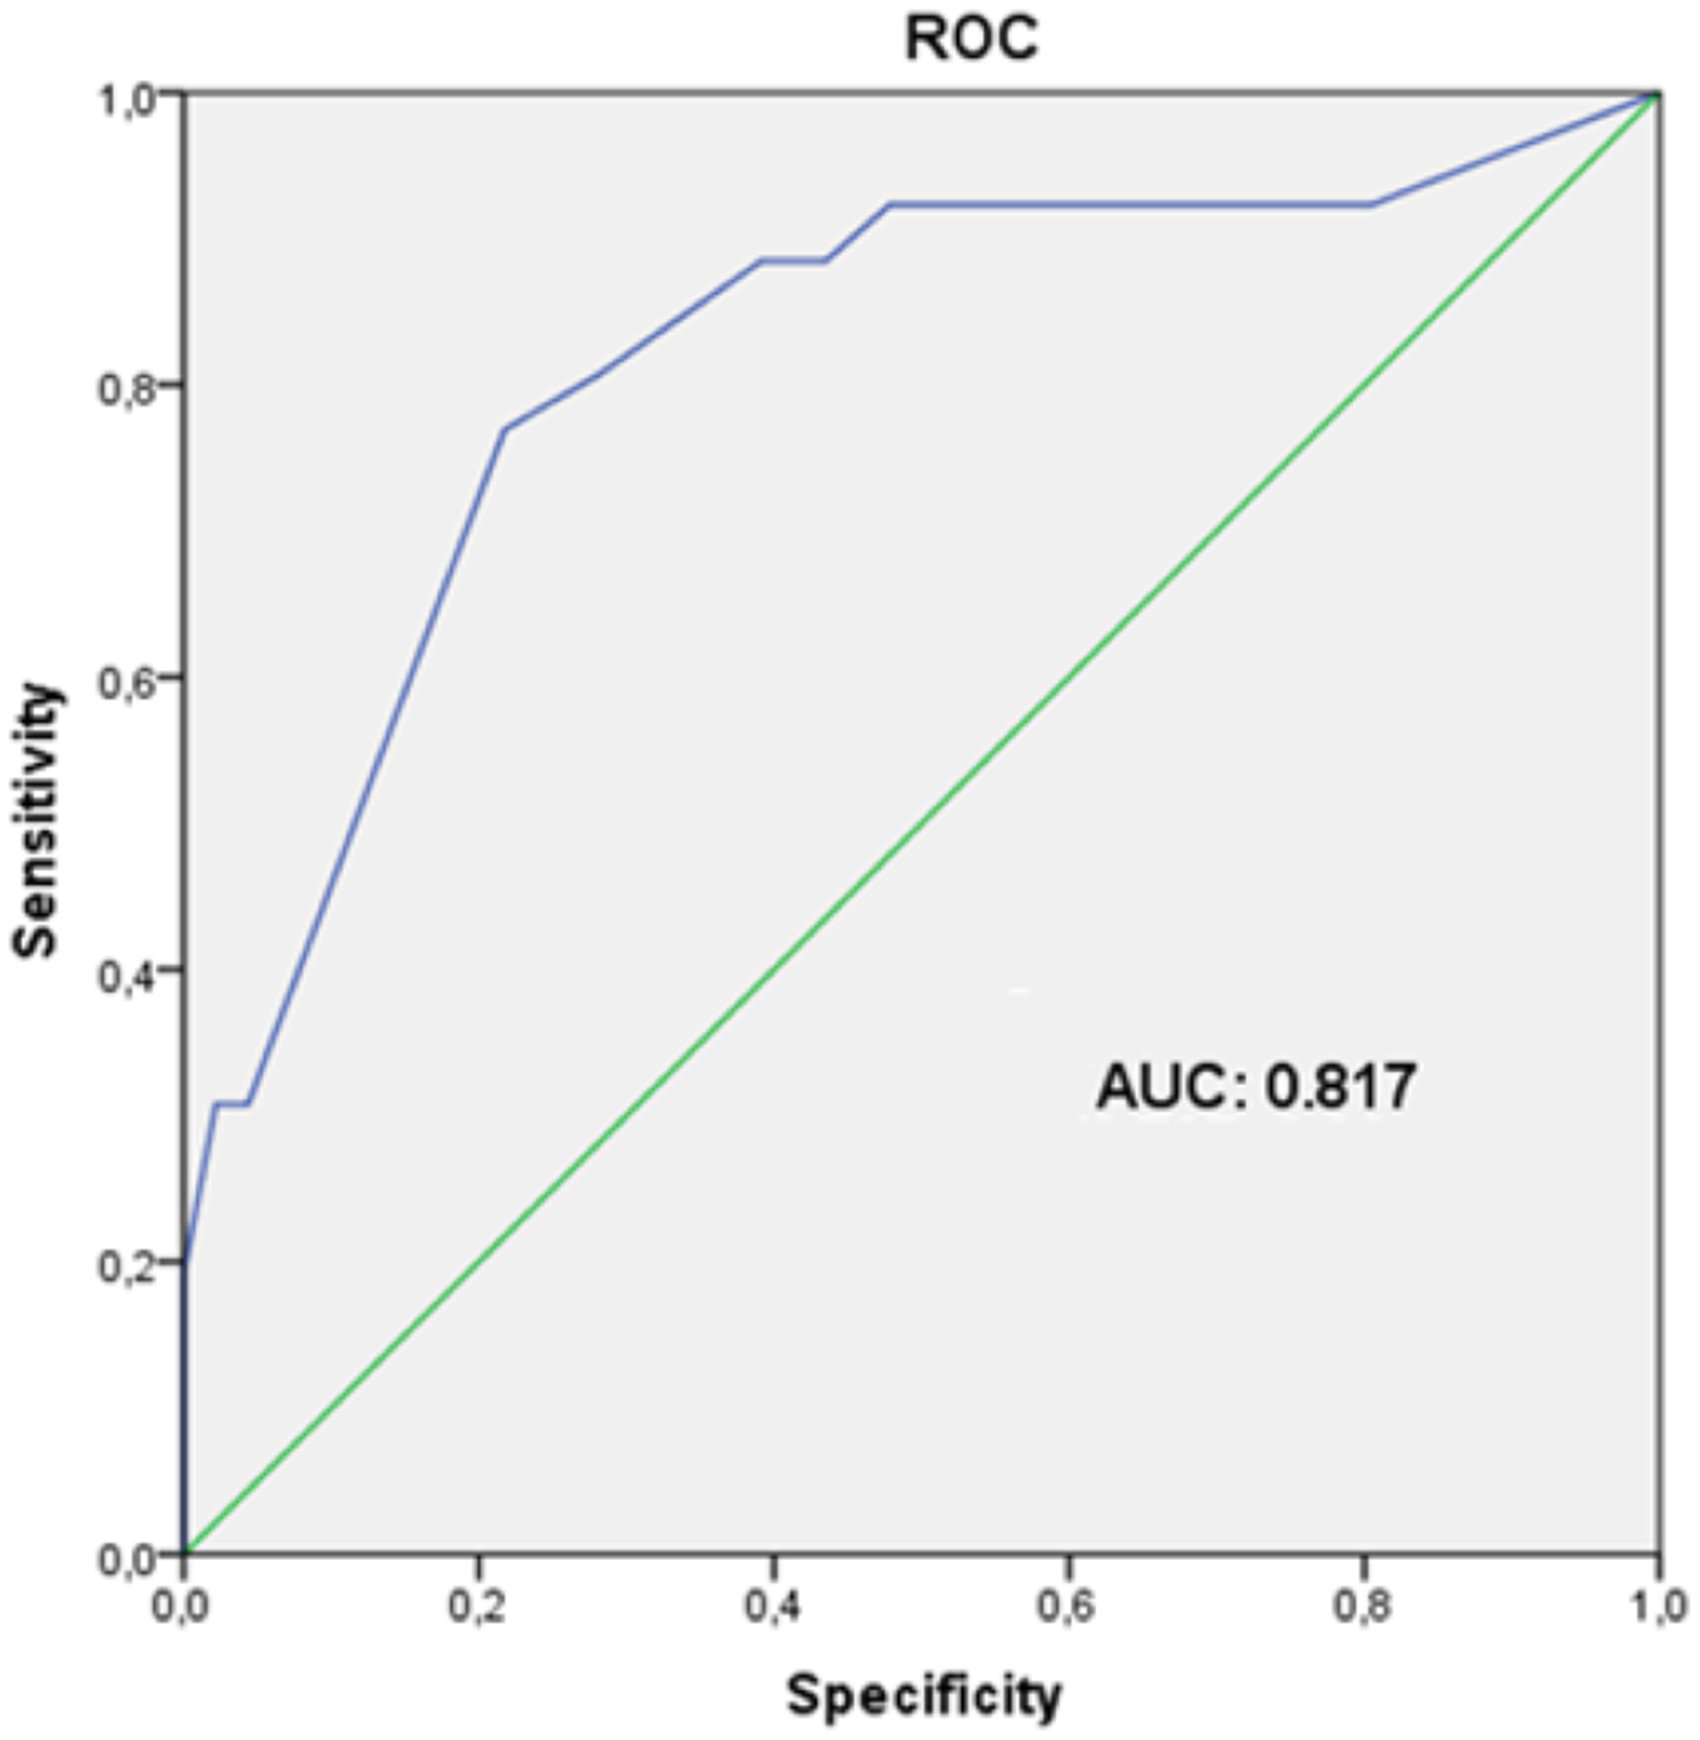
Determination of the cut-off value. ROC test was performed to analyze the optimal cut-off value. Abbreviations: ROC, Receiver Operating Characteristic; TB, Tumour budding; AUC, Areas under the ROC curves.
Association Between Prognostic Factors and TB.
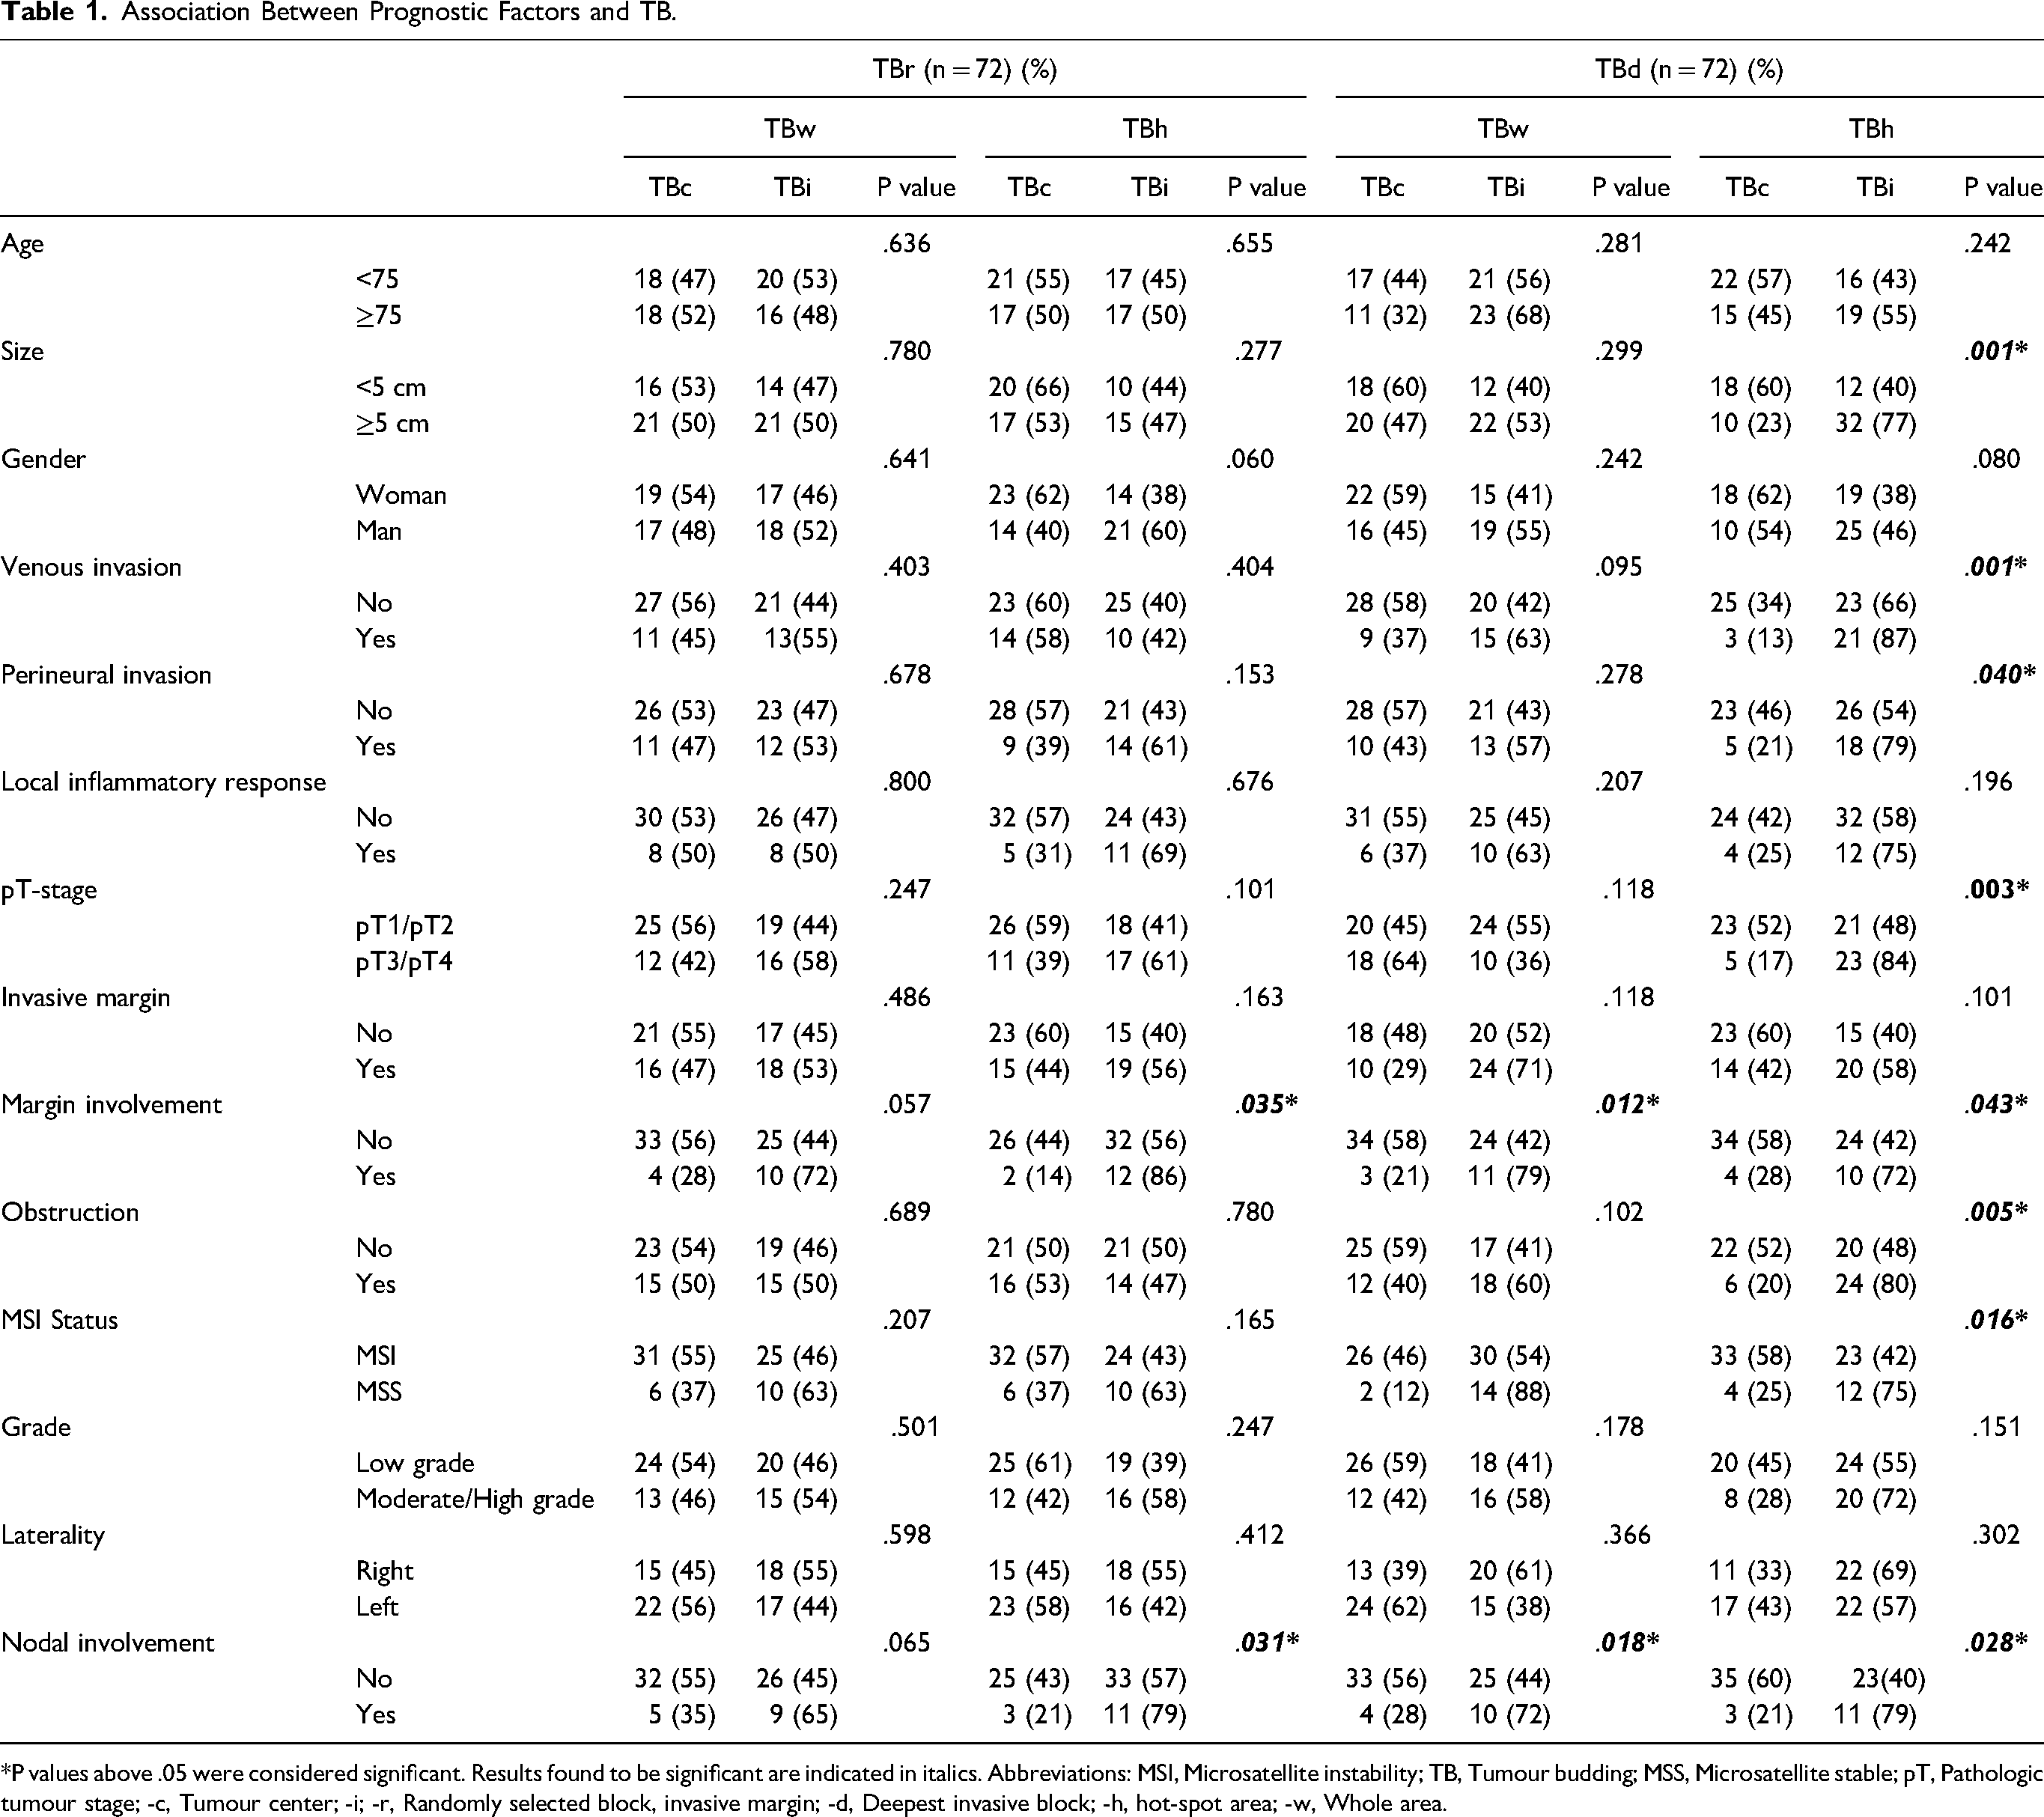
*P values above .05 were considered significant. Results found to be significant are indicated in italics. Abbreviations: MSI, Microsatellite instability; TB, Tumour budding; MSS, Microsatellite stable; pT, Pathologic tumour stage; -c, Tumour center; -i; -r, Randomly selected block, invasive margin; -d, Deepest invasive block; -h, hot-spot area; -w, Whole area.
Correlation of Different Techniques.
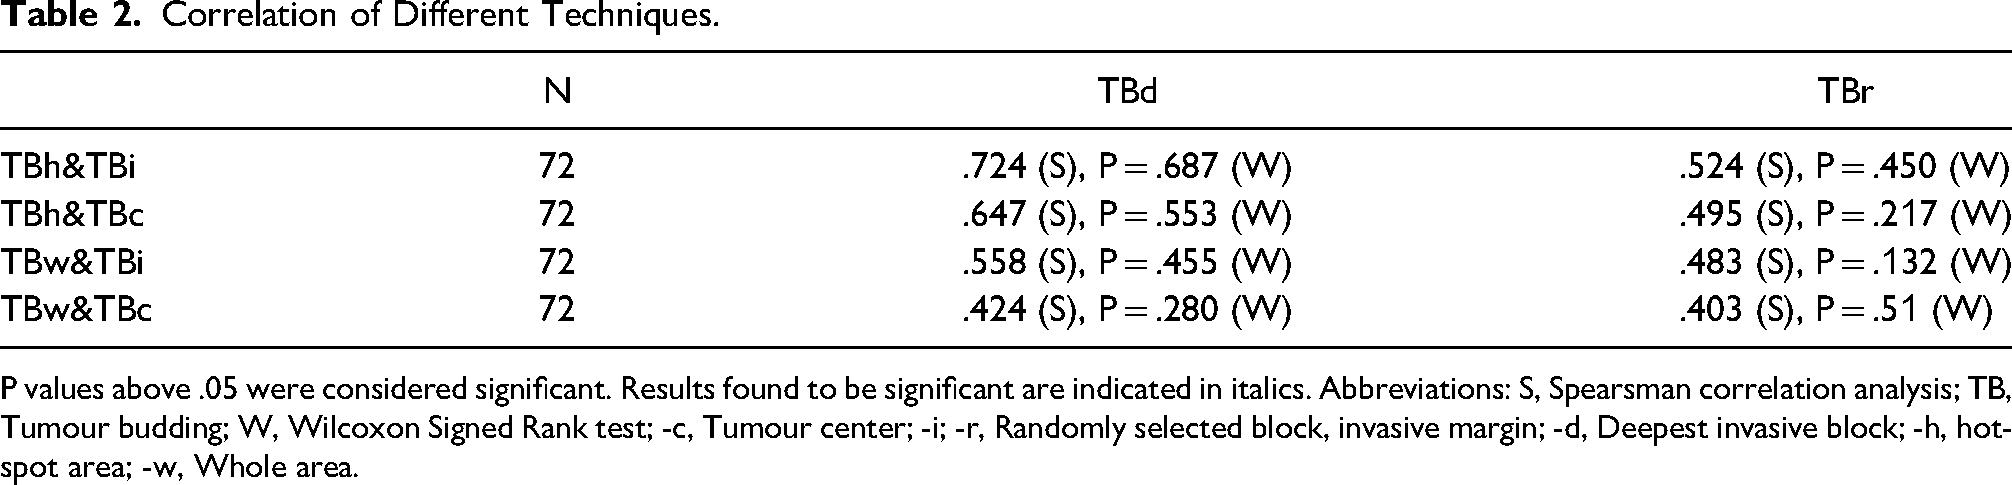
P values above .05 were considered significant. Results found to be significant are indicated in italics. Abbreviations: S, Spearsman correlation analysis; TB, Tumour budding; W, Wilcoxon Signed Rank test; -c, Tumour center; -i; -r, Randomly selected block, invasive margin; -d, Deepest invasive block; -h, hot-spot area; -w, Whole area.
Reproducibility
We analyzed tumour budding separately by the different methods described above. We conducted the analysis for both continuous and categorical variables. Here we have noted only the best results as an example. We found that interobserver agreement was generally within a clinically useful range (Κ = .51–.75). Additionally, we found that K values in TBr (-r: Randomly selected block) were significantly lower than TBd (-d: Deepest invasive block). On the other hand, we saw that K values increased in TBh (-h: hot-spot area) and rose to excellent levels in TBi (-i: invasive margin) (Table 3). When we evaluated the heterogeneity of tumours, we noted that ICC values in TBd were lower than in TBr. This result showed us that the variation was due to biological differences between tumours (the ICC value of .694 means that 30.6% of the total variance is due to variation (heterogeneity) within a single tumour). As a result, we found that the intertumoral variation was higher than the intratumoral variation (Table 3). (heterogeneity and measurement noise). Therefore, inter-tumoural variation is considerably higher than intra-tumoural variation (Table 3).
Reproducibility.
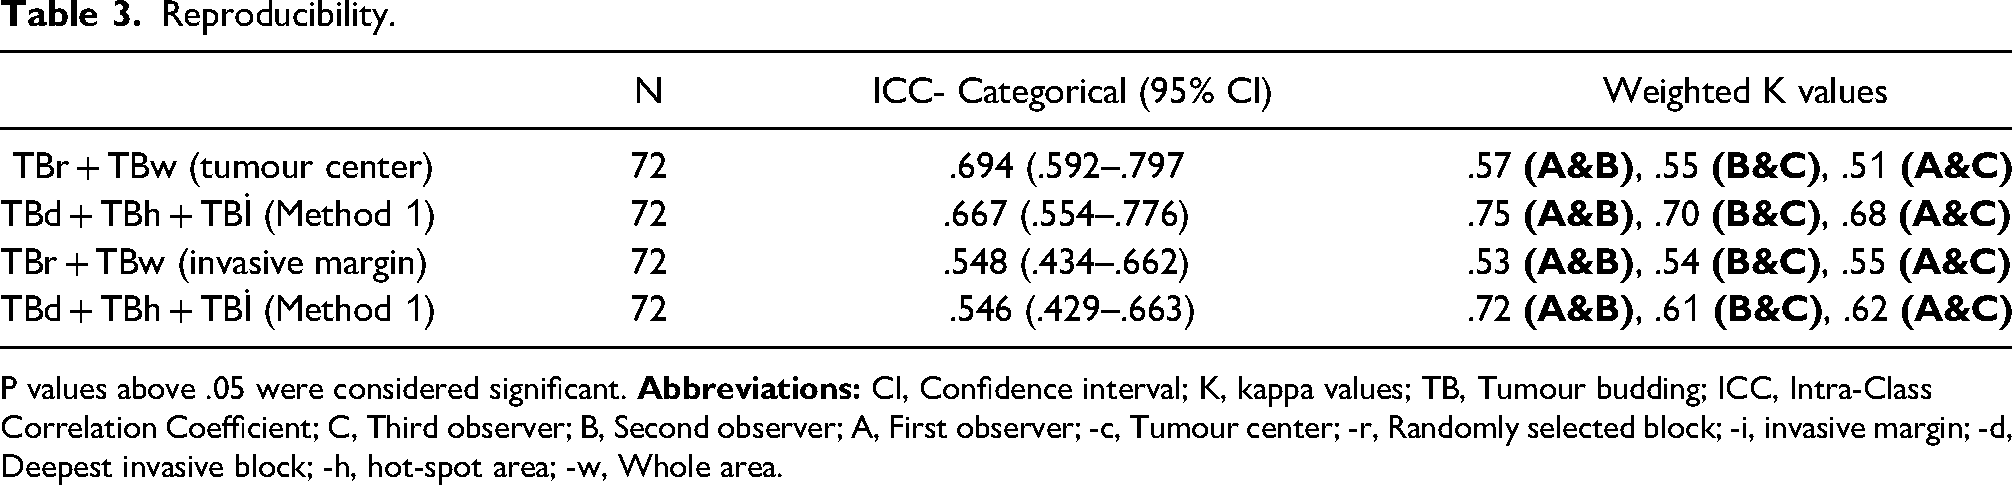
P values above .05 were considered significant.
Follow-up
Here we mentioned the results of Method 1, where we achieved the best results. During the five-year follow-up, we found that 22 patients died (30%; n = 7 in low TB, n = 15 in high TB) and 26 patients relapsed (36%; n = 8 in low TB, in high TB n = 18). Of these recurrent patients, 10 had local recurrence (13%; n = 2 in low TB, n = 8 in high TB), and 7 had distant recurrence (9%; n = 8 in high TB). = 6 and n = 1 in low TB). When we examine the 5-year survival rates; RFS = 76% and OS = 80% in high TB patients, and RFS = 88% and OS = 90% in low TB patients. When we examined the recurrence rates, LR = 9% and DR = 8% in high TB, LR = 4%, and DR = 2% in low TB (Table 4). When we examined the univariate survival analysis, we found that there were significant differences between the survival groups (RFS = .00003, OS = .0004, LR = .003, and DR = .008). Other parameters in which significant differences were observed were pT stage, MSI, surgical margin, and nodal involvement (Table 4, Figure 4). When we examined the multivariate survival analysis, we found that high TB was an independent poor prognostic parameter (RFS: HR = 1.42 [1.13–1.80], p = .002), OS: HR = 1.38 [1, 07–1.79], p = .014), and LR: HR = 1.61 [1.03–2.52], p = .034) (Table 5).
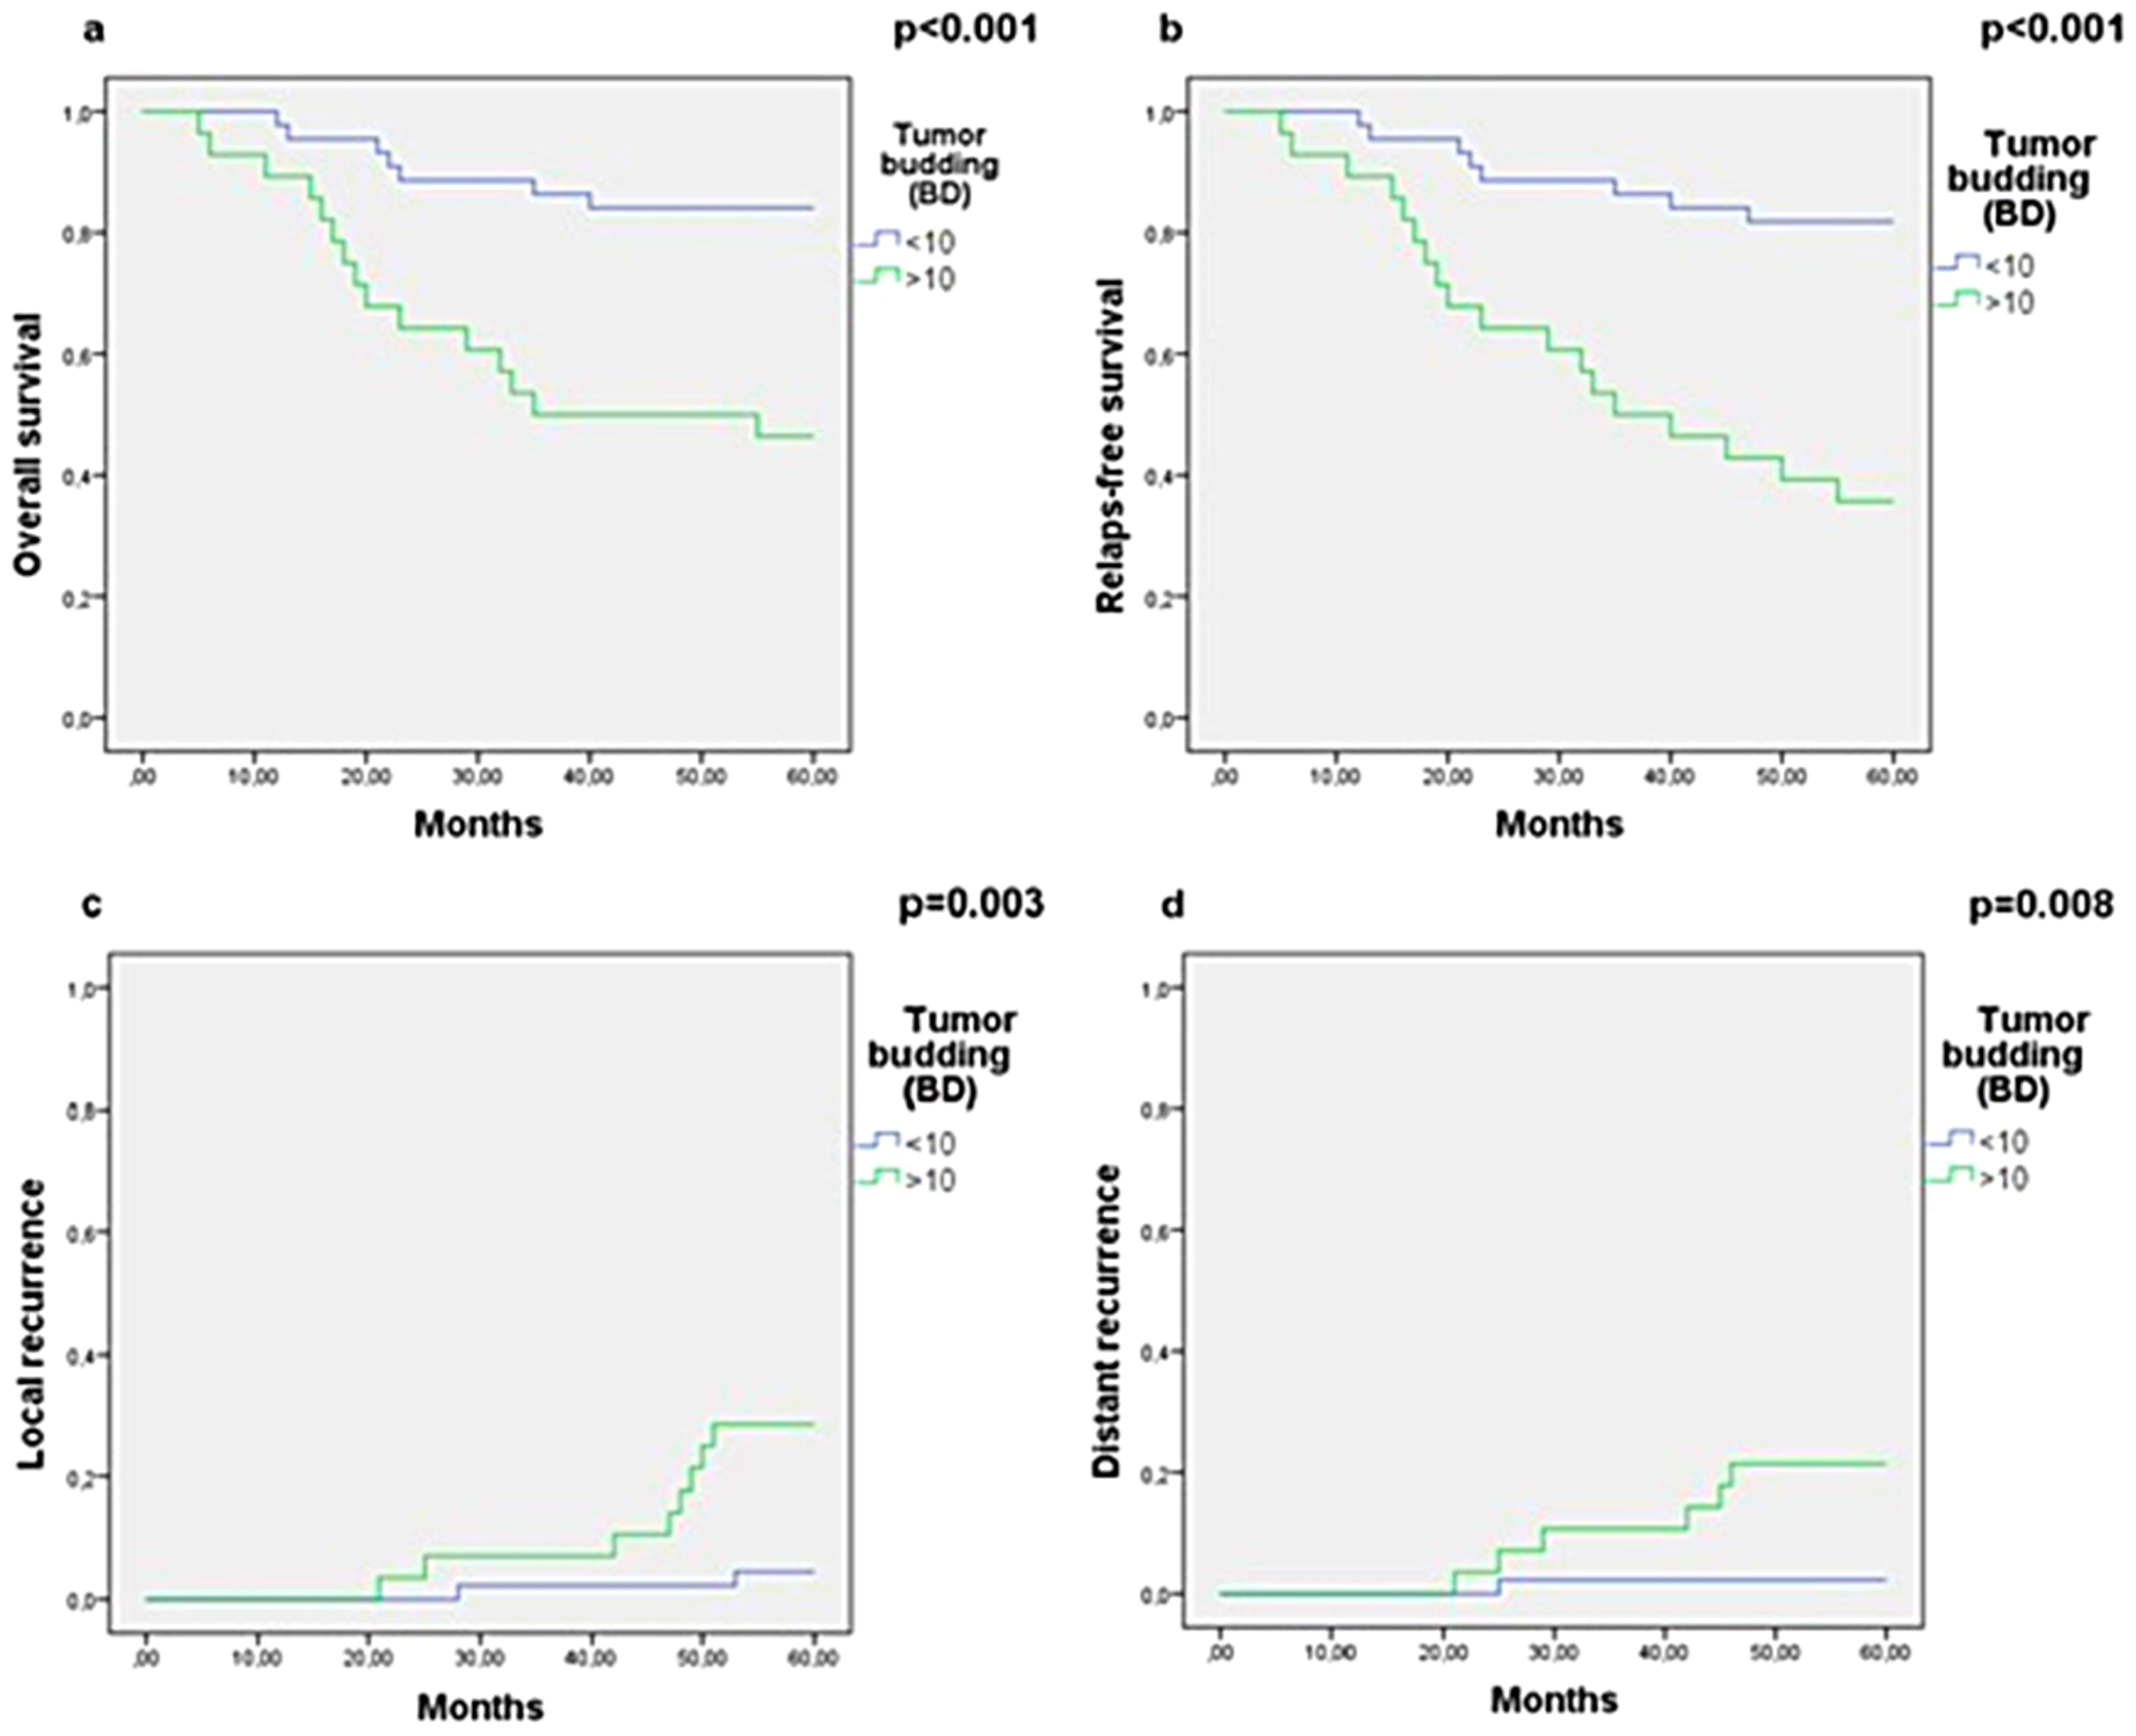
Recurrence and survival analyses. Kaplan-Meier test was performed when analyzing survival curves. a: Overall survival, b: Relapse-free survival, c: Local recurrence, d: Distant recurrence.
Univariate Survival Analysis.
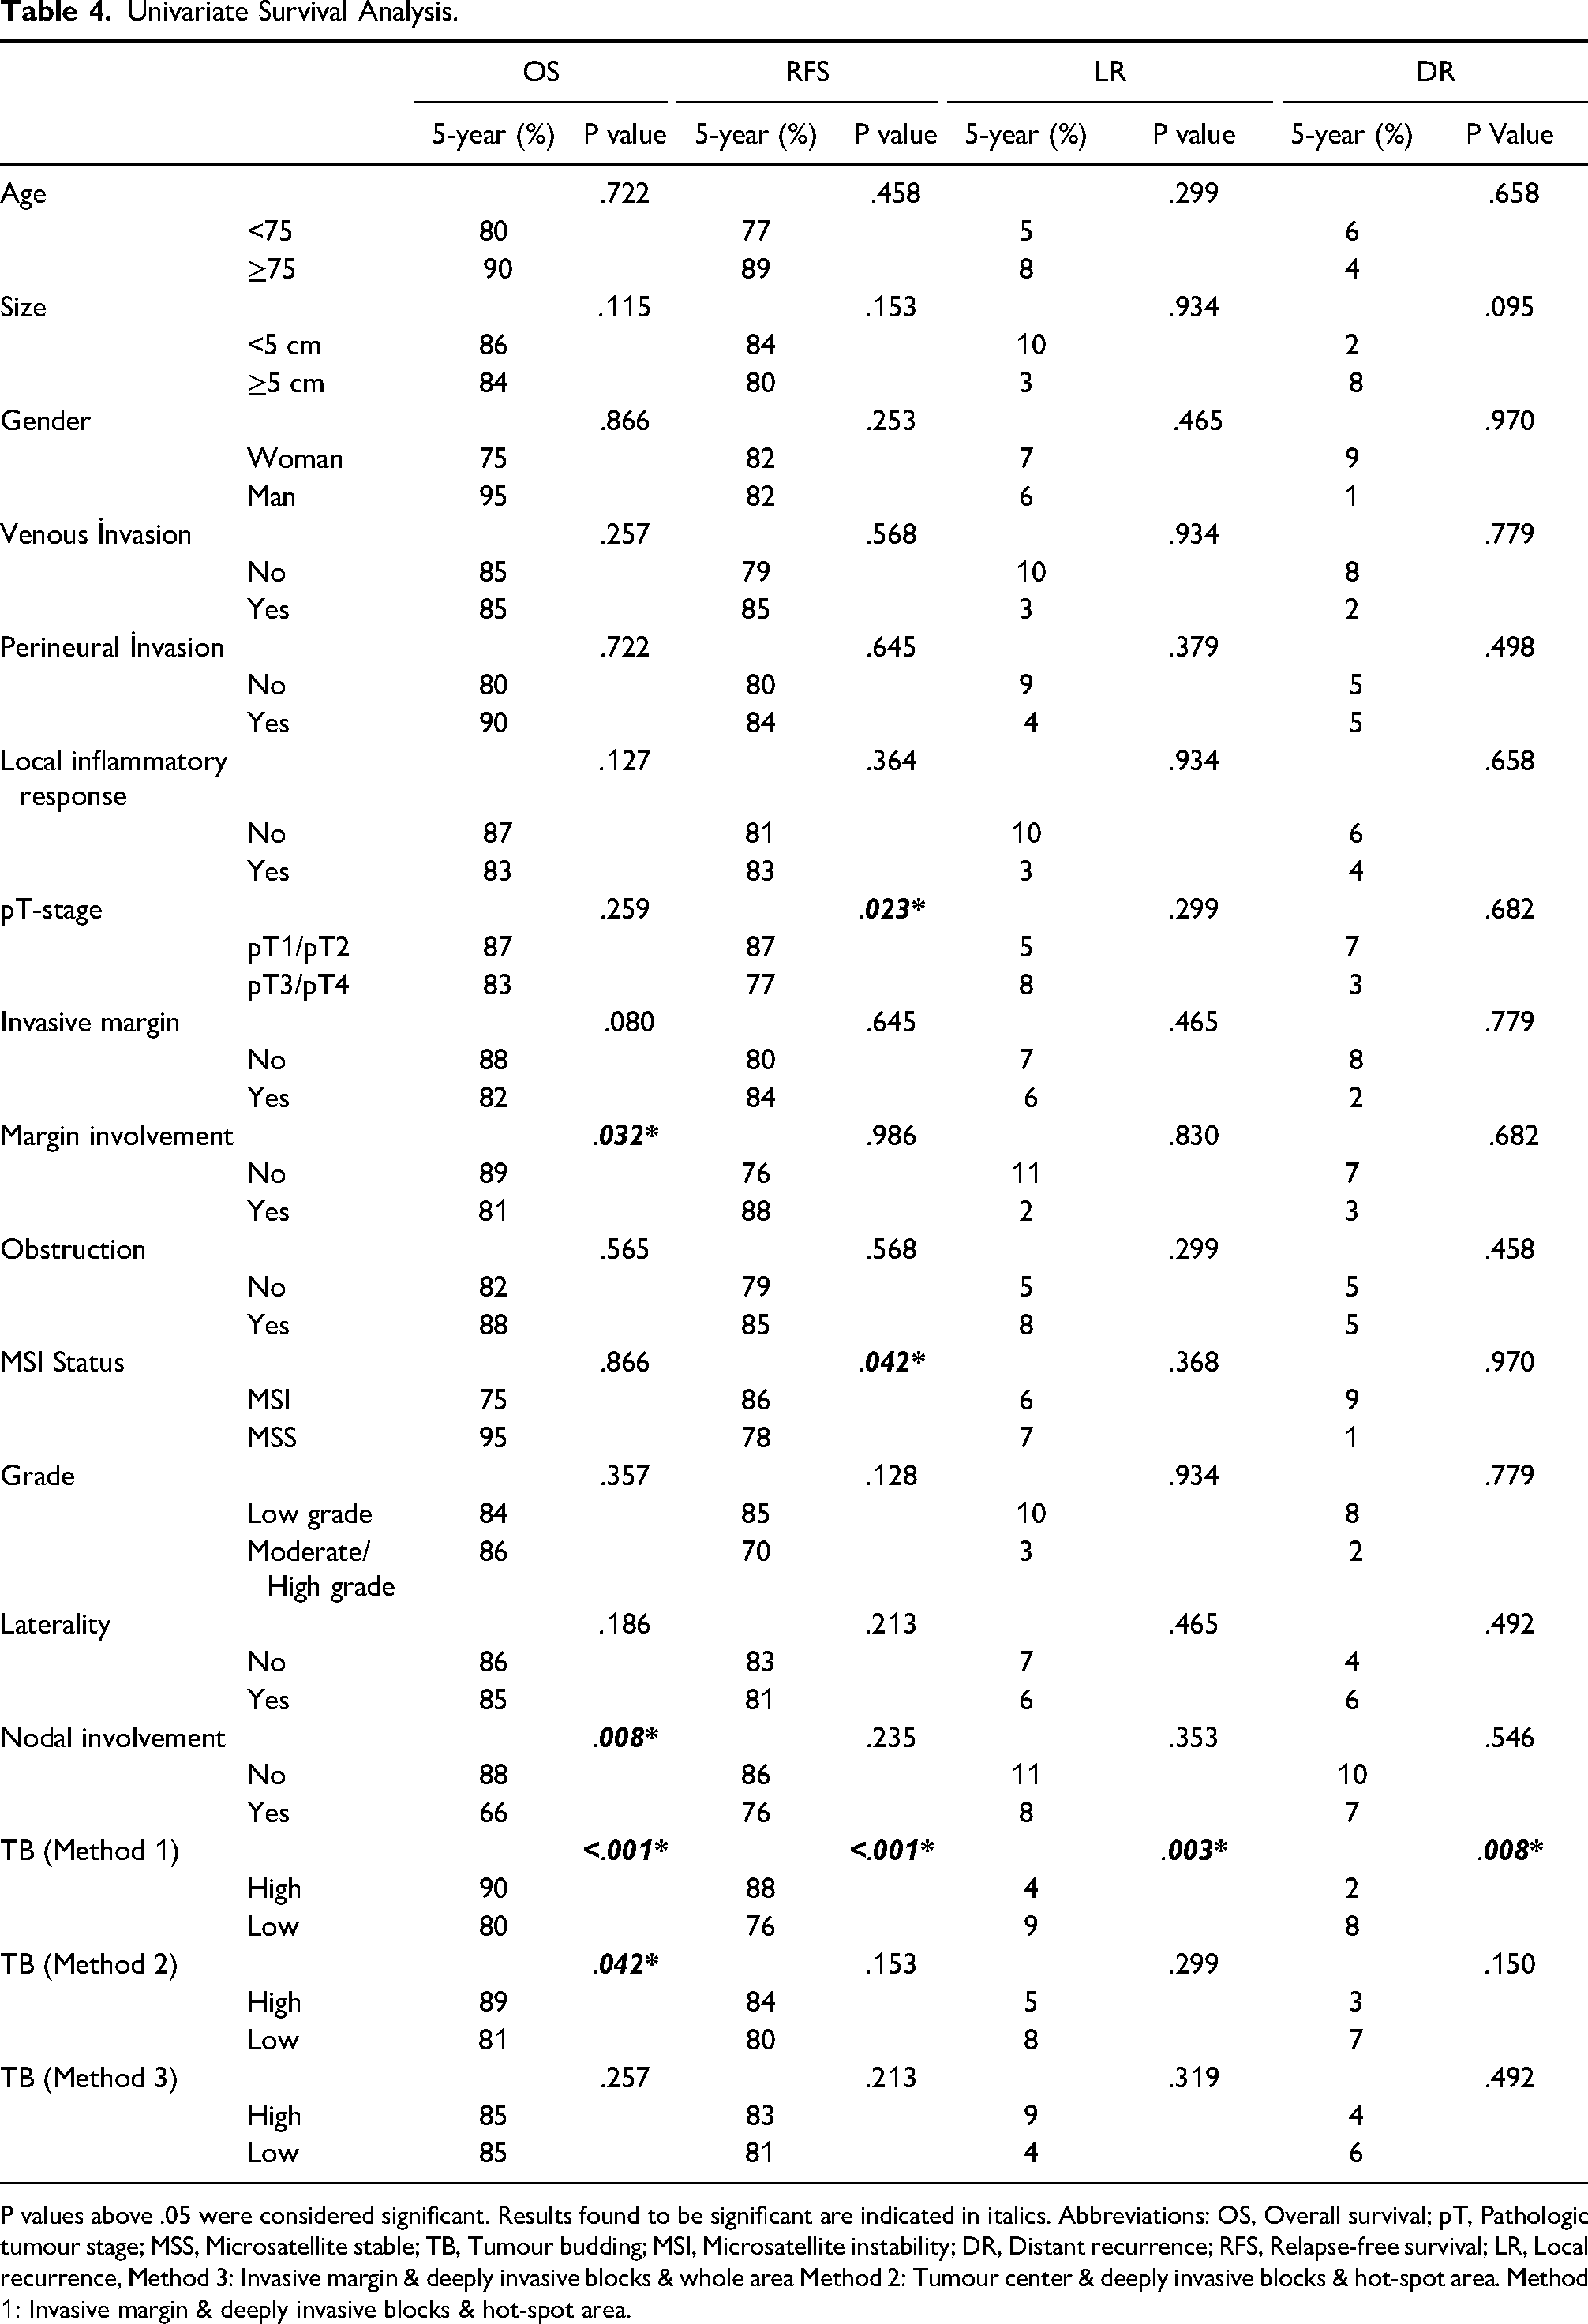
P values above .05 were considered significant. Results found to be significant are indicated in italics. Abbreviations: OS, Overall survival; pT, Pathologic tumour stage; MSS, Microsatellite stable; TB, Tumour budding; MSI, Microsatellite instability; DR, Distant recurrence; RFS, Relapse-free survival; LR, Local recurrence, Method 3: Invasive margin & deeply invasive blocks & whole area Method 2: Tumour center & deeply invasive blocks & hot-spot area. Method 1: Invasive margin & deeply invasive blocks & hot-spot area.
Multivariate Survival Analysis.
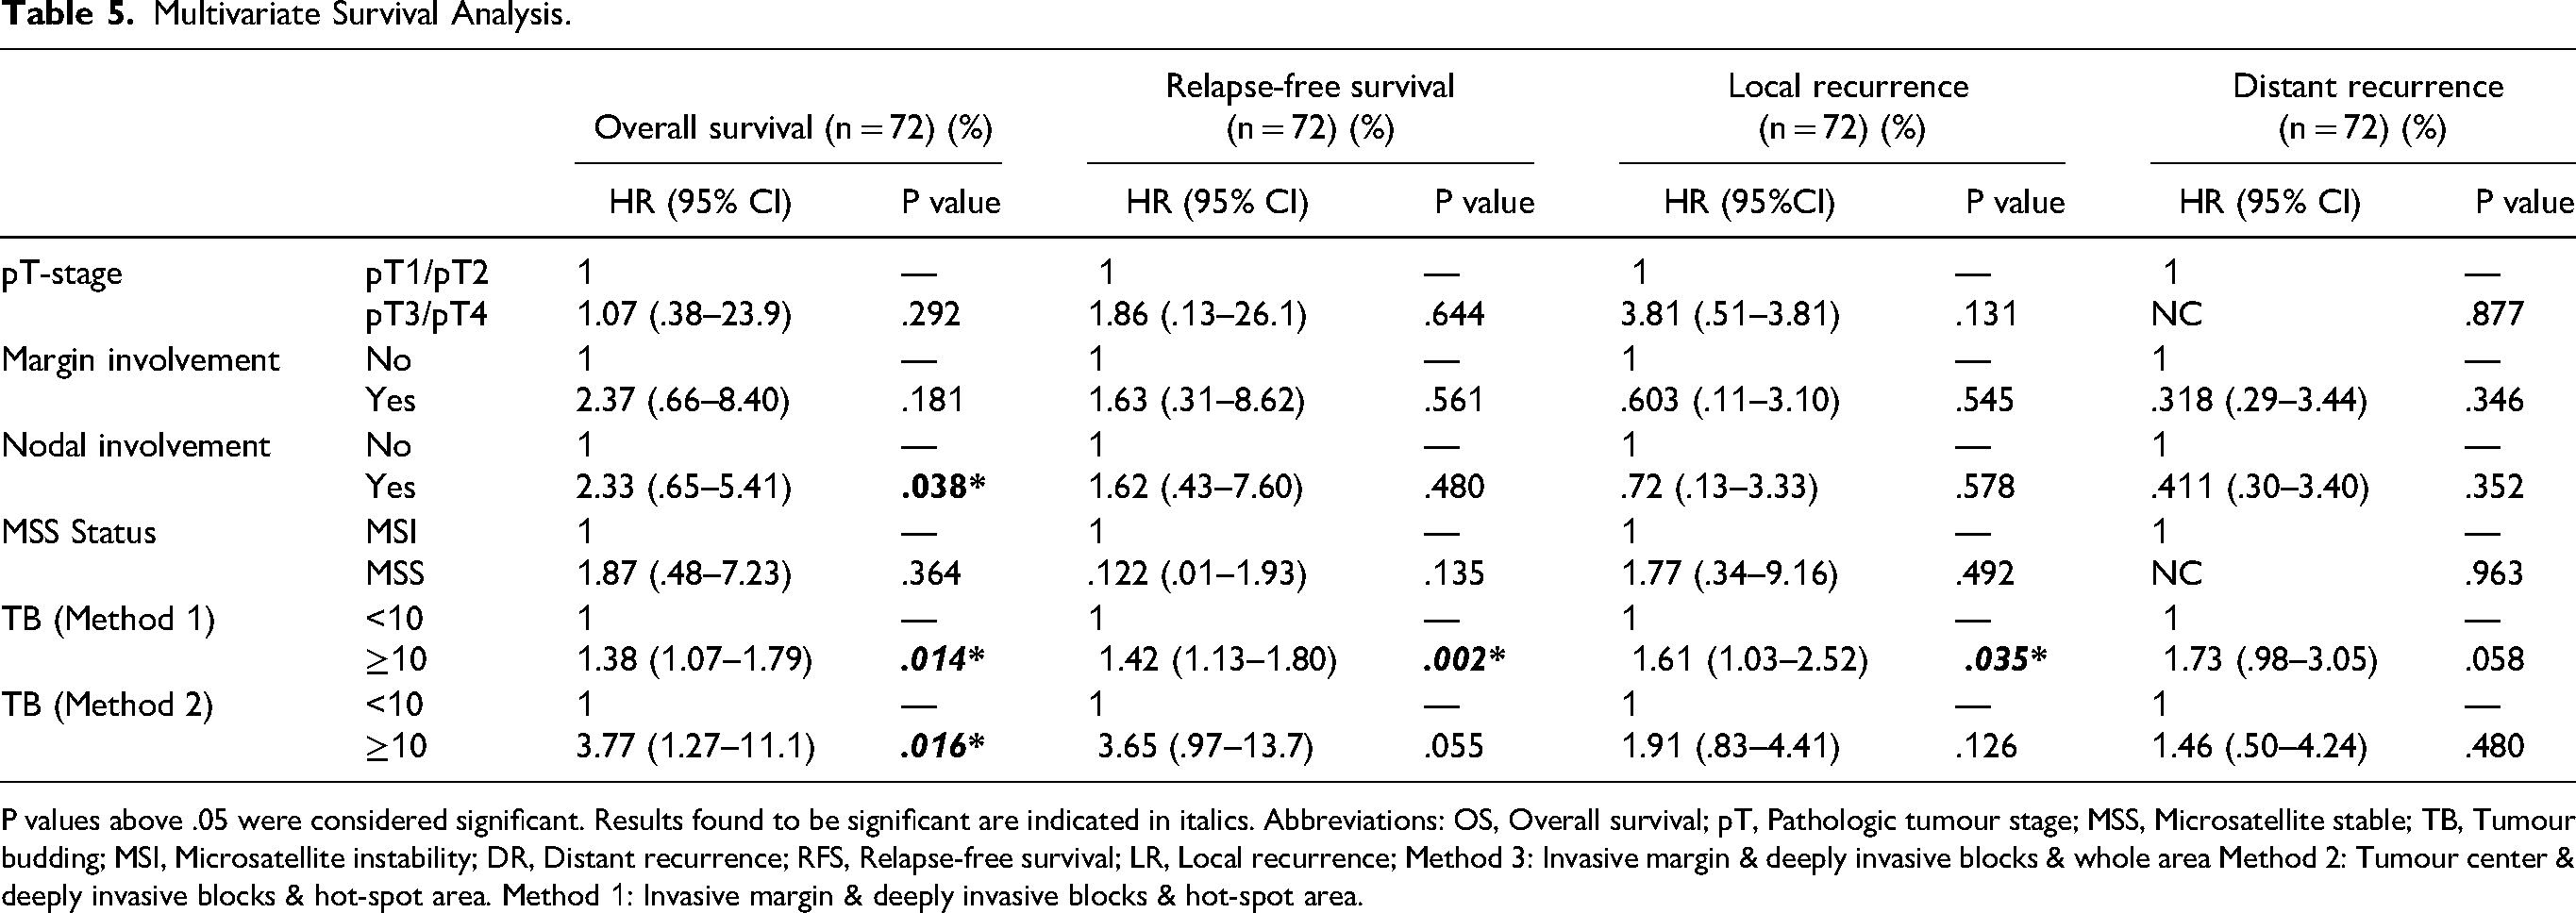
P values above .05 were considered significant. Results found to be significant are indicated in italics. Abbreviations: OS, Overall survival; pT, Pathologic tumour stage; MSS, Microsatellite stable; TB, Tumour budding; MSI, Microsatellite instability; DR, Distant recurrence; RFS, Relapse-free survival; LR, Local recurrence; Method 3: Invasive margin & deeply invasive blocks & whole area Method 2: Tumour center & deeply invasive blocks & hot-spot area. Method 1: Invasive margin & deeply invasive blocks & hot-spot area.
Discussion
In this study, we discussed the effect of tumour budding on survival in stage II colon cancer patients treated only with surgery. According to our findings, tumour budding has a significant impact on the progression of CC. We also investigated the optimal technique for the assessment of TB and found that Method 1 was more beneficial.
Although in some studies no prognostic significance was noted,21,22 the presence of high TB was found to be associated with shorter survival in most stage II colon cancer studies.10,11,15 According to our findings, tumour budding is an independent poor prognostic factor for CC in terms of both recurrence and survival. However, it should be emphasized that studies are quite variable in terms of both population and evaluation methods. In addition, in some studies in the literature, tumour budding was evaluated in a single area and only in routinely stained (H&E) stained sections. In very comprehensive studies in terms of population and methodology, it was determined that the presence of high tumour budding was an independent survival parameter for CC, similar to our results. 11 However, when examined carefully, it is seen that the population in most studies is quite heterogeneous, and rectal tumours are often included in the population. However, there is no clear information in the literature about whether there is a difference between rectal tumours and colon tumours in terms of tumour budding. For this reason, we did not include rectal tumours when creating our population. We also excluded patients treated with adjuvant chemotherapy to increase homogeneity. As a result, the population in our study was designed to be quite homogeneous compared to other studies.
A most important challenge in evaluating methods such as tumour budding in the literature is the availability of many different techniques. For this reason, repeatability and standardization are not possible. These different techniques include scoring methods, staining, assessment field, visualization, etc.13,23–25 After evaluating these methods separately, we discerned method 1 (analysis of deepest invasive blocks & hot spot area & invasive margin) to be the most reproducible in addition to being the most predictive with regard to overall survival and recurrence.
There are different findings about the tumour budding rate and mean in studies, ranging from 7.11 to 8.0511,24 and 19.5% to 45%.24,25 For example, Koelzer reports a budding rate of 30% and an average of 7.11 buds in his study. 11 Horic found an average bud count of 7.95. 25 We attempted to explain the variability in the literature, including our study, with method differences and heterogeneity of tumours. Indeed, we found higher intratumoral heterogeneity in our study. We also evaluated with the average of many HPFs, and this may vary the average. As a result, evaluation methods for tumour budding in the literature are quite variable, and extensive studies are needed for standardization.
Although reproducibility and interobserver agreement are better with IHC, there is currently a consensus on the evaluation of tumour budding with H&E.8,12 Additionally, some studies in the literature found no difference in prognostic effect between H&E and IHC.21,23,26–29 In our study, we used H&E and IHC stained sections together. Difficulties we experience with H&E stained sections are as follows; bud-like structures, fragmented appearance of tumour glands due to inflammatory leakage, and disintegration of tumour tissue due to mucin leakage. Difficulties we experience with IHC stained sections are as follows; staining of different cell types (vascular cells) other than tumour cells.
We would like to highlight important aspects of our study as follows: First, our study was conducted according to REMARK guidelines. 13 We propose a reliable parameter for colon cancer patients, which is very popular in the literature. We think that we obtained more reliable results because we worked with a very homogeneous population (stage II colon cancer patients who did not receive adjuvant treatment). We tried many different methods and chose the most suitable one. Therefore, we think that our study will make an important contribution to the standardization of the literature.
The limitations of our study are as follows. First of all, our study is retrospective and these studies have some limitations (for example, sampling bias). Although we evaluate many different areas of the tumour, this only constitutes a small part of the entire tumour. Additionally, since our patients were treated according to protocols before 2012, there may be differences compared to current treatment protocols.
Conclusion
Our results confirm the predictive value of tumour budding in colon cancer patients. In addition to the established prognostic parameters, tumour budding is accessible in post-treatment resection specimens and could, at least hypothetically, predict the need for chemo-radiotherapy in stage II patients. We recommend using method 1 and the cutoff value of 10 buds for optimal tumour budding analysis.
Footnotes
Abbreviations
Acknowledgments
We would like to thank the staff of the Department of Pathology for their support at all stages of our study.
Declaration of Conflicting Interests
The authors declared no potential conflicts of interest with respect to the research, authorship, and/or publication of this article.
Funding
The authors received no financial support for the research, authorship, and/or publication of this article: The subject or material we discuss in our study has absolutely no financial relationship with any organization.
Ethical Approval
Ethical approval for this study was obtained from an ethics committee or institutional review board (11/2019).