
Abstract
This study investigated the construct (structural) validity of Holland’s circumplex model of vocational personality types in Africa. Data were obtained on the general occupational themes of the Strong Interest Inventory for 28 countries. These countries were classified into three different geographic regions (Eastern Africa, Southern Africa, and Western Africa). The randomization test and circumplex covariance structure modeling were used to investigate the fit of Holland’s circumplex model across these regions. Results provide preliminary evidence for the generalizability of Holland’s model in the African context. Inspection of the angular locations of the six vocational personality types in two-dimensional space indicated slight disordering of the types in the Eastern Africa region and the correct ordering of the types in the Southern and Western African regions. Implications for theory and practice are discussed.
Vocational theories and models developed in the United States are often applied in other contexts without consideration of the cross-cultural validity of these theories and models (Leong & Pearce, 2014; Stead & Watson, 1998; Tracey & Gupta, 2008). This practice is potentially problematic because it may impose U.S. culture elements onto another cultural group while ignoring cultural-specific elements that impact on an individual’s career decisions, choices, and development (Leong, 2002; Leong & Pearce, 2014). One model that has enjoyed global application (Bullock, Andrews, Braud, & Reardon, 2010; Leung, 2008; Reardon & Lenz, 1998) is Holland’s model of vocational personality types. This model has a rich tradition and extensive literature base that contributes to its widespread use in career interventions and research (Reardon & Lenz, 1998). However, proper application of the model depends on whether its validity is supported in the context where it is applied (Tracey & Gupta, 2008).
In brief, Holland (1958, 1973) proposed that there are six basic vocational personality types (i.e. Realistic [R], Investigative [I], Artistic [A], Social [S], Enterprising [E], and Conventional [C]) and that the relations between these types can best be summarized by a circular structure. Whereas the structural validity of Holland’s model (i.e., the circular structure) has received much support in the U.S. (Kantamneni, 2014; Rounds & Tracey, 1996; Tracey & Rounds, 1993; Xu & Tracey, 2016), there is evidence that the model may not fit well outside this region (Rounds & Tracey, 1996). This calls into question the cross-cultural transportability of Holland’s model and whether or not it can be safely used in career guidance and counseling with non-U.S. clients.
In response to the greater awareness of cultural factors that impact on counseling (see Leong, 2002; Leong & Pearce, 2011, 2014), several studies have investigated the construct validity (i.e., structural validity) of Holland’s model outside the U.S. (Einarsdóttir, Rounds, Ægisdóttir, & Gerstein, 2002; Hedrih, Stošić, Simić, & Ilieva, 2016; Iliescu, Ispas, Ilie, & Ion, 2013; Long, Adams, & Tracey, 2005; Nagy, Trautwein, & Lüdtke, 2010; Šverko & Babarović, 2006; Tang, 2009). For the most part, these studies support the construct validity of the model in the countries where it was examined. Unfortunately, these studies are mostly confined to Europe and Asia. Few studies have investigated the construct validity of Holland’s model in the African continent (for a review, see Bullock et al., 2010). This is problematic because there is evidence that Holland’s model is used for career interventions in several African countries (e.g., Amoah, Kwofie, & Baiden, 2015; Chemeli, 2013; de Bruin & de Bruin, 2009; Kolawole & Fabunmi, 2014; Muriithi, 2008; Muskin, 2012; Salami, 2004, 2008; Watson, Foxcraft, & Allen, 2007; Watson, McMahon, & Longe, 2011).
If Holland’s model is not valid in Africa, counselors could be doing their clients a disservice (see Rounds & Tracey, 1996) by imposing a model that is not relevant to and/or functioning as intended in the African context. The purpose of this study is therefore to investigate the structural validity of Holland’s model of vocational personality types in the African continent. This investigation may assist in determining the boundary conditions of Holland’s model (Leong & Pearce, 2011, 2014) and shed light on the cross-cultural structure of vocational interests (Primavera et al., 2010). In the following paragraphs, we discuss Holland’s circumplex model of vocational personality types. This is followed by an overview of cultural factors that may impact on the structural validity of Holland’s model, and a presentation of studies that have investigated the structural validity of Holland’s model in Africa.
Holland’s Circumplex Model of Vocational Personality Types
Holland (1958, 1973, 1996) argued that people and environments can be classified into six vocational personality types (commonly abbreviated to RIASEC). While Holland argued that these types form a hexagonal model, it is more common to refer to his model as forming a circumplex instead (Etzel, Nagy, & Tracey, 2016; Rounds, Tracey, & Hubert, 1992; Tracey & Rounds, 1993). A circumplex model can be seen as a circular representation of variables (Fabrigar, Visser, & Browne, 1997; Tracey, 2000). Two central components of a circumplex model are (a) the angular locations between types and (b) their vector length or radii (Gurtman, 1997). Angular locations indicate the similarity between types (Darcy & Tracey, 2007; Fabrigar et al., 1997) while vector length refers to “the amount of variance that the trait shares with the circular domain in which it is being projected” (Gurtman, 1997, p. 93). Underlying the circumplex are two orthogonal dimensions that account for the relations among the types (Tay, Su, & Rounds, 2011). In the vocational interest literature, these dimensions are typically referred to as the people–things and data–ideas dimensions (Prediger, 1982).
There are four main definitions of Holland’s circumplex depending on the constraints placed on the angular locations and/or vector lengths (for an overview of these definitions and how they manifest in different circumplex models, see Darcy & Tracey, 2007). Using Browne’s (1992, 1995) framework, the most restrictive model is the circulant model, where the angular spacing between the variables and the communalities (i.e., vector lengths) are constrained to be equal (Browne, 1995; Darcy & Tracey, 2007; Tracey, 2000). Applied to Holland’s model, the circulant model implies a 60° spacing between the RIASEC types and that each type has equal radius or equal common variance (Rounds et al., 1992). A derivative of the circulant model is the circular ordering model (Darcy & Tracey, 2007; Tracey, 2000). This model is similar to the circulant model in that it assumes a 60° spacing between the RIASEC types (i.e., equal spacing) and equal vector lengths but focuses only on the relative magnitude of the correlations between the RIASEC types rather than making explicit equality constraints (Darcy & Tracey, 2007).
In contrast to the heavily restrictive circulant model, the unrestricted or loose circular ordering model, which is the least restrictive of the four circumplex models, only requires that the order of the types must be consistent with a circular structure (Browne, 1995; Darcy & Tracey, 2007; Tracey, 2000), but neither equal spacing nor equal communalities are required. In between, these two models are two quasi-circumplex models where either the angles are constrained to be equal and the communalities freely estimated or where the angles are freely estimated and the communalities are constrained to be equal (Browne, 1992; Tracey, 2000).
Research has generally shown that Holland’s model is more consistent with the least restrictive model than with a circulant model (Beinicke, Pässler, & Hell, 2014; Darcy & Tracey, 2007; Gupta, Tracey, & Gore, 2008; Nagy et al., 2010). It is not surprising that Holland’s model often does not fit the restrictive circulant version of the circumplex because it represents a theoretical ideal that may not be approximated in reality (Fabrigar et al., 1997). In practice, it is the circularity of the RIASEC types that are of concern (i.e., the correct ordering of the RIASEC types and their coverage of the underlying interest space). Minor departures from the circulant RIASEC model (i.e., the hexagonal model) may not necessarily have practical significance for counseling (for similar arguments made in reference to the interpersonal circumplex, see Gurtman & Pincus, 2000; Trucco, Wright, & Colder, 2013).
Holland’s Model and Culture
It is well known that culture cannot be ignored in career guidance and counseling (Leong & Pearce, 2011, 2014) because culture influences how people understand the world of work and how they see themselves in relation to the world of work (Hansen, Scullard, & Haviland, 2000). Holland’s model was developed in and for the U.S. context and U.S. occupational structure and is therefore inherently Eurocentric in orientation (see Leong & Wong, 2003; Nauta, 2010; Rounds & Tracey, 1996). This raises the question as to whether or not Holland’s model is valid in the African context. Countries in Africa are different to the U.S. in many ways that may be relevant with respect to how persons make decisions about career choice. For example, Levers, May, and Vogel (2011) argue that Western (Eurocentric) societies tend to be more individualistic and competitive, whereas African societies tend to be more collectivistic and cooperative. The Western worldview also tends to promote an independent self-view whereas in Africa, the self tends to be viewed within the context of others (Mkhize, 2004).
These aforementioned differences may potentially influence the meaning of vocational interests, the role that vocational interests play in people’s career choices and decisions and the organization of interest types in a particular cultural group (Hansen et al., 2000; Rounds & Tracey, 1996; Tracey & Gupta, 2008). It need not, however, necessarily impact on the structure of vocational interests. For example, Rounds and Tracey (1996) found that individualism–collectivism did not explain differences in the fit of Holland’s model across countries. It must be noted that even though the structure may be the same (i.e., RIASEC), the meaning that people give to the vocational personality types may differ across different cultural groups (Soh & Leong, 2001). At the same time, it is possible that there might be some constructs (e.g., the structure of vocational interests) that transcend culture and are more universal in nature (see Cheung, van de Vijver, & Leong, 2011).
Labor and economic conditions, which may differ across the U.S. and countries in Africa, may also influence how people view occupations and how people respond to interest inventory items (see Einarsdóttir, Eyjólfsdóttir, & Rounds, 2013; Einarsdóttir, Rounds, & Su, 2010; Holland, 1997; Leong, 1997; Primavera et al., 2010). For example, in favorable economic conditions, there may be more latitude in career selection, with more focus given to vocational interests and aptitude, in comparison to unfavorable economic conditions, where obtaining a job may supersede interests and aptitude (du Toit & de Bruin, 2002; Hussain et al., 2014).
Given that cultural differences might impact on how people view vocational interests, there is much merit in investigating which elements of Holland’s model are generalizable and which are culturally specific (Leong, 2002). Failure to attend to differences in interest structure and Holland’s model (should such differences be found) can potentially lead to inappropriate career guidance and counseling interventions (Rounds & Tracey, 1996; Tracey & Gupta, 2008). In this respect, Hansen, Scullard, and Haviland (2000) emphasized that “clients may be confused if they are encouraged to envision themselves in the world of work using the circular order structure if the R-I-A-S-E-C model is not appropriate for cultural populations similar to the clients” (p. 163). That is, structural differences may represent different mental representations of the world of work (Hansen et al., 2000; Rounds & Day, 1997) negating the use of Holland’s model and the associated assumptions of Holland’s model in career guidance and counseling.
The Fit of Holland’s Model in Africa
In a review, Bullock et al. (2010) found one published study that investigated the construct validity of Holland’s model in Africa (i.e., du Toit & de Bruin, 2002). We conducted a fresh search of the literature using Google Scholar, EBSCOhost, PsycINFO, and Academic Search Complete as databases and found four published articles that investigated Holland’s circumplex model in Africa: du Toit and de Bruin (2002), Morgan, de Bruin, and de Bruin (2015a, 2015b), and Wheeler (1992). All four studies were conducted in South Africa, which limits the generalizability of the results to the Africa continent as a whole. Some studies outside South Africa have employed Holland’s model in other African countries but did not explicitly examine the structural validity of the model (e.g., Chemeli, 2013; Ekore, 2014; Migunde, Agak, & Odiwuor, 2011; Muriithi, 2008). For the most part, these studies do not report the correlations between the six RIASEC types, which prevent further analysis of the data. The results of the four South African studies that did focus on the structural validity of the RIASEC model are presented in the following paragraphs.
Wheeler (1992) used smallest space analysis (Guttman, 1968) to examine the validity of a South African adaptation of the Self Directed Search (SDS), which is a popular measure of Holland’s RIASEC types, among Grade 12 participants. The results did not support the predicted RIASEC ordering of the types, with the Artistic type falling between the Enterprising and Conventional types (i.e., RISEAC). du Toit and de Bruin (2002) examined the fit of Holland model among men and women from the North West and Eastern Cape provinces in South Africa, using the South African standardization of the SDS. Using multidimensional scaling, they observed disordering of the RIASEC types across all their sample groups (RISAEC, RISAEC, RICESA, and RISCEA). A mean correspondence index (CI) value (Hubert & Arabie, 1987), which indicates how many order predictions corresponding with Holland’s circumplex structure are met in a correlation matrix (Rounds et al., 1992), of .41 was obtained across all the sample groups. This is far less than the U.S. benchmark of .70 (Rounds & Tracey, 1996). The authors argued that the poor representation of Holland’s model could possibly be explained by language (i.e., participants completed the instrument in English, which was not necessarily their spoken home language), cultural differences in how participants perceived the world of work, and the perceived role of interests in occupational selection (du Toit & de Bruin, 2002).
More recently, Morgan et al. (2015a) set out to develop a local measure of Holland’s model that from the outset took the multicultural and multilingual composition of the South African population into consideration. In contrast to the low CI values reported by du Toit and de Bruin (2002), Morgan et al. (2015a) found CI values of .83 and .92 across two sample groups that were obtained from participants across two provinces (Gauteng and KwaZulu-Natal), and Morgan et al. (2015b) found CI values of .72 for men and .97 for women, respectively. Circumplex covariance structure modeling, which is a confirmatory technique used to investigate fit of a circumplex model (Browne, 1992, 1995), also indicated that the correct ordering of the RIASEC types occurred Morgan et al. (2015a) and that a circumplex model of Holland’s vocational personality types was tenable in South Africa. Given the inconsistency of results across different studies, the question is raised as to whether the observed differences in fit across studies are due to (a) Holland’s model being invalid in the African context, (b) sampling error, or (c) differences in the instruments used to measure the six types.
Aim of the Study
As a whole, studies on the construct (structural) validity of Holland’s model in Africa appear to be limited, scattered, and isolated and based on psychometric instruments that potentially have varying quality. A thorough analysis of RIASEC data collected on a well-established instrument, such as the strong Interest Inventory (SII; Donnay, Thompson, Morris, & Schaubhut, 2004), across several countries holds promise for investigating the construct validity of Holland’s model in Africa. The aim of this study is therefore to examine the construct validity of Holland’s RIASEC model in the African context using data obtained with the SII.
Method
Participants
RIASEC scores of 599 adolescents and adults (all participants were 18 years or older) who indicated that both their country of origin and country of residence were in Africa were obtained from CPP, Inc. Clients completed the SII for career counseling and/or personal development. The mean age of the respondents was 26.08 years (standard deviation [SD] = 9.71, median = 22). There was an approximately equal representation of men (n = 299, 49.9%) and women (n = 300, 50.1%). Unfortunately, the sample sizes were relatively small for each of the individual countries precluding the use of individual countries in the data analysis. It was therefore decided to collate the countries into three regions: East, South, and West. It is recognized that although the countries share similar geographic regions, they do not necessarily share the same cultural backgrounds and economic/labor conditions. The results can therefore not be generalized to each country. This collation provided a sample size large enough for the statistical analyses.
The collation was done according to the regions described in Esterhuysen, van As, and Ndlovu-Gatsheni (2013). The countries representing each region are presented in Table 1. It is important to note that English is not the main spoken language in some of these countries. Although a wealth of data on South Africa was available, it was decided to not include it because it would dominate in the Southern region and because the focus was on regions in Africa that have not yet had research done on the construct validity of Holland’s model.
Countries in Each African Region.
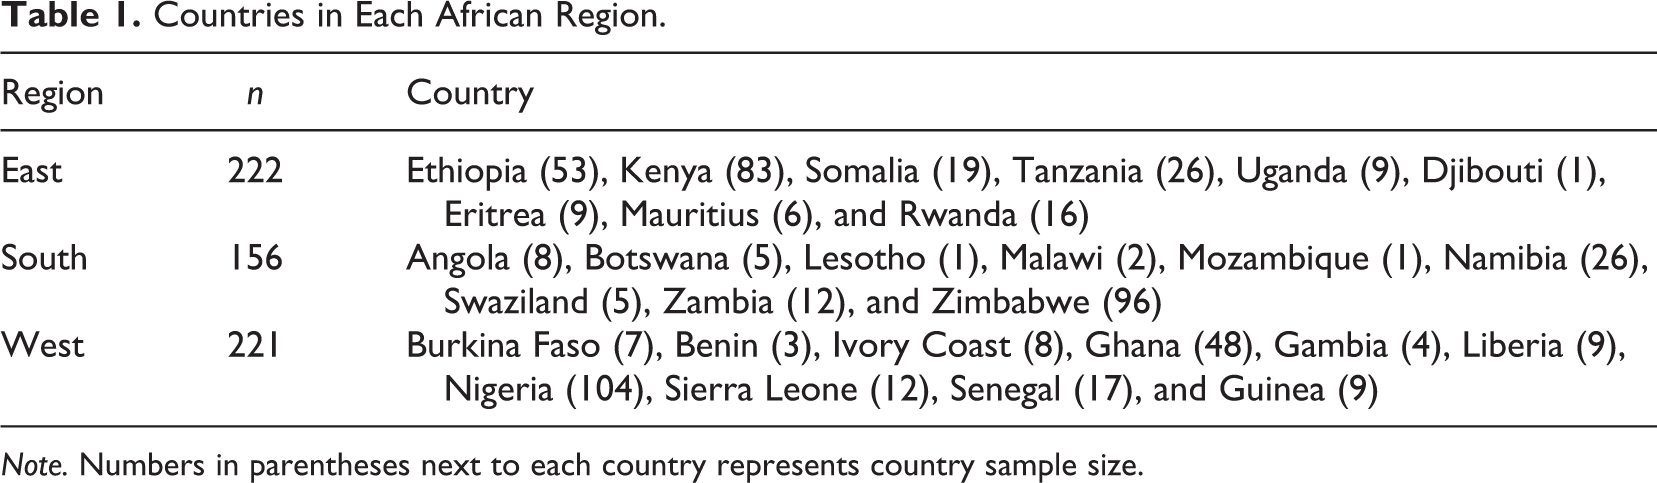
Note. Numbers in parentheses next to each country represents country sample size.
Instrument
The raw scores of the SII’s (Donnay et al., 2004) general occupational themes (GOTs), which correspond to Holland’s RIASEC types, were used. There is much evidence supporting the construct validity of the GOT in the U.S. (Flores, Spanierman, Armstrong, & Velez, 2006; Fouad & Mohler, 2004; Kantamneni, 2014; Kantamneni & Fouad, 2013; Oliver & Waehler, 2005; Pirutinsky, 2013). CI values ranging from .56 (Flores et al., 2006) to .97 (Kantamneni, 2014) have been found for the GOT across different U.S. sample groups. Flores et al. (2006) reported CI values of .94 (women) and .86 (men) for the SII reference sample. In an unpublished report, Morgan (2015) reported a CI value of .86 for South African data. To our knowledge, no validity evidence in the African context (outside South Africa) is available. α coefficients ≥.90 have been found for the six GOT (Donnay et al., 2004; Harmon, Hansen, Borgen, & Hammer, 1994).
Analysis
Circumplex covariance structure modeling (Browne, 1992, 1995) and the randomization test of hypothesized order relations (Hubert & Arabie, 1987) were used to analyze the data. Correlation matrices (these can be obtained from the first author) were used as input for each analysis. Circumplex covariance structure modeling is a confirmatory factor analytic approach that investigates the circumplex structure underlying common score correlations between variables (Browne, 1992; Fabrigar et al., 1997; Grassi, Luccio, & Di Blas, 2010). An attractive feature of circumplex covariance structure modeling is that it yields polar angles between each factor, factor communalities, and minimum common score correlations (MCSCs; Browne, 1992). The MCSC indicates the correlation between common score variables that are opposite of each other (i.e., 180° apart). In a circumplex model, the MCSC should be close to 0 if all the variables in the correlation matrix are positively correlated (Fabrigar et al., 1997).
Model fit was investigated using the root mean square error of approximation (RMSEA), standardized root mean square residual (SRMR), and comparative fit index (CFI). Against the background of the cautionary notes of Kenny, Kaniskan, and McCoach (2015) about the use of the RMSEA in models with small degrees of freedom, we interpret the RMSEA with caution (the degrees of freedom in the different models we examined were 3, 8, and 13, respectively). We used values ≤.08 for the SRMR and ≥.95 for the CFI (Hu & Bentler, 1999) to indicate satisfactory model fit. The CircE Version 1.1 (Grassi et al., 2010) package in R (R Core Team, 2016) was used to conduct the circumplex covariance structure modeling analysis.
The randomization test of hypothesized order relations (Hubert & Arabie, 1987) was used to investigate fit of the circulant ordering model. The randomization test produces a p value and CI value. The p value is used to test model data fit (Tracey, 2000). We used a p value <.05 to reject the null hypothesis that model fit would occur with random relabeling of rows and columns of the correlation matrix (Hubert & Arabie, 1987; Tracey, 2000). The CI value represents the degree of model fit and ranges from −1.00 to 1.00, where −1.00 means that none of the order predictions were met and 1.00 indicates that all of the order predictions were met (Tracey, 2000). Although Rounds and Tracey (1996) found a mean CI value of .48 (SD = .18) based on 76 non-U.S. correlation matrices, we used the U.S. CI benchmark of .70 (SD = .14; Rounds & Tracey, 1996) as an indication of satisfactory degree of fit. The RANDALL program (Tracey, 1997) was used to calculate the CI and p values.
Results
Means and SD of the RIASEC scales for the three regions are presented in Table 2. The randomization test results show that across each of the three regions, the null hypothesis could be rejected (p < .05; see Table 3). The CI value of the Southern African region was .74, whereas the CI values for the Eastern and Western African regions were .64 and .63, respectively.
Descriptive Statistics of the GOT.
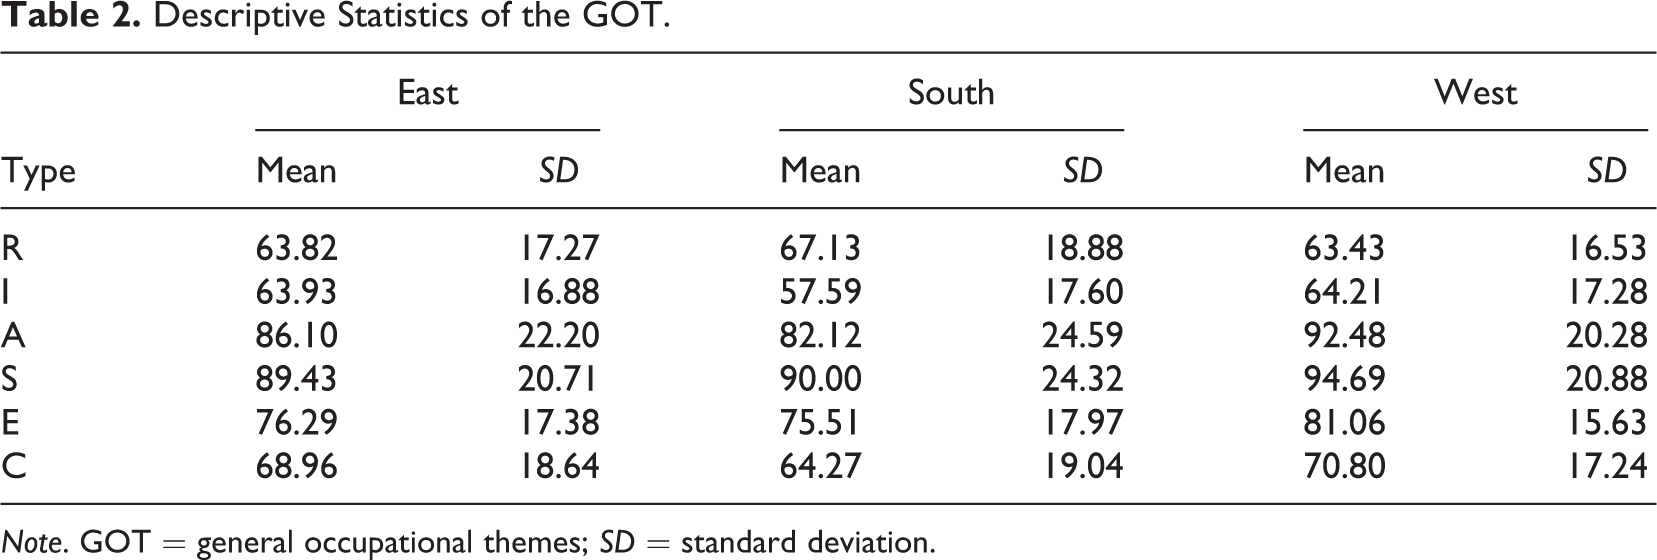
Note. GOT = general occupational themes; SD = standard deviation.
Ordering of Types and RTHOR Results Across the Three African Regions.
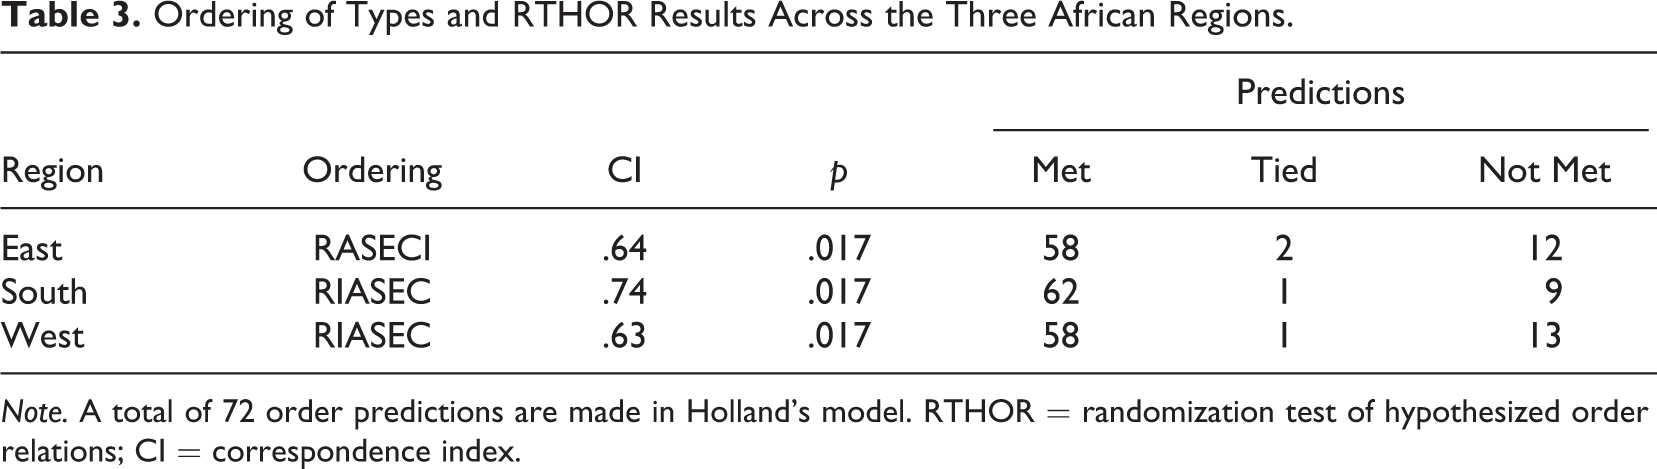
Note. A total of 72 order predictions are made in Holland’s model. RTHOR = randomization test of hypothesized order relations; CI = correspondence index.
The circumplex covariance structure modeling results are summarized in Table 4, which shows that across all the regions, the loose circular ordering model (i.e., the unconstrained model) was the best fitting model (i.e., this model produced the highest CFI and lowest RMSEA and SRMR values). Figures 1 –3 graphically presents the parameters of the unconstrained model in each of the three regions. As a whole, Table 4 shows that the fit of the unconstrained model in the Southern region was better than that in the Eastern and Western regions. The CFI and the SRMR indicated relatively good fit in the Western and Southern regions, but only marginal fit in the Eastern region. Across the three regions, the MCSC of the unconstrained model deviated from 0. This likely indicates the presence of a strong general factor in the data (Trucco et al., 2013).
CCSM Model Fit Statistics Across the Three African Regions.
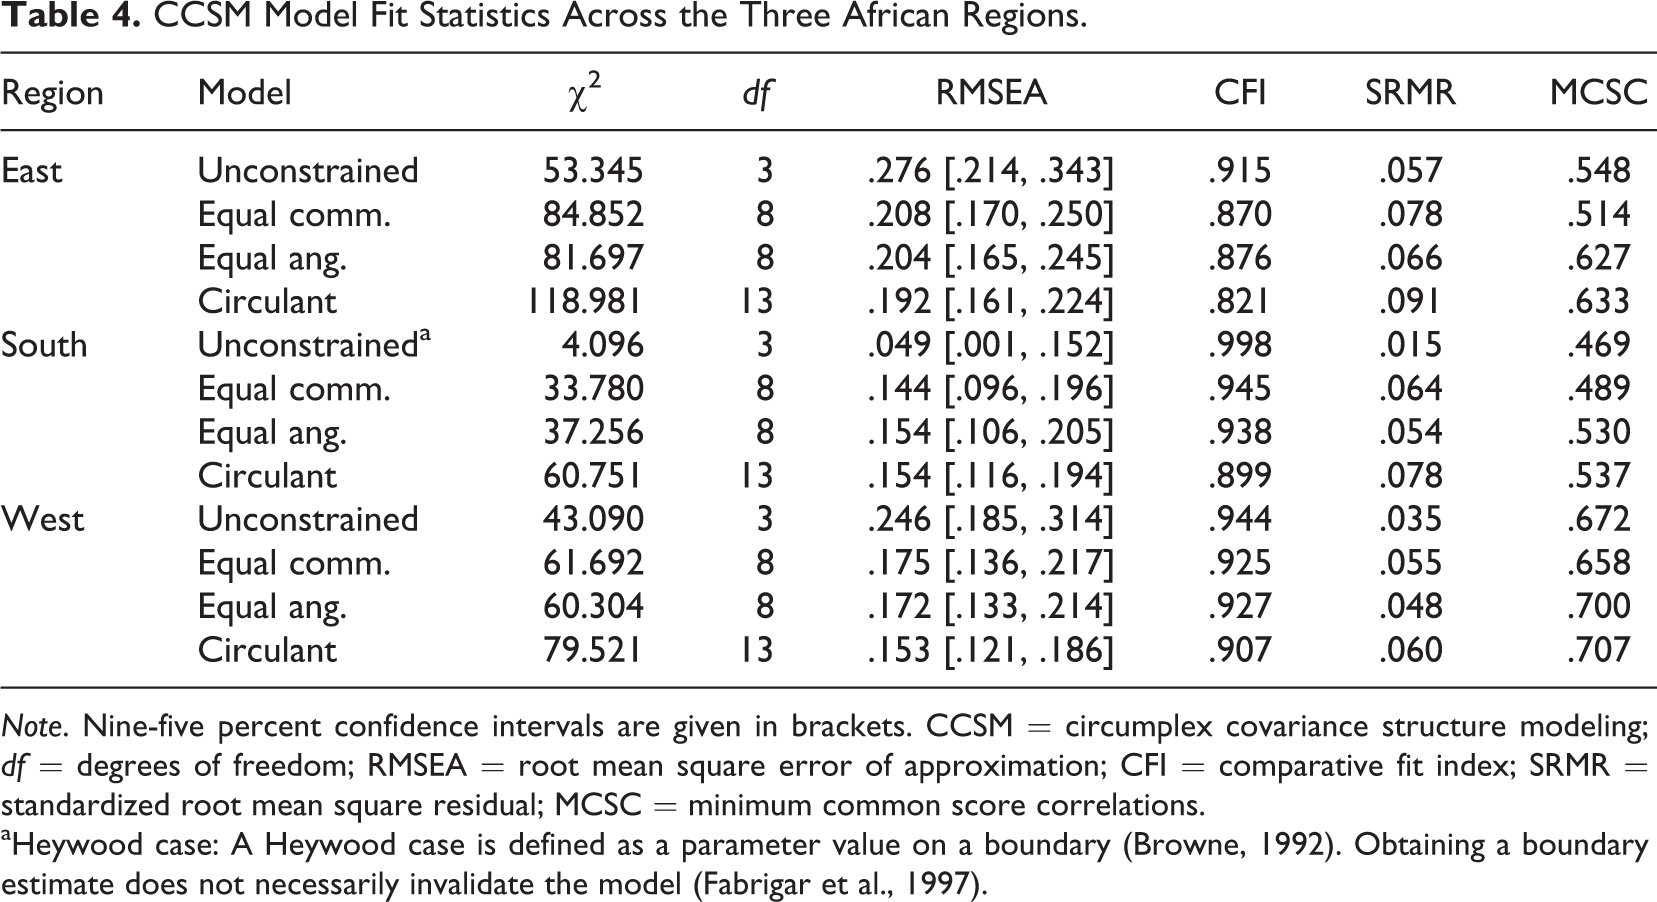
Note. Nine-five percent confidence intervals are given in brackets. CCSM = circumplex covariance structure modeling; df = degrees of freedom; RMSEA = root mean square error of approximation; CFI = comparative fit index; SRMR = standardized root mean square residual; MCSC = minimum common score correlations.
aHeywood case: A Heywood case is defined as a parameter value on a boundary (Browne, 1992). Obtaining a boundary estimate does not necessarily invalidate the model (Fabrigar et al., 1997).
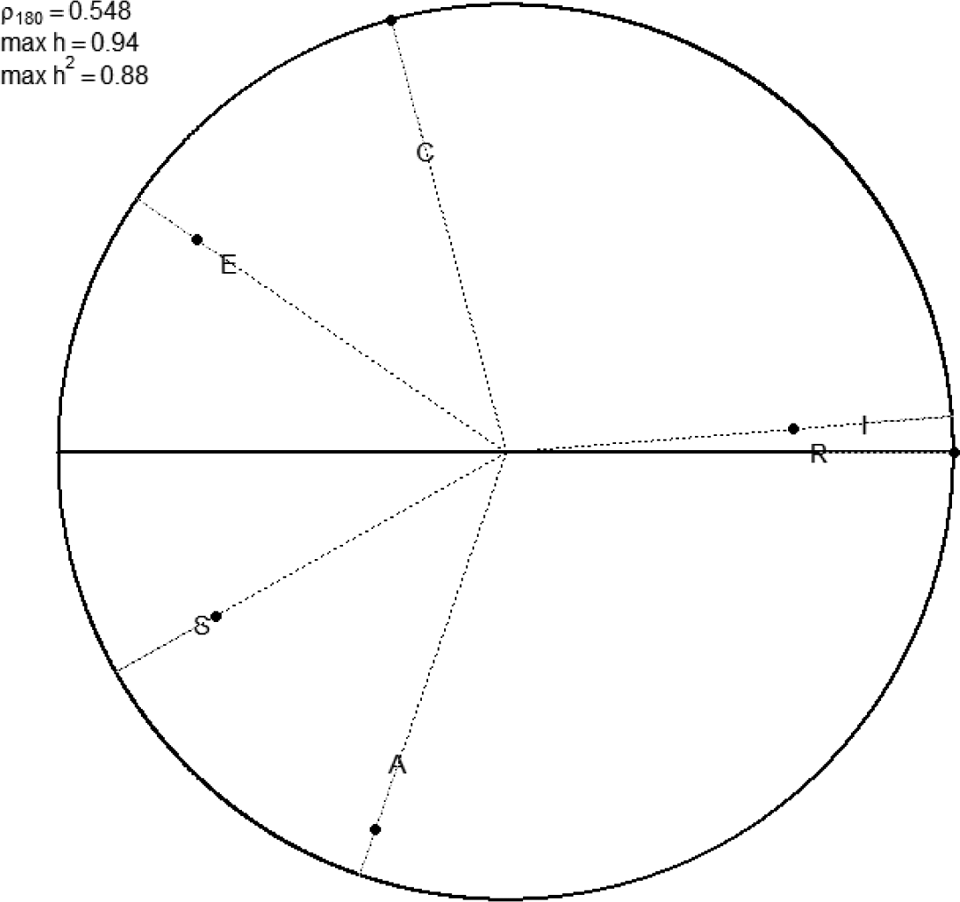
Angular locations for the Eastern region.
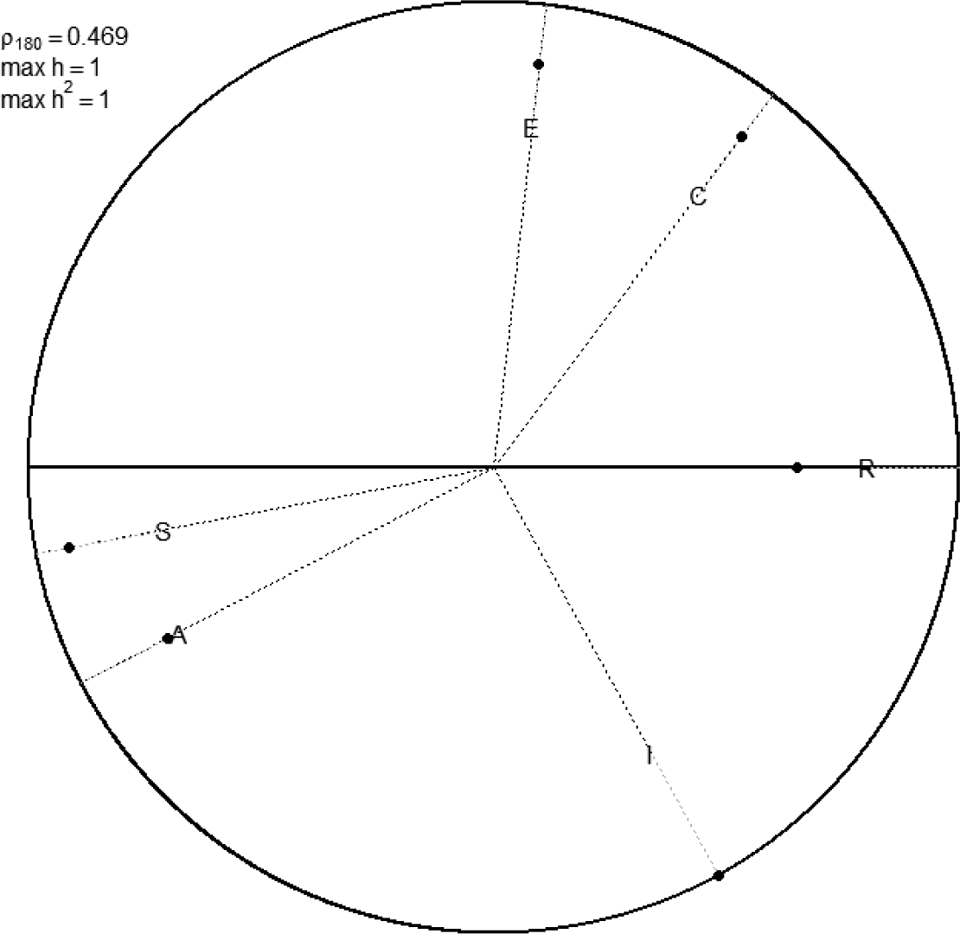
Angular locations for the Southern region.
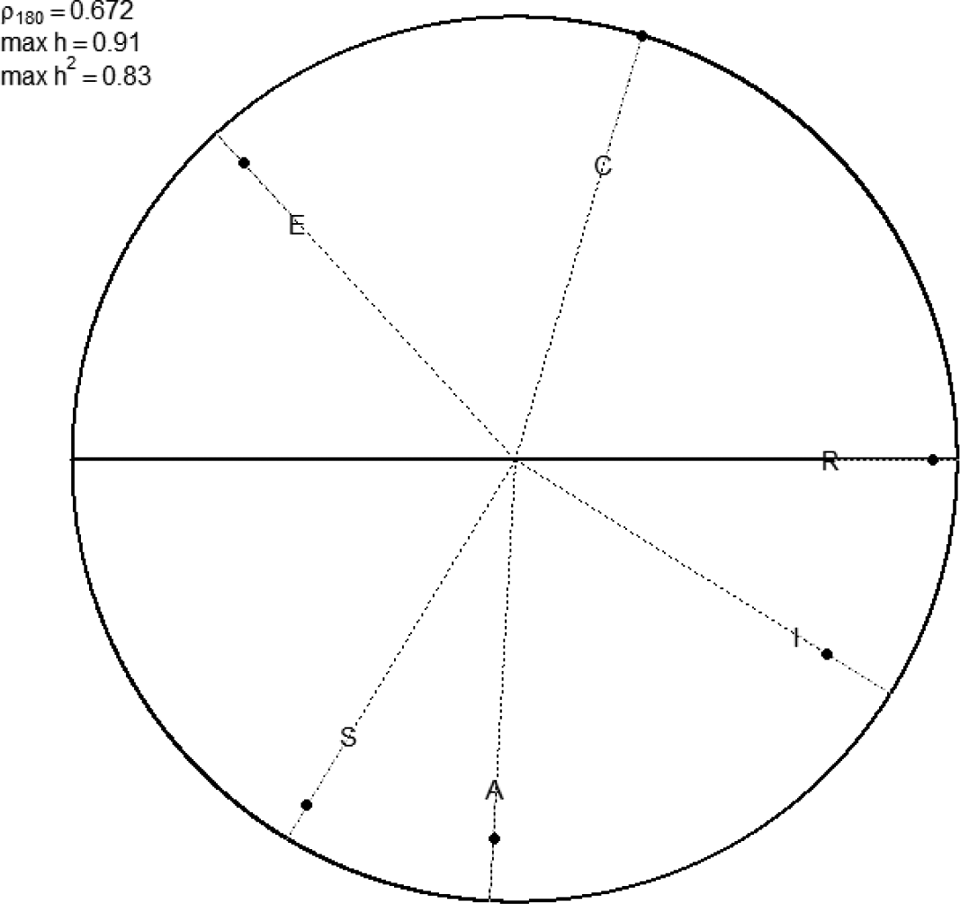
Angular locations for the Western region.
The estimated angular locations revealed disordering between the types for the Eastern African region (RASECI) with the Investigative type falling between the Realistic and Conventional types (see Figure 1), rather than between the Realistic and Artistic types. However, the Investigative type only had a 5° separation from the Realistic type and therefore did not appear to form a distinctive type from the Realistic type. For the Southern and Western African regions, the correct circular ordering was observed (RIASEC; Table 5).
CCSM Parameter Estimates Across the Three African Regions.
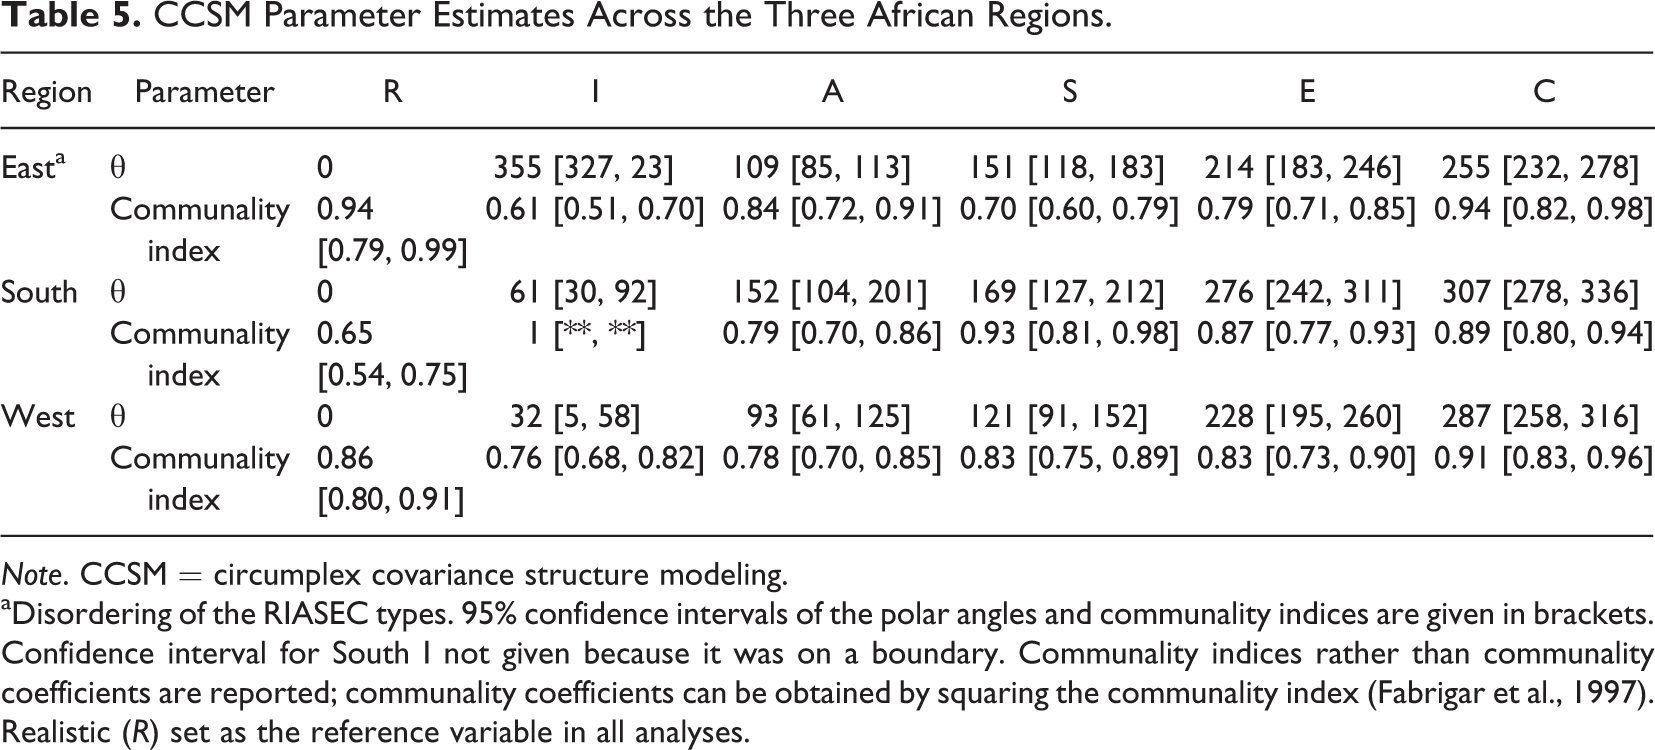
Note. CCSM = circumplex covariance structure modeling.
aDisordering of the RIASEC types. 95% confidence intervals of the polar angles and communality indices are given in brackets. Confidence interval for South I not given because it was on a boundary. Communality indices rather than communality coefficients are reported; communality coefficients can be obtained by squaring the communality index (Fabrigar et al., 1997). Realistic (R) set as the reference variable in all analyses.
Discussion
This study investigated the construct (structural) validity of Holland’s model of vocational personality types in Africa. It is one of the first studies to explicitly examine the cross-cultural transportability of Holland’s model across several different African countries. This investigation is important because it sheds light on the generalizability and suitability of Holland’s model in Africa and the appropriateness of interventions and predictions based on his model (Leong & Pearce, 2011, 2014; Gupta et al., 2008). Investigating the cross-cultural validity of Holland’s model in Africa is also an initial step toward developing a culturally appropriate and sensitive career psychology on the continent by investigating the universality or cultural specificity of the structure of vocational interests (see Cheung et al., 2011).
The randomization test and circumplex covariance structure modeling were used to investigate the fit of Holland’s model, as operationalized by SII’s GOT, in the African context. As a whole, results provided mixed evidence in support of the validity of Holland’s model across 28 different countries, which were divided into three regions. This provides some evidence for the universality of Holland’s model and the cross-cultural transportability of Holland’s model outside the U.S. context but also highlighted some discrepancies between model predictions and observed data. In the following sections, we elaborate on the aforementioned by discussing the results of the randomization test and circumplex covariance structure modeling.
The randomization test for the three African regions found evidence for circular structure in the data (i.e., all p values < .05). Correspondence indices show that the fit of the RIASEC model in the Southern African region was as good as the U.S. benchmark reported by Rounds and Tracey (1996), but the fit of the Eastern and Western African regions was lower than this benchmark. The CI values were, however, all larger than the non-U.S. average of .48 obtained by Rounds and Tracey (1996). Comparison with previous South African studies shows that the observed fit across the three regions was better than that reported by du Toit and de Bruin (2002) but weaker than the fit reported by Morgan (2015) and Morgan et al. (2015a, 2015b). Whereas the results indicate weaker fit for the Eastern and Western regions, it should be noted that at least 80% of the RIASEC order predictions were met in these two regions.
The circumplex covariance structure modeling results indicated that the loose circular ordering (unconstrained) model demonstrated the best fit of the competing models across the three regions. Circumplex covariance structure modeling yielded evidence of satisfactory fit of an unconstrained circular ordering model of the RIASEC vocational personality types in the Southern and Western region, but marginally unsatisfactory fit in the Eastern region. Without further research, it is difficult to pinpoint the reasons for differences in fit across the regions. We note that without replication, it is not clear whether the observed differences might hold up in subsequent studies. We speculate, however, that cultural and contextual variables (e.g., independence vs. interdependence, structure of the economy and the labor market, and freedom of individual expression in choices) might prove useful in explaining differences in the structure of interests across different contexts (Einarsdóttir et al., 2010; Hansen et al., 2000; Rounds & Tracey, 1996; Tracey & Gupta, 2008).
Recommendations and Limitations
This study represents a first step toward investigating the appropriateness of Holland’s model in the African context. In summary, the results hold promise for the cross-cultural transportability of Holland’s model in Africa. This implies that practitioners and researchers may potentially tap into the wealth of practical and theoretical knowledge that has accumulated about Holland’s model and that there may be merit in continuing work in validating and building interest inventories that operationalize Holland’s vocational personality types in Africa.
This study is not, however, without limitations. First, the countries included in this study are not representative of the entire African continent. The countries were also somewhat arbitrarily grouped according to geographical proximity in order to produce sample sizes that facilitated data analysis. A second limitation is that little is known about the demographic particulars (e.g., educational level, home language, and socioeconomic status) of respondents. Despite these obvious limitations, the results potentially provide a useful starting point for further research that may focus more explicitly on specific African countries or cultures.
A third limitation is that the results cannot be divorced from the instrument that was used to obtain the data. It is possible that the content of some items from the SII may not be applicable to the cultural and labor contexts and economic conditions of the countries that were included in the study. An interest inventory that contains items tailored specifically for local conditions might produce better fit to Holland’s model. Future research in African countries could therefore consider developing RIASEC inventories that incorporate local rather than imported item content (e.g., Morgan et al., 2015a).
Conclusion
This study set out to investigate the construct (structural) validity of Holland’s circumplex model across three African regions. It is one of the first studies to investigate the fit of Holland’s model of vocational personality types across several different countries in Africa. The results indicated some support for the cross-cultural transportability of Holland’s model across three regions in Africa, which implies that there is potential in fruitfully applying Holland’s model for career guidance and counseling in the African continent. However, more research on the structural validity of Holland's model in African contexts is required before any definite conclusions can be drawn about the cross-cultural transportability of the model to these contexts.
Footnotes
Authors’ Note
The authors are indebted to T.J.G. Tracey, M. Browne, M. Grassi, J. Rounds, and B.M. Wiernik for assistance with techniques used to analyze circumplex models.
Acknowledgments
We also thank M. Morris and two anonymous reviewers for their thoughtful comments on earlier drafts of the manuscript and CPP, Inc. for kindly providing the data for this study.
Declaration of Conflicting Interests
The author(s) declared the following potential conflicts of interest with respect to the research, authorship, and/or publication of this article: Brandon Morgan is affiliated with JvR Psychometrics who is the distributor of the SII in South Africa.
Funding
The author(s) received no financial support for the research, authorship, and/or publication of this article.