
Abstract
The Career Indecision Profile-65 (CIP-65) is a relatively new measure of career indecision that appears to have promise for use in career counseling and research. We sought to expand the information available to those evaluating the CIP-65 for potential use by assessing its measurement equivalence in college (N = 529) and noncollege (N = 472) samples and its scores’ test–retest reliability in a subset of the college–student sample (n = 107). Six-week test–retest reliability coefficients ranged from .58 (interpersonal conflicts) to .85 (choice/commitment anxiety) for the subscale scores. Confirmatory factor analyses revealed that the CIP-65’s four-factor structure fit the data well in both the college and noncollege samples. The CIP-65 scores were configurally invariant in the two samples, but we did not find support for metric invariance. We offer explanations for these findings, discuss implications for practice, and present ideas for future research.
Refining one’s vocational identity and making career decisions are typical developmental tasks of late adolescence and early adulthood (Super, 1980). Nevertheless, career decision-making is often difficult (Gati, Krausz, & Osipow, 1996; Germeijs & De Boeck, 2003), and career indecision—“the inability to specify an educational or occupational choice” (Kelly & Lee, 2002, p. 322)—is a common presenting concern among clients at university counseling centers (Cairns, Massfeller, & Deeth, 2010; Lucas & Berkel, 2005) and adults at outpatient clinics (Goodman & Savage, 1999; Leung, 2002).
A recently developed instrument—the Career Indecision Profile-65 (CIP-65; Hacker, Carr, Abrams, & Brown, 2013)—appears promising for identifying clients’ sources of career indecision, but because the measure is relatively new, much is still unknown about its scores’ psychometric properties. In particular, we lack information about test–retest reliability, which limits the degree to which the CIP-65 can be useful as a means of tracking clients’ gains in counseling. In addition, the CIP-65’s suitability for use with noncollege young adults is uncertain, as thus far it has been used exclusively with school-based samples. Measurement equivalence analyses are needed to reveal whether the CIP items are interpreted in a conceptually similar manner by young adults who are and are not in college. The purpose of this study was to extend the available psychometric information by assessing the CIP-65 scores’ test–retest reliability and examining measurement equivalence in college and noncollege samples.
CIP-65 Background
For several decades, researchers have attempted to elucidate the factors that underlie career indecision because dissecting these sources would allow counselors to tailor therapeutic approaches to a client’s needs. There is consensus that career indecision is a complex, multidimensional construct (Kelly & Lee, 2002), and several theoretically derived models of career indecision exist (e.g., Chartrand, Robbins, Morrill, & Boggs, 1990; Gati et al., 1996; Germeijs & De Boeck, 2003). All of these models include an information-deficit component (about the self, the world of work, or both), but beyond that common feature, they differ considerably with respect to the number and type of factors they encompass (Brown et al., 2012). For example, the Chartrand et al. model posits four career indecision factors that include information deficits about the self and the world of work, a generalized indecisiveness factor, and a factor-reflecting anxiety about career decision-making. The Gati, Krausz, and Osipow (1996) model encompasses 10 factors that reflect various information deficits as well as dysfunctional beliefs, motivational factors, and trait-like indecisiveness. The Germeis and De Bock (2003) model has three factors that include insufficient information about career options and uncertainty about one’s values and uncertainty about the outcomes of various career options. Kelly and Lee (2002) speculated that a lack of cohesion and consistency in the career-indecision literature contributed to a decline in research on the topic and limited the degree to which counselors could draw from the literature to guide their work with clients.
In an attempt to reignite interest and stimulate new research on the career-indecision construct, Brown and Rector (2008) reviewed the extant literature and identified more than 50 factors that correlate with career indecision. They submitted 28 correlation matrices from the prior literature to meta-analytic factor analyses that suggested four latent career-indecision factors. Brown et al. (2012) then validated and refined the model through additional factor analyses with primary and secondary data. Their final four-factor model consists of neuroticism/negative affectivity, choice/commitment anxiety, lack of readiness, and interpersonal conflicts. Neuroticism/negative affectivity reflects general (i.e., not specific to career decision-making) state and trait anxiety, perceived vulnerability, depressive affect, trait neuroticism, and a tendency to focus on what might go wrong with career decisions; choice/commitment anxiety is characterized by difficulty committing to a career decision and a lack of information about the self and the world of work; lack of readiness is marked by a lack of planfulness, low goal directedness, and low self-efficacy; finally, interpersonal conflicts is defined by disagreements with others regarding career choice and/or a perception that information about careers obtained from others is unreliable. Because these factors were derived from a comprehensive search of the variables that had previously been found to be related to career indecision and were extracted using a data-driven approach, there is hope that they represent a meaningful, more stable taxonomy than previous career-indecision models (Brown et al., 2012; Xu & Tracey, 2017).
Brown and colleagues (2012) created a new measure—the CIP—using items from other instruments that loaded saliently on one of the four factors in the Brown and Rector (2008) meta-analysis. Because the original CIP’s 167-item length might be a deterrent in research and counseling settings, Hacker, Carr, Abrams, and Brown (2013) later created the shorter CIP-65 using the items that loaded most strongly on their respective factors. The shorter measure has the same factor structure as that of the original CIP (Hacker et al., 2013).
Test–Retest Reliability
Gathering information about the CIP-65 scores’ test–retest reliability would be useful because it would allow career counselors to compare clients’ pre and postintervention scores to fluctuations that can be expected naturally. Without such information, it is difficult to determine whether any improvements seen in counseling can be attributed to the intervention itself.
Exactly how much stability in career indecision we should expect from one point in time to the next is unclear. Career indecision is at least a somewhat stable construct; if the problem were fleeting and consistently addressed on its own, clients would not feel the need to seek assistance. At the same time, we can expect an individual’s level of career indecision to increase or decrease to some degree with new information or life events. Finding that a career one had in mind has a poor outlook according to the most recent survey reported in the news may increase one’s career indecision, whereas newfound support for one’s educational or career plans from another person may help to decrease career indecision. Because of these natural fluctuations, it has been suggested that career indecision is at least somewhat inherently unstable and that moderate test–retest reliability coefficients would accurately reflect this instability (Hartman, Fuqua, & Jenkins, 1986; Hartman, Utz, & Farnum, 1979).
Consistent with the conceptualization of career indecision as a construct with some inherent instability, other career-indecision measures tend to produce scores with test–retest coefficients that range in strength but are typically of moderate-to-strong magnitude. Reasonably strong (e.g., .82 to .90; Osipow, 1980), test–retest coefficients have been obtained with short (e.g., 2-week) retest intervals, whereas more moderate coefficients (e.g., .63 to .70; Chartrand & Robbins, 1997; Osipow, 1980) have been found with longer (e.g., 6-week to 3-month) intervals. Based on these findings from other career-indecision measures, we expected to find modest (i.e., .50 to .70) test–retest reliability coefficients for the CIP-65’s scores when assessed with a 6-week interval among college students. We chose a 6-week retest period because we believed it would provide sufficient time for new information or life events to arise which might affect participants’ level of career indecision while still occurring within the same academic semester, so that the overall context for career decision-making would remain constant.
Although we expected modest test–retest stability for the CIP-65 scores overall, we did expect some variability in the strength of the subscale scores’ test–retest coefficients, as dimensions of career indecision have been shown to differ in stability (Jaensch, Hirschi, & Freund, 2015). Because of the inherent stability of trait neuroticism (Cobb-Clark & Schurer, 2012), we expected the CIP-65’s neuroticism/negative affectivity subscale score to have the highest test–retest reliability coefficient. On the other hand, career-relevant information can easily be obtained in a short amount of time. Because several lack-of-information items load on the CIP-65’s choice/commitment anxiety factor, we expected this factor’s scores would have lower stability. Additionally, in previous research (Nauta, 2012), the stability of a career-indecision factor reflecting disagreements with others was considerably lower than that of other career-indecision factors, so we expected that the CIP-65 interpersonal conflicts factor, which reflects such disagreements, might also have more modest test–retest stability.
College and Noncollege Equivalence
Another aspect of the CIP-65 for which information is needed has to do with its potential use with clients or research participants who are demographically different from the participants in the original scale-development sample. Tests of measurement equivalence yield information about whether an instrument measures the same constructs in the same way among members of different groups, which is an important assumption if one wishes to compare mean differences between groups or use norms from one sample as a comparison for a client from a different group. Configural invariance exists when a measure has the same factors in two or more groups (Vandenberg & Lance, 2000). Metric invariance assesses whether there are equal factor loadings across groups, which would suggest the measure’s items are interpreted similarly by the members of the groups (Byrne, Shavelson, & Muthen, 1989). Finally, scalar invariance exists when people from different groups who have the same mean score on a factor respond similarly to its items (Vandenberg & Lance, 2000). Measurement equivalence is determined in a stepwise manner; if configural invariance is established, then metric invariance introduces additional equality constraints. If there is metric invariance, then the most stringent form of equivalence—scalar invariance—is tested. If a less stringent form of invariance is not supported, the data would be unlikely to support more stringent models, so invariance tests typically stop at the earliest step in which a measure is found to vary across groups (Vandenberg & Lance, 2000).
The CIP-65 was created based on data from a U.S. college-student sample. Since then, this original sample has been used as a comparison in multiple-group confirmatory factor analyses (CFAs) with several international samples. Abrams et al. (2013) found support for configural invariance with a sample of high school and college students from Iceland, but metric invariance was not supported, suggesting that some of the factors hold different meanings for individuals in the two countries. Carr and colleagues (2013) compared the original U.S. sample to (mostly college-student) French-speaking young adults in Switzerland and France as well as to an Italian high school sample. Among those groups, configural and metric invariance were largely supported, but scalar invariance was not supported. Finally, when Abrams, Lee, Brown, and Carr (2015) conducted equivalence tests between the original U.S. sample and a sample of high school students from South Korea, they did not find evidence for measurement invariance; instead, a five-factor model appeared to fit the data better among that sample. Collectively, the cross-national equivalence findings suggest the CIP-65 may operate similarly—at least in terms of factor structure—among people from different Western nations, although the meaning of the factors may vary to some degree by culture. The Abrams et al. (2015) study raises the possibility that its factor structure may differ among people from non-Western nations. To date, the South Korean sample of Abrams et al. (2015) has been the only one not to consist either entirely or mostly of college students. Thus, it is unclear whether the CIP-65 has measurement equivalence with nonstudent samples.
Once an ever-increasing trend, college enrollment peaked at 70% in 2009 before falling each of next 4 years (U.S. Department of Labor, Bureau of Labor Statistics, 2014). Currently, about a third of high school graduates do not enter college, and still more students do not finish a degree. Sometimes deemed the forgotten half, young adults who do not pursue college are an understudied population (Blustein et al., 2002). Unemployment rates for noncollege young adults are higher than those of degree-holding young adults, and noncollege young adults are more likely than those with college degrees to be working in jobs that they view as “stepping stones” rather than careers that reflect their identities (Pew Research Center, 2016). The CIP-65 might be useful as a tool for helping to identify career decision-making difficulties with this population because the content of its items does not assume that the respondent is in school or holds a degree, but to date, the CIP-65 has not been administered to nonschool-based samples.
In a commentary on psychology’s dependence on undergraduates for research, Sears (1986) posited that although college students look much like the general adult population, important differences may exist. College students tend to have more identity confusion, less crystallized attitudes, more feelings of insecurity, and more egocentric attitudes than do young adults who are not in college (Sears, 1986). College students also tend to have greater cognitive skills and more unstable peer relationships than their noncollege counterparts (Henry, 2006). With respect to career development in particular, Pascarella and Terenzini (2005) found that college attendance is associated with lower job satisfaction, possibly by way of raised expectations about the workplace.
Given these known differences between young adults attending and not attending college, it stands to reason that members of the two groups may be in fundamentally different positions with respect to career decision-making. Those not in college may have less access to career-relevant information, may perceive that they have less time to make career decisions, and will have fewer available career options than college students. Their more stable peer relations may also result in fewer fluctuations related to perceived support for career decision-making. These differences, among others, could impact how college students and their noncollege counterparts experience career indecision and result in measurement variance between these two groups on a measure of career indecision such as the CIP-65. On the other hand, Multon, Wood, Heppner, and Gysbers (2007) found that clusters of career-undecided individuals did not differ based on employment status or education level, so it cannot be taken as a given that college and noncollege samples will differ in terms of their interpretation of and responses to the CIP-65 items.
We examined the CIP-65’s measurement equivalence in college and noncollege young adult samples. The previous findings (Abrams et al., 2013; Abrams et al., 2015; Carr et al., 2013) of configural invariance in several Western samples led us to expect the factor structure of the CIP-65 would be invariant in the college and noncollege samples. On the other hand, differences between college and noncollege young adults with respect to access to resources and a variety of career options led us to speculate that we may not obtain support for the more stringent forms of measurement equivalence.
Method
Participants and Procedure
We collected data via an online survey from two samples: (a) college students at a large Midwestern university and (b) noncollege, nondegree-holding young adults from the Amazon Mechanical Turk (MTurk) online crowdsourcing marketplace. In this study, we specified the MTurk listing to be displayed only to MTurk workers with IP addresses in the United States to avoid the potentially confounding factor of country of residence. We also limited participation to MTurk workers aged 30 and under to keep the developmental level similar to that of the college students. Finally, we collected data from the college and MTurk samples simultaneously to minimize the risk that time of year would be a confound.
The college students participated in the study as a means of earning extra course credit in a psychology class, whereas we paid the MTurk workers US$0.20 in compensation. MTurk workers tend to be internally (e.g., complete surveys for enjoyment) rather than externally motivated (Buhrmester, Kwang, & Gosling, 2011; Paolacci & Chandler, 2014), and research suggests MTurk data quality is not affected by compensation amount (Buhrmester et al., 2011). Thus, although the college-student and MTurk participants received different forms of compensation, we believe it is fairly unlikely that this would have yielded differences in data quality. Moreover, studies comparing MTurk participants with college subject pool participants have revealed that data quality (e.g., passing attention checks) is comparable (Goodman, Cryder, & Cheema, 2013; Hauser & Schwartz, 2015; Kees, Berry, Burton, & Sheehan, 2017).
The online participant sign-up system we used to recruit the college-student participants logs user identifications, so instructors can grant course credit. We used those identifications to invite a subset of the college students to complete the survey again 6 weeks later so we could examine the CIP-65 scores’ test–retest reliability. We collected the retest data from only a portion of the college-student sample (we stopped issuing retest survey invitations after receiving approximately 100 responses) because a power analysis revealed that a sample size of 85 would be sufficient for detecting correlations with a medium or large effect size (Cohen, 1992), which we anticipated based on the retest correlations of career indecision factors in prior studies (Chartrand & Robbins, 1997; Osipow, 1980). Additionally, the data were collected over the course of several weeks, and if we had continued to collect retest data from additional participants, the 6-week retest interval for the remaining participants would have spanned two semesters, introducing a potential confound. Ideally, we would have collected retest data from the MTurk workers as well, but we were unable to do so because we did not have a way to contact the MTurk workers to issue follow-up invitations.
College sample
The college students, who were enrolled in a wide variety of majors, accessed the study’s online survey via a research-participation sign-up system. Five hundred forty-six participants accessed the survey, but after removing cases with 5% (k = 4) or more missing CIP-65 items as in Hacker et al. (2013), 529 had usable data.
The 529 college-student participants ranged in age from 18 to 28 years (M = 19.19, SD = 1.45). The majority identified as female (81%) and White/European American (81%). Smaller proportions identified themselves as Black/African American (8%), Hispanic/Latino(a) (7%), multiracial (2%), Asian/Asian American (1%), and native American (1%). Participants’ self-reported average career decidedness (M = 4.92, SD = 1.28) was between slightly decided (4) and moderately decided (5) on a 6-point Likert-type scale. In terms of class standing, 45% were freshman, 23% were sophomores, 20% were juniors, and 11% were seniors.
One hundred seven of the college students (20% of those with usable Time 1 data) completed the online survey a second time and comprised the Time-2 subsample used for the test–retest analyses. Those in the Time-2 subsample were more likely to be female, χ2 (1, N = 525) = 4.44, p = .04, to have self-identified as being White/European American (non-White/European American categories were collapsed to meet minimum cell size frequencies), χ2 (1, N = 525) = 6.41, p = .01, and were more advanced in school, χ2 (1, N = 528) = 13.81, p = .01, than the participants who only took the survey once. However, there was no difference in average career decidedness, (M = 4.88, SD = 1.31 and M = 5.04, SD = 1.24 in the Time-1-only and Time-2 samples, respectively), t(528) = 1.13, p = .26, between participants for whom Time-2 data were and were not obtained.
Noncollege sample
We obtained survey responses from 678 eligible MTurk workers, but after removing participants with duplicate responses (i.e., multiple cases with the same IP address and identical demographics) and cases with 5% (k = 4) or more missing CIP-65 items, 472 participants had usable data. These noncollege (i.e., nondegree holding and not enrolled half-time or more in college) participants ranged in age from 18 to 30 years (M = 25.58, SD = 3.18). More than half (57%) identified themselves as female and 42% identified as male. The majority (72%) were White/European American; other participants described themselves as Black/African American (9%), Asian/Asian American (5%), Hispanic/Latino/a (8%), multiracial (3%), and native American (1%). Participants’ average self-reported career decidedness (M = 3.44, SD = 1.60) was between slightly undecided (3) and slightly decided (4) on a 6-point Likert-type scale.
Comparison of the college and noncollege samples’ demographics
Although we took steps to keep the college and noncollege samples as similar as possible in terms of age and country of origin, there were several differences. The college-student sample (M = 19.19, SD = 1.45) was younger, t(616.93) = 37.94, p < .001, d = 2.59, consisted of significantly more women, χ2(1, N = 990) = 74.90, p < .001, and was more career decided, t(895.59) = 16.03, p < .001, d = 1.02, than were the noncollege participants.
Measures
Demographic items
Participants reported their gender, age, race/ethnicity, college or nonstudent status, year in school (if applicable), major (if applicable), and level of career decidedness (1 = very undecided; 6 = very decided).
Attention-check items
In accordance with recommendations by Goodman, Cryder, and Cheema (2013), we embedded two screening questions (e.g., “I have never used the Internet.”) within the online survey and did not use data from the 6.4% of participants whose responses to one or both questions suggested the possibility of random responding.
CIP-65
Participants responded to all of the CIP-65 items (Hacker et al., 2013). Respondents indicate their degree of agreement on a 1 (strongly disagree) to 6 (strongly agree) scale to items that reflect its four subscales, with higher scores reflecting greater career indecision after the lack of readiness subscale items are reversed. In previous research with college students, the CIP-65 scores’ Cronbach’s α estimates have ranged from .88 (choice/commitment anxiety) to .96 (choice/commitment anxiety; Hacker et al., 2013). In the current study, internal consistency estimates for all four CIP-65 subscales were high in both the college and noncollege samples (see Table 1). The CIP-65 scores’ validity is supported by the finding that scores from three of the four subscales (with the interpersonal conflicts subscale being the exception) discriminate between students taking a career-planning course and students not enrolled in such a course and the finding that all four subscale scores correlate negatively with self-reported levels of career decidedness (Hacker et al., 2013).
Means, Standard Deviations, Cronbach’s α, and Correlations Among Career Indecision Profile-65 Factor Scores for College and Noncollege Samples.
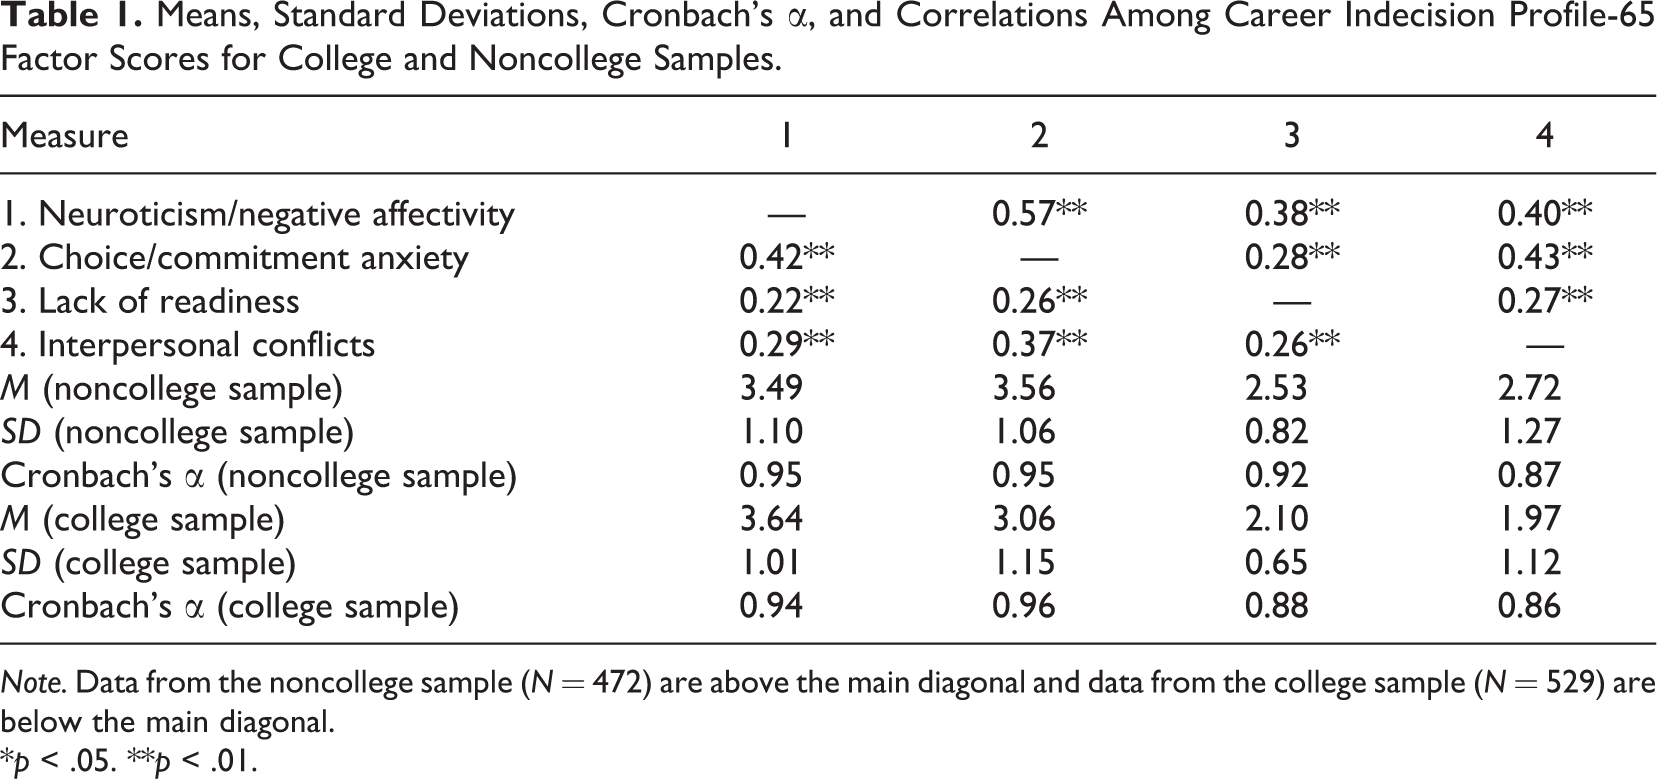
Note. Data from the noncollege sample (N = 472) are above the main diagonal and data from the college sample (N = 529) are below the main diagonal.
*p < .05. **p < .01.
Results
Means, standard deviations, and correlations among the CIP-65 factor scores for the college and noncollege samples are shown in Table 1. All factor scores were significantly positively correlated with one another in both samples. Z-tests revealed that neuroticism/negative affectivity scores correlated more strongly with scores on the choice/commitment anxiety (z = 3.15, p = .002), lack of readiness (z = 2.78, p = .005), and interpersonal conflicts (z = 1.97, p = .049) factors in the noncollege sample than in the college sample. Participants in the college sample had higher average scores on the neuroticism/negative affectivity factor, t(960.94) = 2.23, p = .026, d = .14, than did the noncollege participants, whereas the noncollege participants had higher scores on the choice/commitment anxiety factor, t(997.36) = 7.25, p = .003, d = .45, the lack of readiness factor, t(896.74) = 9.22, p < .001, d = .58, and the interpersonal conflicts factor, t(946.09) = 9.91, p < .001, d = .63.
Test–Retest Reliability Analyses
Among the 107 college-student participants who took the CIP-65 twice, the 6-week test–retest correlations (Pearson’s r) for scores from all four CIP-65 factors were of moderate magnitude or higher, in line with Hypothesis 1. Contrary to our expectation that the neuroticism/negative affectivity scores would have the highest degree of stability, however, our findings revealed that the choice/commitment anxiety scores had the highest test–retest reliability coefficient (r = .85), followed by neuroticism/negative affectivity (r = .79), lack of readiness (r = .78), and interpersonal conflicts (r = .58; all ps < .01).
Measurement Equivalence Analyses
Overview of equivalence analyses
We conducted single-group CFAs using LISREL 8.80 (Jöreskog & Sörbom, 2006) with both the college and noncollege samples independently to assess model fit. A multigroup CFA then compared the factor structure of the CIP-65 across the college and noncollege samples. Maximum likelihood estimation using covariance matrices was used in all models. To be consistent with previous CFAs of the CIP-65 (e.g., Hacker et al., 2013), missing data were imputed for cases with k = 3 or fewer missing CIP-65 items. Cases with k = 4 or more missing CIP-65 items were excluded from all single-group and multigroup CFAs.
We evaluated goodness-of-fit using four fit statistics, including two absolute fit indices: the root mean square error of approximation (RMSEA) and the standardized root mean square residual (SRMR), and two relative fit indices: the nonnormed fit index (NNFI) and the comparative fit index (CFI). For both absolute fit indices, smaller values indicate better model fit. For the RMSEA, MacCallum, Browne, and Sugawara (1996) suggested 0.01, 0.05, and 0.08 to indicate excellent, good, and mediocre fit, respectively, while Hu and Bentler (1999) suggest a .06 cutoff criterion. Hu and Bentler (1999) also suggest that values of .08 or less indicate adequate model fit when using the SRMR. For both relative fit indices, larger values indicate better fit. Hu and Bentler (1999) suggest that NNFI and CFI values above .95 represent good fit.
Consistent with the recommended successive-step approach of Vandenburg and Lance (2000), we first assessed configural invariance through single-group CFAs in which each sample was separately evaluated for goodness-of-fit. Upon finding evidence for configural invariance, the results were combined and used as a baseline for the more restrictive models and used to assess metric and scalar invariance. Measurement invariance was determined based on two criteria. Nested models were first compared using the χ2 difference test. In addition, changes in CFI values were examined due to sample-size sensitivity of the χ2 statistic. We followed the recommendation of Meade, Johnson, and Brady (2008) by interpreting a difference in CFI values of greater than .002 as evidence of measurement variance.
Equivalence findings
A single-group CFA with our college sample revealed that the hypothesized four-factor model of Hacker et al. (2013) fit the data well, and all reported fit indices closely matched those found by Hacker and colleagues in the original scale-development sample (2013; see Table 2). Both the NNFI and CFI exceeded the .95 recommendation. The RMSEA fell below the .08 recommendation, while the SRMR was slightly higher than .08.
Measures of Fit.
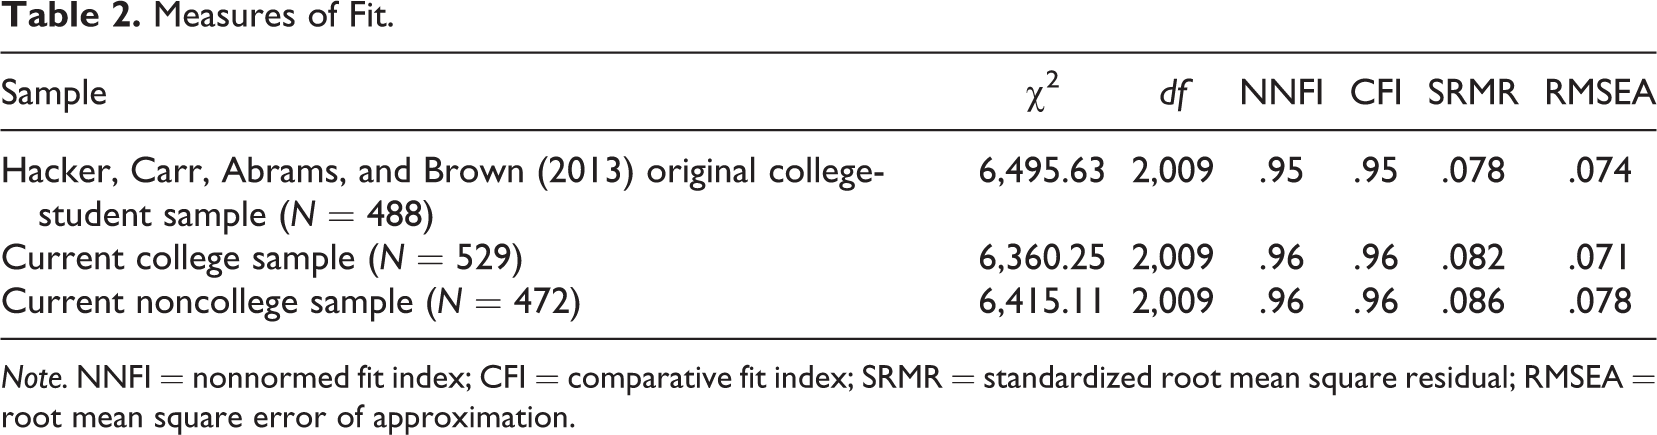
Note. NNFI = nonnormed fit index; CFI = comparative fit index; SRMR = standardized root mean square residual; RMSEA = root mean square error of approximation.
The hypothesized four-factor model also fit the data well among the noncollege sample, and fit indices closely mirrored those of the college samples (see Table 2). Again, the NNFI, CFI, and RMSEA met the criteria for good fit, but the SRMR was slightly higher than the recommended .08 cutoff criterion. Thus, with the exception of the SRMR values, the results largely supported the CIP-65’s configural invariance across college and noncollege samples. For a full list of factor loadings in both groups, see Table 3.
Within-Group Completely Standardized Loadings for the Career Indecision Profile-65 Items Across Samples.
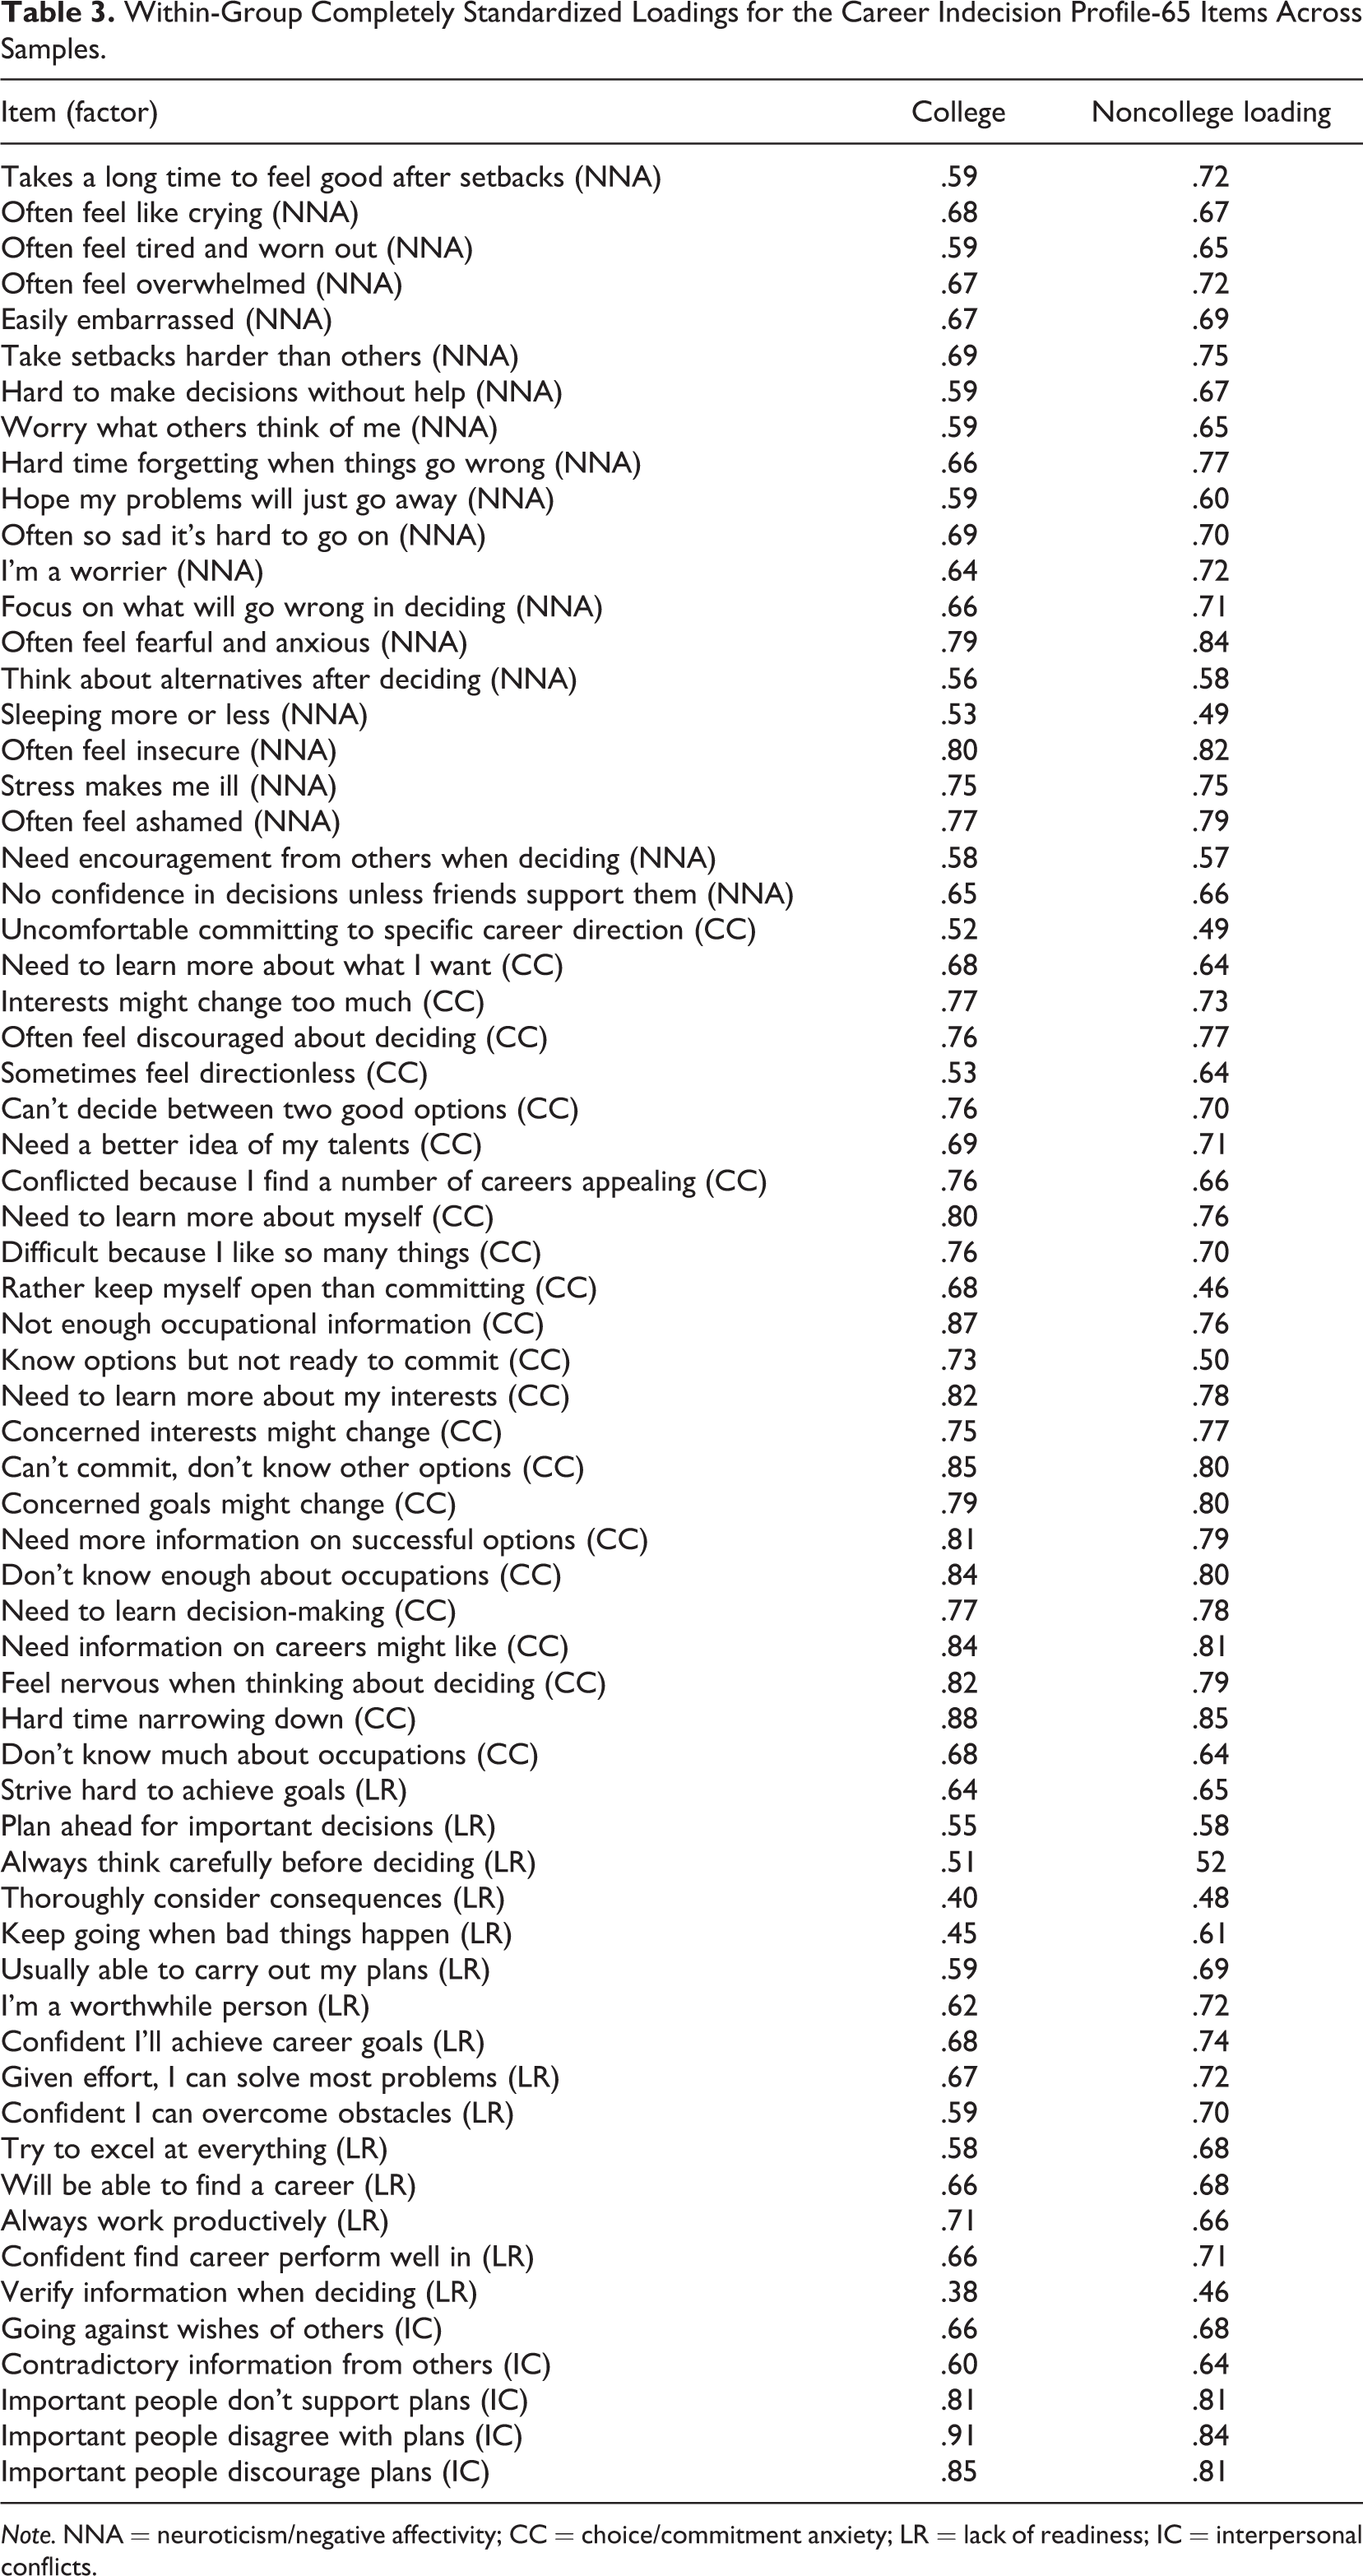
Note. NNA = neuroticism/negative affectivity; CC = choice/commitment anxiety; LR = lack of readiness; IC = interpersonal conflicts.
We next used multigroup CFA modeling to assess metric invariance. For these analyses, a baseline model (the combined college and noncollege samples with no cross-group equality constraints) was compared to models in which various factor loadings were constrained to be equal across groups. First, to conduct an omnibus test of metric invariance, all factor loadings were constrained to be equal and compared to the baseline model. As shown in Table 4, a χ2 difference test revealed that the baseline model fit the data significantly better (p < .001) than the model in which all factor loadings were constrained to be equal. The change in CFI values (ΔCFI = .017) adds further evidence to the lack of metric invariance between samples.
Results of Metric Invariance Tests Between College (N = 529) and Noncollege (N = 472) Samples.
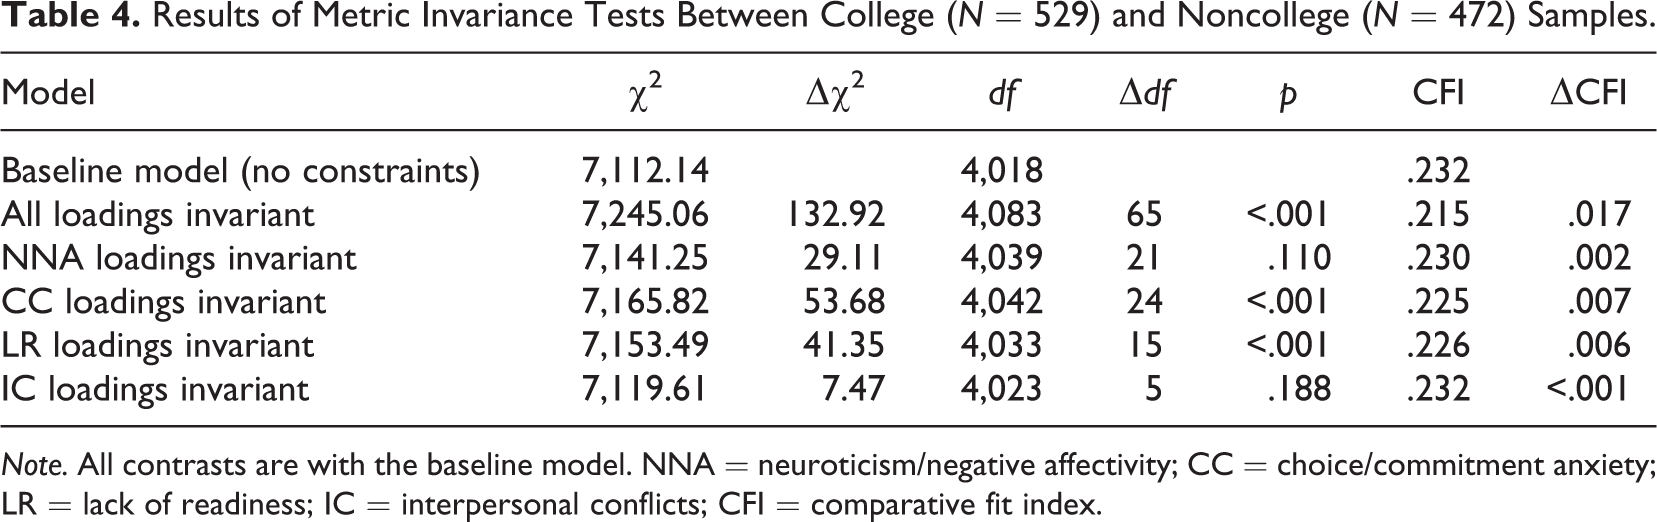
Note. All contrasts are with the baseline model. NNA = neuroticism/negative affectivity; CC = choice/commitment anxiety; LR = lack of readiness; IC = interpersonal conflicts; CFI = comparative fit index.
After finding a lack of omnibus metric invariance across the college-student and noncollege samples, we conducted further tests factor by factor to see which yielded the largest discrepancies of fit. In these four tests, loadings on one factor were constrained to be equal, while loadings were free to vary on the three remaining factors. We conducted tests of metric invariance by factor instead of by individual items due to the large number of items that compose the CIP-65. When compared with the baseline model, χ2 difference tests were significant for both the model in which choice/commitment anxiety items were constrained to be equal (p < .001) and the model in which lack of readiness items were constrained to be equal (p < .001). The changes in CFI values (ΔCFI = .007 and ΔCFI = .006, respectively) corroborate these results, as changes greater than .002 indicate a lack of metric invariance. However, metric invariance was found between the unconstrained baseline model and the remaining two models: the model in which neuroticism/negative affectivity items were constrained to be equal (p = .110) and the model in which interpersonal conflicts items were constrained to be equal (p = .188). Again, the changes in CFI values (ΔCFI = .002 and ΔCFI < .001, respectively) corroborate these tests. Despite the metric invariance found for these two factors, we did not pursue tests of scalar invariance given the lack of metric invariance in the omnibus comparison.
In sum, because the same four-factor model fit the data well in the college-student and noncollege samples, the CIP-65 can be considered configurally invariant. However, metric invariance, which is concerned with the interpretation of test items across groups, was not supported. Whereas it is true that full metric invariance is rare, and it is acceptable if a small percentage of items show a lack of metric invariance, several items in two of the four factors showed metric variance, which was enough evidence to conclude that many items are interpreted differently across groups.
Discussion
The purpose of this study was to add to the literature on the psychometric properties of scores from the CIP-65. We believed information about test–retest stability and measurement equivalence would be useful to career counselors and researchers who are interested in interpreting changes in career-indecision levels over time or who might be considering the CIP-65 for use with young adults who are not in college.
Test–Retest Stability
We had expected the 6-week test–retest reliability for the CIP-65’s scores to be moderate in strength, in line with other measures of career indecision when a somewhat lengthy retest interval is used. Among our college-student retest subsample, we found that the reliability coefficients for three of the four factors were fairly high (.78 to .85), suggesting that these CIP-65 factor scores may be a bit more stable than those of several other career-indecision instruments when assessed over a similar interval. The interpersonal conflicts factor’s 6-week test–retest correlation of .58 was more modest. Unfortunately, because we did not have a way to issue retest survey invitations to the noncollege participants, the CIP-65 scores’ test–retest stability among noncollege young adults remains unknown.
The variability in strength of the retest correlations for different factors is consistent with findings from other career-indecision measures (Jaensch et al., 2015). Our findings suggest that, at least among college students, researchers and counselors should expect considerably more fluctuation in the CIP-65’s interpersonal conflicts scores than in its other factor scores. This finding could reflect college students’ tendency to have peer relations that change over a short period of time (Henry, 2006), or it may reflect the nature of career decision-difficulties stemming from interpersonal discord. Perhaps college students’ disagreements with others about their career choices wax and wane as they ponder different choices, make those considerations known to others, and make decisions regarding course enrollments and majors. At any rate, the lower stability of this factor aligns with previous research (Nauta, 2012) that revealed low stability for a career-indecision factor reflecting disagreements with others. There now seems to be fairly convincing evidence, at least among college-student samples, that an interpersonal component of career indecision is among its least stable aspects.
We had expected the choice/commitment anxiety factor scores to have fairly low test–retest stability due to a number of lack-of-information items that load on this factor, coupled with the ease with which new information can be obtained. The test–retest data did not support this hypothesis; in fact, the choice/commitment anxiety scores had the highest stability of all four CIP-65 factors. We note that although several lack-of-information items do load on this factor, several of its other items revolve around trait-like commitment issues such as being concerned that one’s goals or interests might change. It appears this factor therefore reflects a potentially more chronic form of indecision than simply having inadequate information. In fact, this factor’s test–retest stability was comparable to that of the neuroticism/negative affectivity factor, which reflects trait negative affect. Conceptually, therefore, the CIP-65’s choice/commitment anxiety factor might in part represent a form of career indecision that is more generalized indecisiveness (Chartrand et al., 1990; Fuqua & Hartman, 1983) than transient indecision.
Measurement Equivalence
We found support for the CIP-65’s configural equivalence across college and noncollege samples. This finding implies the same four factors comprise the construct of career indecision for noncollege young adults as have been shown for college students, a result that mirrors the Multon et al. (2007) finding of nonsignificant differences in career-indecision clusters based on individuals’ educational level or employment status. However, the results of this study suggest that the CIP-65 may not be metrically invariant across college-student and noncollege samples. Specifically, it appears that this lack of metric invariance is due to several items on both the choice/commitment anxiety and lack of readiness factors.
In general, items on the choice/commitment anxiety scale had higher loadings for college students than for their noncollege-going peers. This difference is especially true for items that reflect a lack of commitment despite knowing the options and having enough information. For example, the choice/commitment anxiety items involving difficulty making a choice between two or more good options, feeling conflicted because of finding a number of careers appealing, and generally wanting to keep options open all had higher factor loadings among the college-student sample than the noncollege sample. Thus, this scale seems to be defined more by a general lack of commitment for college students, whereas for noncollege young adults, this scale may reflect more of a feeling of directionlessness due to not knowing oneself and one’s interests, something that a college experience may assuage by letting students choose their major and elective credits. The noncollege young adults also have fewer career options in general (Pew Research Center, 2016), so in contrast to the college students, their choice/commitment anxiety may stem from not feeling pulled toward any career options more so than having too many appealing options.
On the other hand, items on the lack of readiness scale showed higher loadings in the noncollege sample. Particularly, items reflecting a lack of self-confidence, use of planning skills, and persevering or overcoming obstacles in general (items on this factor were reverse-coded) loaded higher in the noncollege sample than the college sample. This finding could mean that for noncollege students, the lack of readiness factor is largely defined by a lack of self-worth, which perhaps stems from a difference in general self-efficacy between college students and their noncollege-going peers (Bandura, 1995). Among the college students, the highest lack of readiness factor loadings tended to be for items specific to career goals and decisions as opposed to general planning and perseverance. It appears college students may distinguish between career decision-making tasks and more general planning and problem-solving tasks to a greater degree than do noncollege students, and their perceived lack of readiness appears to be more strongly determined by career-specific perceptions.
In the only other study in which the CIP-65 was administered to a noncollege sample, there were also some important differences in the factor structure of the CIP-65. Namely, among Abrams et al.’s (2015) South Korean high school sample, a fifth factor labeled Need for Information emerged, and no correlation was found between choice/commitment anxiety and lack of readiness scores. Of course, the participants in Abrams and colleagues’ study differed in two important ways from the noncollege participants in the present study. First, they were from a different culture; second, they had not forgone college, they had simply not had a chance to choose whether or not to attend college yet. Further research will be needed to determine whether the lack of configural equivalence in the Abrams et al. (2015) study is attributed to the non-Western sample, the younger age of the participants, or both.
Implications for Practice
The test–retest coefficients yielded by this study help inform career counselors as to which CIP-65 factors are likely to remain stable over a 6-week period and which are more likely to fluctuate. If practitioners use the CIP-65 to monitor treatment progress, these test–retest correlations are useful baseline data. If an intervention is to be considered effective, clients’ pre and postintervention scores on the CIP-65 subscales would need to be correlated to a lower degree than these test–retest coefficients.
Second, this study’s results generally add support for the use of the CIP-65 in research and practice in college-student populations, as we confirmed the factor structure obtained by Hacker et al. (2013) in the original scale-development sample with a new U.S. college-student sample. The data from the current study also suggest the CIP-65 may operate similarly in noncollege young adults in that the overall factor structure appears to be similar to that obtained with college students. However, practitioners should take into consideration the probable difference in the interpretation of items, especially in the choice/commitment anxiety and lack of readiness factors. Also, it would be prudent to use noncollege norms when interpreting the scores, as our data did not support metric invariance in the college and noncollege samples, and comparisons of their factor-score means revealed significant differences between the college and noncollege samples. Counselors may wish to be mindful that, in comparison to college-student clients, noncollege young adults may be more likely to report struggling with career indecision that involves choice commitment, lack of readiness, and interpersonal conflicts.
Limitations and Future Research Directions
Whereas this study adds information about the psychometric properties of scores from the relatively new CIP-65, it is not without limitations. First, although we tried to make the college and noncollege samples as similar as possible with respect to demographics, some notable differences remained. The noncollege sample was significantly older, and a larger percentage of women comprised the college sample. Research (Feldt, 2013; Schulenberg, Shimizu, Vondracek, & Hostetler, 1988) has revealed the factor-structure of other career-indecision measures to be gender invariant, so we think it is unlikely the differences in our college and noncollege samples are solely the result of the samples’ gender composition, but future research should seek to narrow these demographic differences to more definitively conclude that the differences observed can be attributed to the variable (college vs. noncollege) of real interest. It would also be useful to determine whether there is measurement invariance across racial/ethnic groups within college and noncollege young-adult samples, as this has not yet been investigated.
Second, our conclusions about the CIP-65 scores’ test–retest stability are based on the college-student sample only, and it will be important to determine the stability among noncollege samples to see whether the pattern of stability in retest coefficients is similar to that of the retest coefficients we obtained from the college students. Additionally, it would be useful to examine the scores’ stability over lengthier retest intervals. We found that three of the four CIP-65 factors have considerable stability over a 6-week interval, but examining the factors with a longer retest interval would shed light on whether those three factors are truly trait like.
Third, before the CIP-65 could be used widely in practice, some form of predictive validity should be established. For example, a longitudinal study using the CIP-65 to predict future joblessness or job satisfaction with one’s chosen career would be a useful endeavor. The factor structure and reliability of scores from a measure are ultimately only relevant if the scores on a measure accurately predict future behaviors or attitudes.
Finally, there is potential value in using an emic approach to career-indecision research, rather than the etic approach the present study took. Instead of testing the fit of a model and measure developed for college students in a different population, perhaps developing a new measure within a noncollege culture is warranted. By relying on the CIP-65 or any other measure developed from within a college culture, we might miss important information about career indecision in noncollege individuals.
Footnotes
Authors’ Note
This study is based on the first author’s master’s thesis, completed under the direction of the second and third authors.
Declaration of Conflicting Interests
The author(s) declared no potential conflicts of interest with respect to the research, authorship, and/or publication of this article.
Funding
The author(s) received no financial support for the research, authorship, and/or publication of this article.