Abstract

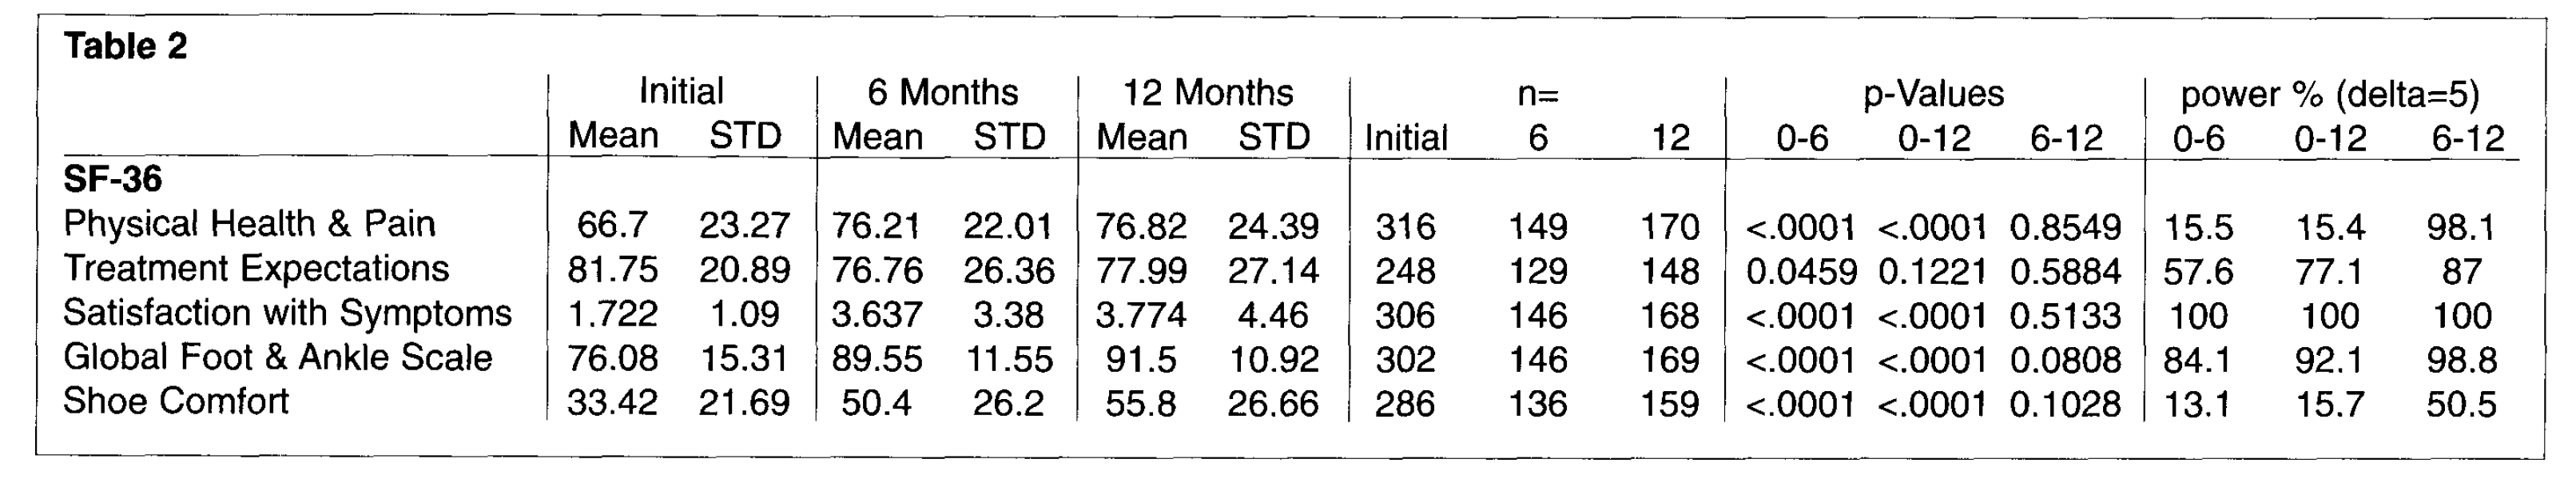
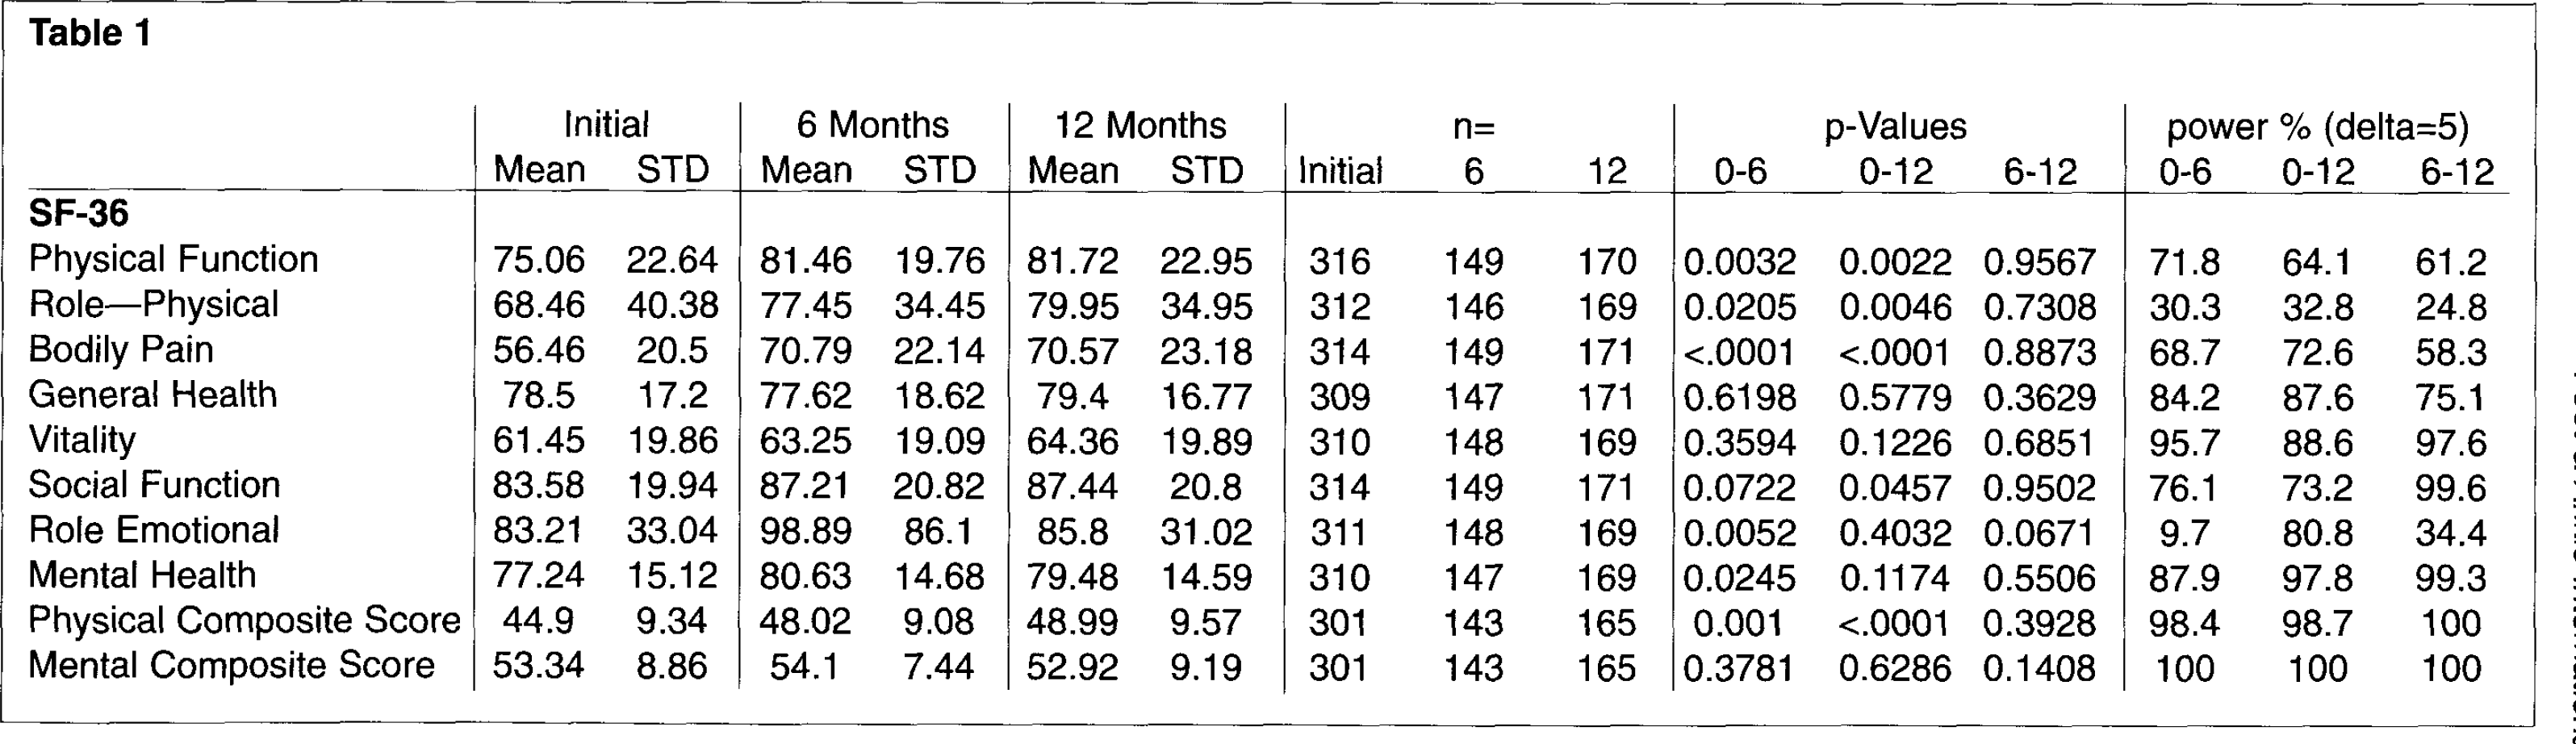
In the article “Outcome Study of Hallux Valgus Surgery: An AOFAS Multi-Center Study” (FAI 22:12, 956–959), two key tables which demonstrate the study participants' SF-36 scores were omitted. The missing tables are shown here.
| Initial | 6 Months | 12 Months | n= | p-Values | power % (delta=5) | ||||||||||
|---|---|---|---|---|---|---|---|---|---|---|---|---|---|---|---|
| Mean | STD | Mean | STD | Mean | STD | Initial | 6 | 12 | 0-6 | 0-12 | 6-12 | 0-6 | 0-12 | 6-12 | |
|
|
|||||||||||||||
| Physical Function | 75.06 | 22.64 | 81.46 | 19.76 | 81.72 | 22.95 | 316 | 149 | 170 | 0.0032 | 0.0022 | 0.9567 | 71.8 | 64.1 | 61.2 |
| Role—Physical | 68.46 | 40.38 | 77.45 | 34.45 | 79.95 | 34.95 | 312 | 146 | 169 | 0.0205 | 0.0046 | 0.7308 | 30.3 | 32.8 | 24.8 |
| Bodily Pain | 56.46 | 20.5 | 70.79 | 22.14 | 70.57 | 23.18 | 314 | 149 | 171 | <.0001 | <.0001 | 0.8873 | 68.7 | 72.6 | 58.3 |
| General Health | 78.5 | 17.2 | 77.62 | 18.62 | 79.4 | 16.77 | 309 | 147 | 171 | 0.6198 | 0.5779 | 0.3629 | 84.2 | 87.6 | 75.1 |
| Vitality | 61.45 | 19.86 | 63.25 | 19.09 | 64.36 | 19.89 | 310 | 148 | 169 | 0.3594 | 0.1226 | 0.6851 | 95.7 | 88.6 | 97.6 |
| Social Function | 83.58 | 19.94 | 87.21 | 20.82 | 87.44 | 20.8 | 314 | 149 | 171 | 0.0722 | 0.0457 | 0.9502 | 76.1 | 73.2 | 99.6 |
| Role Emotional | 83.21 | 33.04 | 98.89 | 86.1 | 85.8 | 31.02 | 311 | 148 | 169 | 0.0052 | 0.4032 | 0.0671 | 9.7 | 80.8 | 34.4 |
| Mental Health | 77.24 | 15.12 | 80.63 | 14.68 | 79.48 | 14.59 | 310 | 147 | 169 | 0.0245 | 0.1174 | 0.5506 | 87.9 | 97.8 | 99.3 |
| Physical Composite Score | 44.9 | 9.34 | 48.02 | 9.08 | 48.99 | 9.57 | 301 | 143 | 165 | 0.001 | <.0001 | 0.3928 | 98.4 | 98.7 | 100 |
| Mental Composite Score | 53.34 | 8.86 | 54.1 | 7.44 | 52.92 | 9.19 | 301 | 143 | 165 | 0.3781 | 0.6286 | 0.1408 | 100 | 100 | 100 |
| Initial | 6 Months | 12 Months | n= | p-Values | power % (delta=5) | ||||||||||
|---|---|---|---|---|---|---|---|---|---|---|---|---|---|---|---|
| Mean | STD | Mean | STD | Mean | STD | Initial | 6 | 12 | 0-6 | 0-12 | 6-12 | 0-6 | 0-12 | 6-12 | |
|
|
|||||||||||||||
| Physical Health & Pain | 66.7 | 23.27 | 76.21 | 22.01 | 76.82 | 24.39 | 316 | 149 | 170 | <.0001 | <.0001 | 0.8549 | 15.5 | 15.4 | 98.1 |
| Treatment Expectations | 81.75 | 20.89 | 76.76 | 26.36 | 77.99 | 27.14 | 248 | 129 | 148 | 0.0459 | 0.1221 | 0.5884 | 57.6 | 77.1 | 87 |
| Satisfaction with Symptoms | 1.722 | 1.09 | 3.637 | 3.38 | 3.774 | 4.46 | 306 | 146 | 168 | <.0001 | <.0001 | 0.5133 | 100 | 100 | 100 |
| Global Foot & Ankle Scale | 76.08 | 15.31 | 89.55 | 11.55 | 91.5 | 10.92 | 302 | 146 | 169 | <.0001 | <.0001 | 0.0808 | 84.1 | 92.1 | 98.8 |
| Shoe Comfort | 33.42 | 21.69 | 50.4 | 26.2 | 55.8 | 26.66 | 286 | 136 | 159 | <.0001 | <.0001 | 0.1028 | 13.1 | 15.7 | 50.5 |