
Abstract
Background: The goal of this study was to identify pressure changes throughout the peroneal groove after a groove deepening procedure. We hypothesized that pressures would decrease. Methods: Twelve fresh-frozen foot and ankle specimens were used. A thin pressure strip containing four sensor pads was secured within the peroneal groove with pads 1 through 4 positioned at the calcaneofibular ligament (CFL) and at the distal, middle, and proximal groove, respectively. The midstance phase of gait was simulated with loads applied to the plantar foot and posterior tibial tendon and to the peroneus longus and brevis tendons. Pressures were recorded with the ankle in neutral, plantarflexion, dorsiflexion, inversion, and eversion. Groove deepening was done by osteotomizing the posterior fibular wall. Pressure readings were then recorded. Average pressures for each of the four sensor pads after the procedure were compared to those obtained before the procedure. Results: The mean pressure overlying the CFL increased at all five ankle positions; however, these changes were not significant. Significant decreases in pressure were noted within the distal and middle groove at all ankle positions after the peroneal groove deepening procedure. Pressure within the proximal groove increased at all but one position, with a significant difference noted in neutral and plantarflexion. Conclusion: Pressures within the middle and distal peroneal groove significantly decreased after a groove deepening procedure. Combining this technique with peroneal tendon debridement may be advantageous for treatment of partial peroneal tendon tears or recalcitrant peroneal tendinitis.
INTRODUCTION
When nonoperative treatment fails, fibular groove deepening has been advocated for the treatment of recurrent peroneal tendon instability, 4,7,10 most commonly when associated with a flat or convex posterior fibular surface. Variations in the shape of the fibula have an effect on the depth of the groove. Most fibulas are concave, with only a small percentage having either a flat or convex geometry. 2 After the posterior wall of the fibula is recessed, the peroneal tendons sit more securely in a deeper groove. In addition to the improved peroneal tracking, groove deepening also may diminish pressures within this groove. Decompressing the peroneal tendons in this fashion may diminish intratendinous stresses and may result in less pain and improved peroneal tendon function.
Short-term clinical studies have reported promising results after peroneal groove-deepening, 4,7,10 but the biomechanical alterations associated with the procedure have not been investigated. We hypothesized that after a groove deepening procedure pressures within the peroneal groove would decrease and pressures at the periphery of the groove would increase. To investigate this hypothesis, we identified pressure changes at various points within and distal to the peroneal groove after a groove deepening procedure.
MATERIALS AND METHODS
Twelve fresh-frozen cadaver foot and ankle specimens were used. After thawing, a lateral incision was made and the peroneal sheath was carefully incised approximately 1 mm posterior to its fibular attachment. The peroneal longus and brevis tendons were then tagged with # 2 Ethibond (Ethicon, Cincinnati, OH) sutures. A medial incision was made to expose and tag the posterior tibialis tendon. These tendons and the sutures were then passed proximally through their respective sheaths.
A flexible thin computerized pressure sensor strip (Tekscan, Inc., Boston, MA) (Figure 1) containing four sensor pads was placed longitudinally within the peroneal groove. The sensor pads were located 8 mm apart on the sensor strip, which measured 1 mm in thickness. The peroneal tendons were gently retracted and a sensor strip was placed between the peroneus brevis tendon and the posterior fibula. The sensor was then secured with a 5-0 nylon suture distal to the groove and positioned in all specimens with the first pad directly over the calcaneofibular ligament (CFL). The second, third, and fourth sensor pads were located in the distal, middle, and proximal grooves, respectively (Figures 2 and 3). The peroneal tendons were allowed to fall back into the groove. The previously tagged tendons along with the proximal end of the sensor strip were then passed proximally through the peroneal sheath and out the proximal end of the cadaver specimen. The superior peroneal retinaculum and the remaining proximal sheath were reapproximated to the fibula. The foot was then mounted in a grasping apparatus that allowed access to the sutures and sensor strip (Figure 4).
To simulate the forces applied to the ankle at the midstance phase of gait, loads were applied to the plantar foot and to the posterior tibial tendon and the peroneus longus and brevis tendons by loading through applied sutures in load ratios based on previous studies: 6,7 axial load, 111 N; posterior tibial tendon load; 32 N; peroneus longus tendon load, 17 N; peroneus brevis tendon load, 6 N (Figure 5). With the foot model loaded, baseline pressure readings were recorded for each of the four sensors in neutral, 20 degrees of plantarflexion, 20 degrees of dorsiflexion, and 30 degrees of inversion and eversion. To minimize the effect of soft-tissue elasticity, the pressure recordings were obtained over a continuous 15-second period and then repeated three times for each ankle position.
The pressure sensor strip and the peroneal tendons were carefully retracted off the posterior fibular wall, and the fibular groove was deepened (Figure 6). The posterior fibular wall was osteotomized as a thin osteofibrocartilaginous flap and retracted posteriorly. A 4.5-mm burr was used to remove approximately 6 mm of fibular cancellous bone. The posterior wall was then repositioned and gently tamped into the fibula. The pressure sensors and tendons were placed back into the groove and the superior peroneal retinaculum and soft-tissue sheath were approximated to the lateral fibula with sutures through bone tunnels. Pressure readings were then recorded at all described ankle positions with loads applied to the foot.
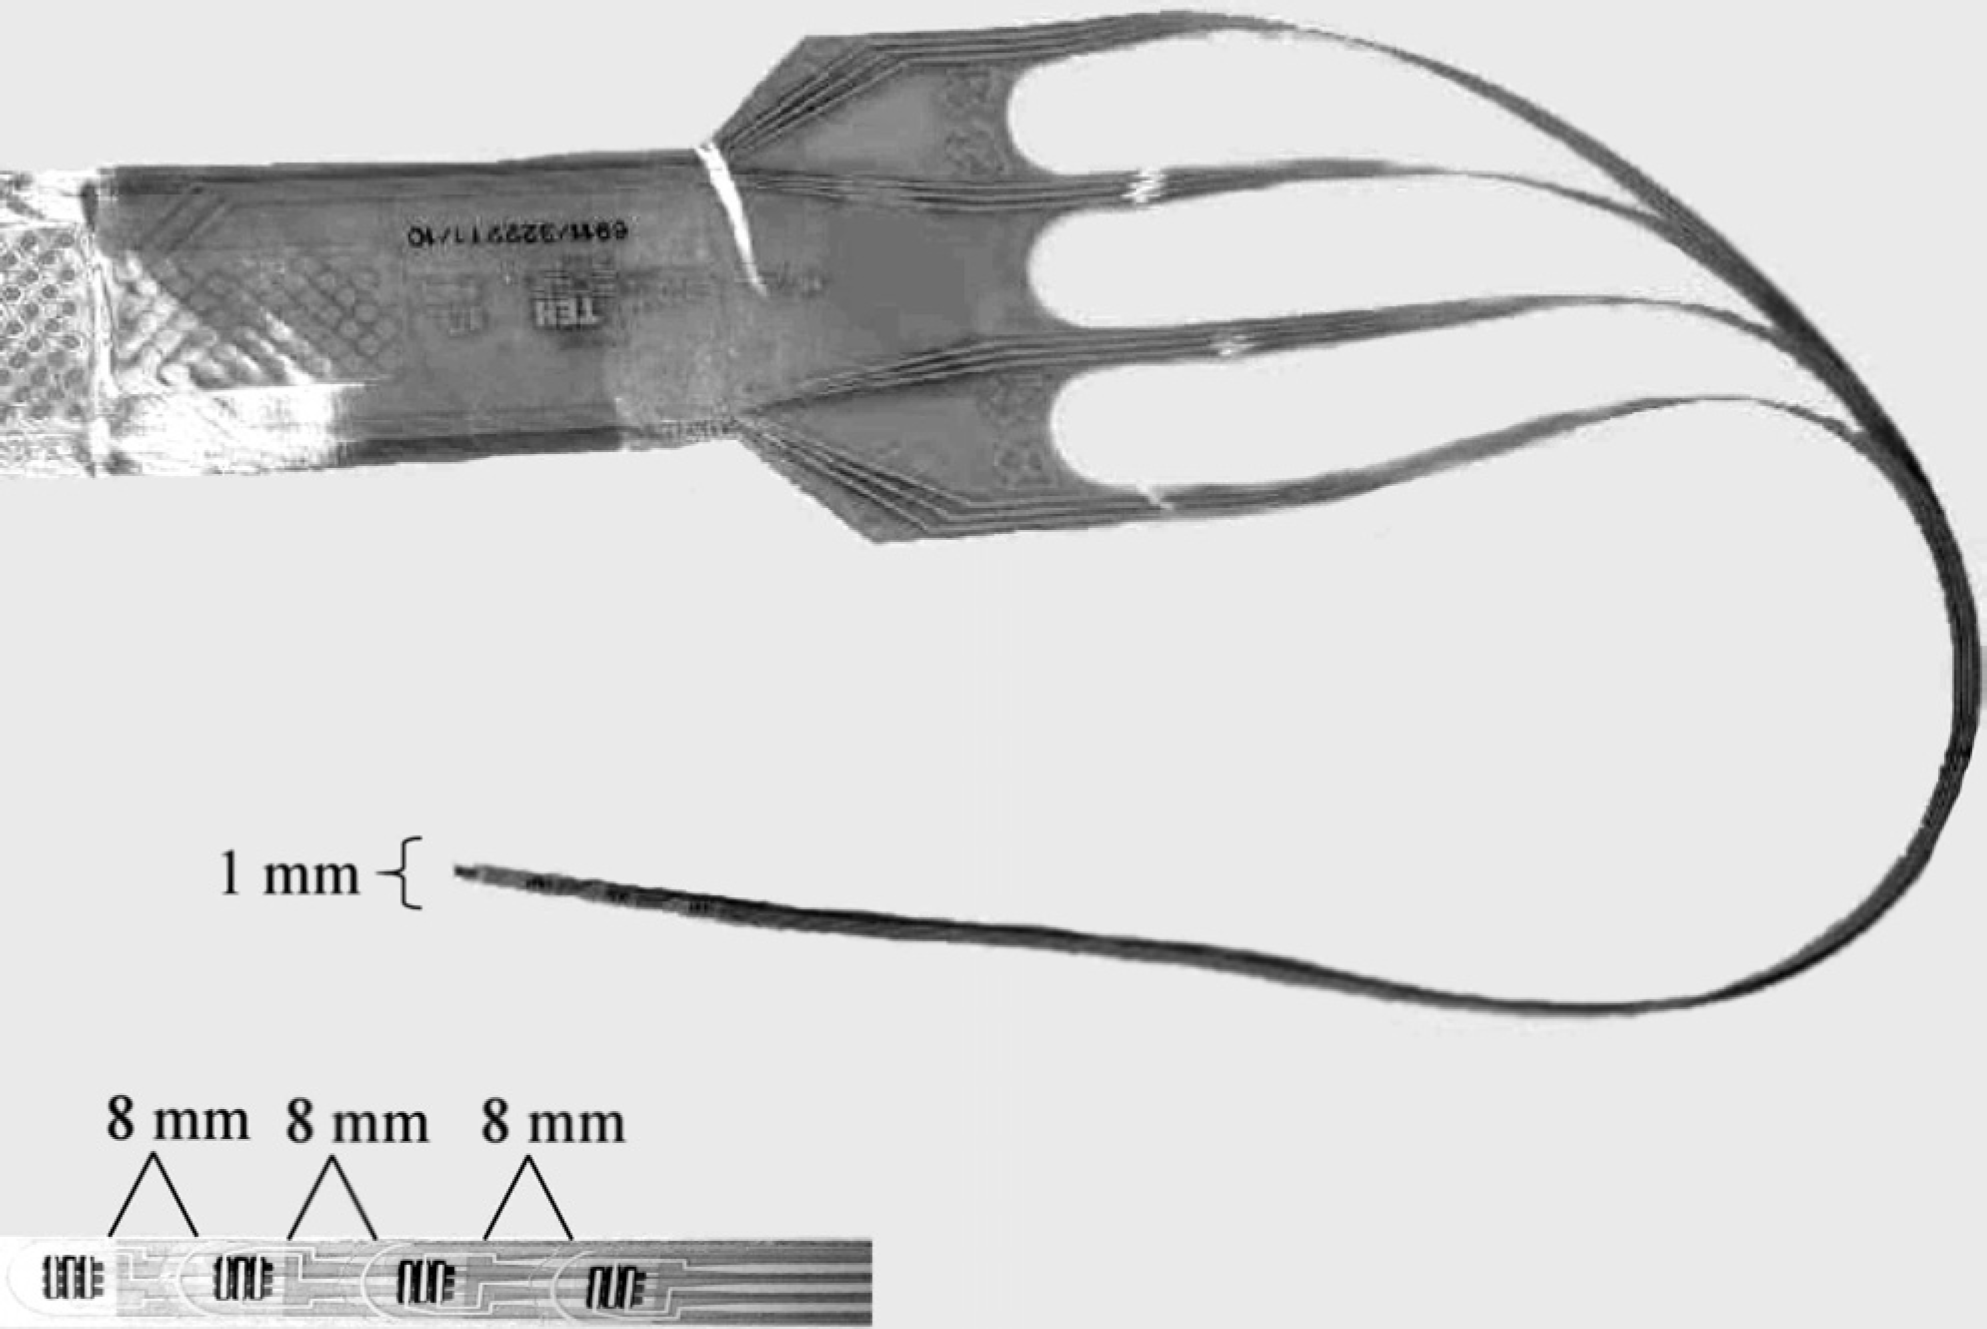
Tekscan computer pressure sensor. The sensor is very thin (approximately 1 mm) and pliable.
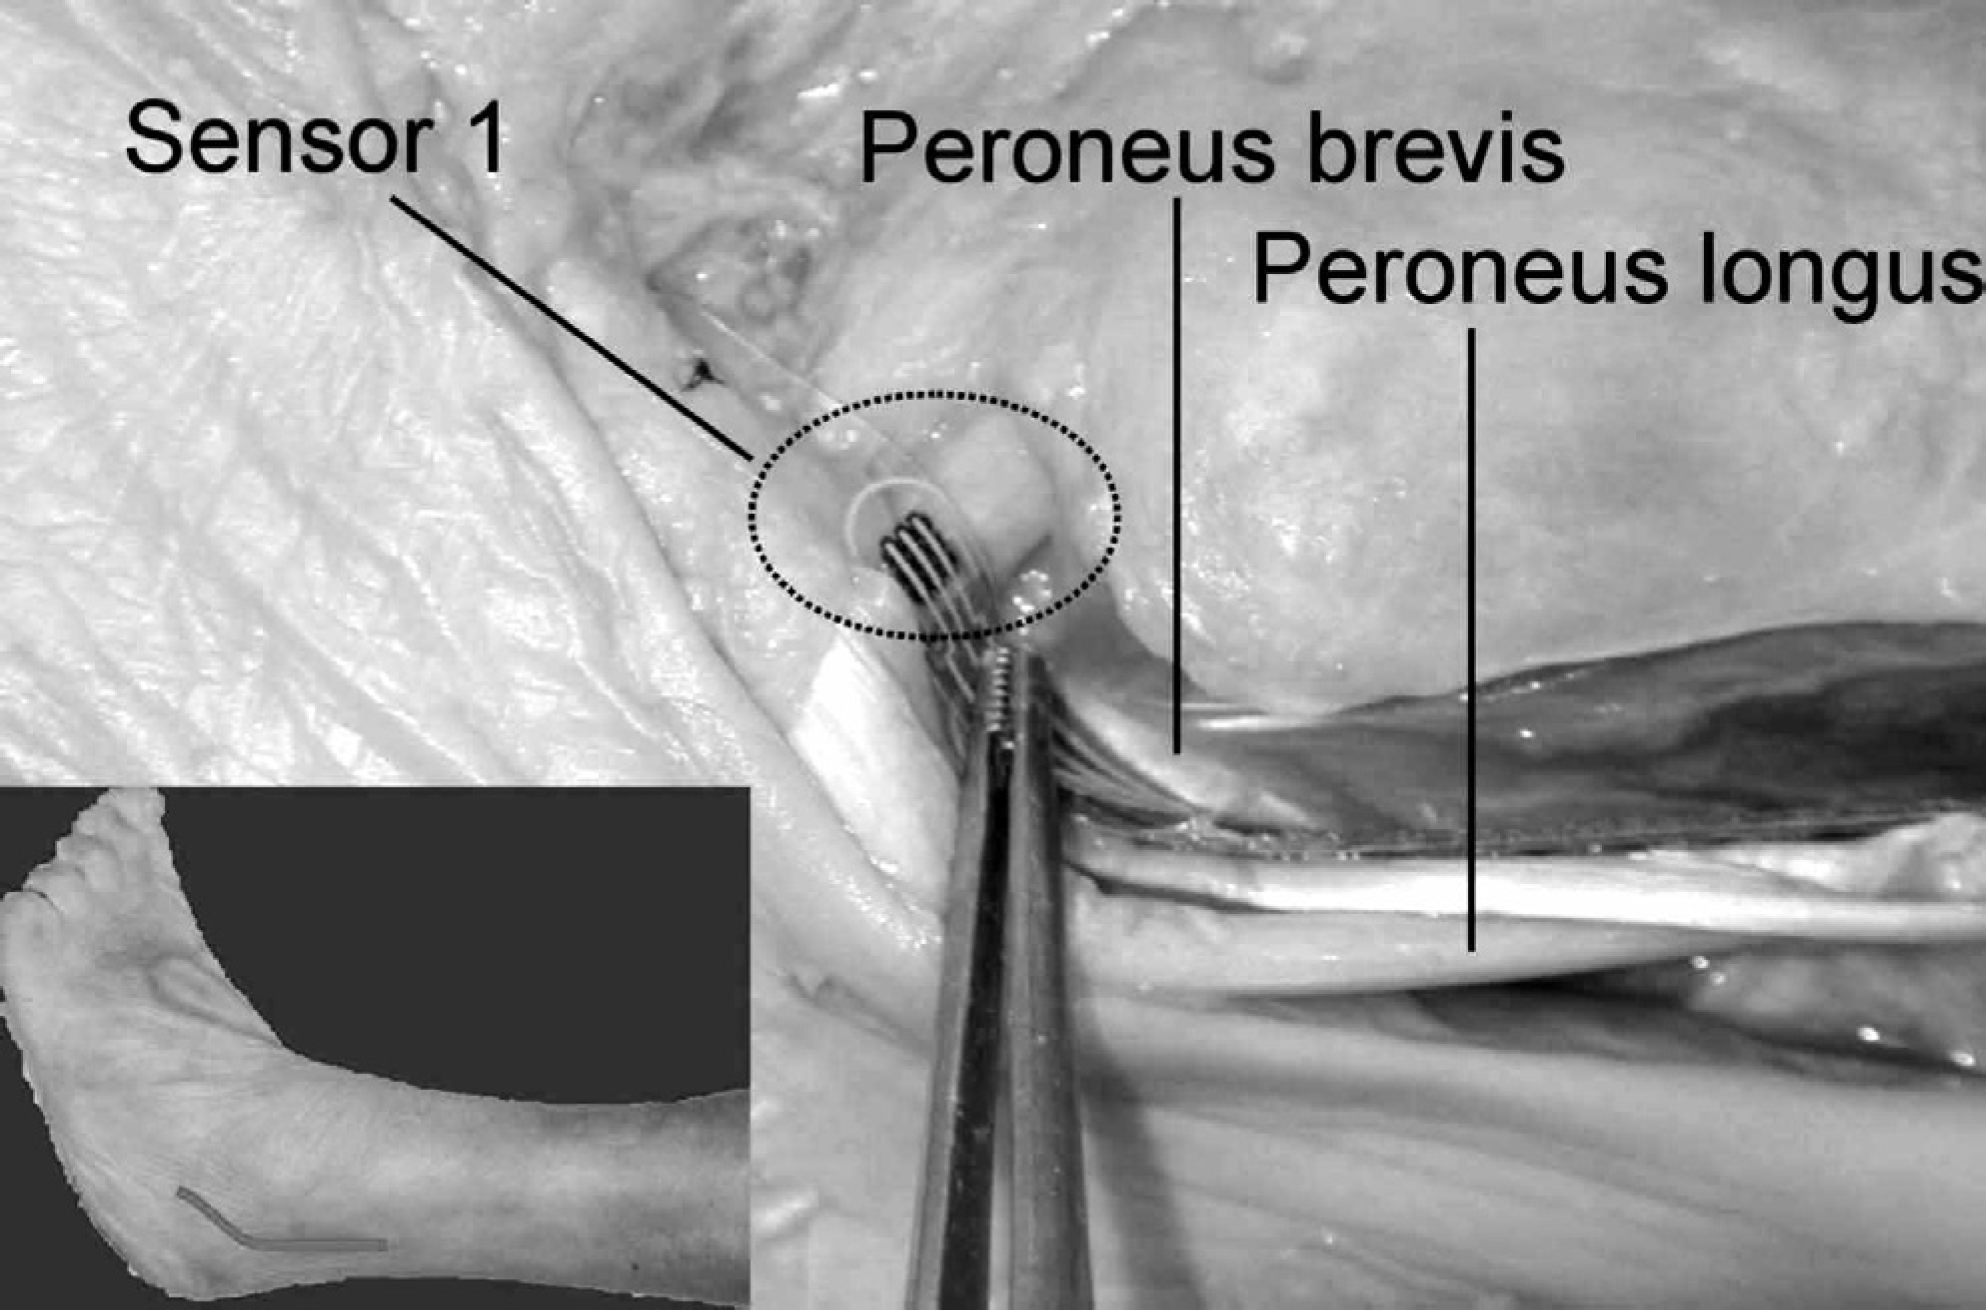
Sensor 1 overlying the calcaneofibular ligament (CFL). The strip is secured distal to the CFL and is positioned within the groove between the peroneus brevis tendon and the posterior wall of the fibula.
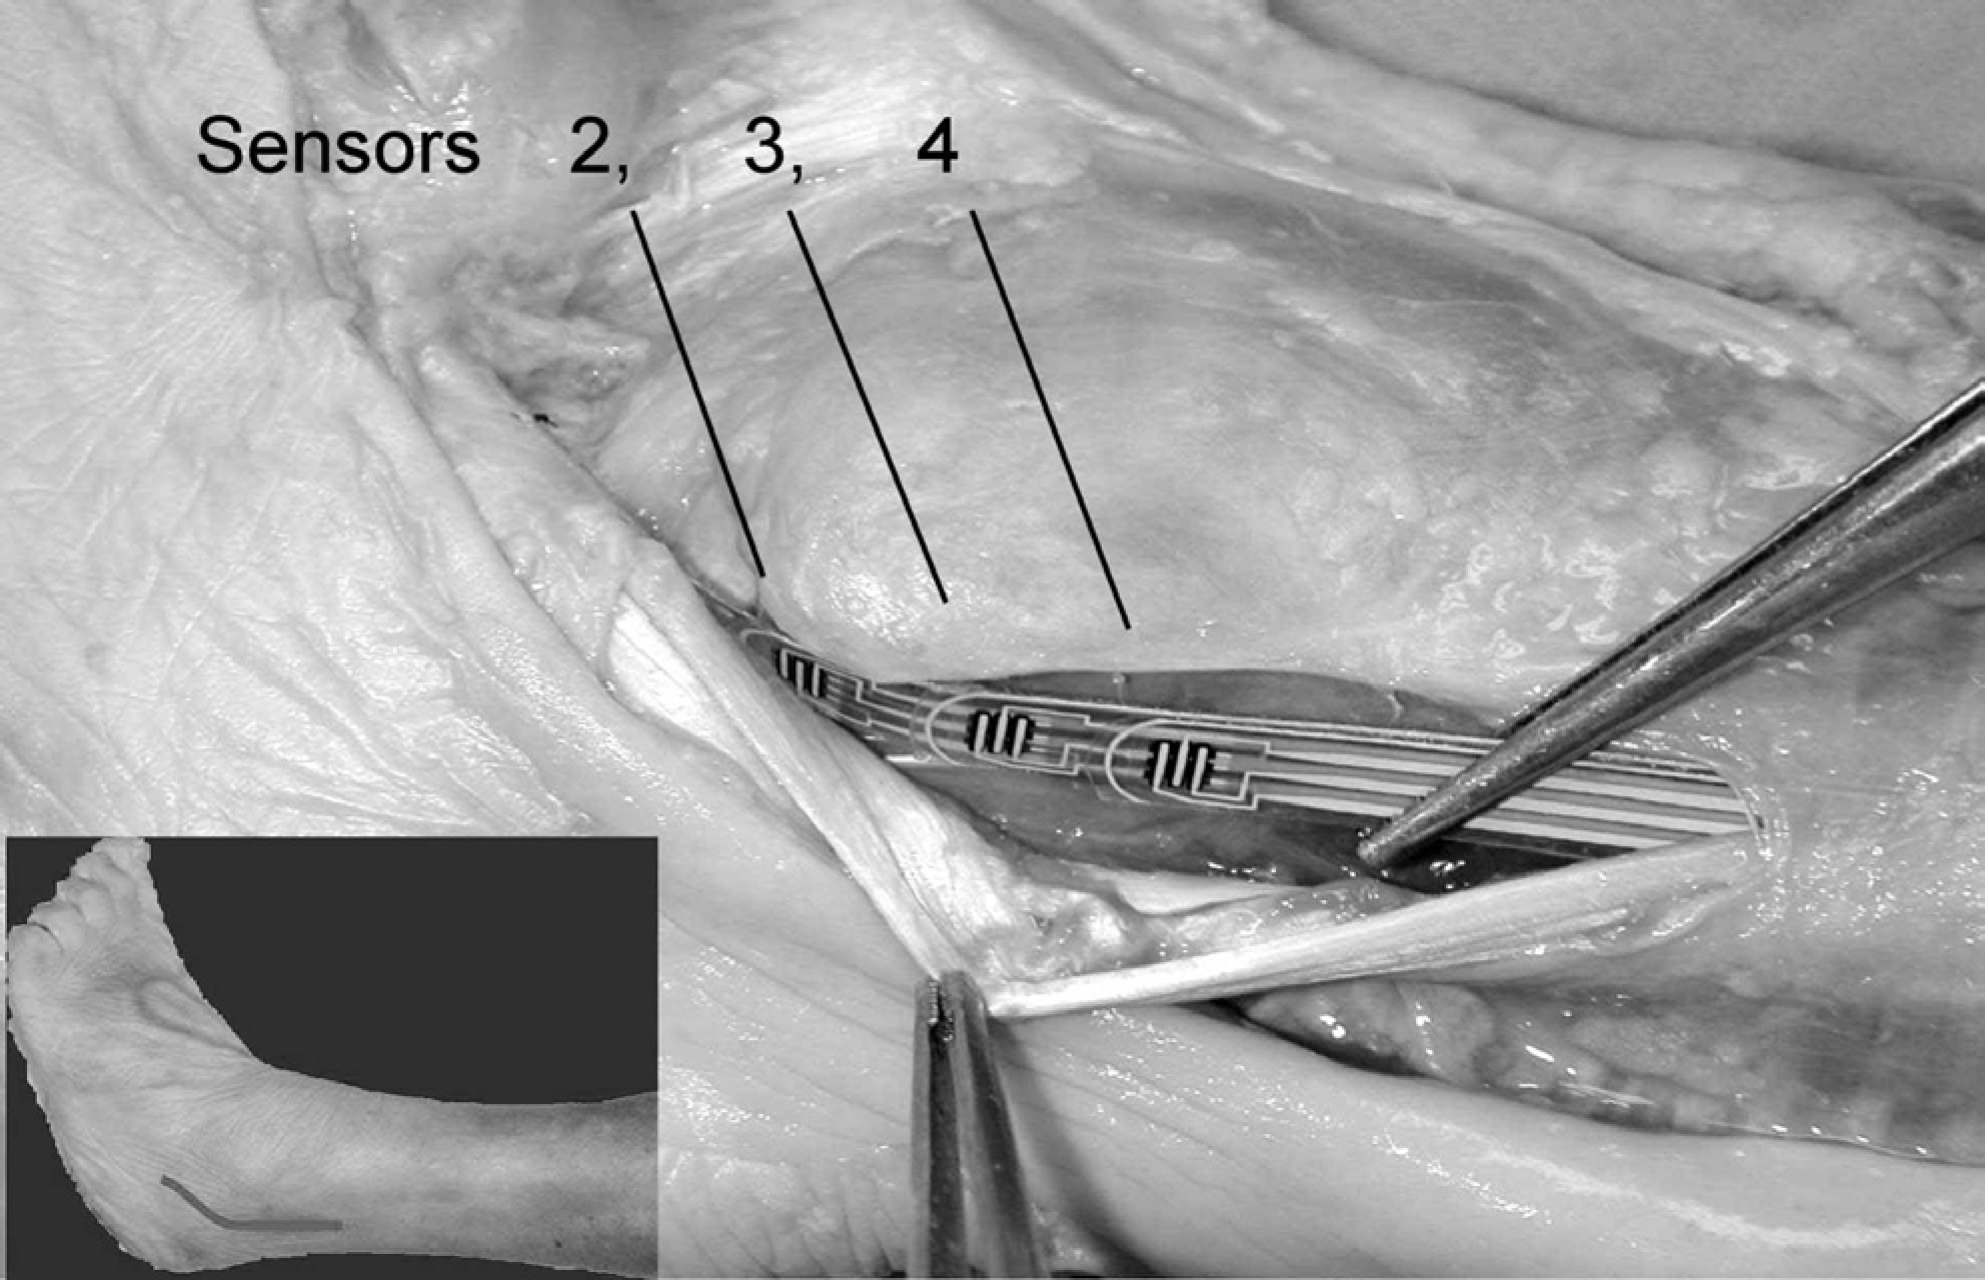
Sensors 2, 3, and 4 positioned within the distal, middle, and proximal groove, respectively.
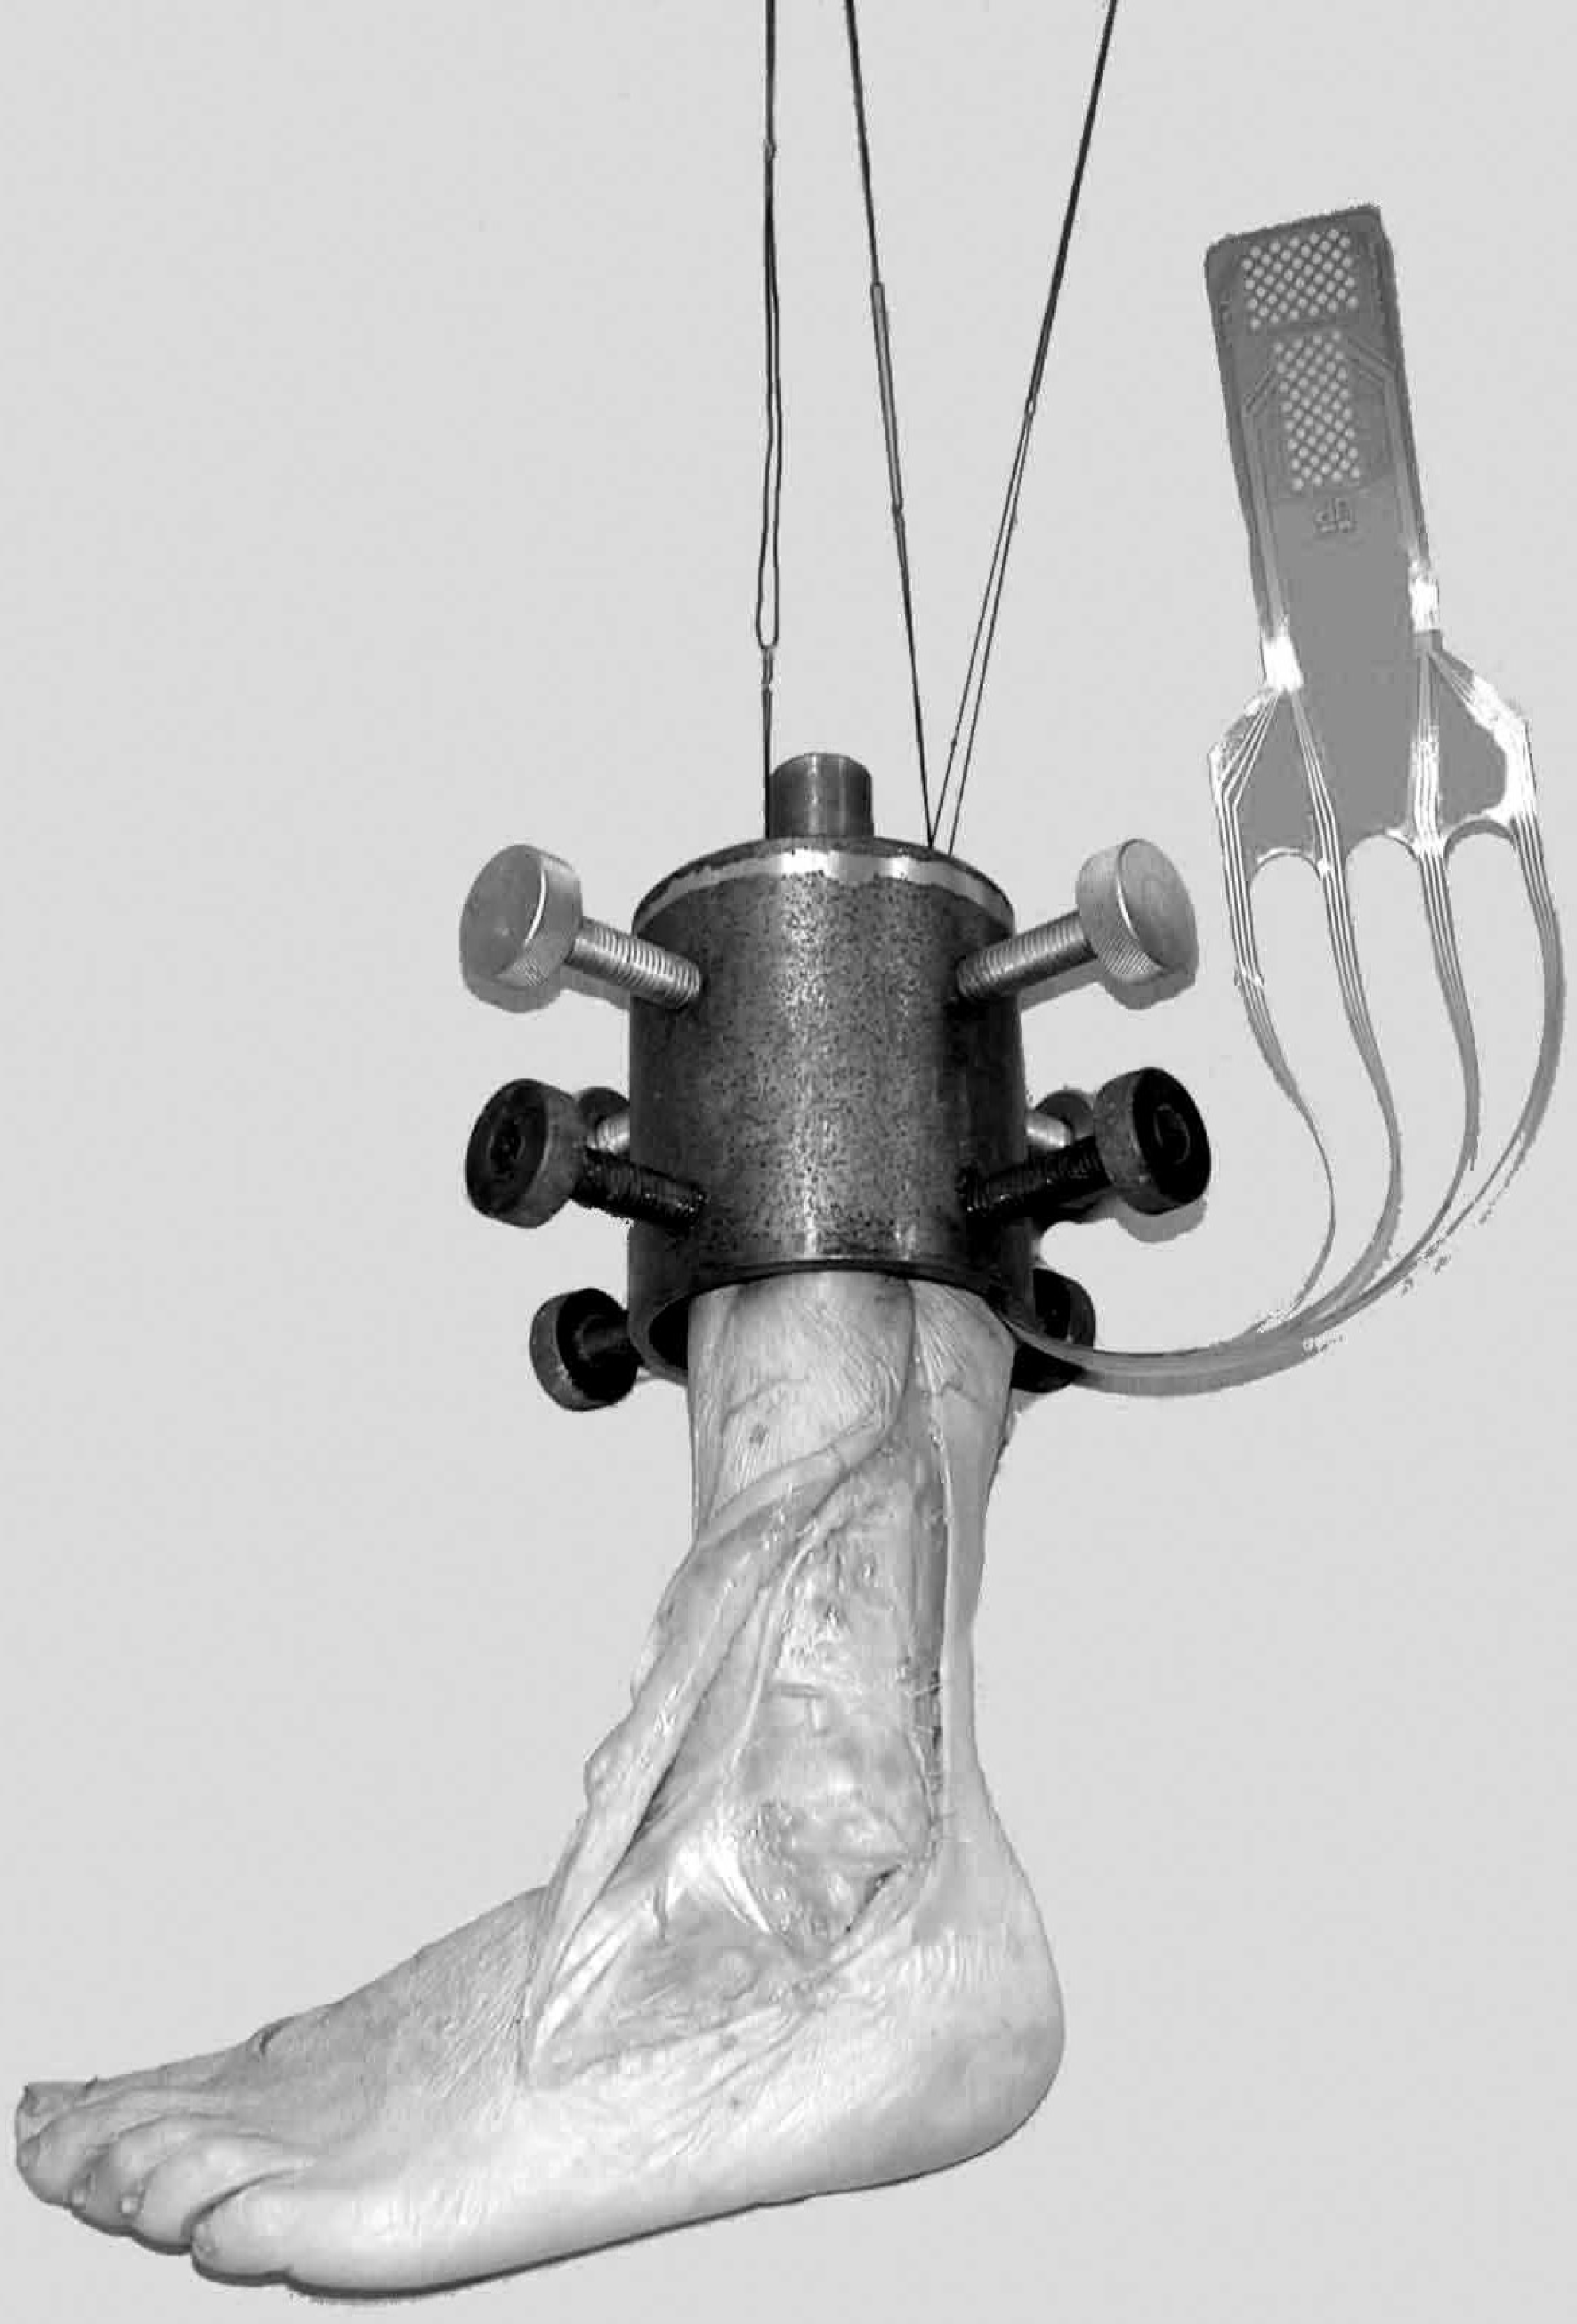
Mounted foot with sensor apparatus secured within the peroneal groove.
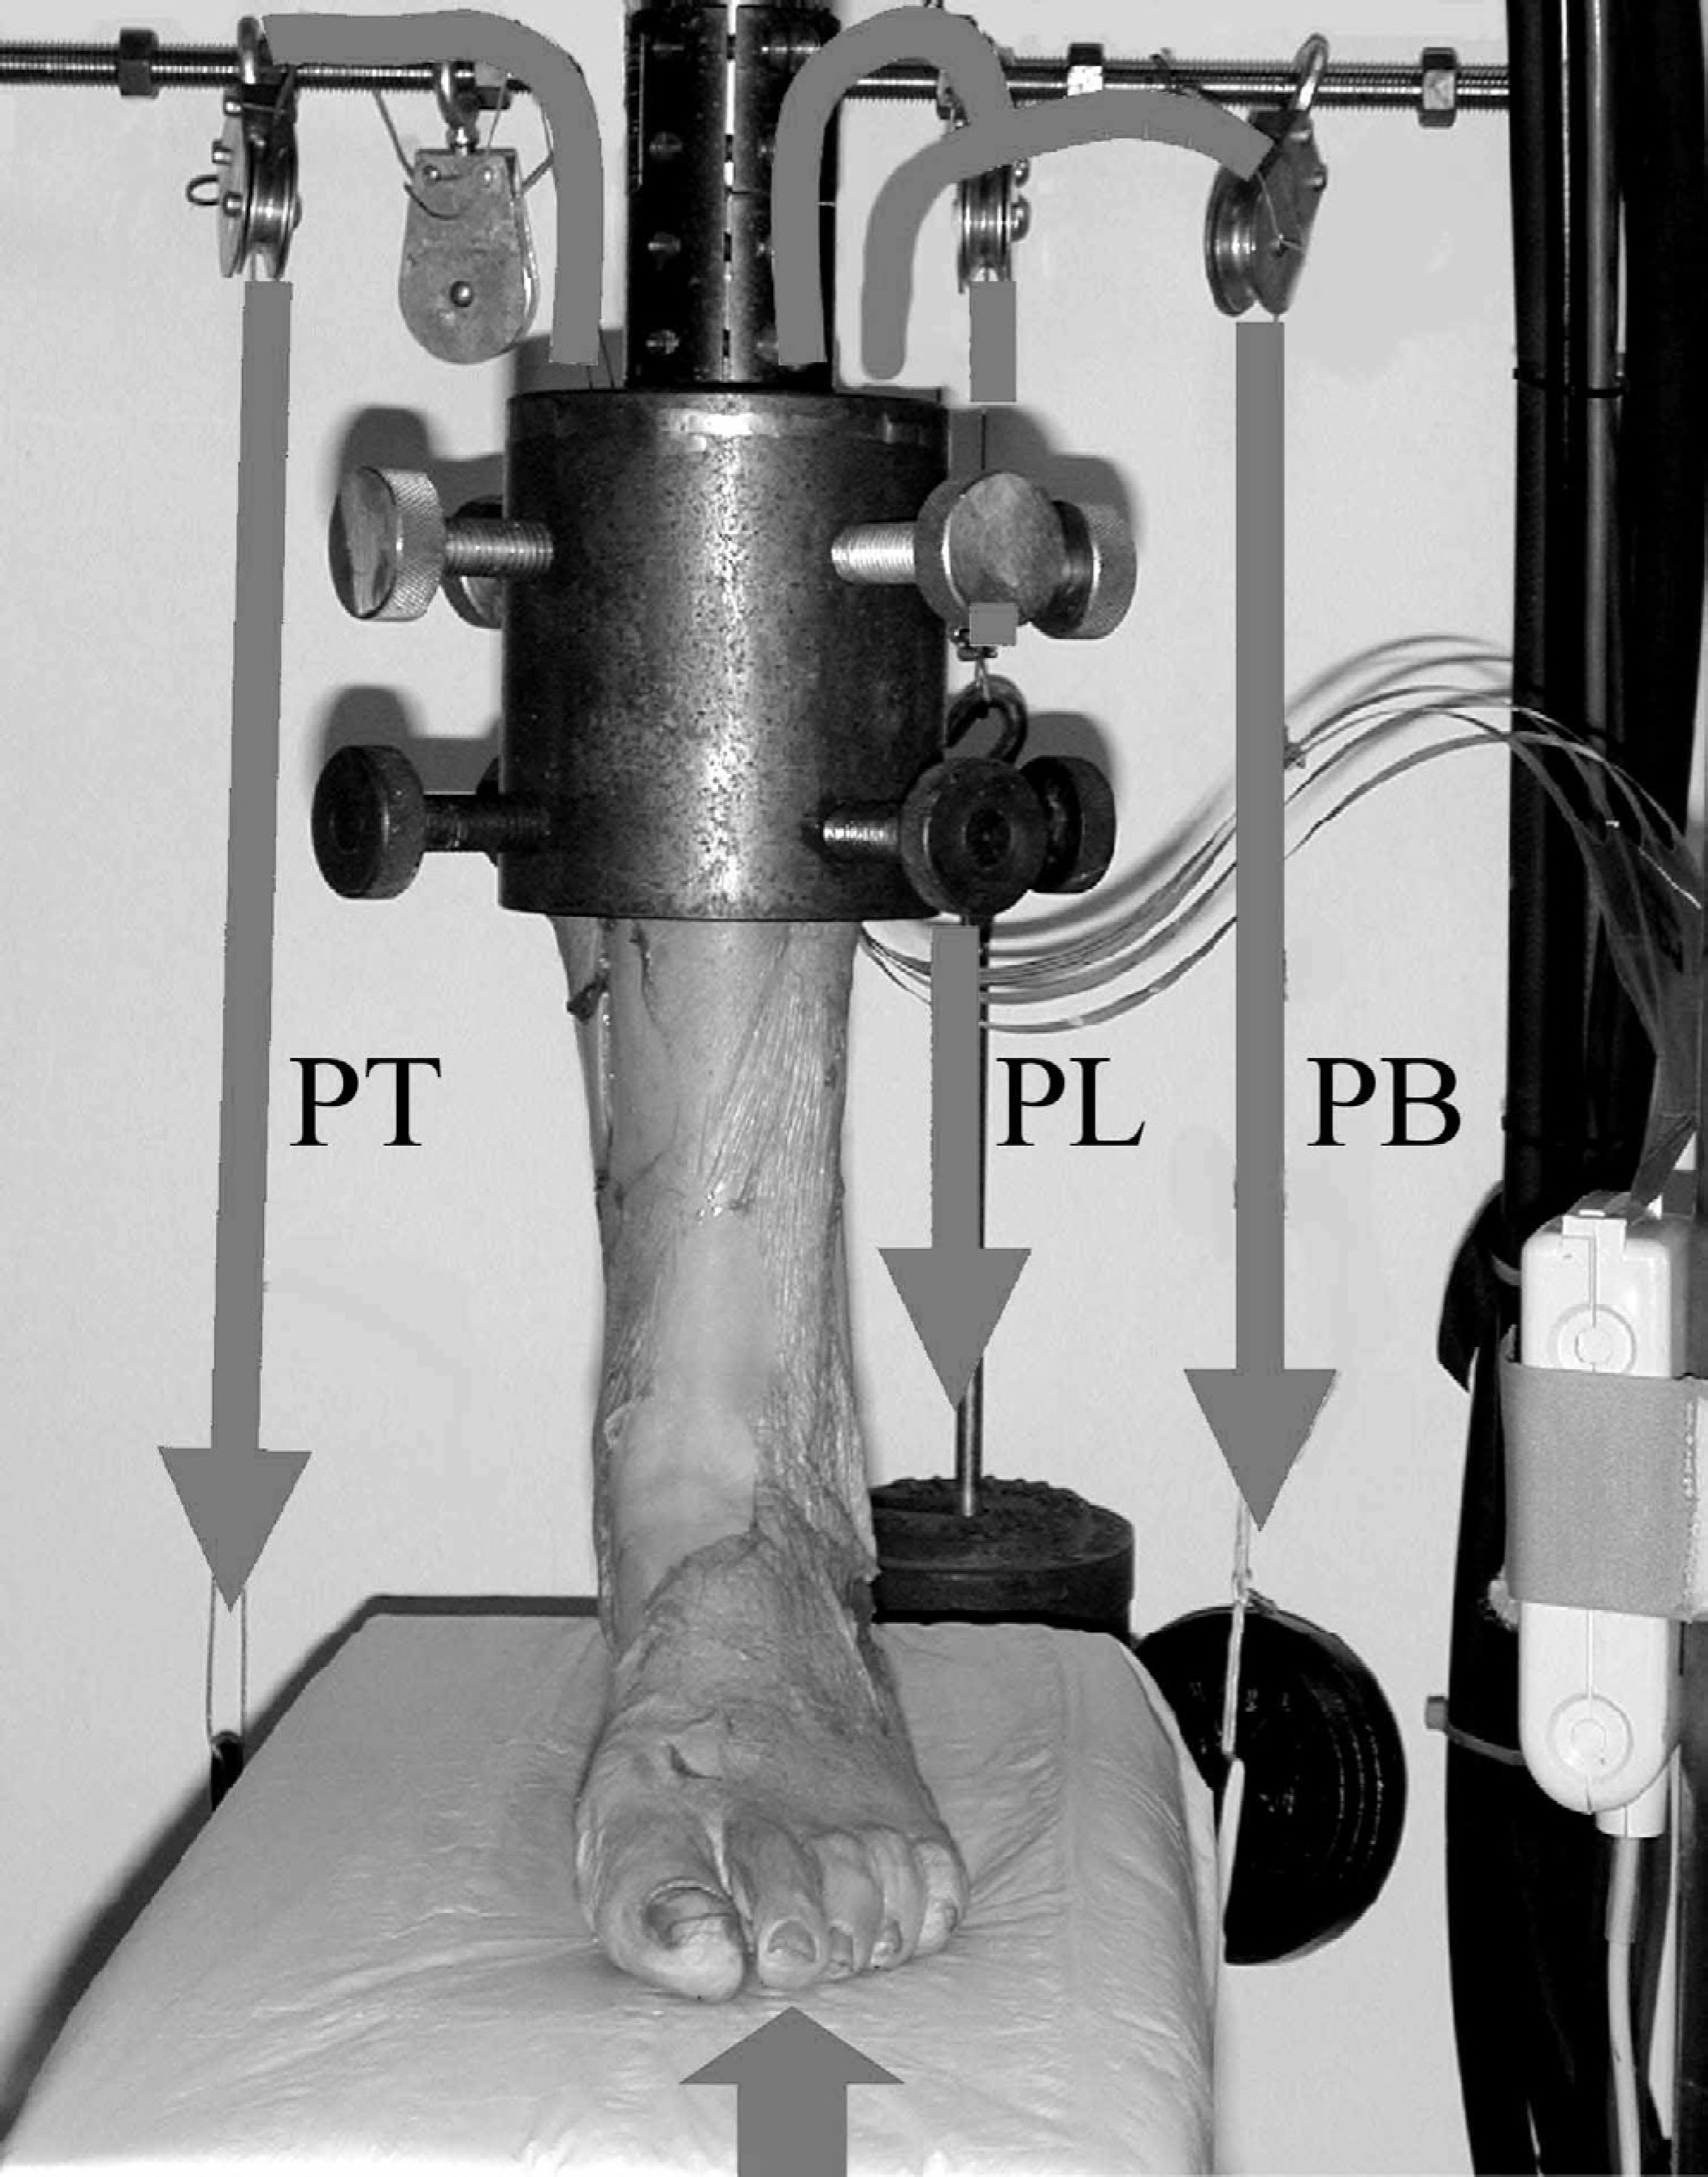
Midstance phase of gait simulated with loads applied axially as well through pulleys attached to the posterior tibial (PT), peroneal longus (PL), and brevis (PB) tendons.
Tekscan computer software was used to generate pressure data. Pressures in kilopascals were recorded over a 15-second interval for each trial, and each trial was repeated three times. The Tekscan software averaged the pressures over the 15-second interval and then averaged the three trials for each position. The same set of recordings was repeated for each of the five ankle positions. At each of the five ankle positions tested, the average pressures before and after the procedure were compared for each of the four sensors. Statistical analysis was done using a two-tailed paired t-test. Statistical significance was set at p ≤ 0.05.
RESULTS
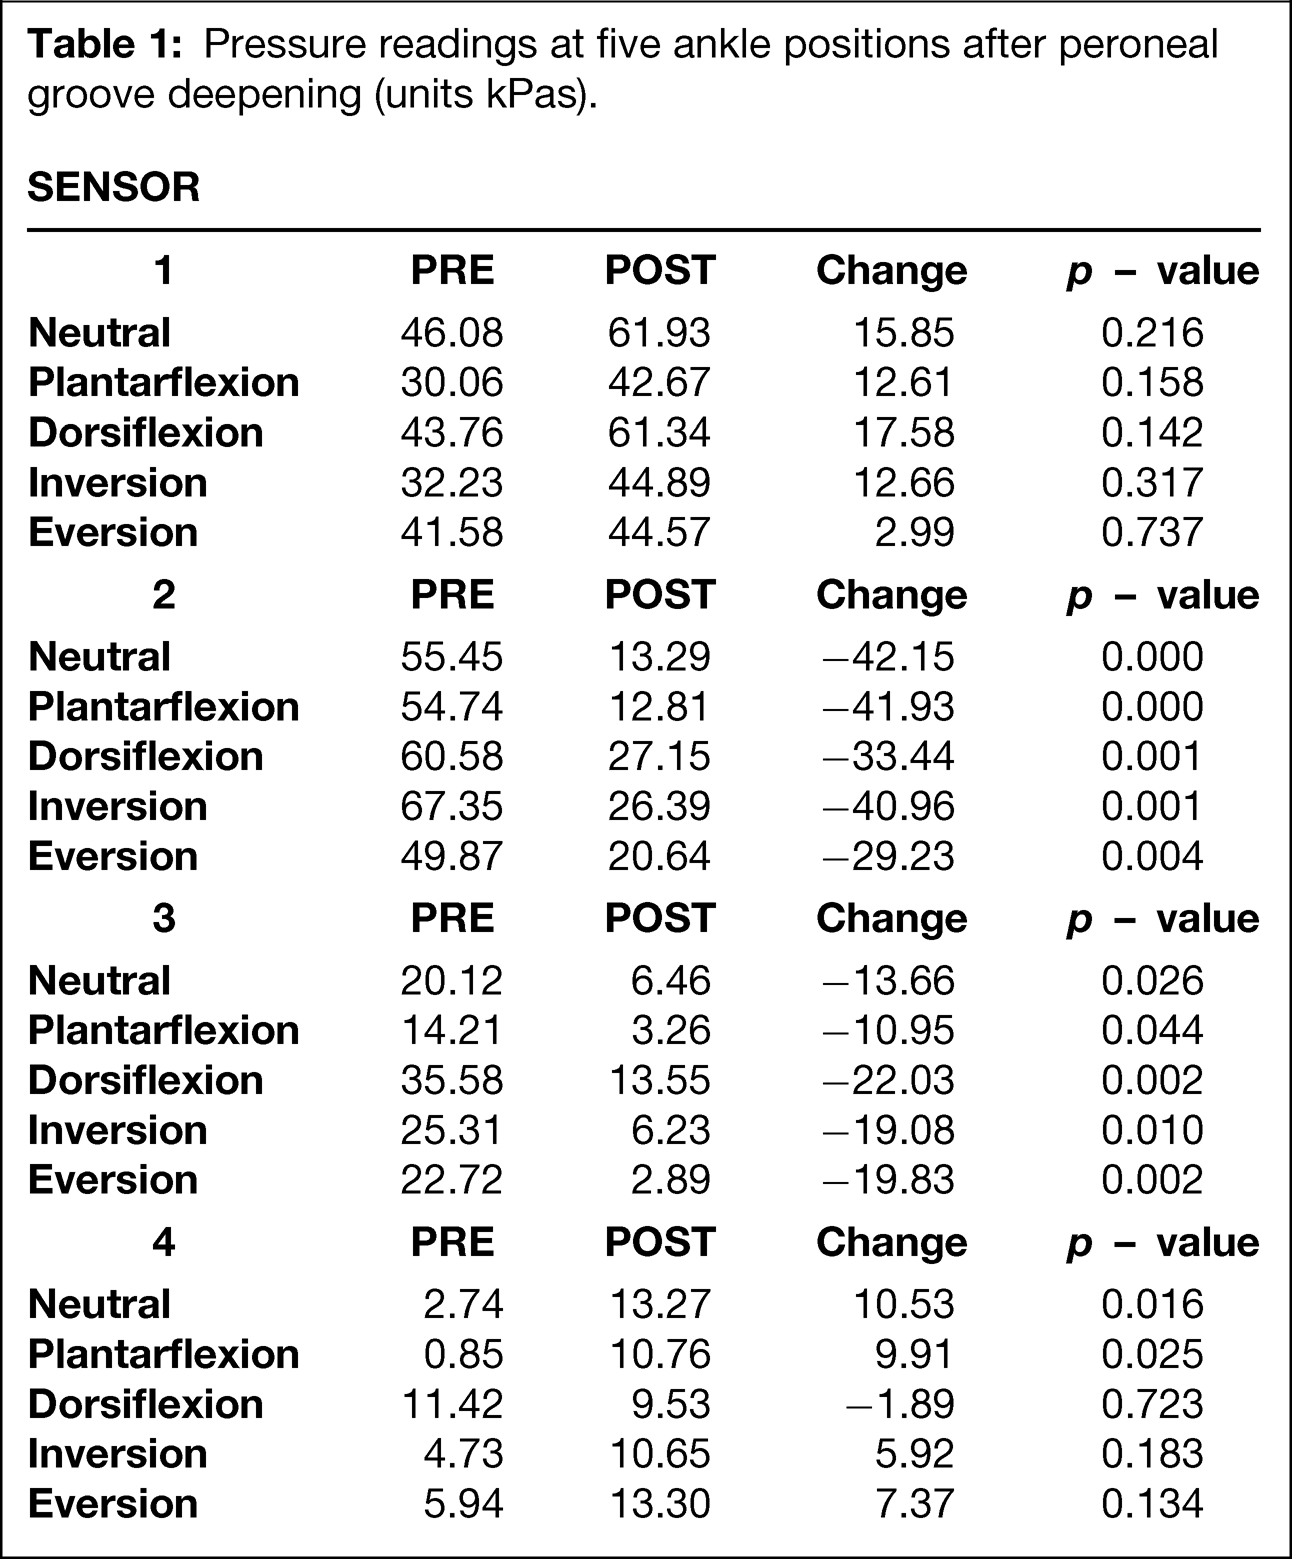
At sensor 1 (Figure 7), which was located at the CFL, pressure readings increased at all five ankle positions after groove deepening. However, none of these changes were statistically significant (Table 1). At the distal groove (sensor 2) (Figure 8), statistically significant decreases in pressure were noted at all ankle positions after the groove deepening procedure (p < 0.05). Pressures within the middle of the tunnel (sensor 3) (Figure 9) significantly decreased at all ankle positions after groove deepening (p < 0.05). Pressure recordings within the proximal tunnel (sensor 4) (Figure 10) increased at all positions except dorsiflexion. Pressures at this location were very low compared to pressures within the middle and distal grooves for all ankle positions. A statistically significant (p < 0.05) difference was noted in neutral and plantarflexion (Table 1).
DISCUSSION
Our findings revealed that pressures within the middle and distal fibular grooves (between the peroneal tendons and posterior fibular wall) significantly decreased as a result of recessing the posterior fibular wall. Concomitant insignificant increases in pressure were noted in the periphery of the groove, at the CFL, and in the proximal groove. This was interesting because an increase of tension and pressure in this area would be expected with dorsiflexion. However, the decrease was statistically insignificant and involved extremely small pressure measurements. The slight decrease in pressure may have occurred because the CFL is viscoelastic and can absorb some of the increase in pressure. 1,3 Pressures over the CFL may have to increase beyond the level tested in the current study before the peroneal tendons experience an increase in stress.
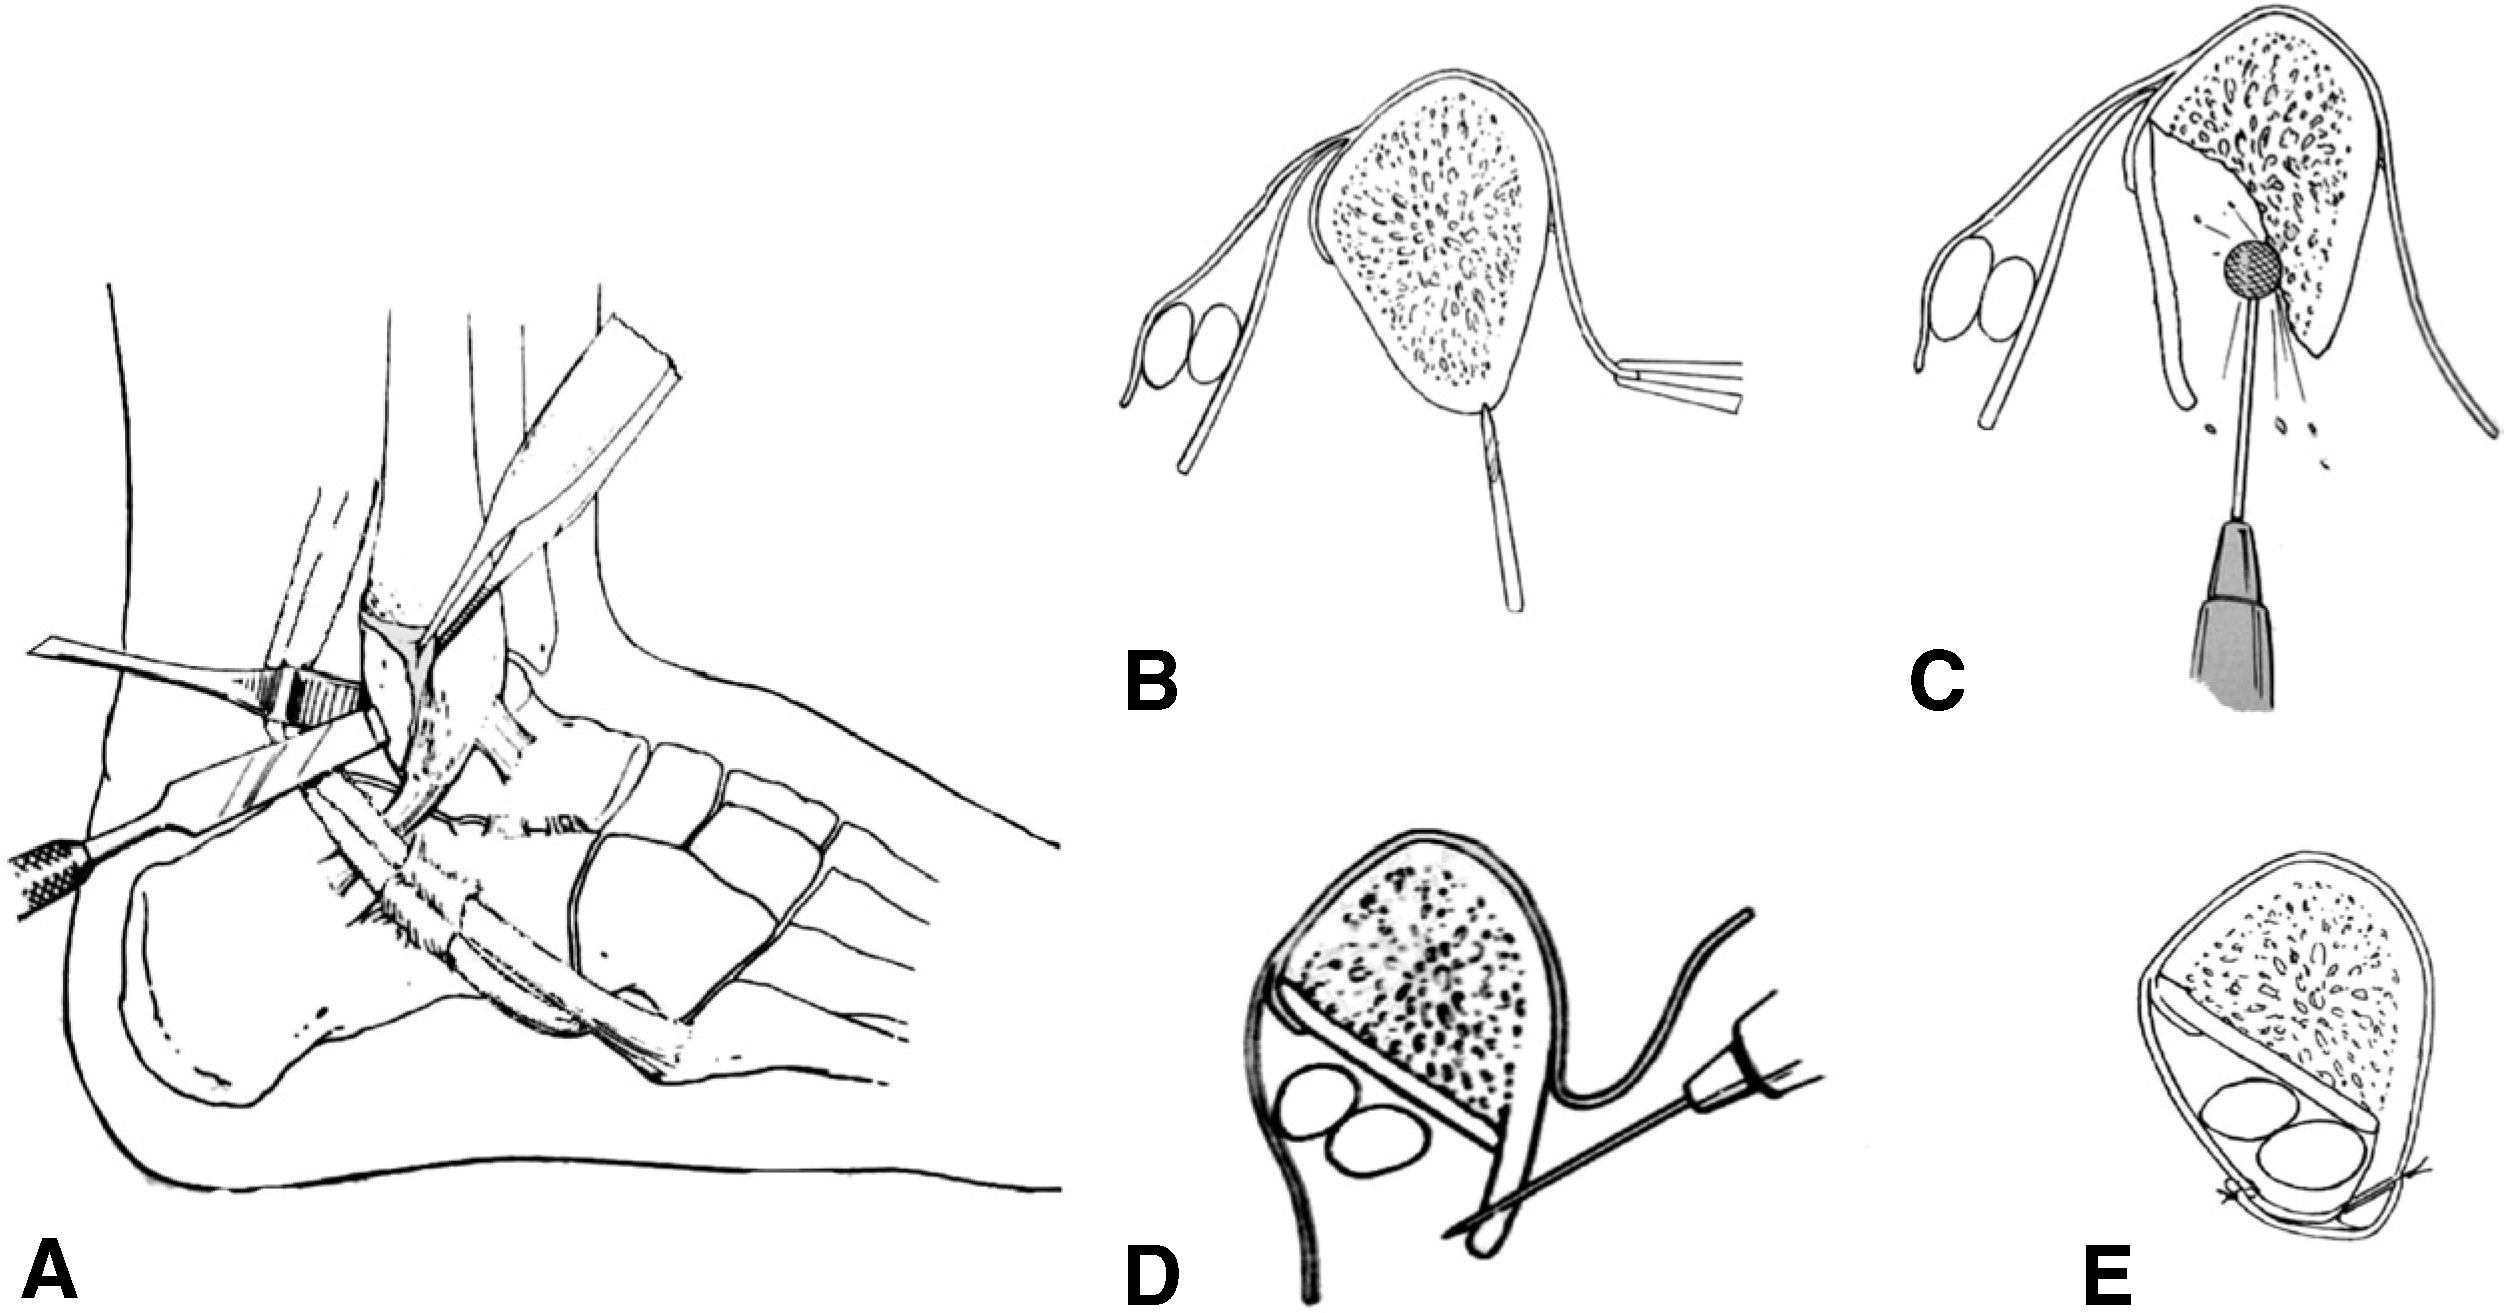
Groove deepening surgical technique.
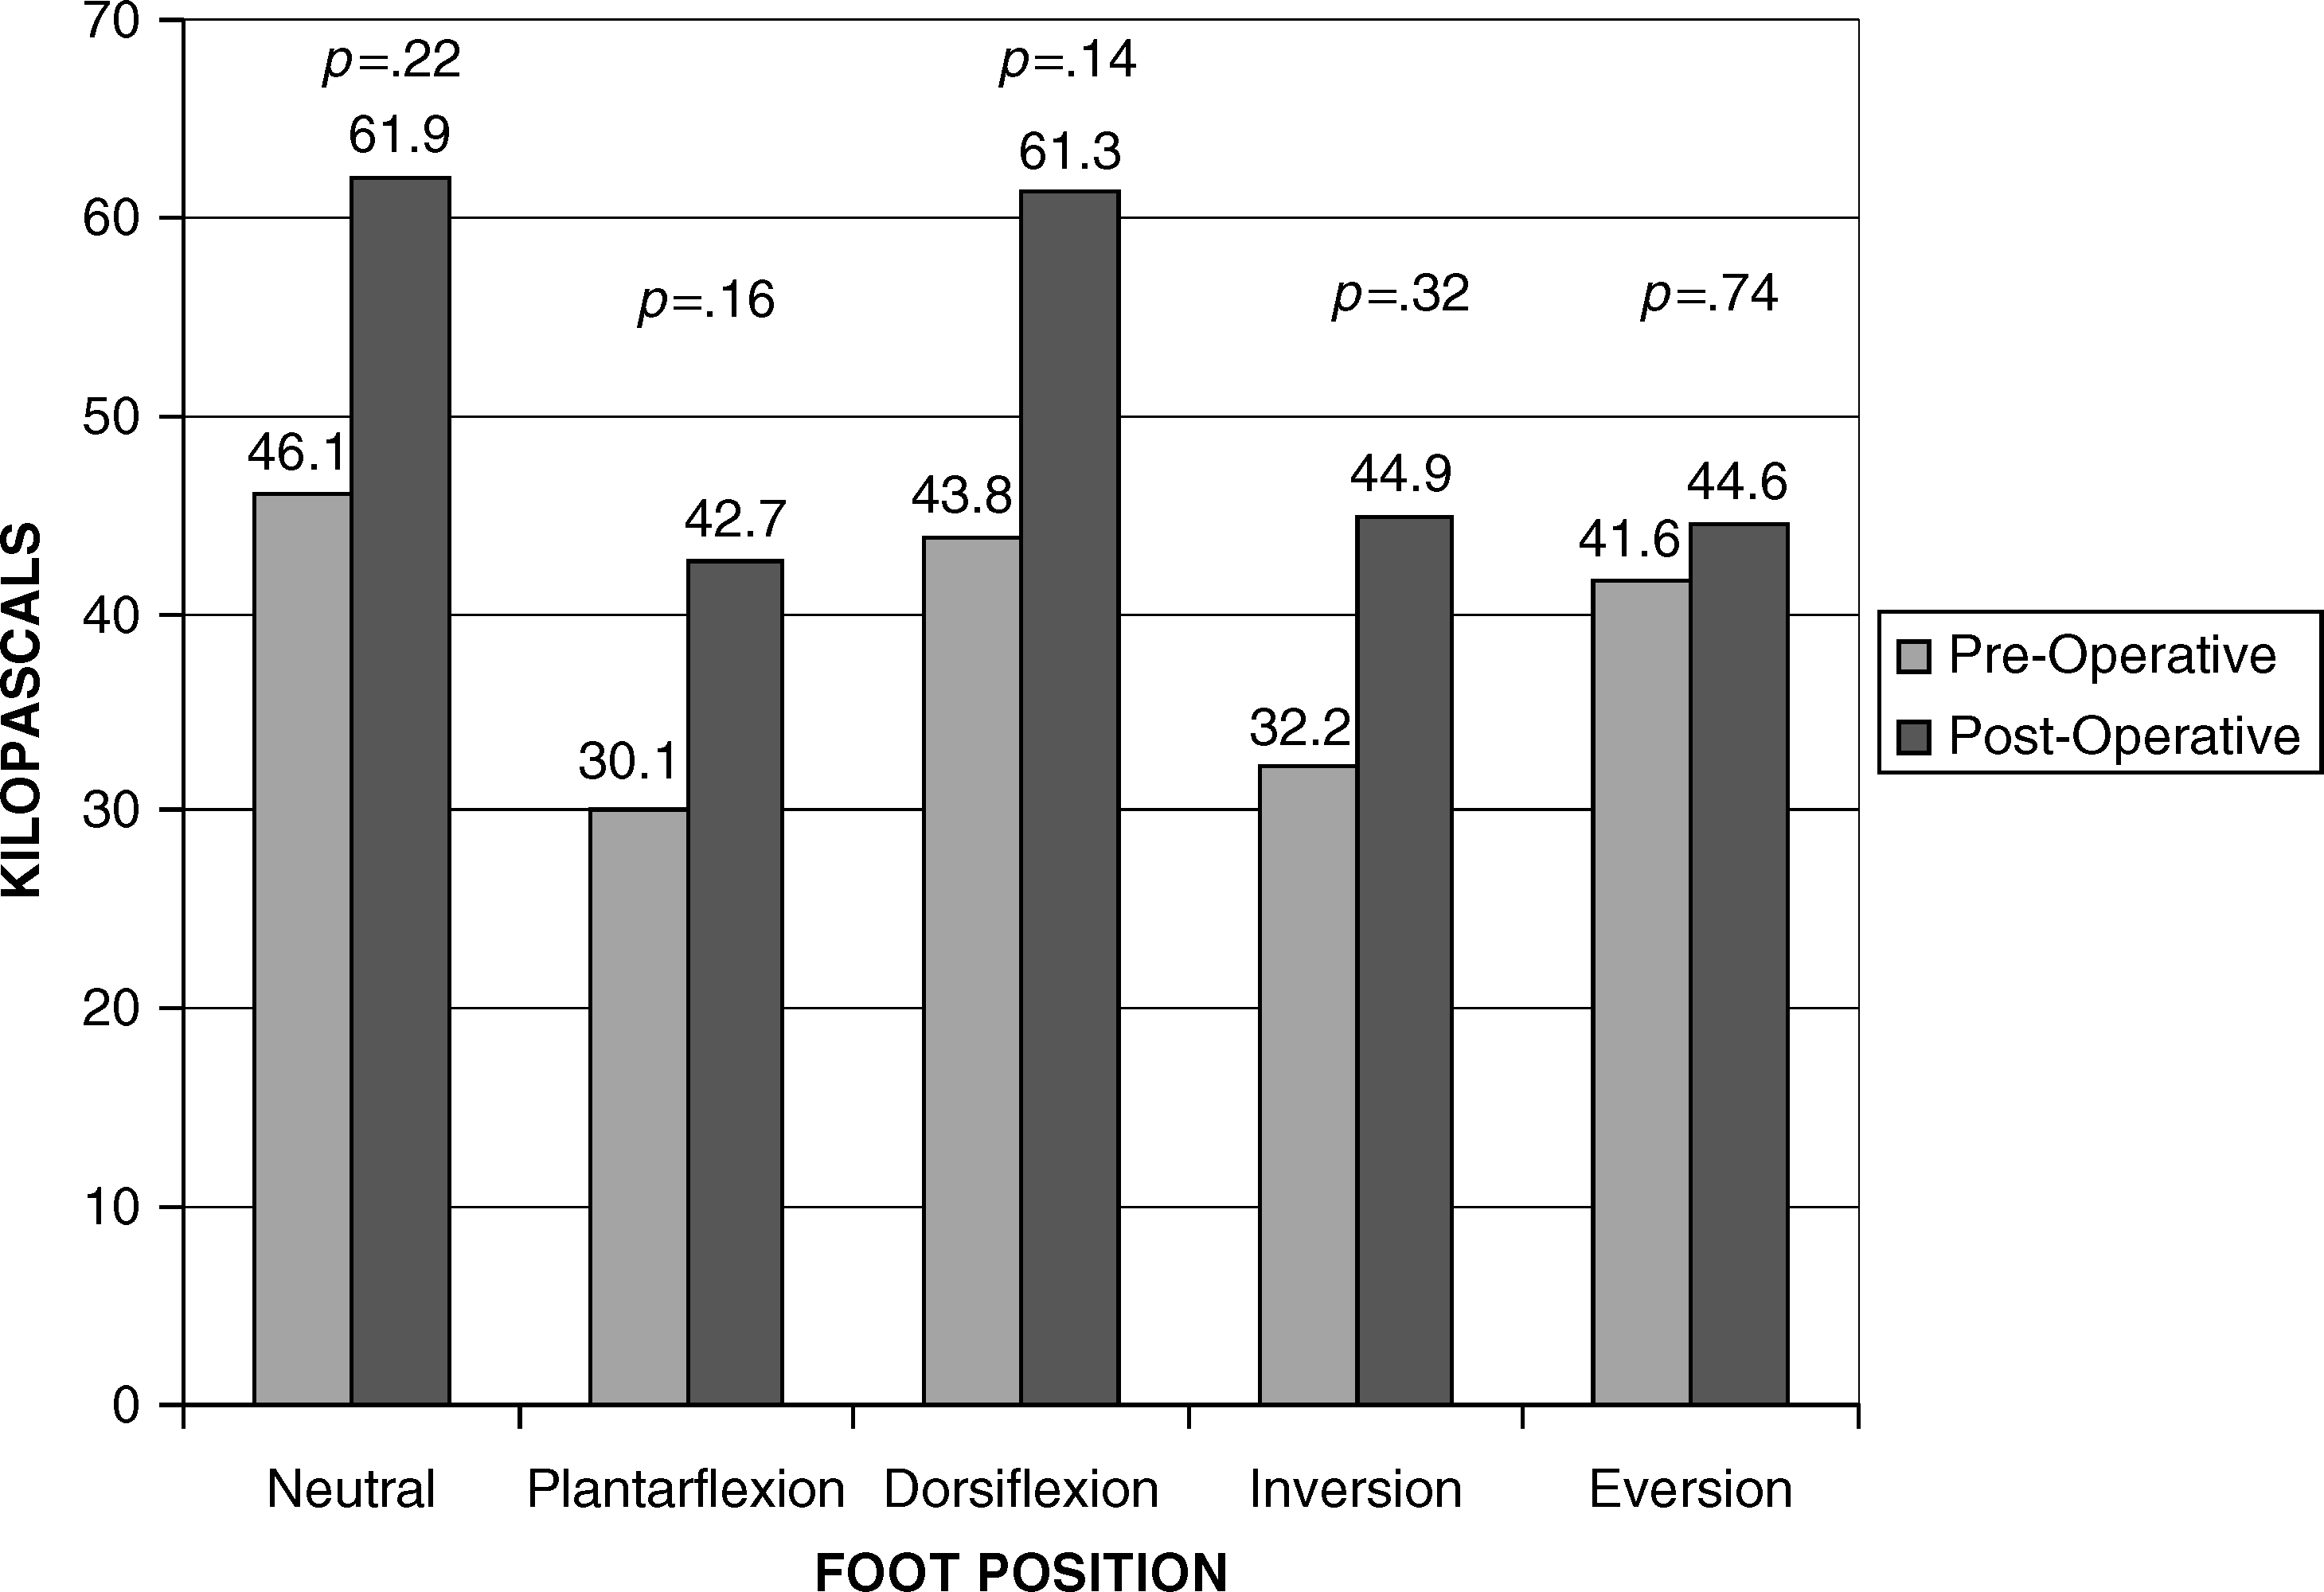
Graph of pressure readings at the CFL (sensor 1).
Previous studies suggest that most peroneal tendon tears occur in the peroneus brevis at the tip of the fibula where a high concentration of stress is applied to the tendon as it turns about the fibula. 5,8,9 Unique anatomic features may account for this predisposition toward peroneal tendon tears, including relatively less vascular area in the peroneus brevis tendon near the tip of the lateral malleolus. 5 Another predisposing factor for tearing is the repetitive compression of the peroneus brevis tendon between the peroneal longus and the bony fibula. 5 Decompression in this area may relieve this pressure on the tendon.
The test set-up was designed to simulate the dynamic status of the midstance phase of gait in multiple ankle positions. However, the current findings are limited in that they are based on a cadaver model. Further, the Achilles tendon was not loaded in this study, and previous studies have documented connections between the Achilles tendon and the peroneal retinacular sheath. 5
Pressure readings at five ankle positions after peroneal groove deepening (units kPas).
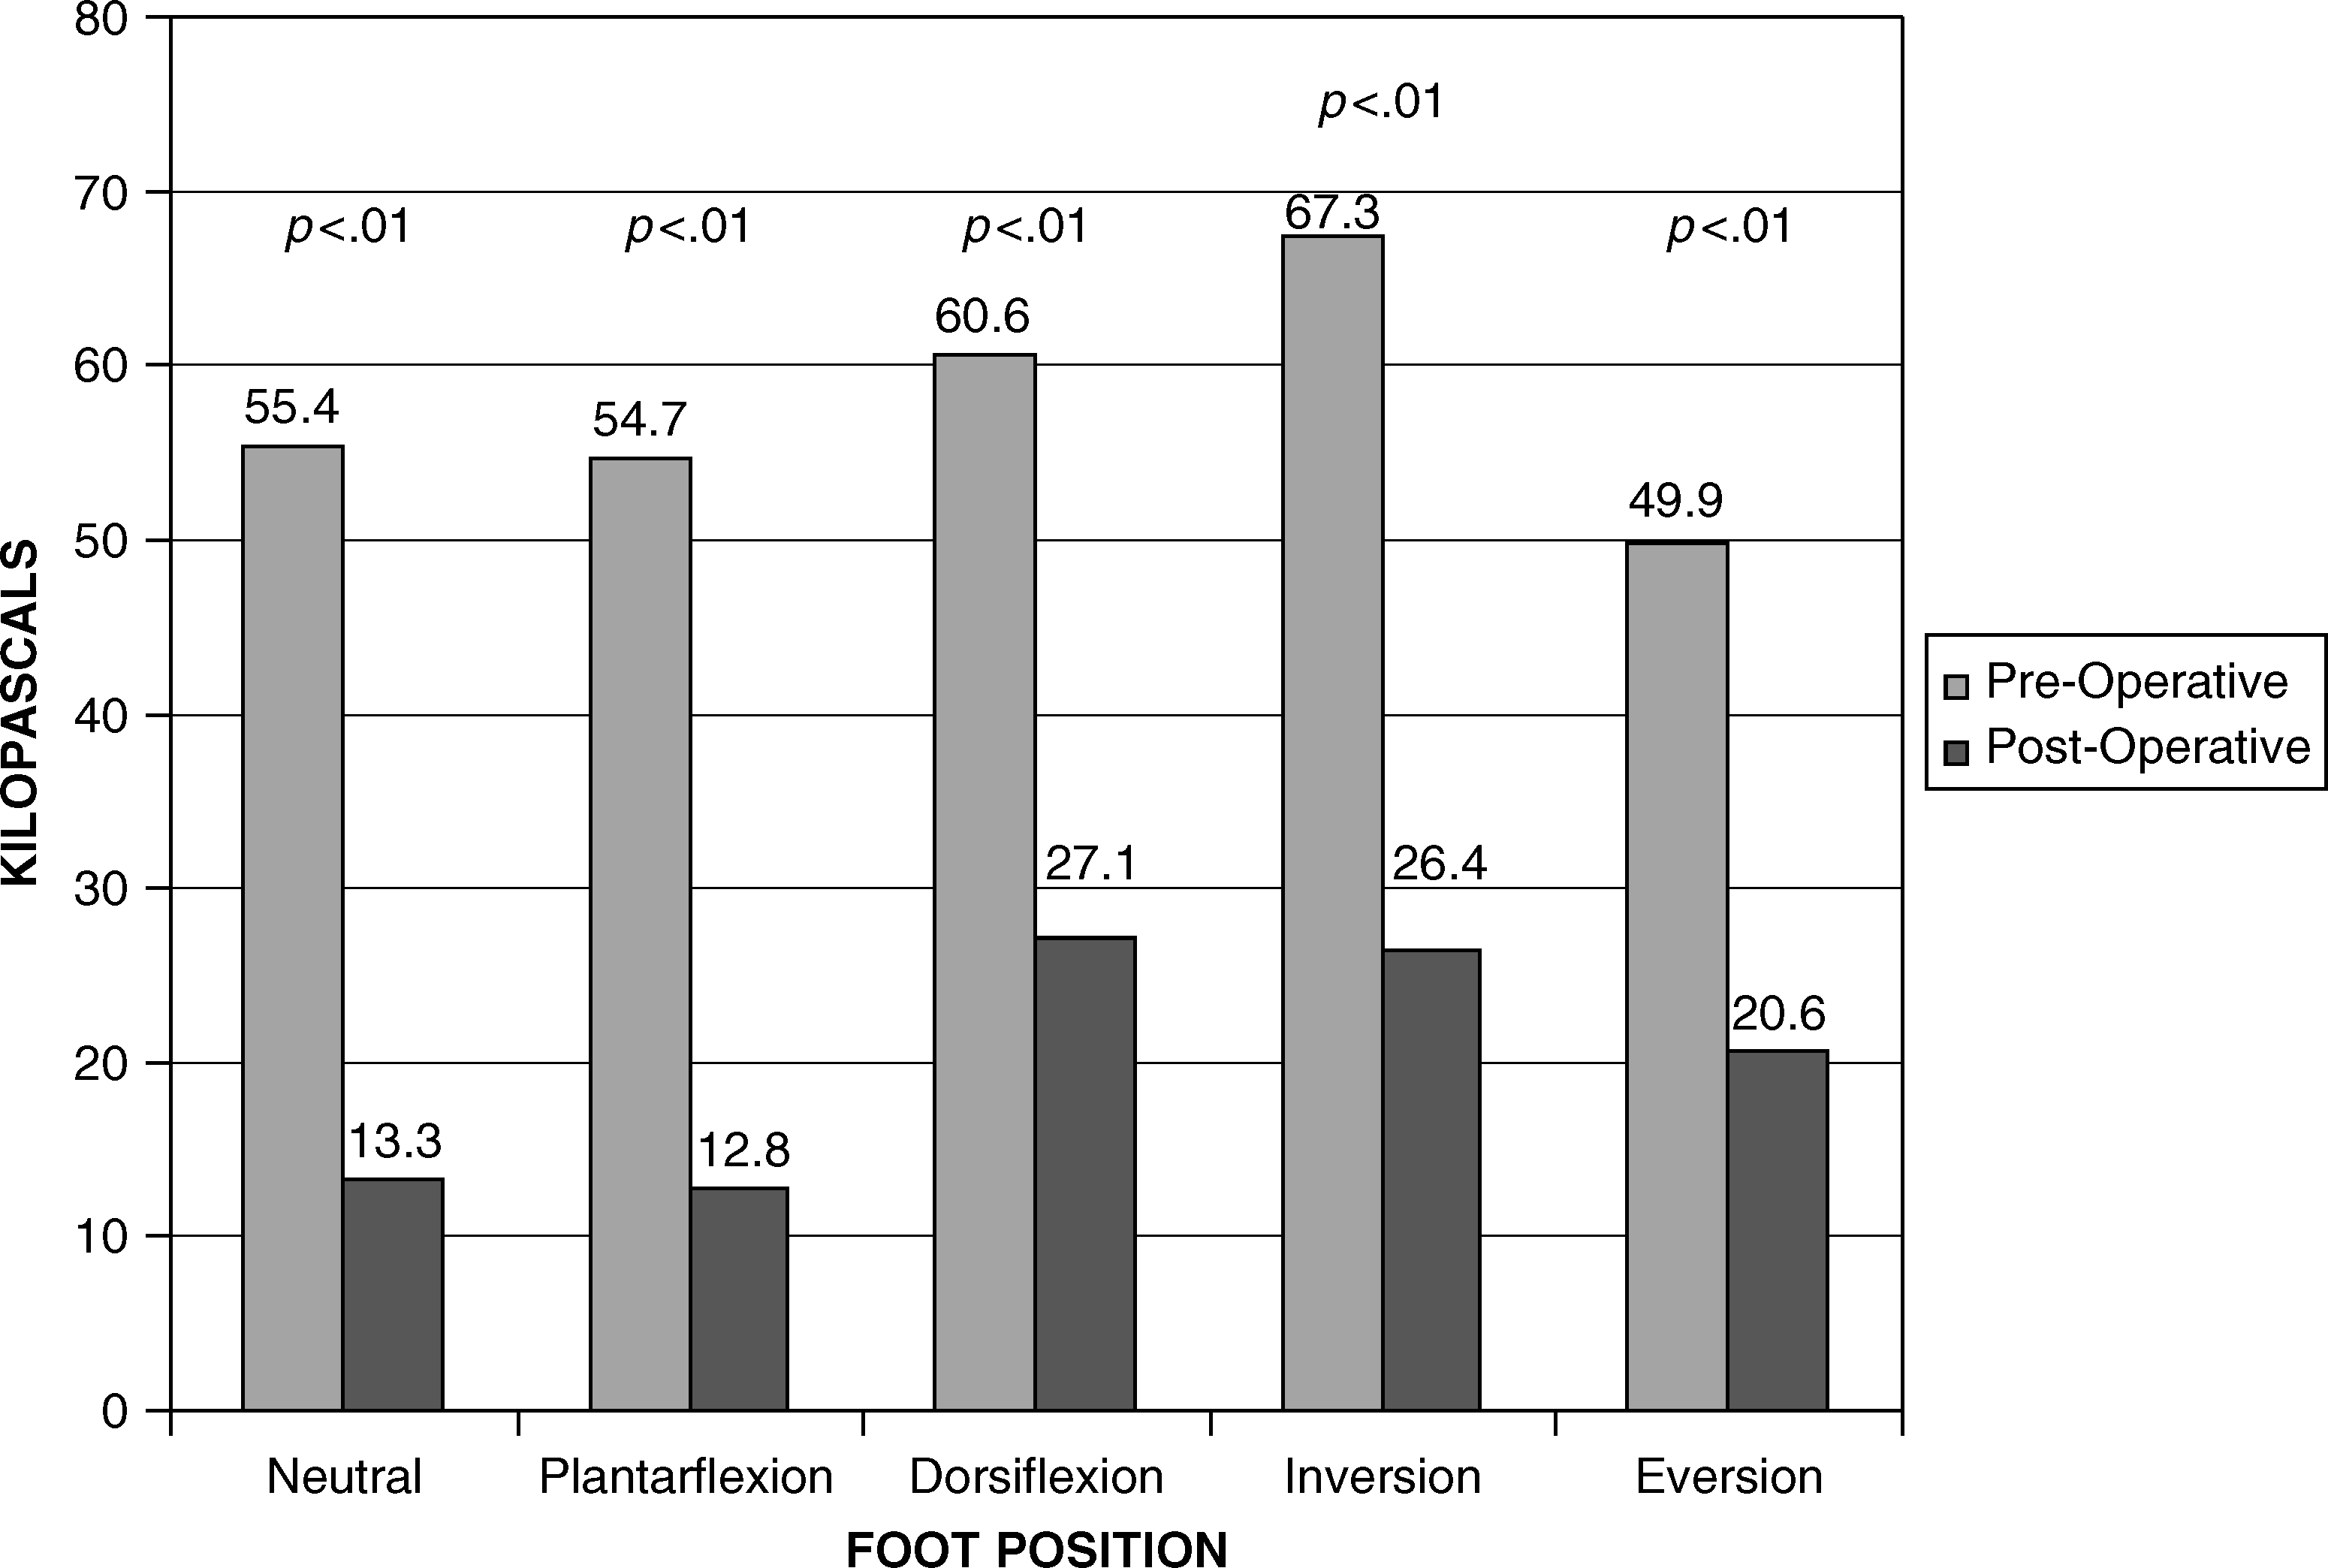
Graph of pressure readings at the distal groove (sensor 2).
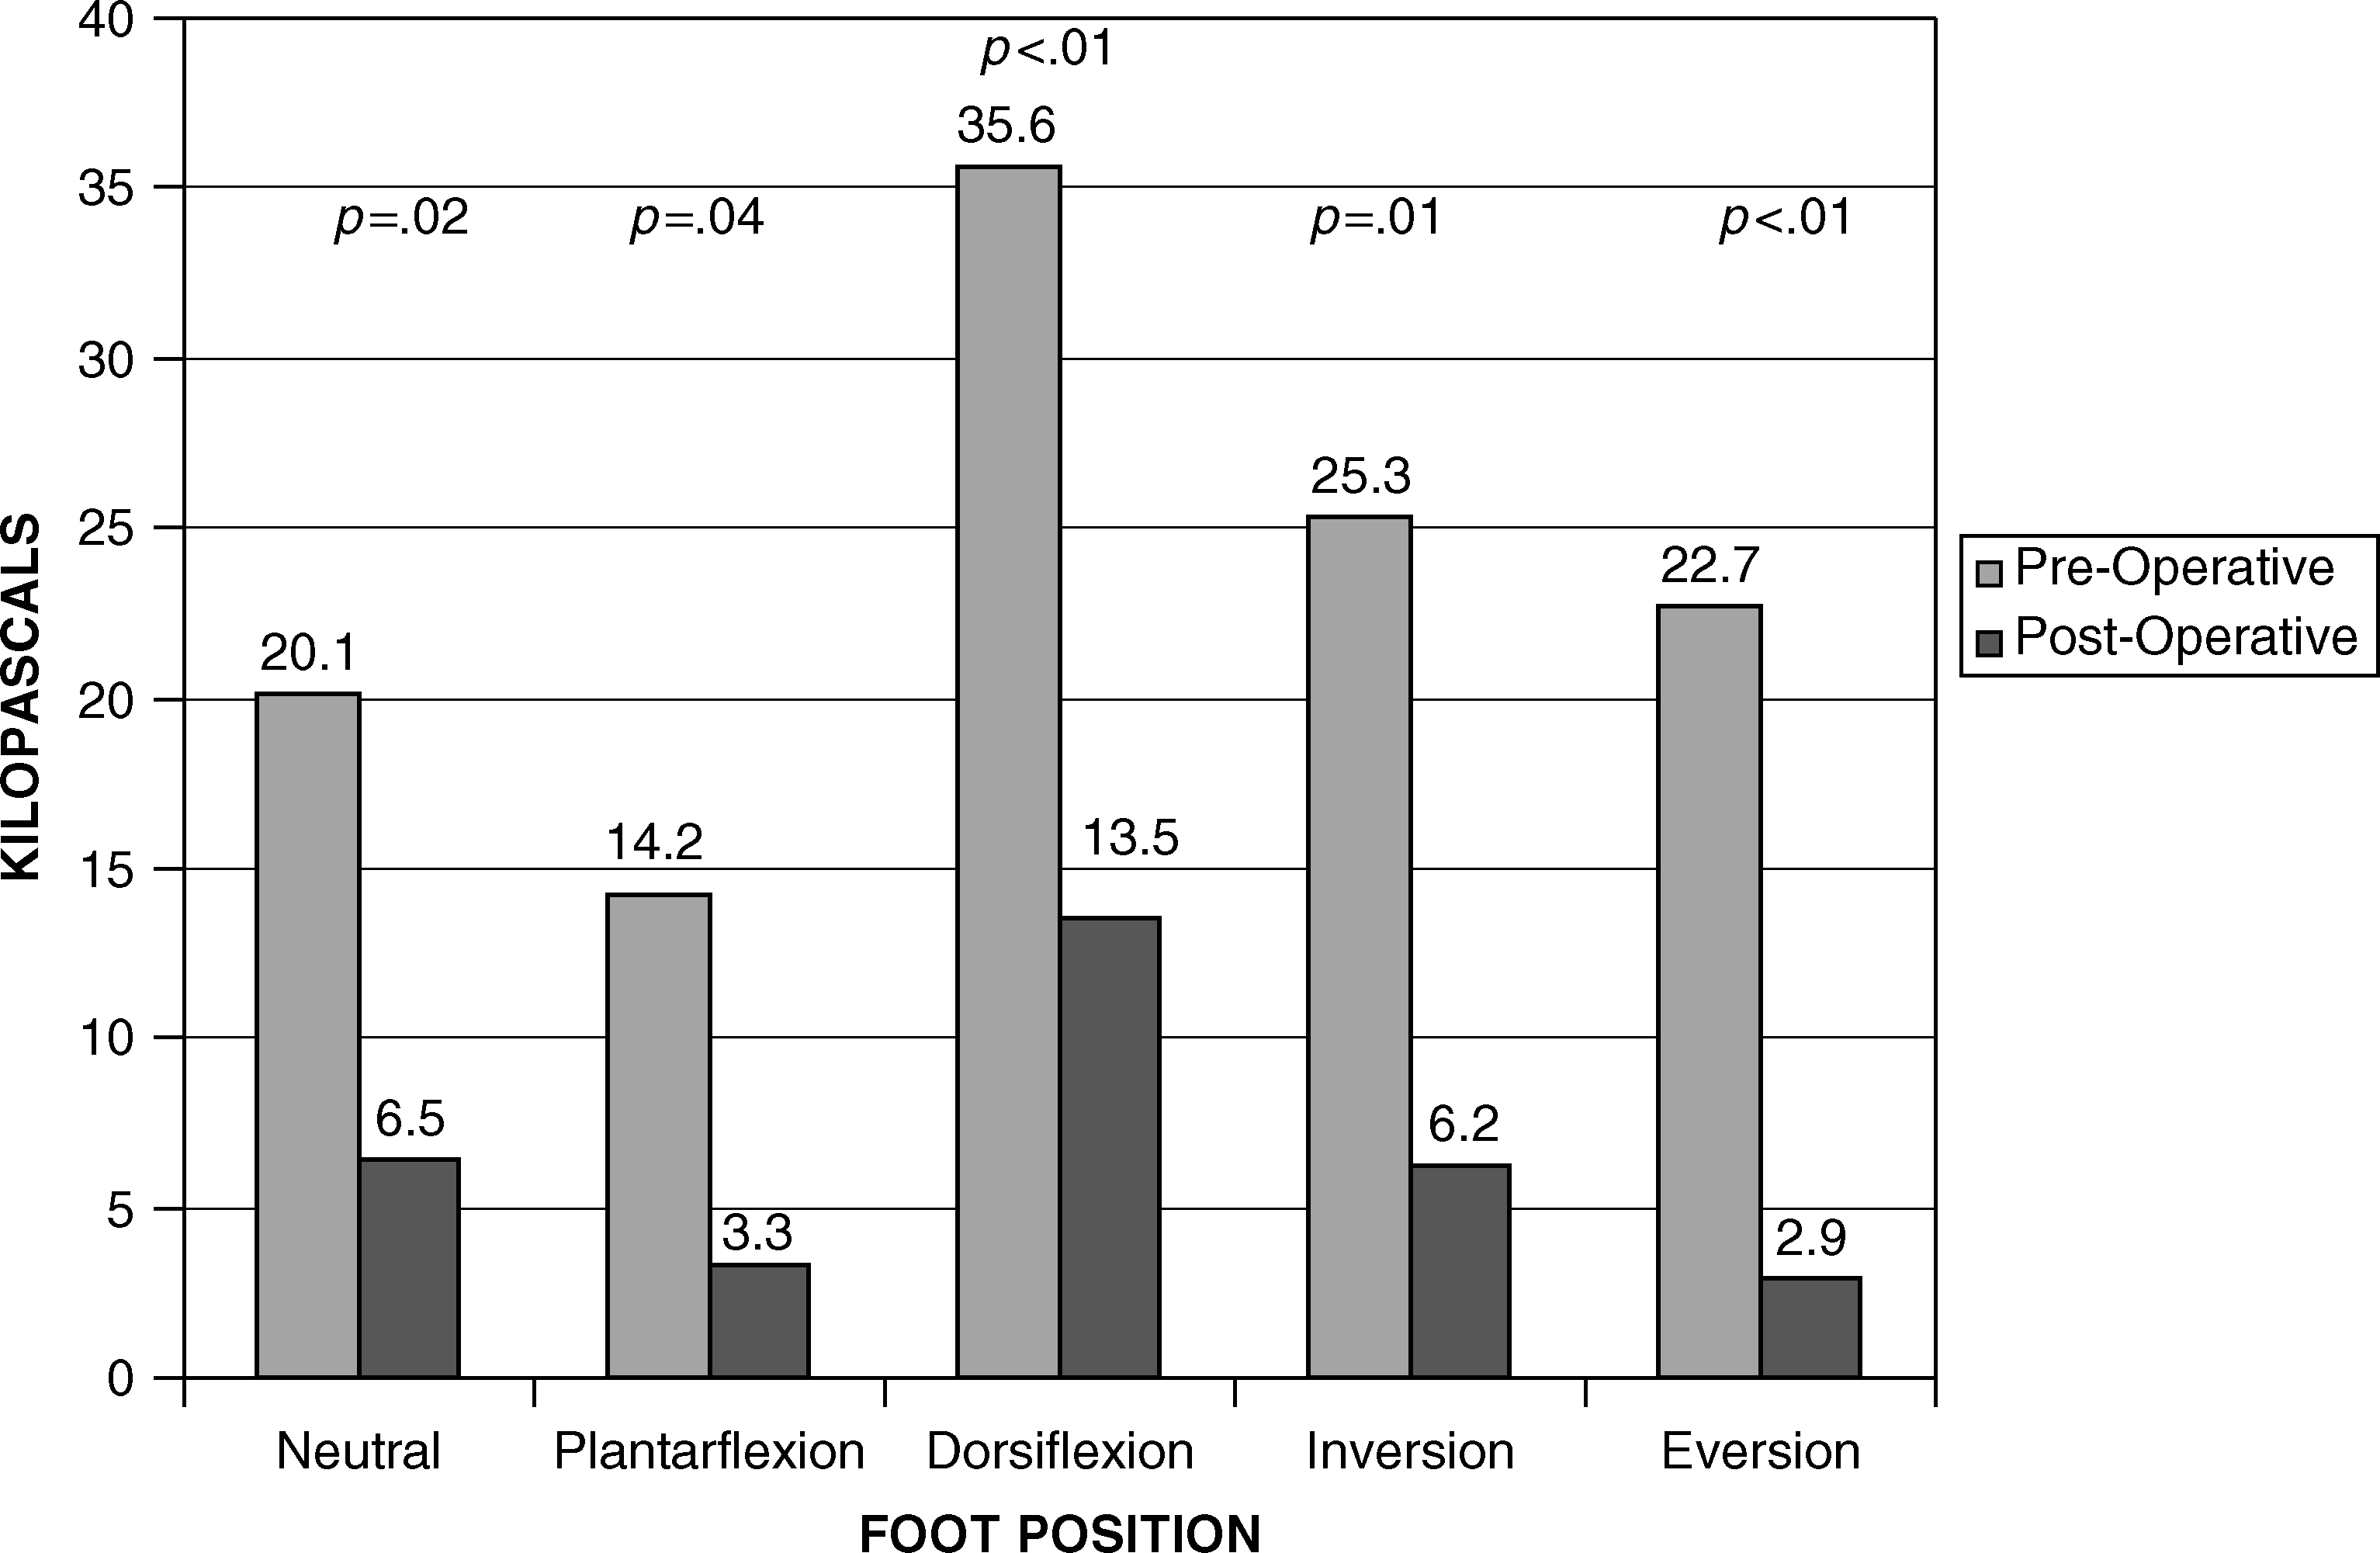
Graph of pressure readings in the middle groove (sensor 3).
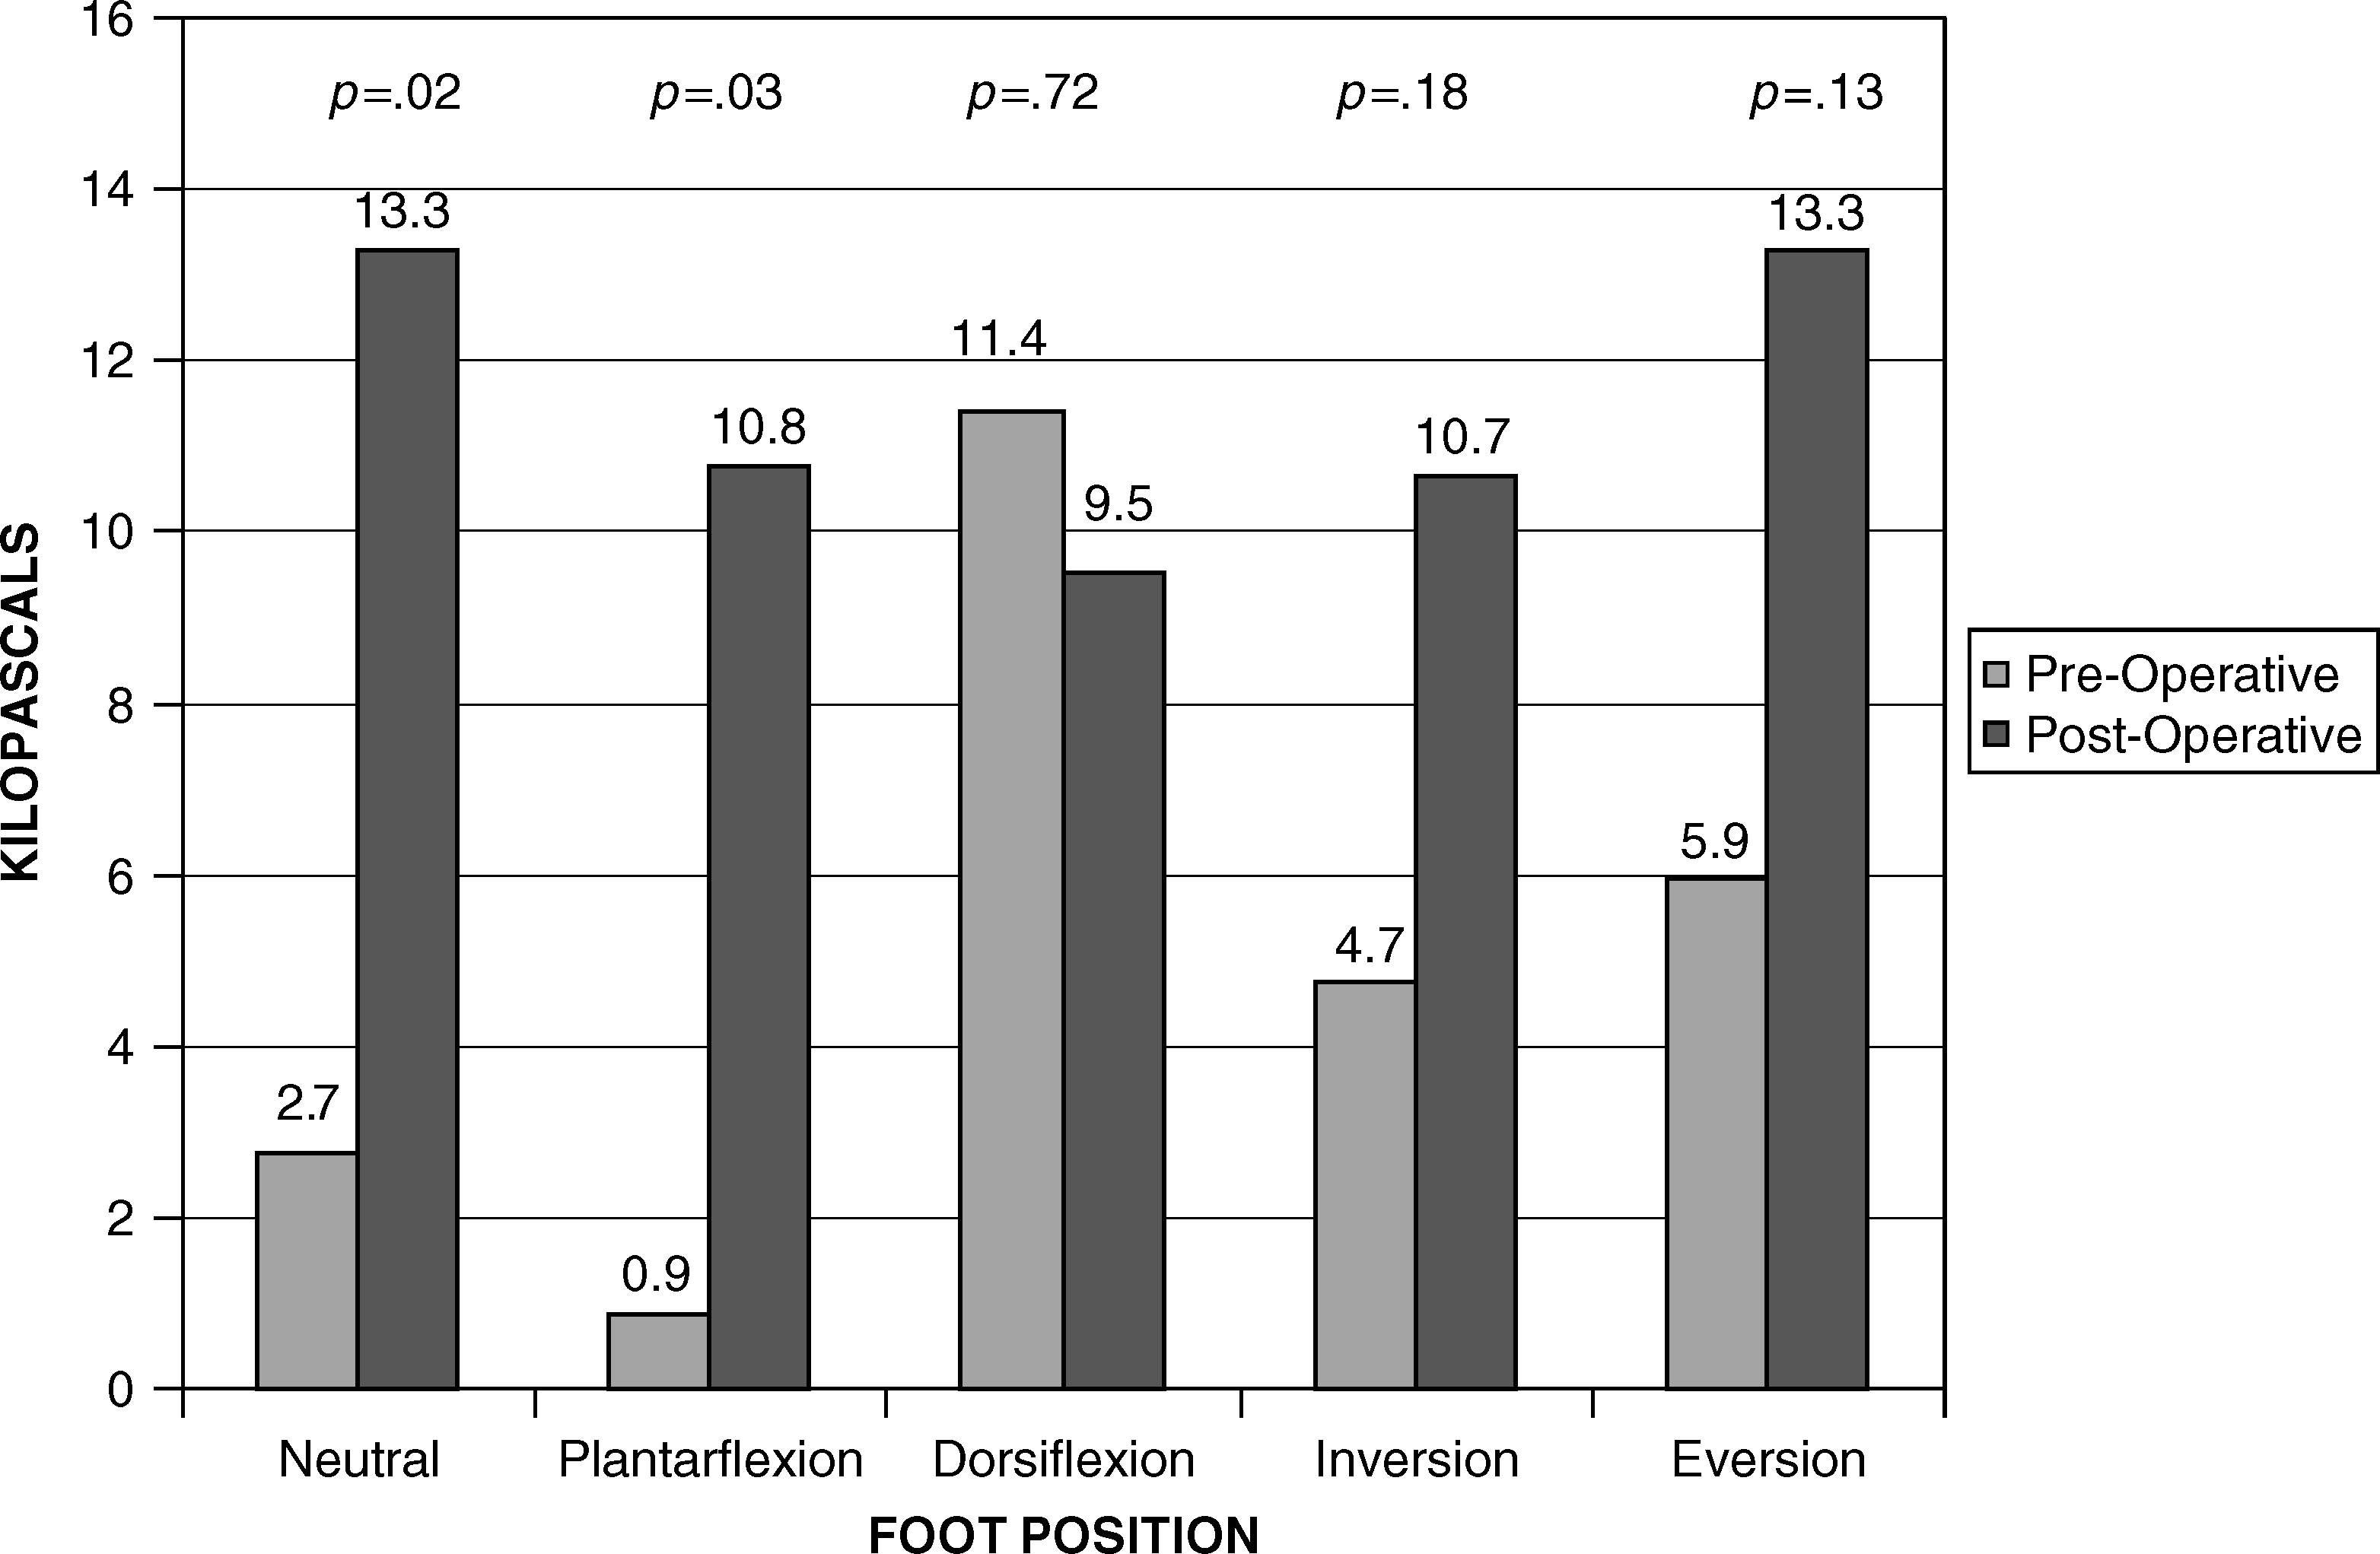
Graph of pressure readings in the proximal groove (sensor 4).
The computer sensor strip was placed within the tunnel itself, which may have elevated pressure readings within the groove. However, the effect on pressure resulting from the placement of the sensor in the groove is likely to be consistent before and after the procedure. Thus, relative change after the procedure should be an accurate indication of pressure change at each sensor.
Most patients with peroneal instability heal well with nonoperative treatment. If these approaches are not effective, groove deepening is one option for the treatment of recurrent peroneal tendon instability with or without peroneal tendinitis or partial tears.
This procedure may be beneficial in patients who are being operatively treated with debridement for persistent symptoms. Decreased groove pressures after this procedure also may limit stresses and reduce pain associated with partial peroneal tendon tears or chronic peroneal tendinitis. We have found improved results and lower recurrence rates with this procedure clinically, but clinical extrapolation of the current results is not possible. Studies currently are underway at our institution to evaluate the clinical outcomes of groove deepening.