
Abstract
Background: In ankles with end-stage osteoarthritis or after total ankle replacement (TAR), radiographic landmarks based on joint surface morphology usually are obscured and inadequate for measurement. Two methods for quantifying anteroposterior tibial-talar alignment without relying on those landmarks were identified in a corollary cadaver-based study. This study aimed to verify reliability and validity of those candidate measures. Methods: On clinical radiographs of 33 nonarthritic and 35 arthritic ankles, the anteroposterior tibial-talar alignment was quantified by the two methods; the tibial-axis-to-talus ratio (T-T ratio: the ratio into which the midlongitudinal axis of the tibial shaft divides the longitudinal talar length) and the posterior-tibial-line-to-talus ratio (P-T ratio: a similar ratio, but using the posterior longitudinal line along the tibial shaft). Two observers performed every measurement twice to evaluate intraobserver and interobserver reliability of the candidate measures. For nonarthritic ankles, the anteroposterior tibial-talar alignment was further determined by a control measure that directly quantified orientation of the talar dome relative to the tibial shaft. Correlation of the T-T and P-T ratios with the control measure was then evaluated for validity. Results: Measurement of the T-T ratio with arthritic ankles was highly reproducible with the coefficients of determination (R 2 ) greater than 0.95, for either interobserver or intraobserver. Correlation between this measure and the control measure was supported (R 2 = 0.60, p < 0.0001). Reliability of the P-T ratio also was strong (R 2 > 0.91), although both reliability and validity of this measure were relatively inferior to the T-T ratio. Conclusions: The T-T ratio reliably and validly described the anteroposterior tibial-talar alignment on clinical radiographs, regardless of the condition of ankle joint surface. This measure appears to be a reliable radiographic measure for determining the magnitude of anteroposterior talar subluxation in ankles with articular degeneration or after TAR and can facilitate clinical investigations.
INTRODUCTION
Anteroposterior ankle malalignment with end-stage osteoarthritis has been implicated in accelerating the rate of degeneration, 5,8 and anteroposterior implant malpositioning after total ankle replacement (TAR) has been considered a possible cause of premature implant failure. 1–4,6 However, reliable means to assess anteroposterior ankle alignment in these clinical conditions have not yet been well established. On radiographs of ankles with either severe articular degeneration or TAR implants, radiographic landmarks based on joint surface morphology usually are obscured and inadequate for measurement. Ankle alignment under such situations must be determined without relying on those landmarks. In addition, because of difficulty in reproducibly positioning the ankle for a standing radiograph, any radiographic measure to accurately describe ankle alignment needs to tolerate perturbations of ankle positioning on clinical radiographs.
To identify a radiographic measure of anteroposterior tibial-talar alignment that meets these requirements, several methods that do not rely on ankle surface landmarks were tested in a cadaver-based study. 7 The methods were compared in terms of sensitivity to perturbations of ankle positioning, and two of them were identified as best for clinical measurement. This study was done to assess the reliability and validity of those measurements in a clinical environment.
MATERIALS AND METHODS
Sixty-eight lateral standing ankle radiographs were collected in our foot and ankle clinic. Each radiograph captured one of two groups of ankles, either with articular degeneration associated with osteoarthritis (OA ankles) or without articular degeneration (non-OA ankles). Thirty-three radiographs of non-OA ankles were obtained from 27 patients (19 women, and eight men; ages 15 to 78 years). Diagnoses for these ankles included heel pain in 12 patients, Achilles tendinopathy in nine, subtalar arthritis in two, hallux valgus in two, metatarsalgia in one, and osteoarthritis of the contralateral ankle in one. Thirty-five radiographs of OA ankles were from 35 patients (21 women and 14 men; ages 45 to 82 years) who had TAR or ankle arthrodesis with an average 4.7 score on the Kellgren-Lawrence scale (range 3 to 5). Every radiograph included at least 10 cm of the tibial shaft and clear demarcation of the floor line. The radiographs were scanned and stored as digital images for on-screen image analysis.
On all radiographs, the anteroposterior tibial-talar alignment was quantified by two methods that do not rely on radiographic landmarks: 1) the tibial-axis-to-talus ratio (T-T ratio: the ratio into which the midlongitudinal axis of the tibial shaft divides the longitudinal talar length) and 2) the posterior-tibial-line-to-talus ratio (P-T ratio: a similar ratio, but using the posterior longitudinal line along the tibial shaft) (Figure 1). 7
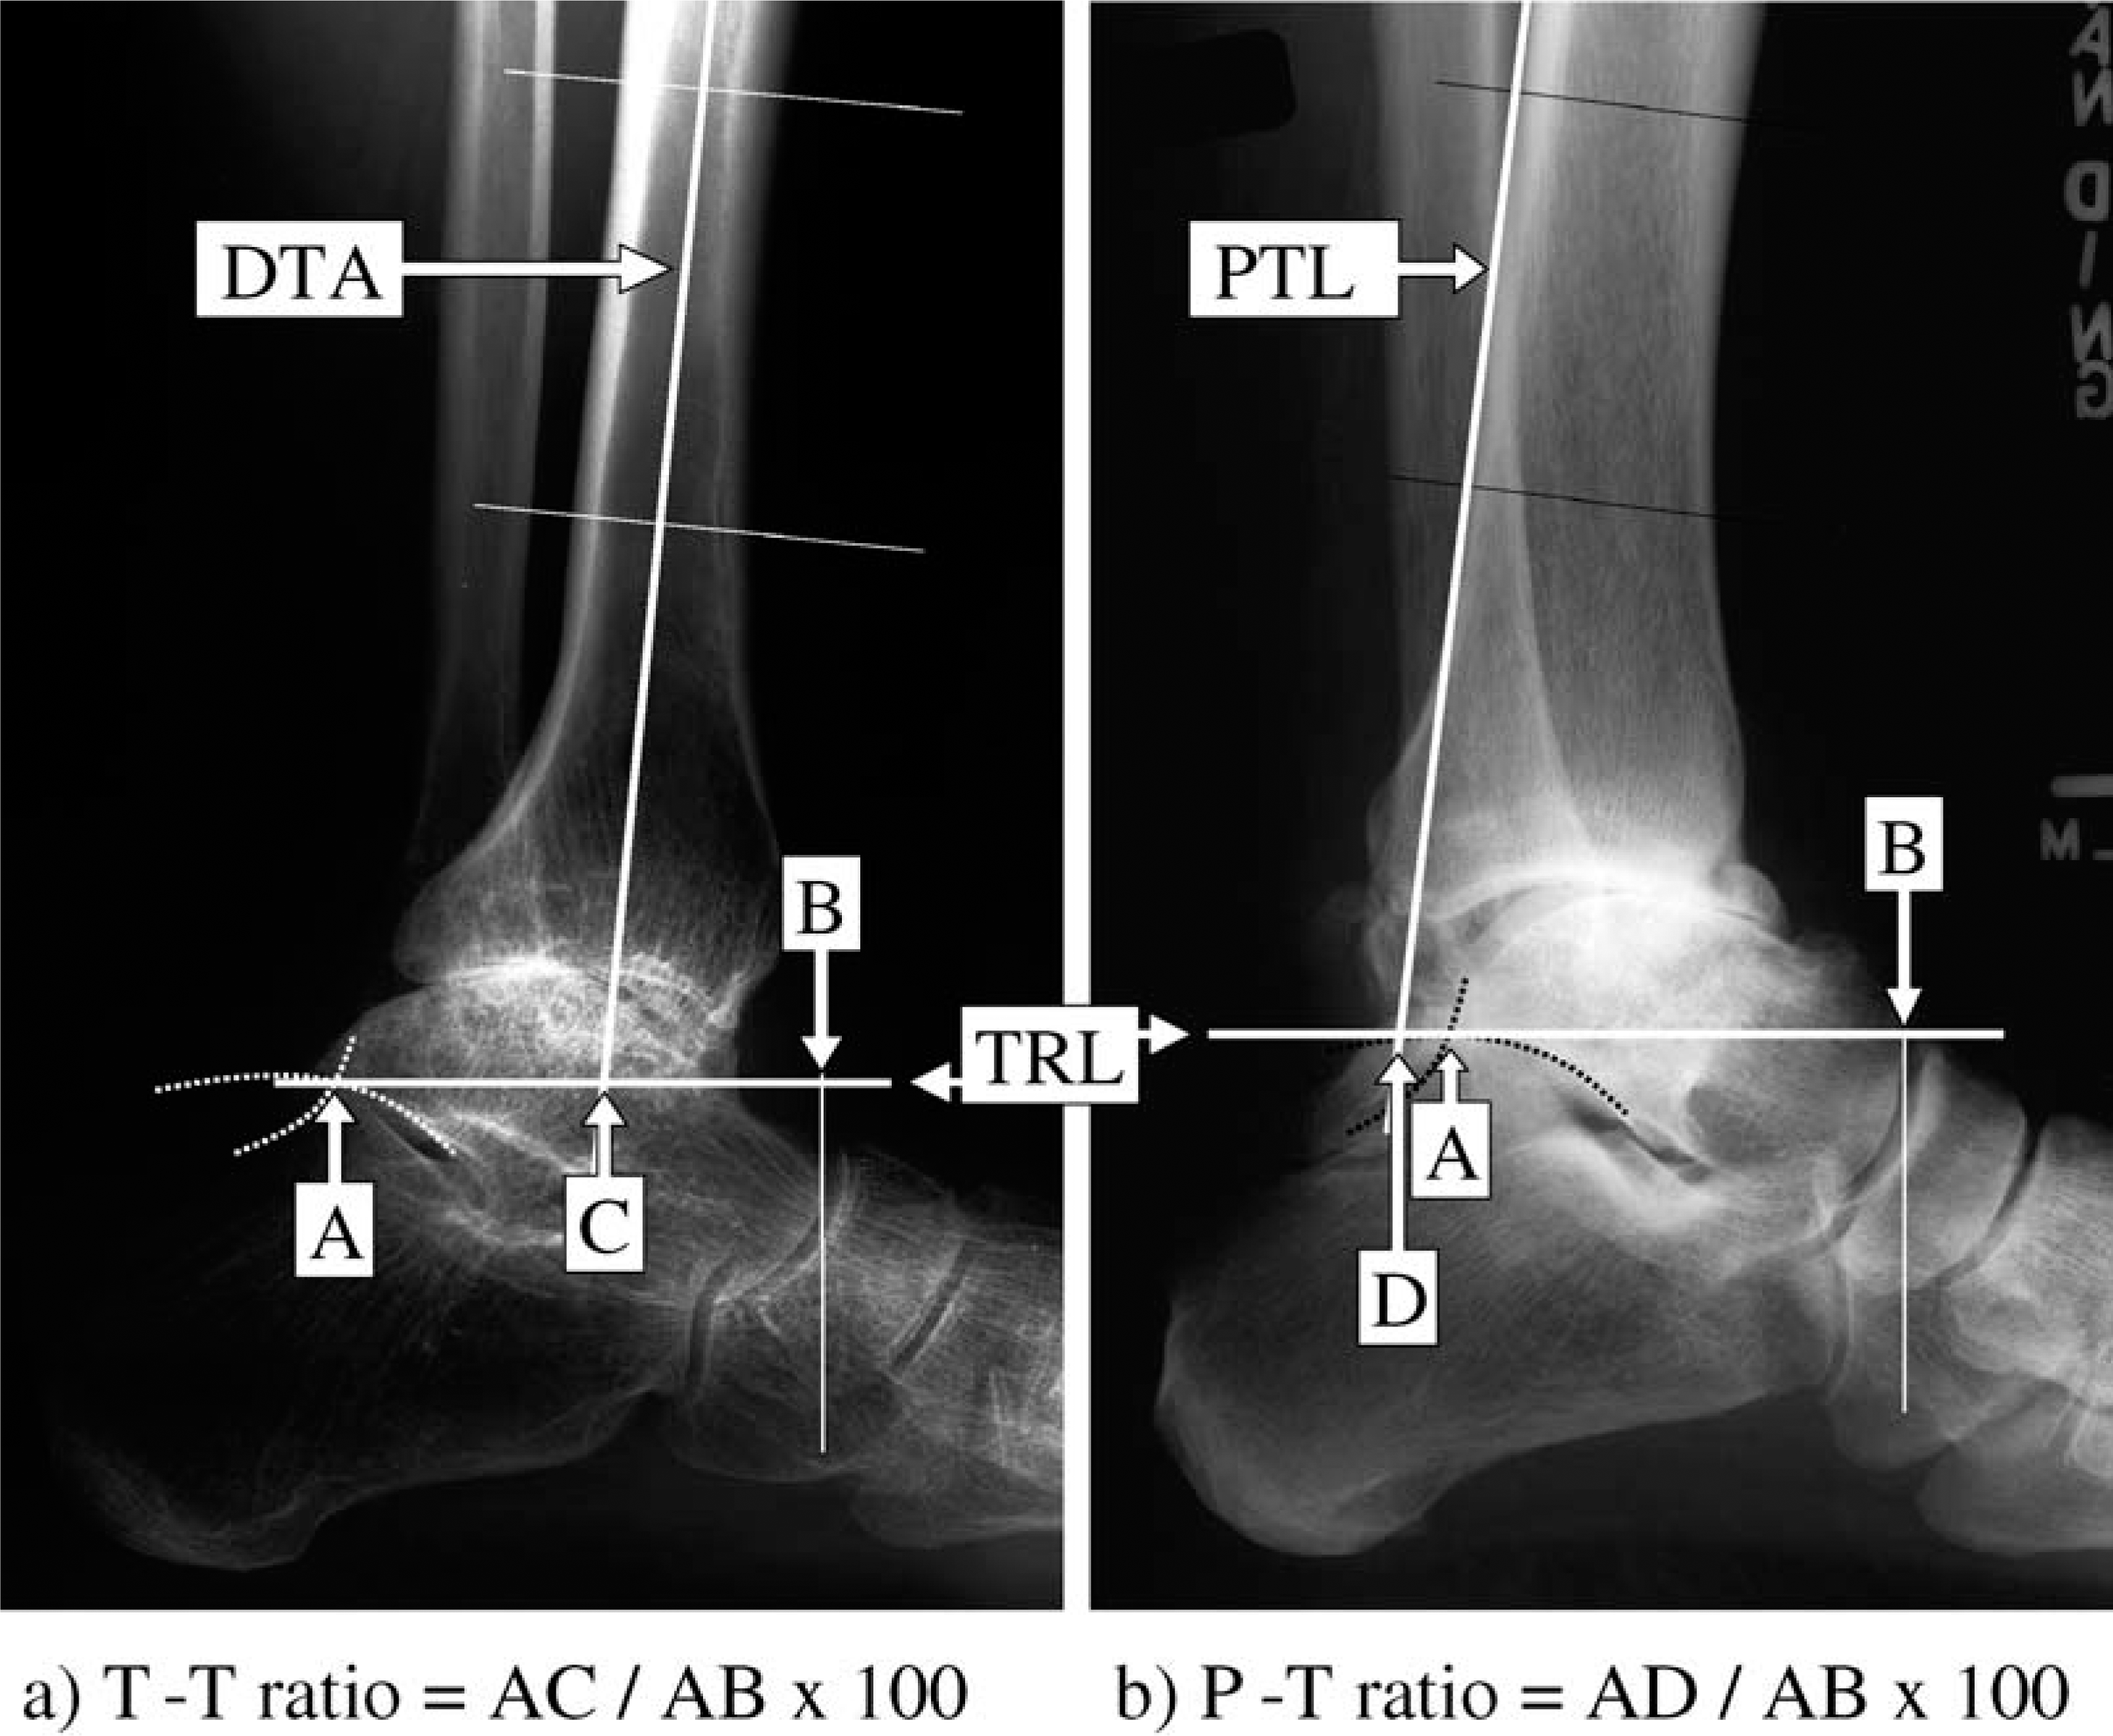
Radiographic measurement of T-T ratio (a) and P-T ratio (b) in an OA-ankle. Posterior talar point (point
In addition these measurements on radiographs of non-OA ankles, anteroposterior orientation of the talar dome with respect to the tibial midlongitudinal axis was quantified as a control measure. The center point of the talar dome was identified as the center of the arc through three (anterior-quarter, middle, and posterior-quarter) points on the lateral projection of the central groove contour. Perpendicular distance from the tibial axis to the talar dome center was then measured and normalized to the longitudinal talar length. When the talar dome center was posterior to the tibial axis, this measure was recorded as a negative value.
Radiographic measurement was done with use of a custom digitizing program based on PV-WAVE® (Version 6.21, Visual Numerics, Inc., San Ramon, CA). 7 All radiographs were measured by two trained observers (J-SS and YT), and each observer performed every measurement twice. Intraobserver reliability was evaluated by linear regression between the outputs of the first and second measurements, and intraobserver error was calculated as the absolute difference between measurements. The mean values of those two trials were similarly analyzed for interobserver reliability. Those reliability analyses were done separately for each group of ankles. Finally, values averaged across observers were recorded as the final measures.
The data of the control measure in non-OA ankles were similarly calculated. For assessing validity of each method, the correlation with this control measure was evaluated by linear regression.
RESULTS
The T-T ratio averaged 34.8% ± 3.8% in non-OA ankles and 37.1% ± 11.6% in OA ankles (Figure 2, A). The P-T ratio averaged 10.2% ± 4.7% in non-OA ankles and 12.8% ± 11.7% in OA ankles (Figure 2, B). On three of the 35 OA ankle radiographs, some landmarks were unidentifiable (because of a triple arthrodesis in two and severe tibial shaft deformity in one), and these ankles could not be measured with either of the methods.
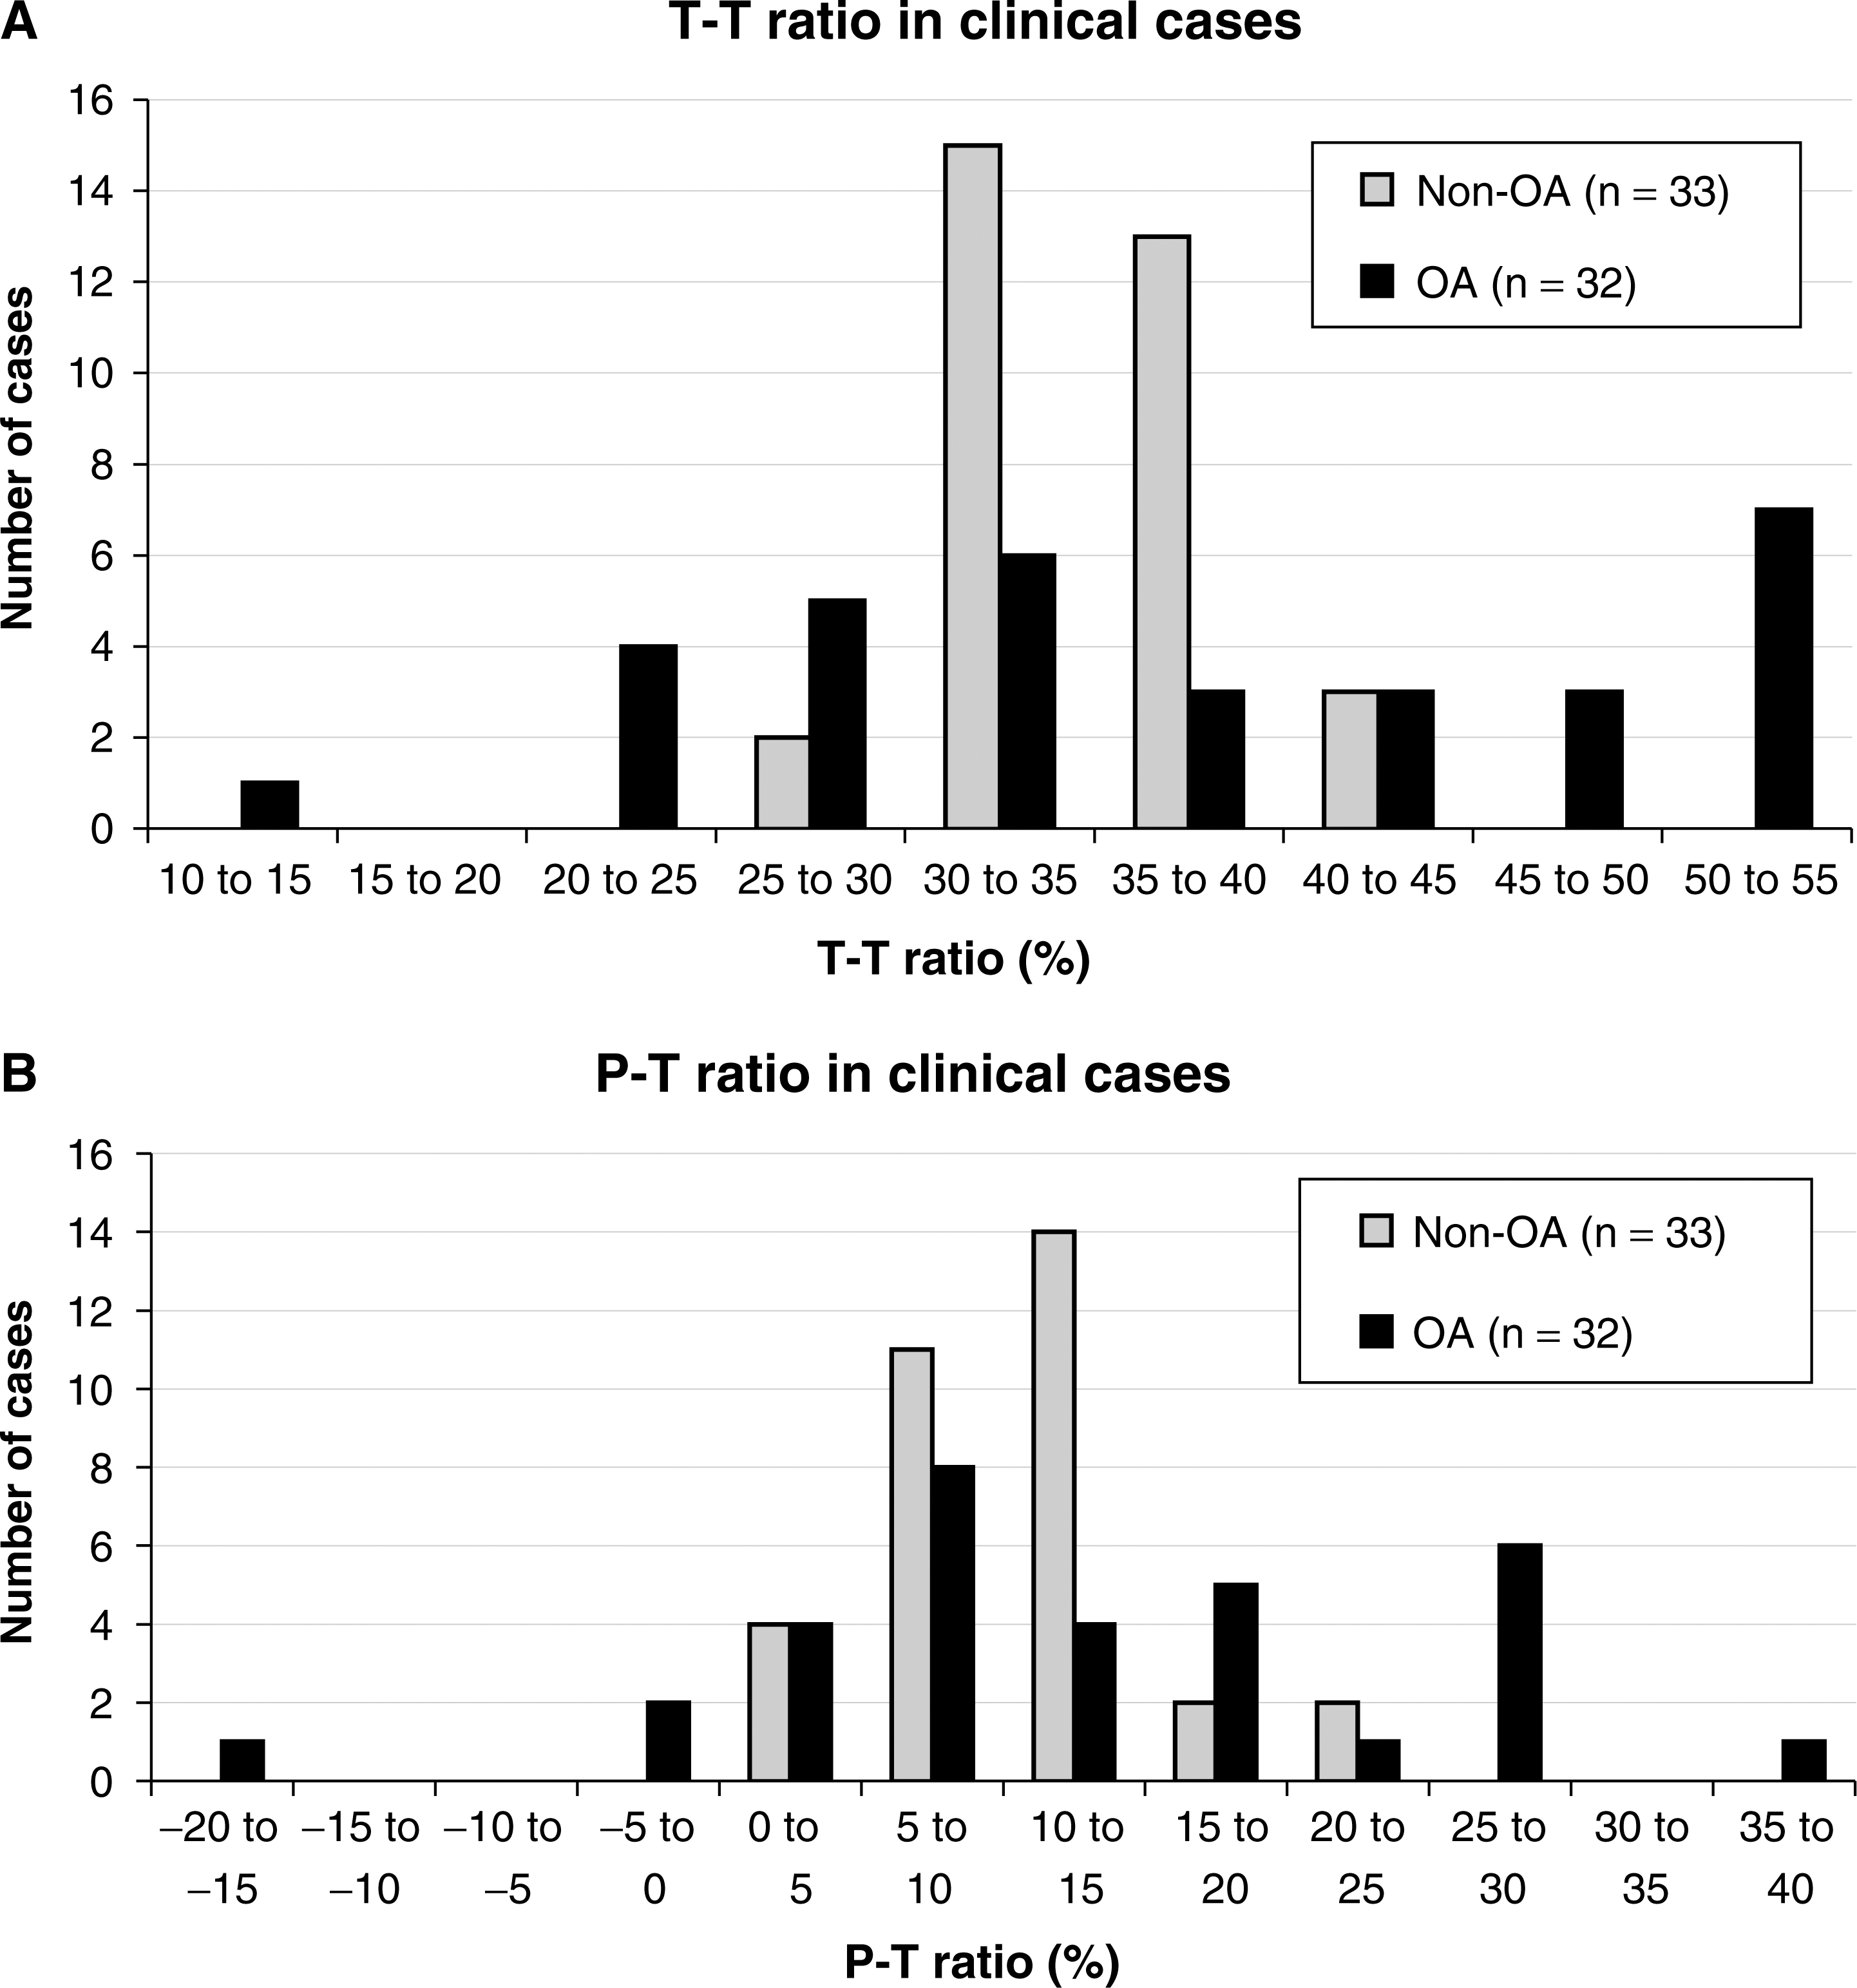
Histograms of anteroposterior tibial-talar alignment quantified by (
The T-T ratio in OA ankles was reproducibly measured, as evidenced by the coefficients of determination (R 2 ) greater than 0.95 for either intraobserver or interobserver reliability, and by inter- or intraobserver error averaging 2% (Table 1). In non-OA ankles, R 2 -values were 0.84 to 0.85. However, the associated intraobserver and interobserver errors were smaller than the corresponding data for OA ankles. Reliability of the P-T ratio was slightly less than that of the T-T ratio, although R 2 -values remained greater than 0.92 with OA ankles and averaged 0.8 with non-OA ankles.
Reproducibility of measurement (R-square value/mean error ± standard deviation)
Correlation with the control measure was significant either with the T-T ratio (R-square = 0.60, p < 0.0001), or with the P-T ratio (R-square = 0.49, p < 0.0 × 001) (Figure 3).
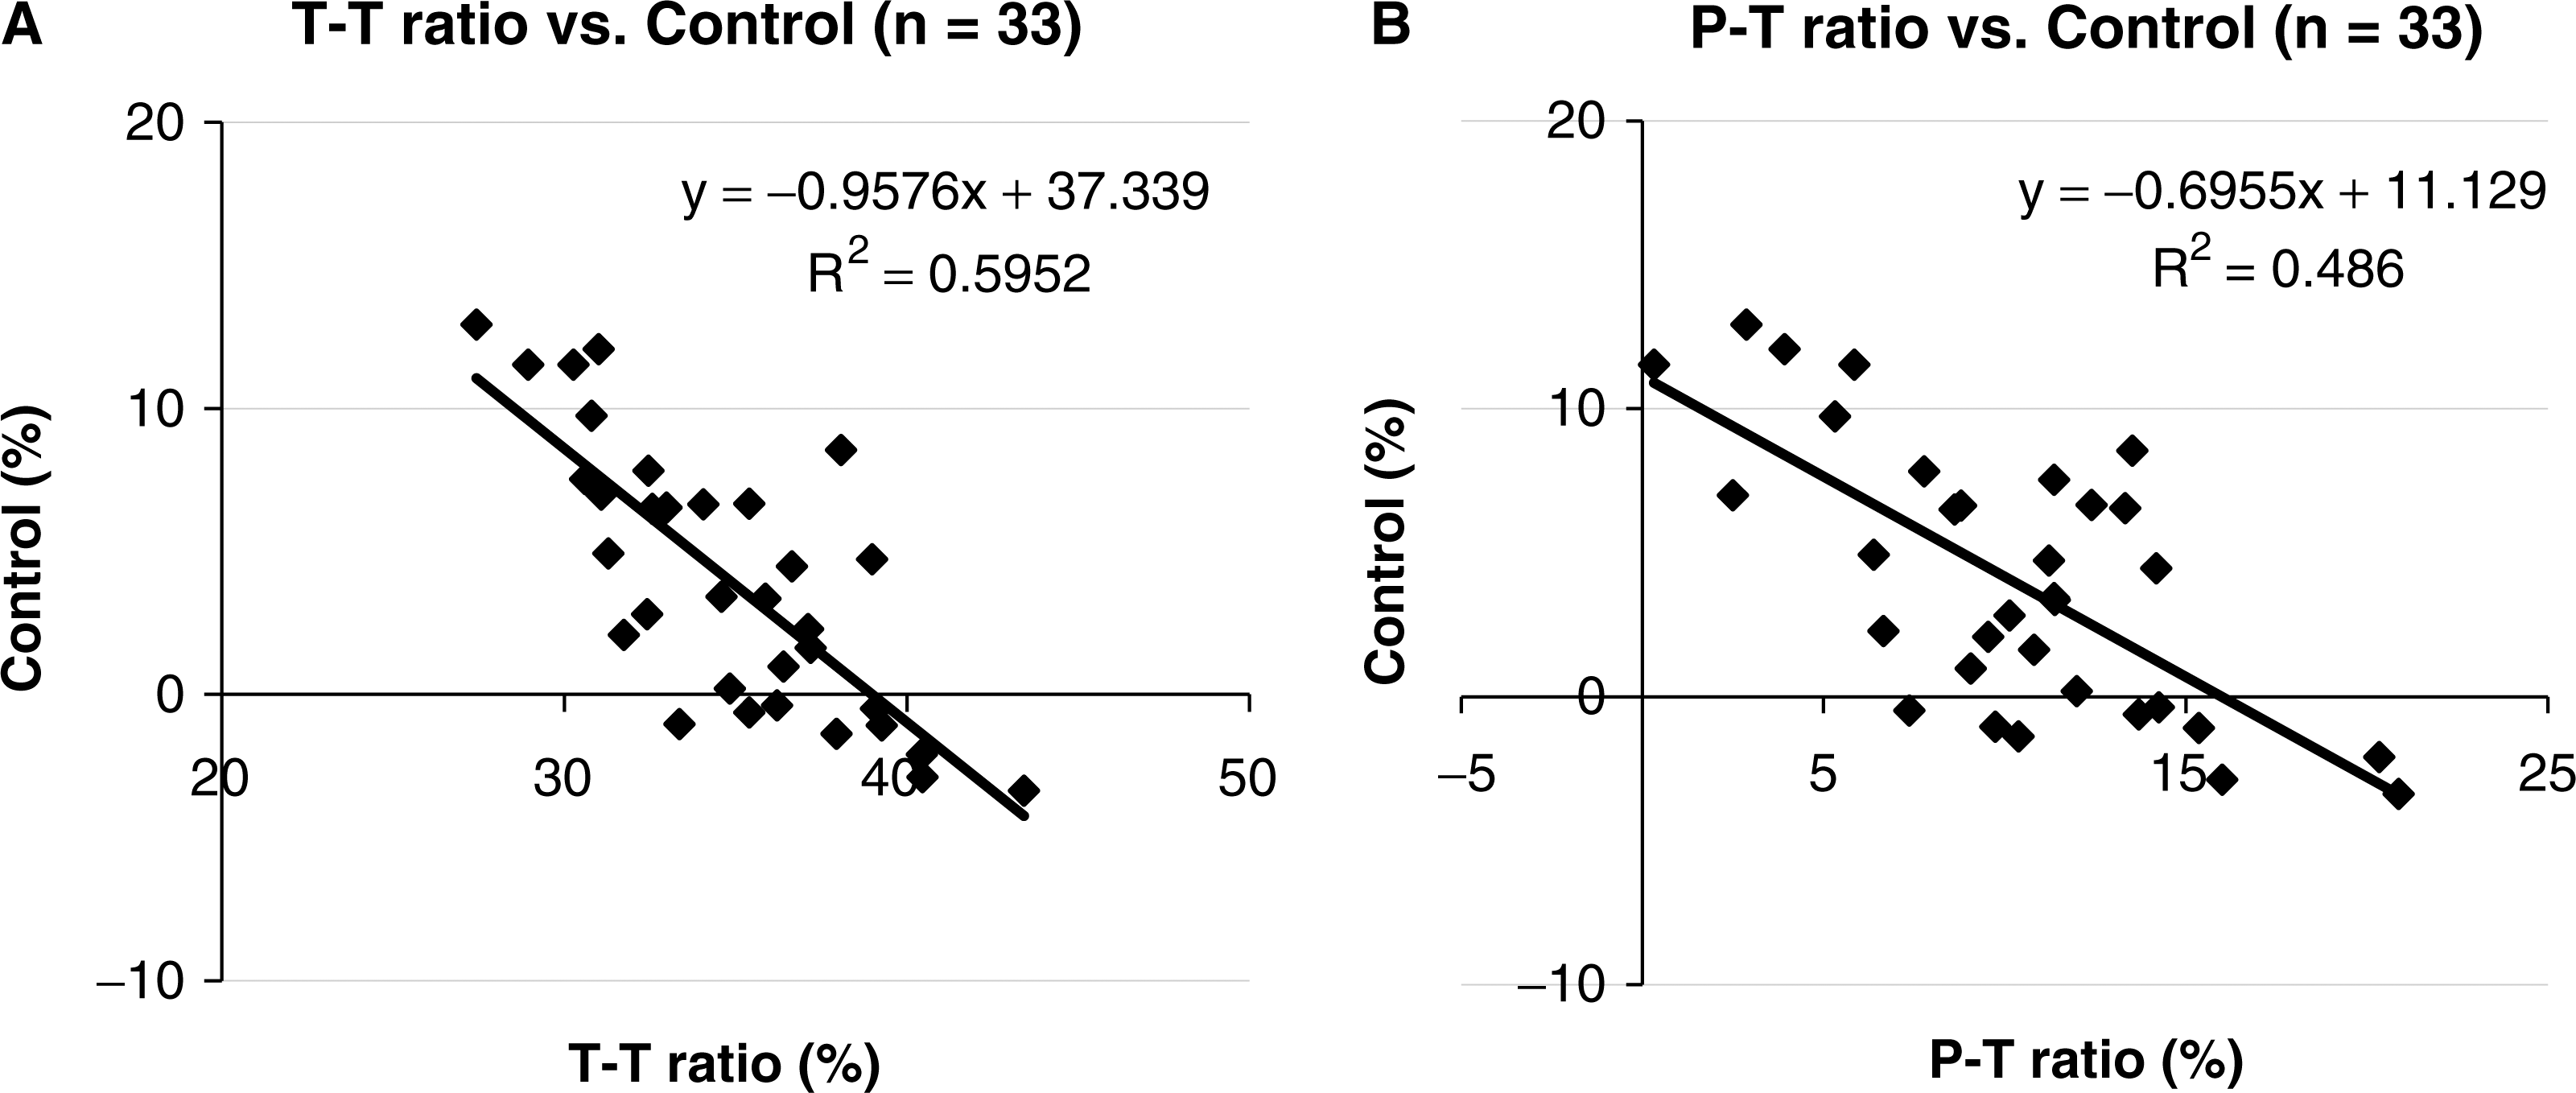
Correlation with the control measure of (
DISCUSSION
High reliability of the T-T ratio was demonstrated in the measurement for OA ankles. With non-OA ankles, although the reported R 2 -values were smaller, this reduction was associated with the relatively narrow distribution in non-OA ankles. Indeed, the associated interoserver and intraobserver errors were smaller in non-OA ankles than in OA ankles. The T-T ratio appears to be meaningfully reliable in clinical settings regardless of the condition of ankle joint surface.
In the determination of the anteroposterior tibial-talar alignment of non-OA ankles, the T-T ratio showed a correlation with the control measure that directly quantified the anteroposterior orientation of the talar dome with respect to the tibia. The reported R 2 -value again was likely affected by the narrow distribution of the T-T ratio in non-OA ankles. This measure appears to validly describe the anteroposterior orientation of the talus under the tibia. In clinical situations, even when the contour of the talar dome is deformed by articular degeneration, anteroposterior talar orientation can be appropriately described by the T-T ratio. This measure is capable of quantifying the magnitude of anteroposterior talar subluxation.
The T-T ratio in OA ankles was distributed more widely, including both smaller and larger values, than in non-OA ankles. This implies that variance of the anteroposterior tibial-talar alignment is associated with articular degeneration with osteoarthritis. If the 95% confidence interval in our non-OA data (from 27% to 42%) is taken as representative of the normal range for healthy populations, five of the 32 OA ankles had anterior subluxation of the talus, and 11 had posterior subluxation. Either direction of subluxation is likely common in end-stage ankle osteoarthritis and possibly plays a role in an accelerated rate of articular degeneration. To clarify this effect, longitudinal clinical investigations are needed.
Regarding both reliability and correlation with the standard measure, the P-T ratio was slightly inferior to the T-T ratio. However, the P-T measure potentially serves as a quick means to assess anteroposterior tibial-talar alignment, especially when focusing on the intersection of the posterior tibial line with the posterior subtalar facet. Indeed, based on the 95% confidence intervals of our non-OA data (from 1% to 20%), this intersection normally should be anterior to the posterior edge of the posterior facet. If the posterior longitudinal line of the tibial shaft falls posterior to this point, the talus is likely to be anteriorly displaced.
With both of these measurement methods, the posterior endpoint of the talus is identified not as an absolute point on a single radiographic landmark, but as a relative point where the extended contours of the subtalar articular surface and the posterosuperior calcaneal cortex intersect. This definition was chosen because ankle arthritis often involves degeneration or dislocation of the subtalar joint (or both), either of which obscures the posterior contour of the talus. As a result, these methods are applicable to most patients regardless of the condition of ankle joint surface, except those with a deformed distal tibial shaft or with a fused subtalar joint.
Based on this study, the T-T ratio appears to be a valid and reliable radiographic measure that is applicable regardless of ankle surface conditions. To explore the effect of anteroposterior talar subluxation on an accelerated rate of articular degeneration with osteoarthritis or to determine the importance of implant positioning with TAR, measurement of the T-T ratio on plain lateral radiographs will serve as a reliable and practical means to assess anteroposterior ankle alignment. In the clinic, assessing the orientation of the posterior longitudinal line of the tibial shaft relative to the posterior facet of the subtalar joint can quickly identify anterior subluxation of the talus.
Footnotes
Acknowledgements
Financial assistance was provided by NIH Grant AR 48939