
Abstract
Background:
The sagittal relationship of the talus to the tibial shaft can prove invaluable to the orthopedist in understanding and effectively treating ankle pathologies such as ligamentous laxity and ankle arthritis. Any useful radiographic analysis tool to assess the lateral position of the talus must be employable reliably in the clinical setting. Previously published measurements to assess the lateral translational relationship of the talus relative to the tibial axis may not be available in the clinical setting or may be subject to significant inaccuracies. We have defined a sagittal talar position measurement (lateral talar station; LTS), which we postulated could be used reproducibly on clinical radiographs by the orthopedist to define the position of the talus as it relates to the anatomic tibial axis. In addition, we defined the normal range of the LTS measurement.
Methods:
A retrospective cohort of patients (121 ankles, 104 patients) who presented to our clinic with foot pain between 2005 and 2011 was evaluated for inclusion in the study. Exclusion criteria included patients with ankle trauma, instability, prior ankle surgery, or radiographic evidence of ankle osteoarthrosis. The final cohort consisted of 82 ankles. The LTS was measured digitally for each subject on weight-bearing lateral ankle radiographs by 3 observers. The mean LTS and standard deviation was determined for the entire cohort. In addition, as a means of validating our methodology, we performed an assessment of interobserver and intraobserver reliability in terms of the LTS measurements.
Results:
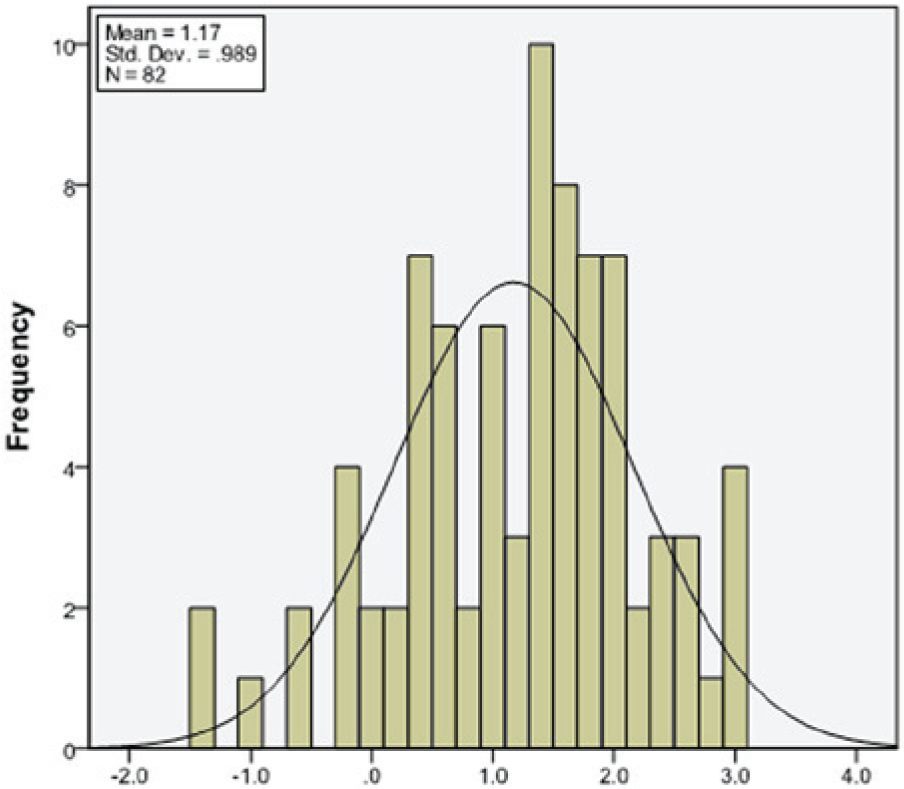
The LTS measurements for the entire cohort fit a Gaussian distribution with a mean of 1.17 mm (SD = 0.9893 mm). Interobserver intraclass coefficients for 2 observers (medical student and radiologist) and intraobserver intraclass coefficients for 1 reader (orthopaedic surgeon) indicated excellent reliability, being above 0.9.
Conclusion:
The LTS was a reliable measure that could be used on weight-bearing lateral ankle radiographs to define sagittal position of the talus in a clinical setting. The normal distribution for the LTS was described in our study population.
Level of Evidence:
Level IV, case series.
The joint reaction forces of the ankle can reach 3.5× body weight during the low demand activity of normal gait and need to be transmitted over a substantially smaller surface area than that of the hip or knee. 13 Changes of 10 to 15 degrees in the distal tibial angulation in either sagittal or coronal planes decrease the ankle contact area by a minimum of 10%.12,19,20 Anterior ankle articular contact stress is known to increase with anterior angular deformity of the distal tibia.18,21,23 Increased posterior articular contact stress would likely be caused by posterior distal tibial angular deformity. 21 As such, favorable alignment is critical to the longevity of the native talocrural joint and malalignment may be a factor in accelerated ankle joint degeneration. It is known that sagittal plane deformities alter the mechanics and joint reaction forces to a greater degree than coronal plane deformities which are accommodated for by the subtalar joint.12,14,20 For this reason, correctly appreciating ankle alignment requires an accurate and reliable method of defining the sagittal tibial shaft axis and the location of the talus relative to this axis.
The weight-bearing ankle radiograph is a standard tool employed in clinical practice for assessment of ankle pathology and alignment.8,9 The majority of interest radiographically has focused on coronal alignment in the region of the tibiotalar joint and hindfoot.2-4,6,16 Coronally, the angle of the distal plafond is 93 degrees as it relates to the tibial shaft with variances of up to 10 degrees of valgus.7,17 For hindfoot alignment, the weight-bearing line of the tibia is known to fall within 8 mm of the lowest posterior calcaneal tuberosity point. 16 Previous work has indicated that there is approximately 10 degrees of anterior opening of the distal tibial plafond sagitally. 5
In addition to providing the distal tibial articular angulation, the lateral view also allows quantification of the sagittal talar station relative to the tibial axis. This allows the orthopedic surgeon to classify the talus as either anterior, neutral, or posterior. 21 Magerkurth et al and Barg et al described the TibCOR measurement (talar center of rotation relative to the anatomical axis of the tibia) to assess the sagittal translational relationship of the talus.1,11 Magerkurth et al showed that the axis of rotation of the talus in a normal population is a mean of 1.6 mm anterior to the axis of rotation of the tibia with a standard deviation of 2.2 mm using the TibCOR measurement that they described. 11 For this measurement, an undefined point in the proximal tibial shaft and a point in the distal tibial metaphysis are used to create a line intersecting these points that represents the tibial axis. This axis is then used to determine the position of the center of rotation of the talus (Figure 1), which is defined by the center of a circle concentric with the arc of the talar articular surface. However, by placing the distal point in the distal metaphysis, the shaft axis may be subject to tibial metaphyseal deformities and may not be a true anatomic representation of the overall tibial axis (Figure 2).
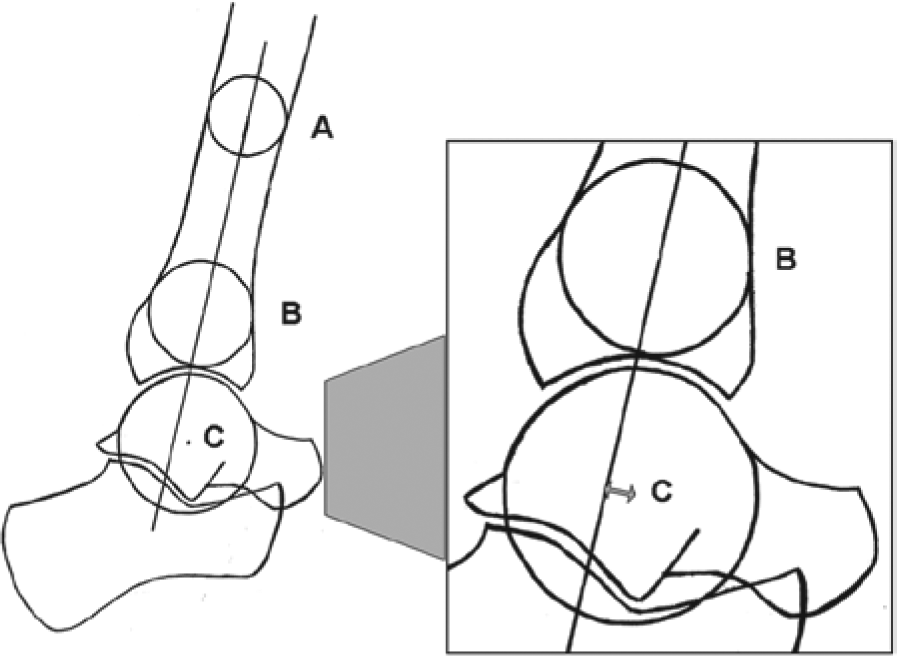
TibCOR measurement parameters. An undefined point in the tibial shaft (point A) was connected to a point in the distal tibial metaphysis (point B). A mid-diaphyseal line was made intersecting the center of the circles at points A and B and was extended distally. A third circle was made fitting the talar dome and the center of its rotation (point C) was measured perpendicularly to the tibial axis line. This distance was defined as the TibCOR.
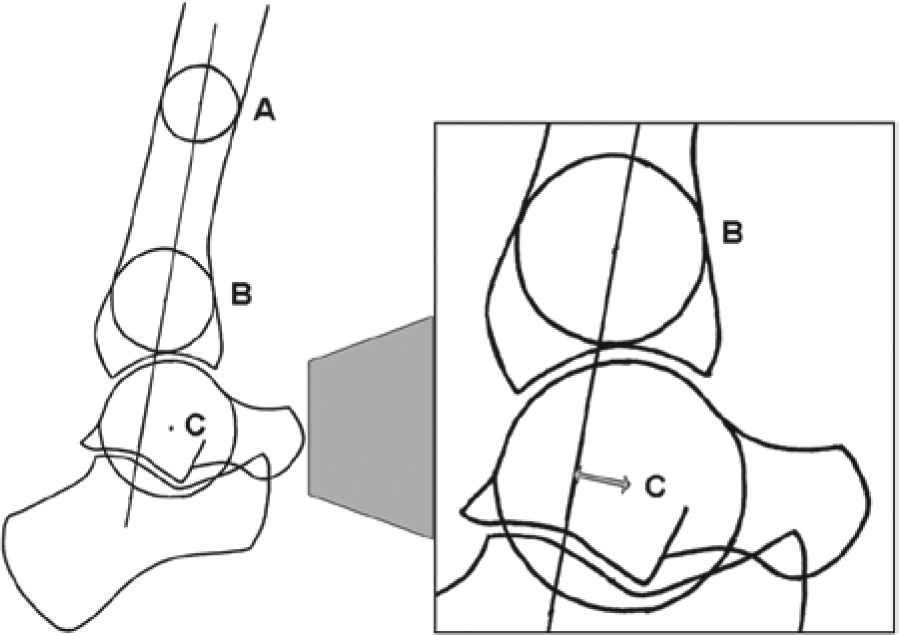
TibCOR measurement with tibial metaphyseal deformity. An undefined point in the tibial shaft (point A) was connected to a point in the distal tibial metaphysis (point B). A mid-diaphyseal line was made intersecting the center of the circles at points A and B and was extended distally. A third circle was made fitting the talar dome and the center of its rotation (point C) was measured perpendicularly to the tibial axis line. This distance was defined as the TibCOR. However, by placing the distal point in the distal metaphysis, the shaft axis was subject to metaphyseal deformities and may not have been a true anatomic representation of the overall tibial axis.
Other previously described measurements of the sagittal talar station include the tibial axis to talus (T-T) ratio, the posterior tibial line to talus (P-T) ratio and the tibial axis to lateral process (T-L) distance.14,21,22 The T-T ratio may be cumbersome for the general orthopedist to utilize in the clinical setting although it was shown to be least affected by transverse and sagittal positional variations of the foot and ankle. In addition, the T-T ratio is difficult to clearly delineate when subtalar degeneration or obscurity is present. The tibial axis was shown to pass through the lateral talar process in a plantigrade foot by Paley et al. 14 However, Tochigi et al have shown that the T-L distance is sensitive to transverse and sagittal plane angulation of the ankle.
Tochigi et al have shown that a tibial shaft length of 10 cm was adequate for determining the proximal intersection point of the shaft axis and that extending the length to 15 cm did not improve reproducibility. Furthermore, at 5 cm proximal to the tibial plafond, the effect of the conical distal tibial shaft did not substantially affect the outcome of the distal shaft axis intersection point, as a more distal point would. 22
The clinical weight-bearing lateral ankle radiograph is commonly affected by some degree of transverse plane angulation, which distorts the articular surface of the talus, creating 2 partly offset condylar curvatures. By treating the talus as a conical cylinder, the center of rotation of the talus can be approximated by a circle described as the average of the radius and centered between the condyles.
Given these considerations, we have defined a sagittal talar measurement (LTS), which we postulated could be reproducibly used on clinical radiographs by the orthopedist to define the position of the talus as it related to the anatomic tibial axis. In addition, we described the distribution of the lateral talar station using this measurement in a normal population of patients.
Methods
Study Design and Patient Cohort
Institutional review board approval was obtained for this study. A retrospectively collected cohort of patients (18 years of age and older) who presented with foot pain to our tertiary hospital clinic between 2005 and 2011 was evaluated for inclusion in the study. Patients with ankle trauma, a history of ankle instability, or evidence of prior surgery about the ankle were excluded. The examined cohort included 121 ankles (104 patients). Radiographic exclusion criteria included length of distal tibial shaft visible on the lateral radiographs of less than 9 cm, excessive malposition of the ankle on the lateral radiograph (based on a qualitative assessment but generally grossly angulated) underlying ankle bony deformity, evidence of ankle joint degeneration, and inadequate radiograph quality. The final cohort consisted of 82 ankles (73 patients). Of the study cohort, 38 ankles were evaluated in males and 44 ankles were evaluated in females. The average age (range) for male and female subjects, respectively, was 25.9 years (18 to 41) and 29.8 years (18 to 50) at the time of presentation.
Power Analysis
A power analysis was done for this study. With an assumed alpha = .05, the power associated with the current study (N = 82) is approximately 0.973.
Radiographic Analysis
Weight-bearing lateral ankle radiographs obtained using the available equipment at a single institution were collected. Digital radiography had been performed using a SID of 45 cm and center beam aimed at the fifth metatarsal (Figure 3). Typically, the distal 10 cm of the tibia were included in the field of view. The images were stored in PACS using Stentor (Stentor, Inc, San Francisco, CA). Using image measurement software (iSite Enterprise; Einhoven, Netherlands), digital measurements were completed by 3 observers: a medical student, an orthopedic surgeon, and a staff radiologist. A training period was completed by all readers but was not rigorously designed.
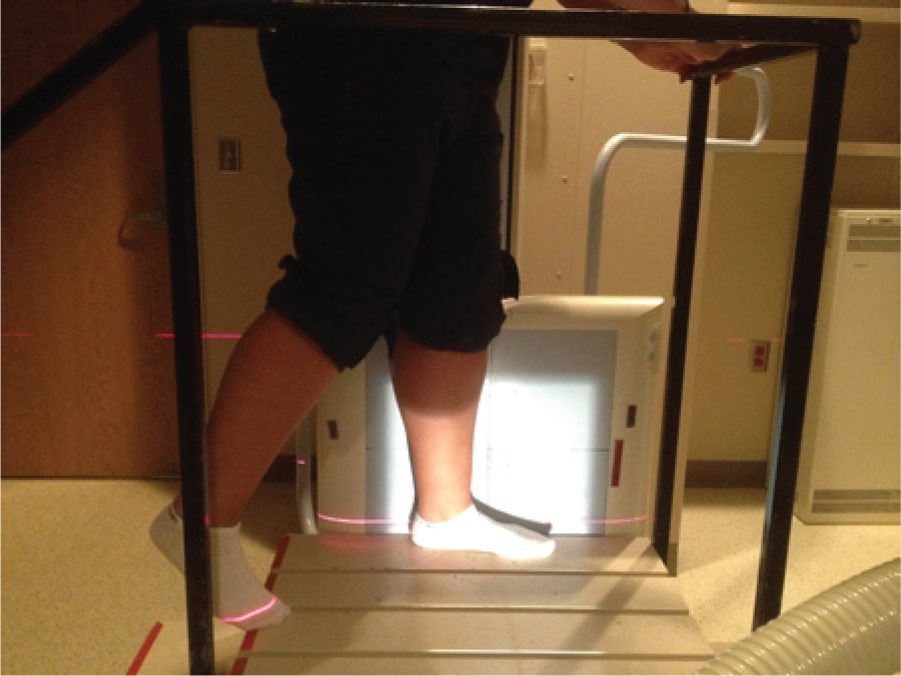
Digital radiography for obtaining lateral ankle radiographs.
Magerkurth et al previously described the TibCOR measurement, which was modified for this study (LTS) such that the tibial axis was prescribed as defined by Tochigi et al11,21,22 (Figure 4). A proximal circle was fit to the anterior and posterior tibial cortices at point A which was 10 cm above the tibial plafond. A distal circle was fit to the anterior and posterior tibial cortices at point B, which was 5 cm above the tibial plafond. A mid-diaphyseal line was made intersecting the center of the circles at points A and B and extended distally. A third circle was made fitting the talar dome and the distance of its center of rotation (point C) measured perpendicularly from the tibial axis line. This distance was defined as the LTS. Talar angulation and rotation was accounted for by treating the talus as a conical cylinder. The radius of the circle was adjusted using the digital tool on our software to reflect the average radius of the talar condyle arcs. The center of the circle (point C) was placed at the midpoint of the condyle arc centers using visual estimation. The center position of such a circle was taken to represent the center of rotation of the talus (Figures 5-7).
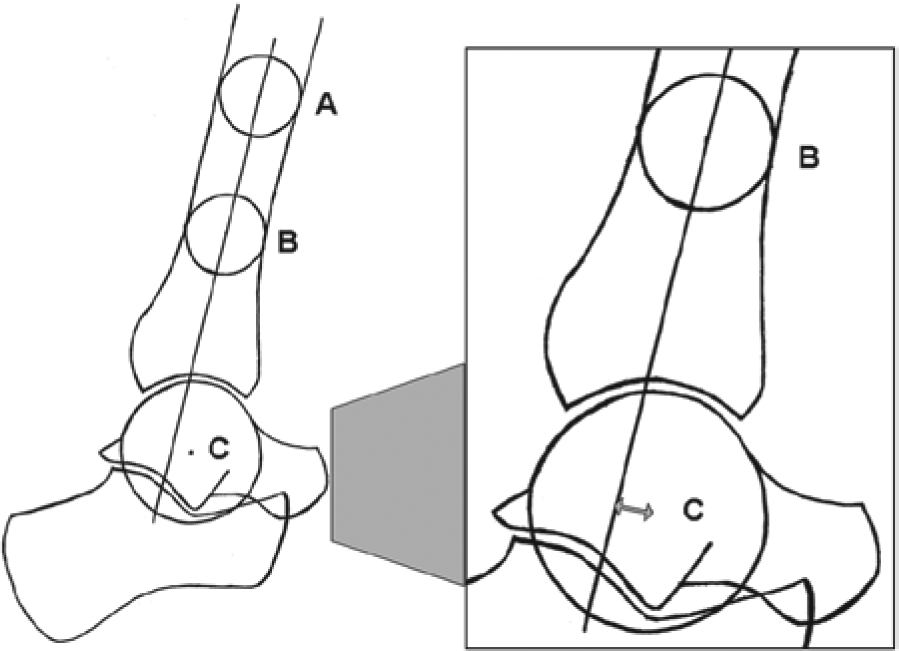
LTS measurement parameters. A proximal circle was fit to the anterior and posterior tibial cortices at point A which was 10 cm above the tibial plafond. A distal circle was fit to the anterior and posterior tibial cortices at point B, which was 5 cm above the tibial plafond. A mid-diaphyseal line was made intersecting the center of the circles at points A and B and was extended distally. A third circle was made fitting the talar dome and the center of its rotation (point C) was measured perpendicularly to the tibial axis line. This distance was defined as the lateral talar station (LTS).
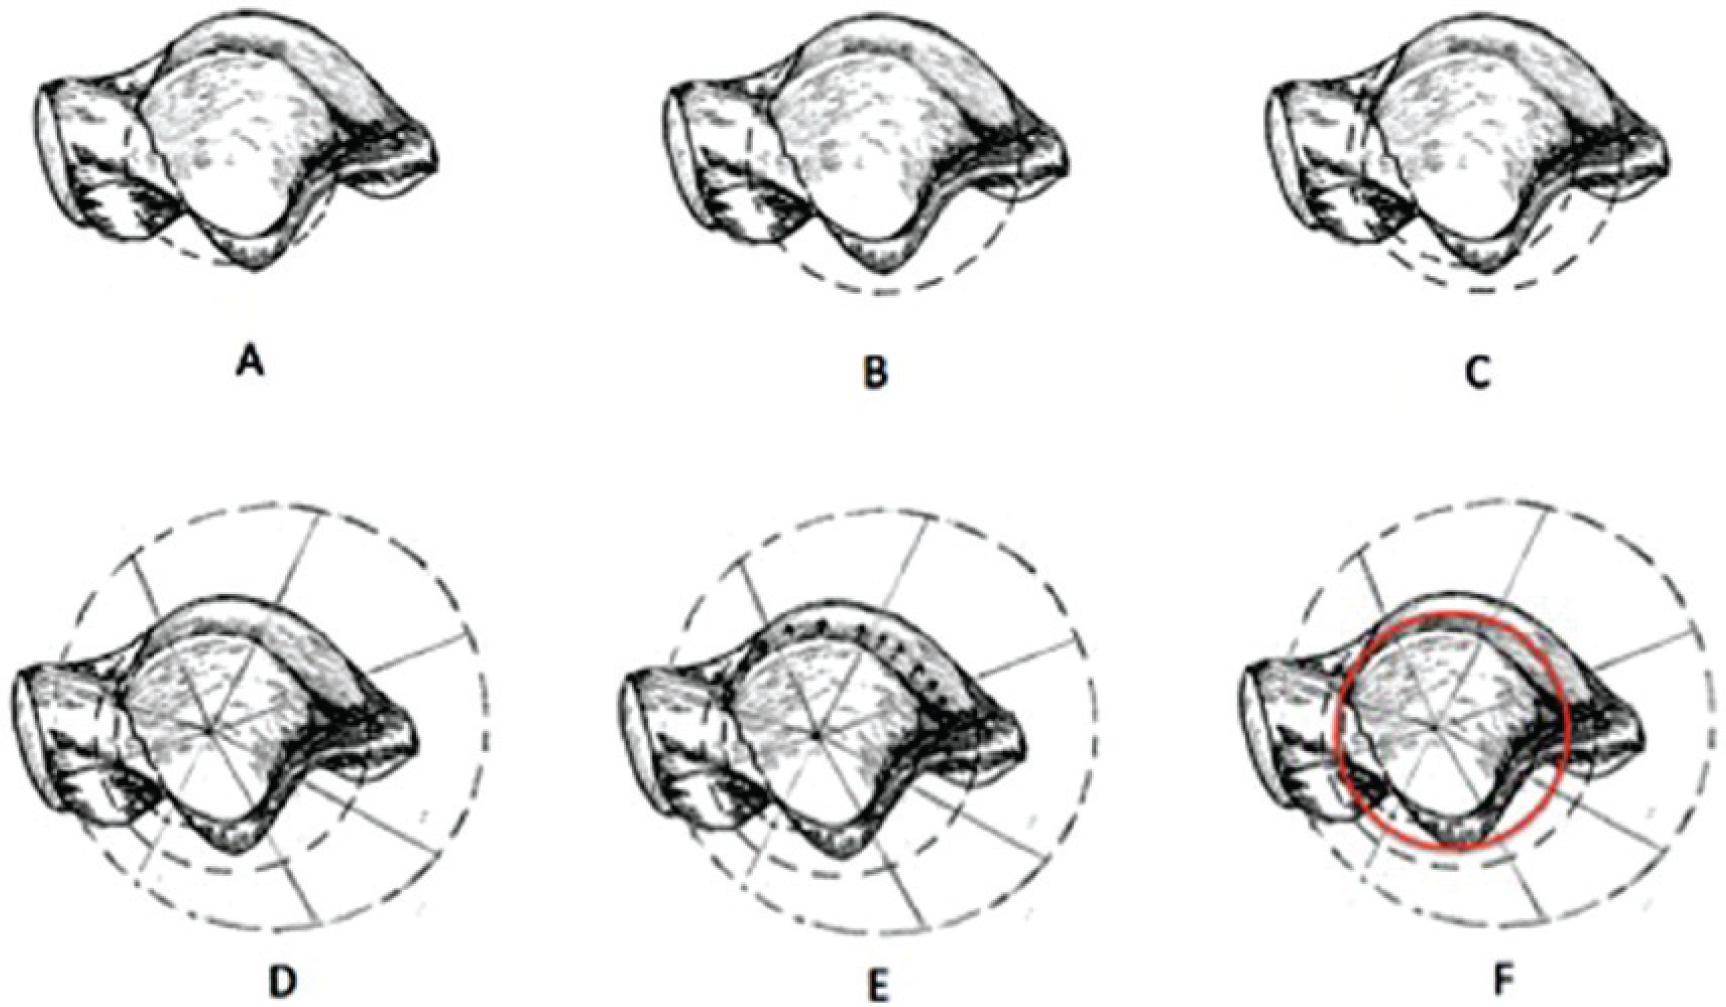
Measurement technique for sagittal talar tilt. (A) Medial talar dome with circle. (B) Lateral talar dome with circle. (C) Medial and lateral talar dome with circles. (D) Conical cylinder of talus. (E) Conical cylinder of talus. Slide circle up to be a best fit between the medial and lateral talar domes. (F) The new circle (red) represents the center of rotation of the talus.
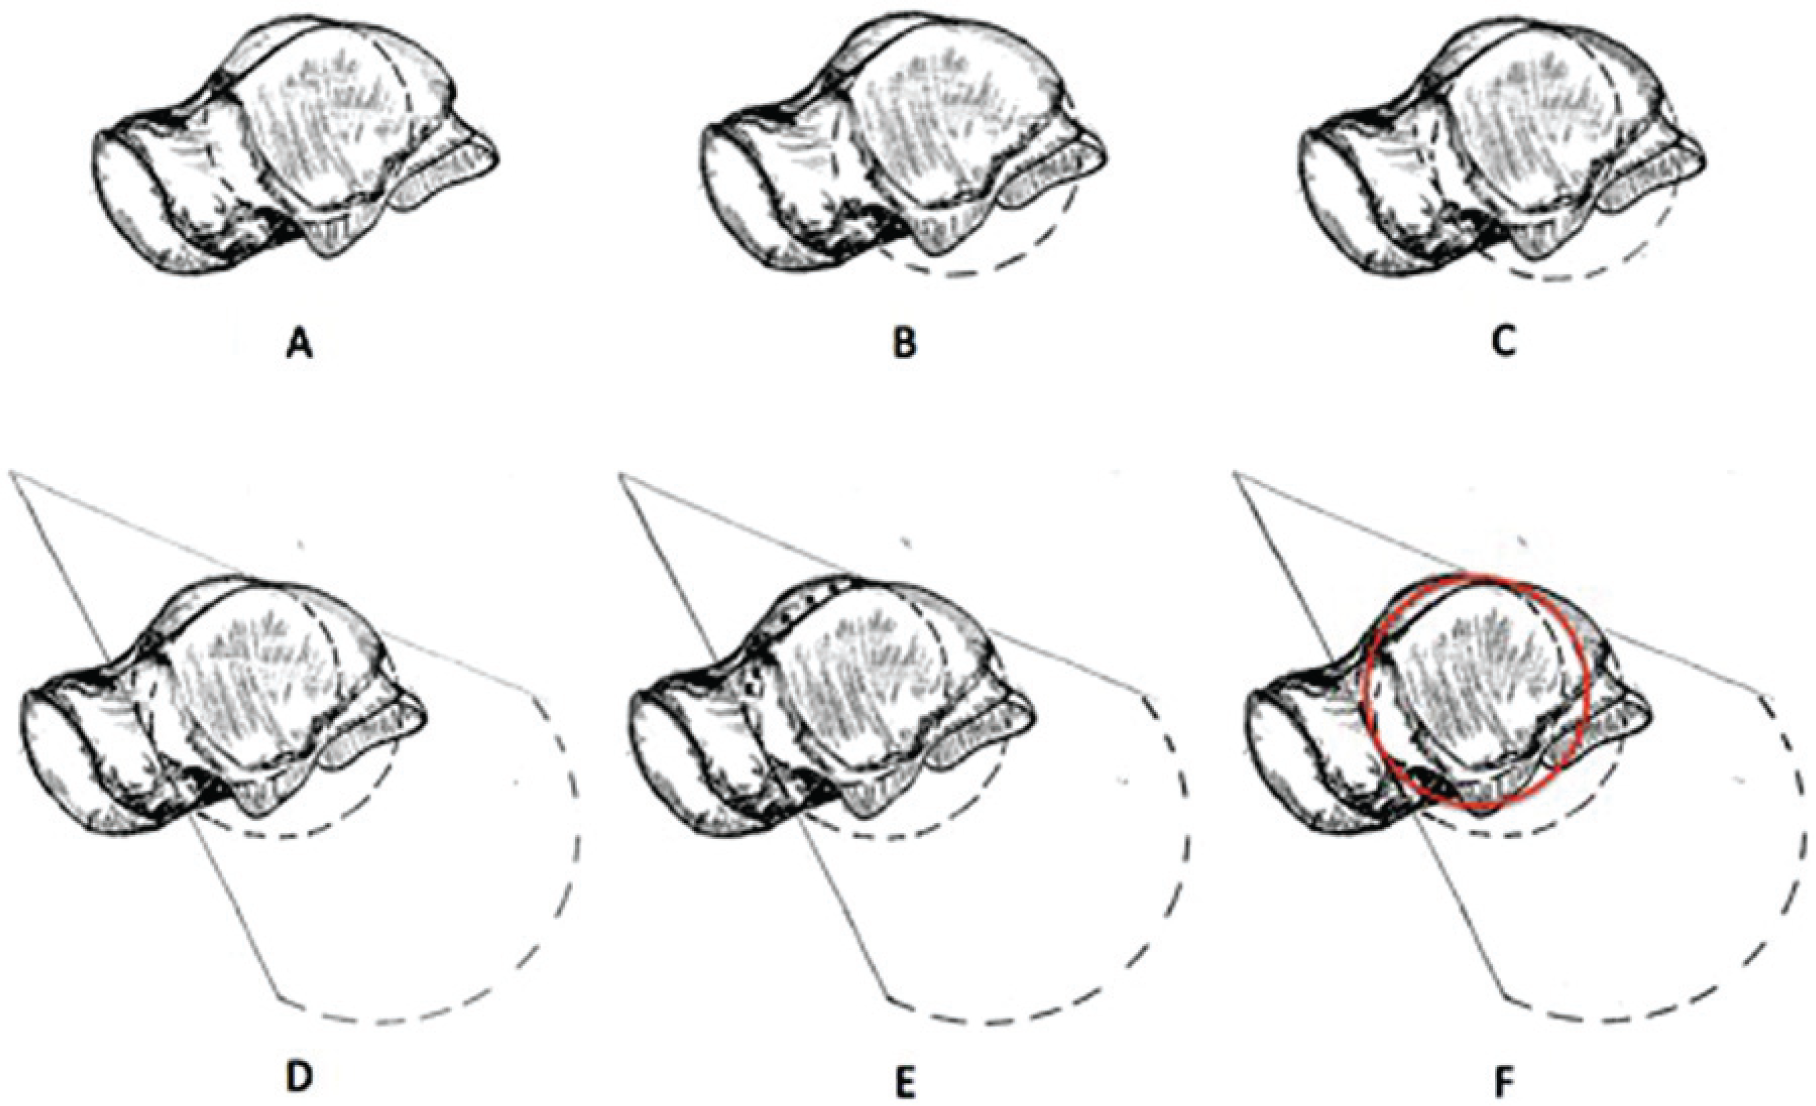
Measurement technique for sagittal talar rotation. (A) Medial talar dome with circle. (B) Lateral talar dome with circle. (C) Medial and lateral talar domes with circles. (D) Conical cylinder of talus. (E) Conical cylinder of talus. Slide circle to be a best fit between the medial and lateral talar domes. (F) The new circle (red) represents the center of rotation of the talus.
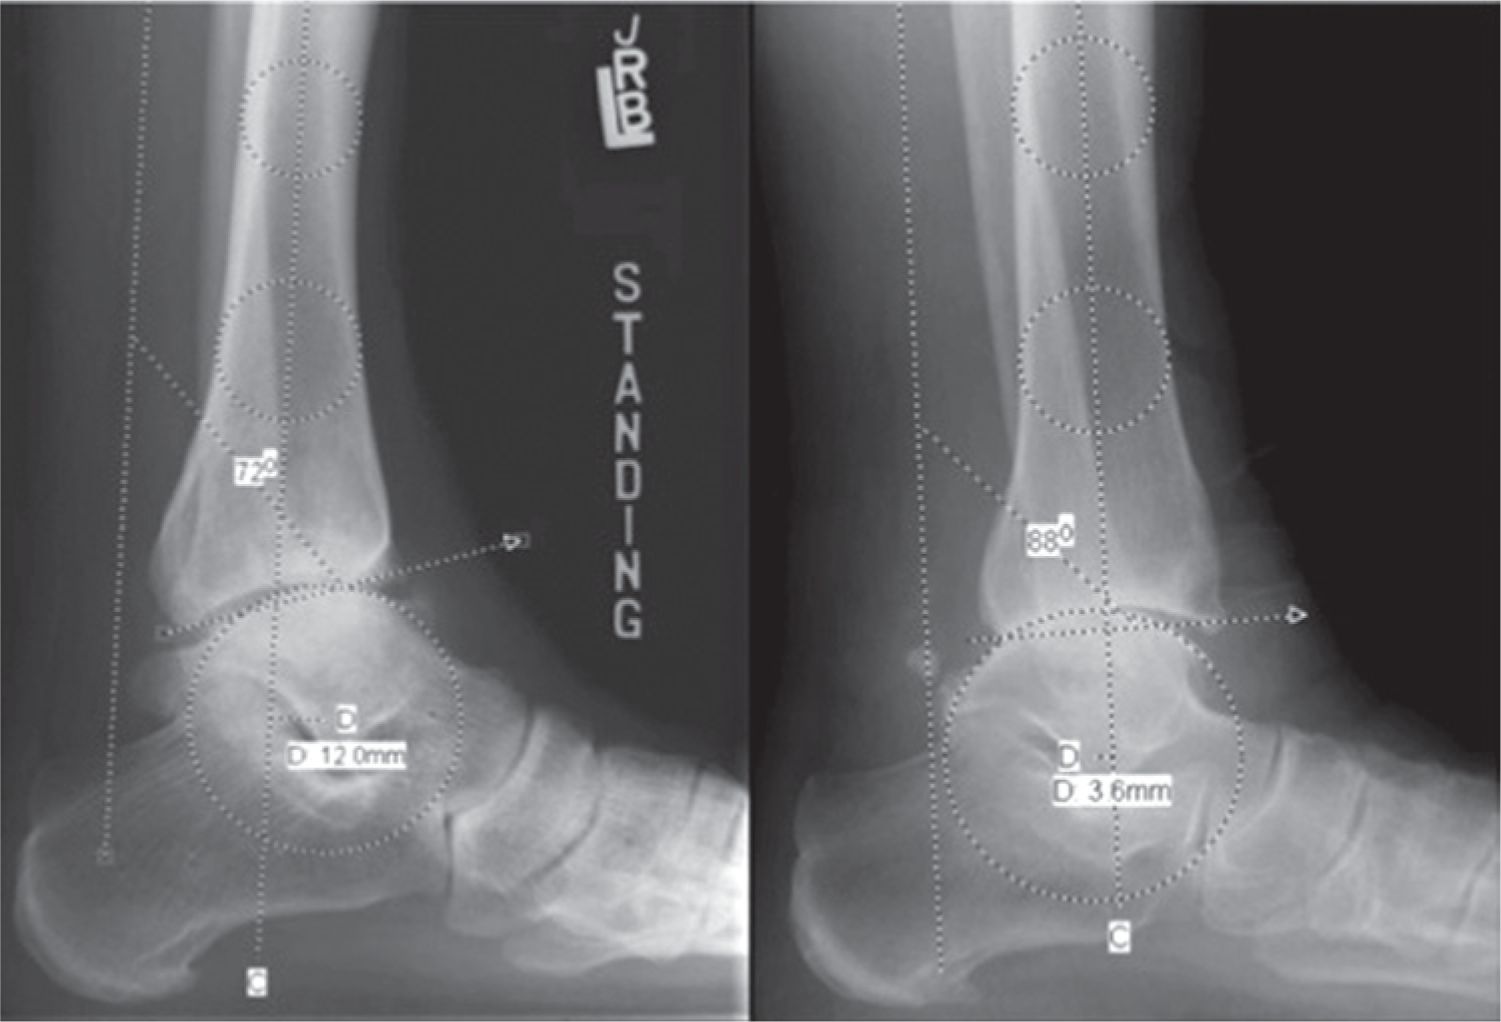
Lateral ankle radiographs demonstrating the LTS measurement.
Data Analysis
The mean LTS and standard deviation were determined for the entire cohort and plotted on a normal distribution curve after conducting Shapiro–Wilk tests for normality. In addition, as a means of validating our methodology, we performed an assessment of interobserver and intraobserver variability in terms of radiographic measurements prior to the completion of the study. The entire study cohort was remeasured 2 months after the initial measurements were completed. An intraclass correlation coefficient with a 95% confidence interval was used to evaluate reliability. Settings assumed absolute agreement in a 2-way random effects model. A coefficient of 1.0 designated a perfect correlation and > 0.8 designated excellent reliability. 10
Results
Radiographic Analysis
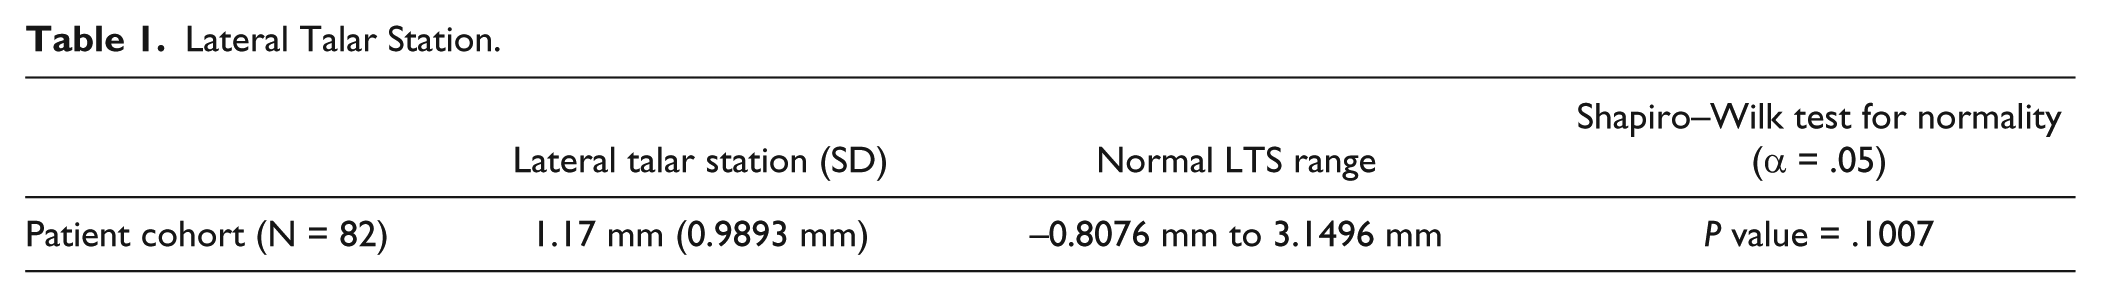
The LTS measurements for the entire cohort had a mean of 1.17 mm and a standard deviation of 0.9893 mm (Table 1). The normal range for the LTS in this cohort was therefore from −0.8076 mm to 3.1496 mm (mean ± 2 SD). This range of values was expected to include the sagittal talar position if an individual was healthy. 13 The LTS measurements for the entire cohort fit a Gaussian distribution which was verified by the Shapiro–Wilk test for Normality (alpha = .05) with a P value of .1007 (Figure 8).
Lateral Talar Station.
Lateral talar station (modified TibCOR).
Interobserver and Intraobserver Reliability
Interobserver intraclass coefficients for the LTS for 2 observers (medical student and radiologist) indicated excellent reliability being above 0.9 (Table 2). Intraobserver intraclass coefficient (orthopedic surgeon) for the LTS indicated excellent reliability, being above 0.9 (Table 2).
Intraclass Correlation Coefficient (95% confidence interval).
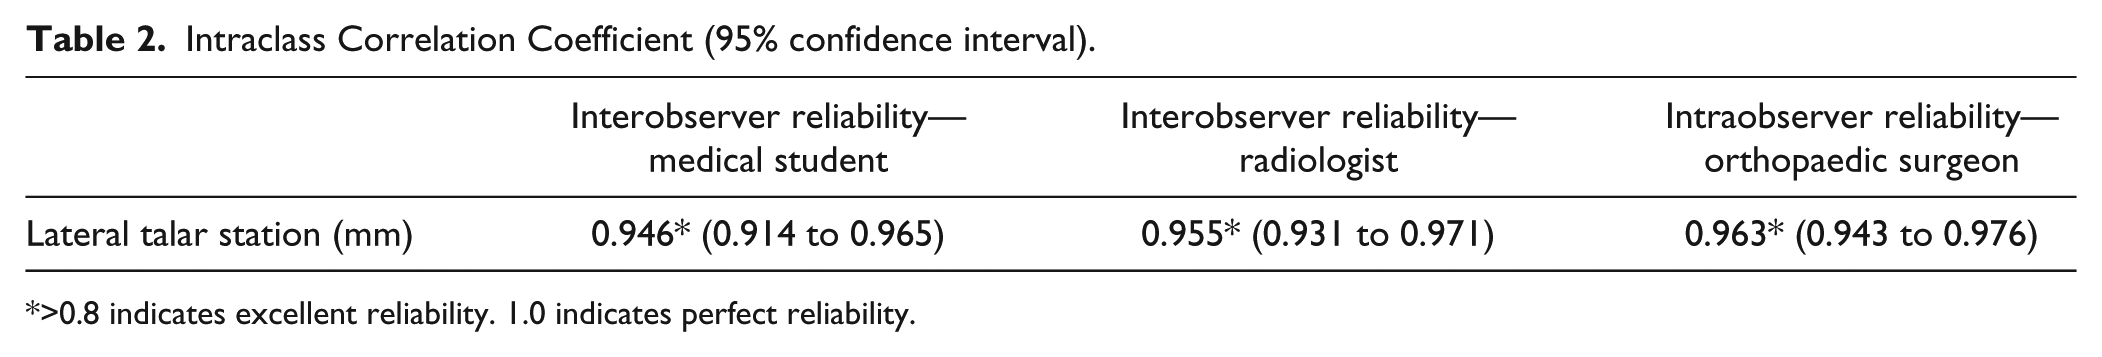
>0.8 indicates excellent reliability. 1.0 indicates perfect reliability.
Discussion
Lower extremity kinematics and alignment are crucial to understand when assessing the ankle joint critically. Anatomically, sagittal plane deformities alter the mechanics and joint reaction forces to a greater degree than coronal plane deformities.12,14,20 While the majority of interest radiographically has focused on coronal alignment,2-4,6,16 anatomic sagittal ankle alignment is also an integral factor to appreciate as it relates to stability and bony anatomy of the talocrural joint. A useful radiographic analysis tool to assess the lateral position of the talus relative to the tibial shaft axis must be effectively employable by the orthopedist in the clinical setting.21,22
Magerkurth et al described a TibCOR measurement (talar center of rotation to the anatomical axis of the tibia) to assess the lateral translational relationship of the talus.1,11 They reported a mean TibCOR measure of 1.6 mm (SD = 2.2 mm) in 52 healthy subjects having an average age of 37 years. 11 However, the placement of the distal point of the tibial axis line in the distal metaphysis used for the TibCOR measure may subject the shaft axis to metaphyseal deformities and potential inaccuracies. Tochigi et al have shown that the tibial axis can be described using points at 10 and 5 cm above the plafond and that this is relatively resistant to axial and sagittal rotational variability that may be expected to occur on clinical radiographs.
Making a circle to determine the sagittal center of rotation of the talus as described by Magerkurth et al also needs to be modified to account for transverse rotation and angulation on most clinical radiographs. This can be achieved by treating the talar dome as a conical cylinder and making a circle with a radius that is the average of the medial and lateral condylar arcs. The circle is then positioned such that its center is at the midpoint of the condylar arc centers. This approach is likely reproducible on film radiographs using protractor drawn circles but this was not evaluated.
Regarding other measures of the lateral talar station, previous work by Paley et al 14 used the position of the tip of the lateral process of the talus to define the lateral talar station relative to the axis of the tibia. This method was shown to be subject to significant variation and not reproducible in the work of Tochigi et al. 21
We have defined a lateral talar station (LTS) measurement, which appeared to reproducibly define the center of rotation of the talus as it related to the anatomic tibial axis on clinical radiographs. The mean LTS measurement in our study population was found to be 1.17 mm (SD = 0.989 mm) in 82 healthy subjects having an average age of 28 years. The range for the LTS in this cohort was from -0.8076 mm to 3.1496 mm. This range of values was expected to include the LTS measurement if the individual was healthy. 15 In comparison, the mean LTS was reported as 1.6 mm (SD = 2.2 mm) by Magerkurth et al using the TibCOR measure. 11 The LTS measure from our study showed a smaller standard deviation and excellent correlation parameters, suggesting that LTS was highly reproducible. As can be seen from the range of the LTS obtained in this study, the normal talus can have a center of rotation that lies slightly posterior to the tibial axis or anterior although an anterior position would be expected in about 81% of the normal population, given the normal distribution.
While the standard deviation for the LTS in our population was smaller than that obtained by Magerkurth et al, the accuracy of either technique is unknown as no gold standard is available for such a determination. Part of the difference in precision between the 2 measurements may be due to the different populations studied. In future studies, either technique could likely be used provided the method used is identified as such and applied to the intended population and radiographs as described in the original articles.
Strengths and Limitations
With a cohort of 82, this study had adequate power to determine that the LTS was a reliable measure to define lateral station of the talus as it related to the tibial axis in a clinical setting. In addition, there was excellent inter- and intraobserver reliability, indicating that the measurement could be performed reliably by various readers with different clinical experience using a range of qualities of clinical radiographs. The stringent radiographic parameters used to define the tibial axis allowed for various readers to reproducibly measure the LTS to standardize the measurement. The exclusion criteria limited the possibility of preexisting pathologic translation of the talus and should therefore reflect the normal distribution. The retrospective nature of the study did not allow for standardizing the procedure of obtaining the radiographs. This necessitated the disqualification of poor quality radiographs that were deemed to have significant rotation or tilting or where the talar dome was significantly obscured and could not be treated as a conical cylinder. The absence of a rigorous training protocol for the readers in this study may be another weakness of this study.
Although neither this nor Magerkurth et al’s study accounted for the angulation of the tibia relative to the floor (tibial floor axis), Tochigi et al has shown that the tibial axis as used in this article is relatively insensitive to sagittal angle changes. In the future, it may be appropriate to obtain radiographs in a standardized way that set the tibial foot axis to the same level in each subject, preferably neutral. Other variables such as BMI and activity level were not accounted for, which is a further limitation of the study. The presence of cavovarus or planovalgus alignment of the foot was also not controlled as this was not felt to directly affect the sagittal position of the talocrural joint.
Obtaining the measurement as described should be possible on most digital analysis software. The required functions (ie, the ability to create movable circles and lines and to obtain measurements) are very basic and commonly available. However, there may be limitations inherent to particular software that may influence the reproducibility of the measurement. Likewise, attempting to obtain the LTS on film radiographs using protractors and rulers should be possible but may present additional challenges. Finally, while the reliability of the LTS measurement was established herein, the validity of this measure in the general population and its use in patients with ankle pathology remains to be established.
Conclusions
The sagittal talar position could be reliably determined using the LTS measurement. This measurement could be used on weight-bearing lateral ankle radiographs to define the sagittal position of the talus in a clinical setting. The normal range for our study population was determined in this article. Further study is required to establish the value of the LTS measurement when assessing ankle pathologies that are subject to sagittal talar translation.
Footnotes
Declaration of Conflicting Interests
The author(s) declared no potential conflicts of interest with respect to the research, authorship, and/or publication of this article.
Funding
The author(s) received no financial support for the research, authorship, and/or publication of this article.