
Abstract
Background:
National campaigns in the United States, such as Choosing Wisely, emphasize that decreasing low-value office visits maximizes health care value. Although patient-reported outcomes (PROs) are frequently used to quantify postoperative outcomes, they have not been assessed as a tool to help guide clinicians consider alternatives or discontinue in-person follow-up visits. The purpose of this study is to assess the frequency and cost of in-person follow-up visits after patients report substantial improvement defined as 2 consecutive improvements above preoperative Patient Reported Outcomes Measurement Information System (PROMIS) pain interference (PI) scores.
Methods:
Retrospective PROMIS PI data were obtained between 2015 and 2020 for common elective foot (n = 759) and ankle (n = 578) surgical procedures. Patients were divided into quartiles according to their preoperative PI score. Multivariable Cox proportional hazards models were used to investigate time to substantial improvement. Substantial improvement was defined as having 2 consecutive postoperative minimal clinically important differences (MCIDs) above preoperative PROMIS PI scores. MCID was measured using the distribution-based method. Multivariable negative binomial models were used to determine the number of visits and direct associated costs after substantial improvement. The cost to payors was estimated using reimbursement rates.
Results:
Within 3 months, 12% to 46% of foot and 16% to 61% of ankle patients achieved substantial improvement. Results vary by preoperative pain quartile, with patients who report higher preoperative pain scores achieving earlier improvement. After achieving substantial improvement, foot and ankle patients averaged 3.60 and 4.01 follow-up visits during the remaining 9 months of the year. Visit costs averaged $266 and $322 per foot and ankle patient respectively.
Conclusion:
Postoperative follow-up visits are time-consuming and costly. Physicians might consider objective measures, such as PROMIS PI, to determine the need, timing, and alternatives for in-person follow-up visits for elective foot and ankle surgeries after patients demonstrate reliable clinical improvement.
Level of Evidence:
Level III, retrospective cohort study at a single institution.
This is a visual representation of the abstract.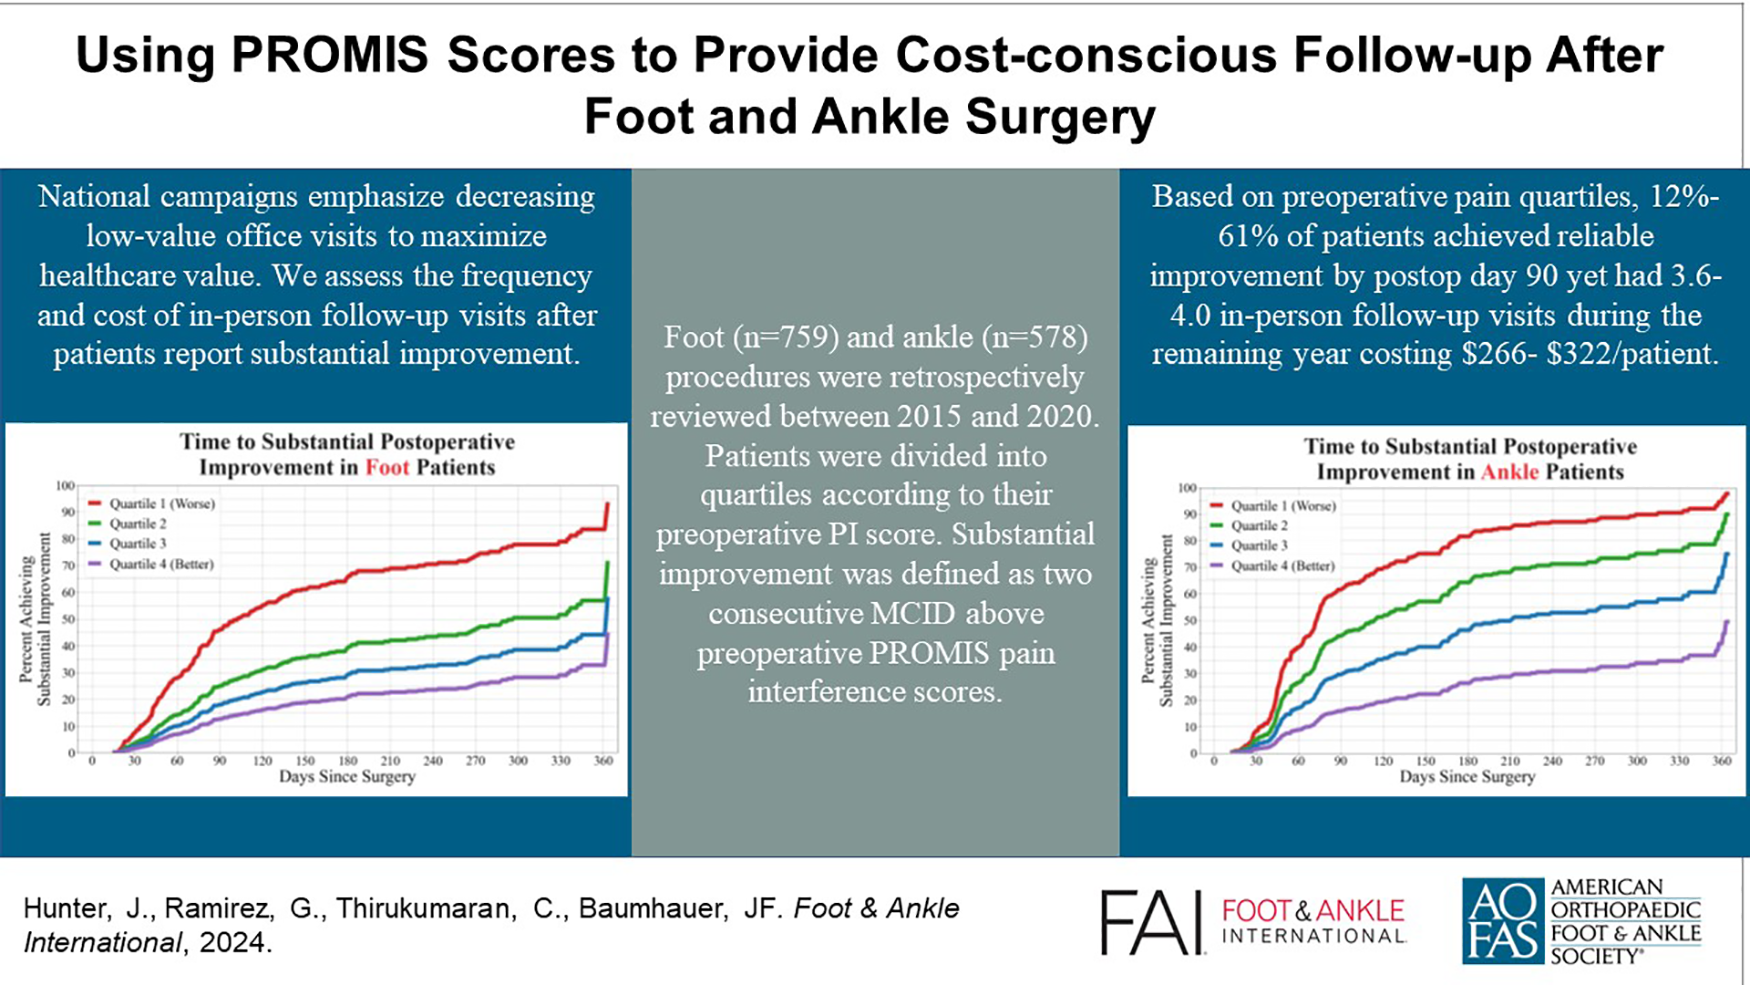
Introduction
Worldwide trends and national campaigns in health care reform, such as Choosing Wisely, emphasize patient-centered, high-value care.22,36 Value-of-care is defined as a specified outcome divided by cost. 27 To maximize value, clinicians strive for the highest outcomes and the lowest cost. Patient-reported outcomes (PRO) are questionnaires that provide a mechanism to quantify the numerator of the value-of-care equation, with the patients’ voice highlighting their recovery progress. 20 Through ongoing assessment and tracking, PROs can help clinicians determine when interventions and follow-up visits are needed or when visits can be reduced or replaced with less expensive alternatives.
When costs of additional visits exceed their future benefit, follow-up visits become economically suboptimal. Measuring the benefits and costs of visits is complex because different stakeholders, such as patients, providers, and payors’ perception of future benefit may not align. Patients may face cost and time barriers when attending visits, whereas physicians may prefer postoperative visits to decrease liability and increase their understanding of postoperative recovery. Additionally, the benefits of follow-up visits may vary by specialty, procedure, and patient complexity. For example, Reich et al 29 found 95.5% of hip fracture patient visits do not change treatment, whereas Talbo et al 34 reported patients undergoing colectomy are twice as likely to be readmitted to the hospital if discharged without a follow-up visit. Although follow-up visits may serve multiple purposes such as educating a patient, providing assurance, and building a patient-physician relationship, the primary purpose of follow-up visits is to evaluate the patient and determine the need for additional care. We are unaware of studies that have compared the costs and benefits of follow-up visits after foot and ankle surgery.
The Patient-Reported Outcomes Measurement Information System (PROMIS) is a validated outcome measurement system frequently used to quickly assess a wide variety of patient symptom domains including pain, physical function, and emotional well-being.2,4,11,16,26,33 PROMIS uses computer adaptive technology by asking 4 to 7 questions and computing a t score that is normalized to the US population. Recent studies show the PROMIS pain interference (PI) domain as the primary factor associated with patient satisfaction. 5 The PI is more robust than a simple 0-10 pain scale because it measures what activities influence patients’ pain and has a stronger correlation with functional scales than pain scales.3,9 Although PROMIS provides an idea of how patients are doing compared to a normalized population, anchor questions such as “How are you doing since your most recent visit?” complement PROMIS scores and provide insight into how patients interpret their own recovery regardless of other patients’ progress.13,18
In the United States, most surgeries include a 90-day global payment program after surgery in which the surgeon or hospital is financially responsible for the total cost of care after the date of surgery. Postoperative visits associated with surgery recovery, such as pain management, dressing changes, and surgery-related physical examinations, are included in this charge.24,28 In fee-for-service compensation models, visits after 90 days require additional payments by patients or associated payors.7,15
The aim of this study is to assess the frequency and cost of postoperative visits after patients report consecutive improvements in PROMIS PI scores. Specifically, we ask how many patients have achieved substantial improvement by the 90-day global period? How many visits occur after patients achieve substantial improvement and what are the costs of these visits? How do these results vary by preoperative PROMIS scores? Results will inform physicians on the frequency of visits after substantial improvement to support cost-conscious decisions when scheduling follow-up visits.
Materials and Methods
Study Design and Setting
This is a retrospective cohort study examining PROs following elective surgery at a single university orthopaedic department from May 1, 2015, to April 30, 2020. Current Procedural Terminology (CPT) codes 28001-28907 identified foot surgeries and codes 27600-27899 identified ankle surgeries. Patients <18 years of age and those who have insufficient data were excluded from the study (Figure 1). Patients who underwent more than 1 surgery on 2 separate days or had surgeries on both the foot and the ankle on the same day were excluded. The study was conducted in accordance with the university’s Research Subjects Review Board (69111; CLICK 1427). In total, PROMIS scores were obtained for 761 foot and 580 ankle patients (Table 1).
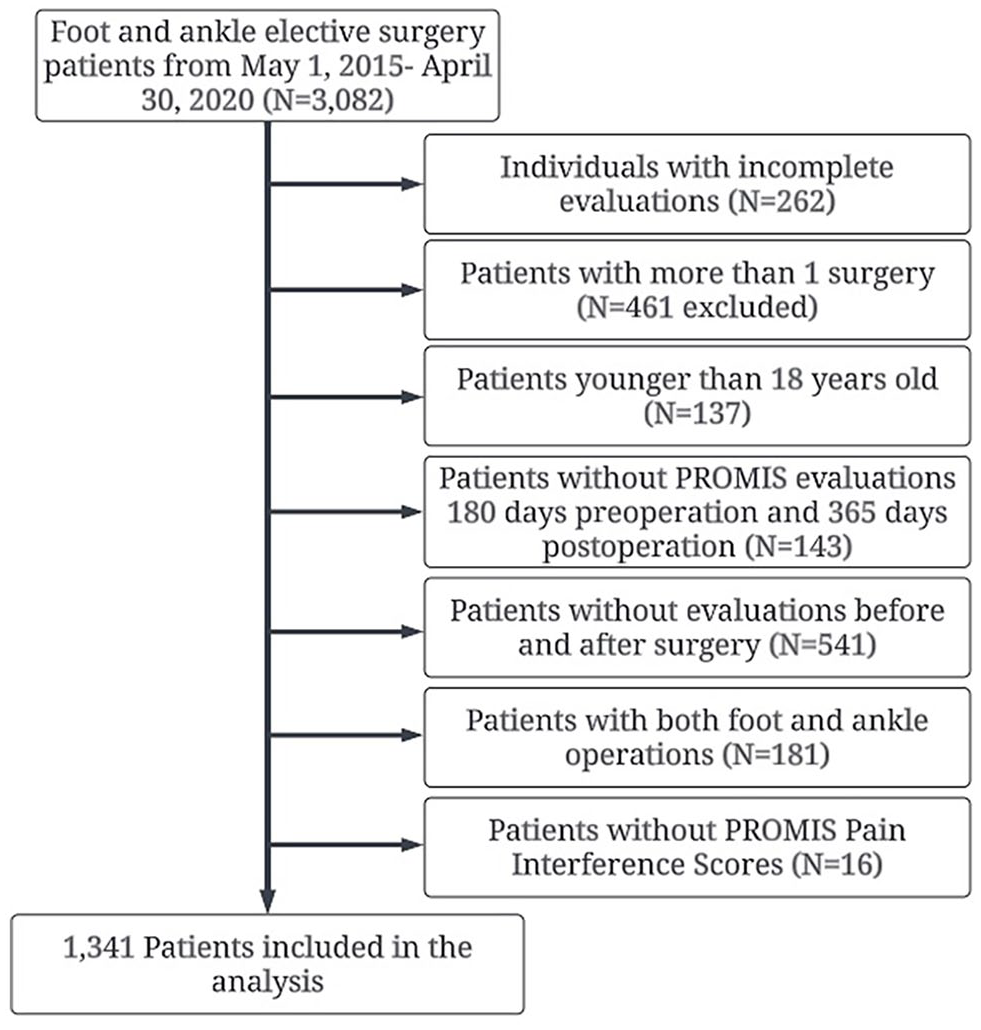
The exclusion criteria displaying which patients were included in the analysis.
Baseline Characteristics of the 1341 Patients. a
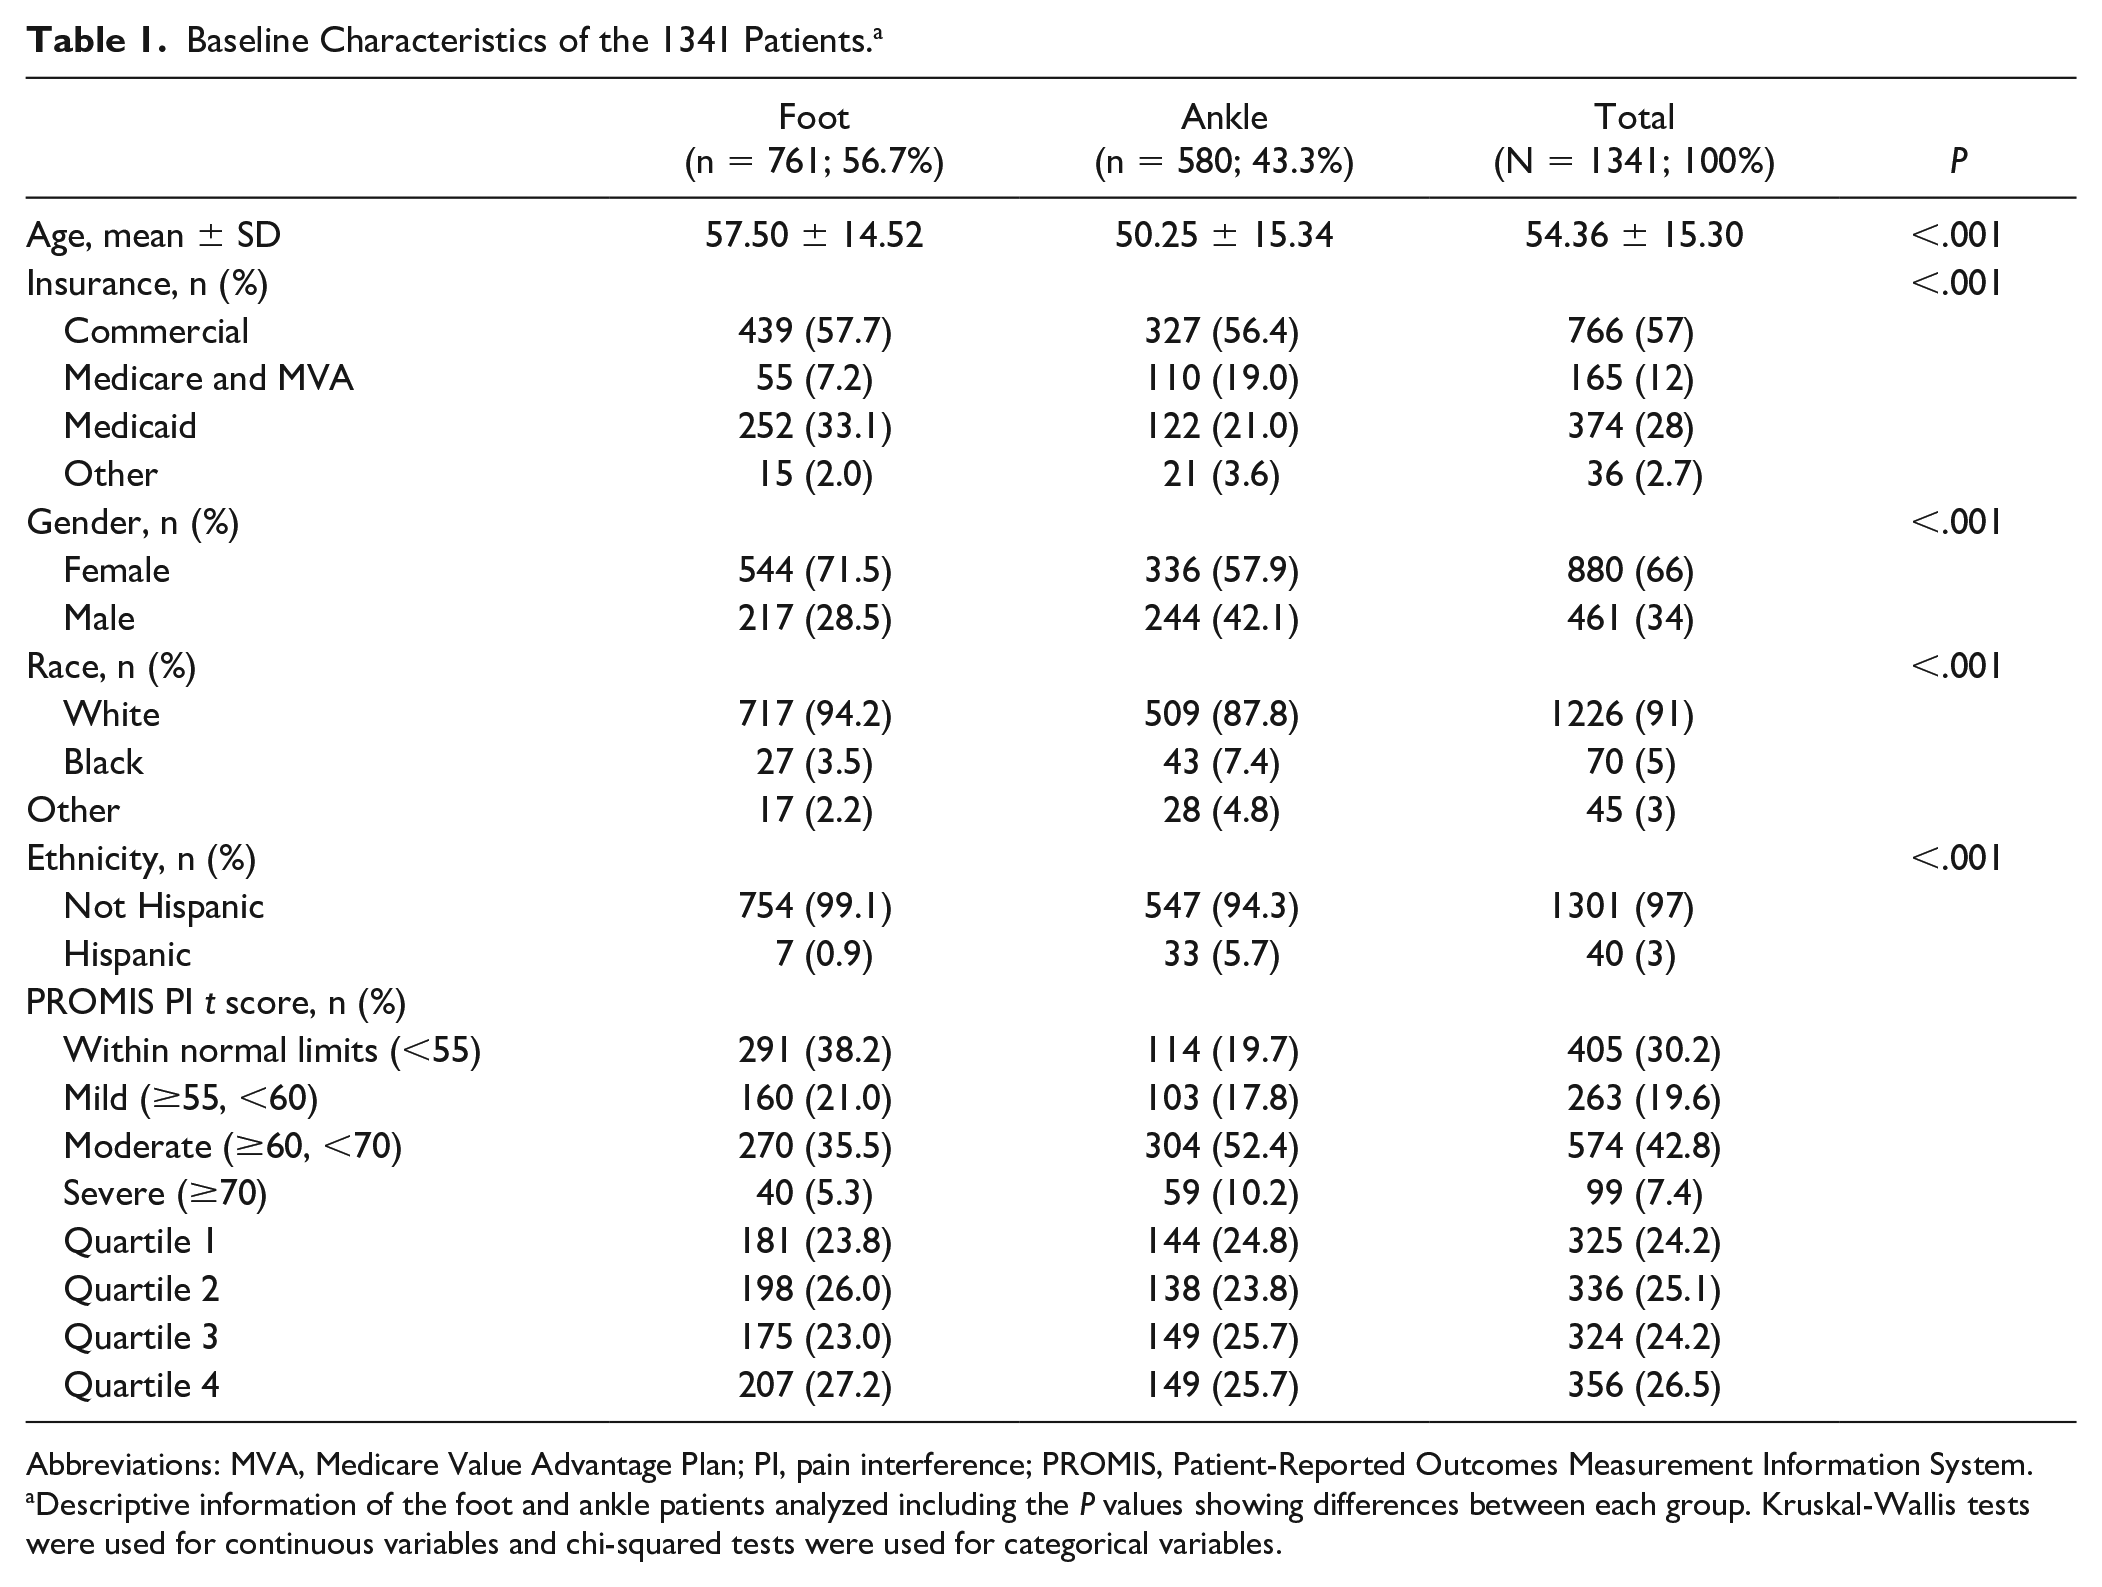
Abbreviations: MVA, Medicare Value Advantage Plan; PI, pain interference; PROMIS, Patient-Reported Outcomes Measurement Information System.
Descriptive information of the foot and ankle patients analyzed including the P values showing differences between each group. Kruskal-Wallis tests were used for continuous variables and chi-squared tests were used for categorical variables.
Key Variables and Outcomes
Postoperative improvement
Patients provided PROMIS self-evaluations within 180 days from surgery and postoperatively at in-person follow-up visits. PROMIS evaluations were not obtained again until 21 days after providing their previous postoperative PROMIS PI evaluation to ensure an adequate length of time for recovery. The minimal clinically important difference (MCID) was determined using the distribution method defined as one-half SD of the preoperative scores for foot and ankle patients. Substantial improvement was defined as having 2 consecutive postoperative MCID evaluations above preoperative PROMIS PI scores. Patients were divided into quartiles according to their preoperative PROMIS PI score (quartile 1 being 25% of patients with the highest PI scores and most pain) to address variances in baseline preoperative pain.14,31 Patients were grouped by percentile and not by severity thresholds such as PROMIS PI scores between 55 and 60, 60 and 70, and >70 because unequal balance of groups violated the proportional hazards assumption required for Cox proportional hazard models.
Number of postoperative visits
The number of visits occurring at 4, 6, 9, and 12 months from the time of substantial improvement were calculated. Patients who met the 2 consecutive improvements above the MCID without a decline below preoperative levels and reported PROMIS scores in-clinic were considered to have had a potentially low-value visit.
Cost per visit and estimated savings
Reimbursement rates for Medicare, Medicaid, and commercial insurance were provided by the university’s billings department for follow-up visits (CPT code 99213). The average cost per visit paid by all commercial insurance providers was used to estimate commercial payor reimbursement rates. Because of variation in payor reimbursement rates, a weighted average based on the distribution of Medicare, Medicaid, and commercial insurance patients was calculated. Estimated total savings were calculated by multiplying average reimbursement amount per follow-up visit by the number of potentially low-value visits estimated by the regression model.
Covariates
Demographic and coding data including age, gender, race, ethnicity, insurance coverage, and CPT code for surgery were obtained and controlled in all multivariable models. Mean age of the cohort was 54.4 (SD 15.3) years, 57% were covered by commercial insurance, and 66% were female (Table 1). Age, insurance type, gender, race, and ethnicity were significantly different between foot and ankle patients (P < .001). Differences between patients who met and failed to meet inclusion criteria were not significant for age, gender, race of ankle patients, or preoperative pain score for foot patients, but differed for race, ethnicity, insurance type for foot patients and ethnicity, insurance type, and preoperative t-score means for ankle patients (Appendix A).
Statistical Analysis
Continuous variables were compared using means and SDs whereas categorical variables were compared using frequencies and percentages. Chi-squared tests were used to determine if differences exist between foot and ankle patients for insurance type, gender, ethnicity, and race, whereas Kruskal-Wallis was used to determine differences between preoperative scores and age (Table 1).
We estimated Cox proportional hazards multivariable models with probability of recovery as the dependent variable and time from operation as the key independent variable adjusted for operative quartile, age, insurance, gender, race, and ethnicity separately for foot and ankle patients. This informed whether preoperative PROMIS PI scores were associated with postoperative improvements and established when patients achieved substantial improvement. The distribution-based method was used to calculate MCID and determine a threshold to define substantial improvement. We estimated multivariable negative binomial regression models to assess the association between preoperative t-score quartile and the number of visits after clinical improvement while controlling for age, insurance coverage, gender, race, and ethnicity. Adjusted marginal estimates were used to determine the percentage of patients showing substantial recovery within 30, 60, 90, 120 days, 6 months, and 1 year for each preoperative quartile for both ankle and foot patients. Analysis with 80% power and alpha of 5% indicates that hazard ratios would be sufficiently powered for values less than 0.79 for foot and 0.74 for ankle (Appendix B).
Sensitivity analysis using anchor question–based MCID
We performed a sensitivity analysis with anchor questions to ensure patients’ statistical improvement aligned with their stated improvement. Of the 761 and 580 patients who reported PROMIS PI scores, 354 (47%) foot and 290 (50%) ankle patients responded to anchor questions. Anchor questions asked how patients felt compared to their previous visit and provided additional perspective of postoperative recovery. Response options to the anchor question included much worse (5 of 5), mildly worse, no change, mildly better, and much better (1 of 5). The anchor-based MCID was defined as the mean change in postoperative PI t score, relative to baseline PI t score, of patients that reported “mildly better” to the anchor question and indicated an improvement in PI t score. Patients reporting improvement relative to their baseline PI t score by an amount equal to or exceeding the anchor-based threshold were considered to have achieved MCID.4,6,31
Results
Pre- and Postoperative Recovery
Mean preoperative PROMIS PI scores were 67.48, 60.59, 55.36, and 49.06 for foot patients and 69.78, 63.70, 59.69, and 51.70 for quartiles 1 through 4 respectively. The mean time from last visit to surgery is 45 days, whereas the median is 30 days. The SD of preoperative PROMIS PI scores using the distribution method were determined to be 7.47 and 7.30; MCIDs were determined to be 3.74 and 3.65 for foot and ankle patients, respectively. Using the distribution-based method, 2 consecutive improvements in MCID measured by PROMIS PI scores were achieved by 46.12% of foot patients in quartile 1 (high pain) and 12.73% of patients in quartile 4 (low pain) in the first 90 days (Figure 2, A). Patients’ status post ankle surgery had higher results, with 61.57% of quartile 1 and 15.91% of quartile 4 achieving substantial improvement by day 90 (Figure 2, B). Table 2 presents the point estimates and the CIs for these estimates. Patients with substantial improvement achieved their greatest benefit between 60 and 90 days after surgery (Figures 3 and 4, B and D). Patients who did not achieve substantial improvement by 90 days rarely achieved MCID (Figures 3 and 4, A and C). Using the Cox proportional hazards model, our results show a significantly greater percentage of substantial improvement in lower quartiles relative to higher quartiles (Table 3).
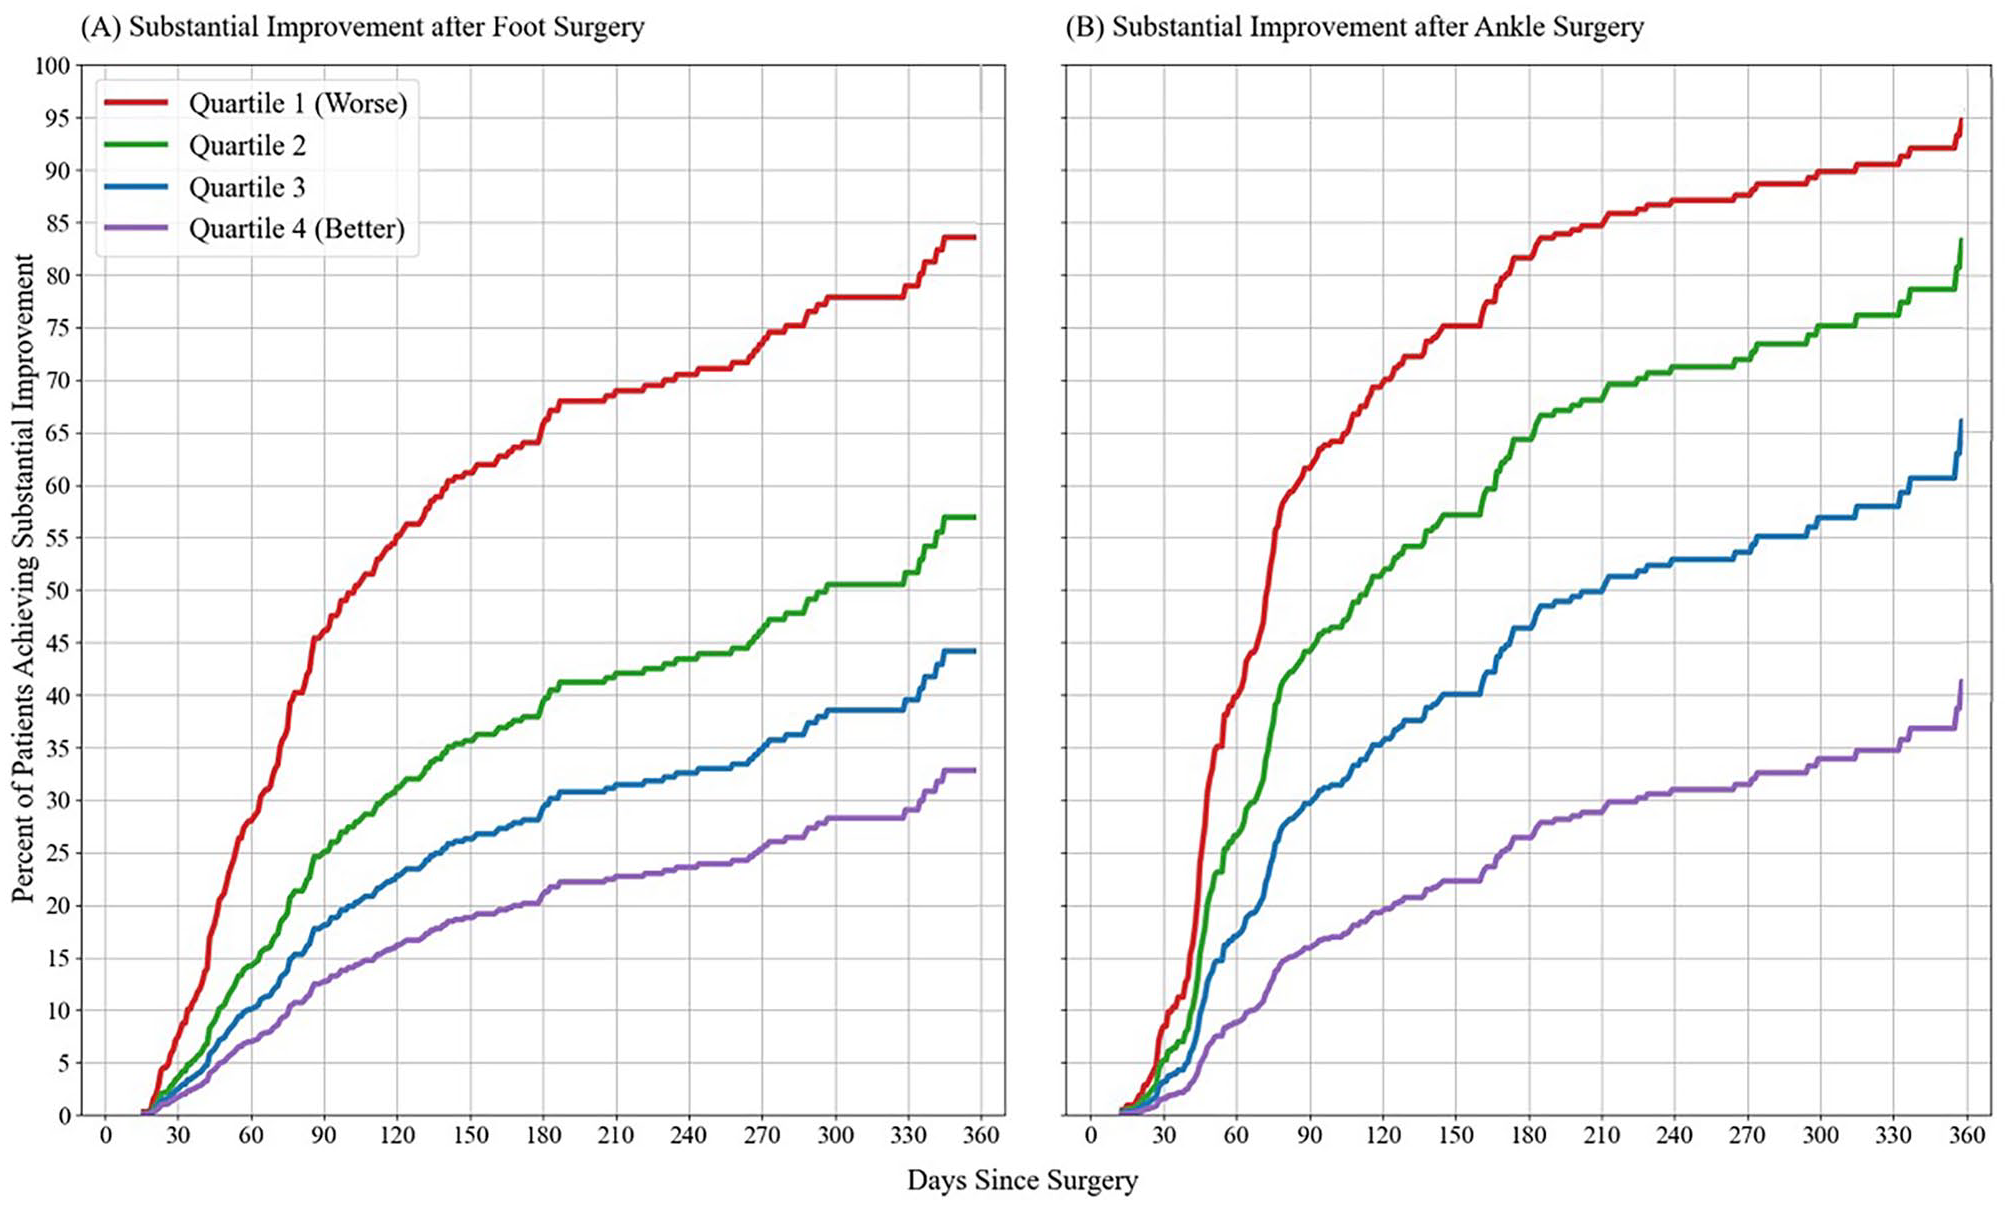
(A) Adjusted means of Cox proportional hazards models of patients achieving the substantial improvement criterion defined as 2 consecutive postoperative PROMIS PI t scores that improved by an amount exceeding the distribution-based MCID threshold. Patients are categorized by preoperative t-score quartile, with quartile 1 comprising patients with the most severe pain interference t scores. These models adjust for preoperative t-score quartile, age, gender, race, ethnicity, and primary payor. (A) The percentage of elective foot surgery patients achieving the substantial improvement criterion. (B) The percentage of elective ankle surgery patients achieving the substantial improvement criterion.
Mean Percentage (CI) of Patients Who Achieve Substantial Improvement. a
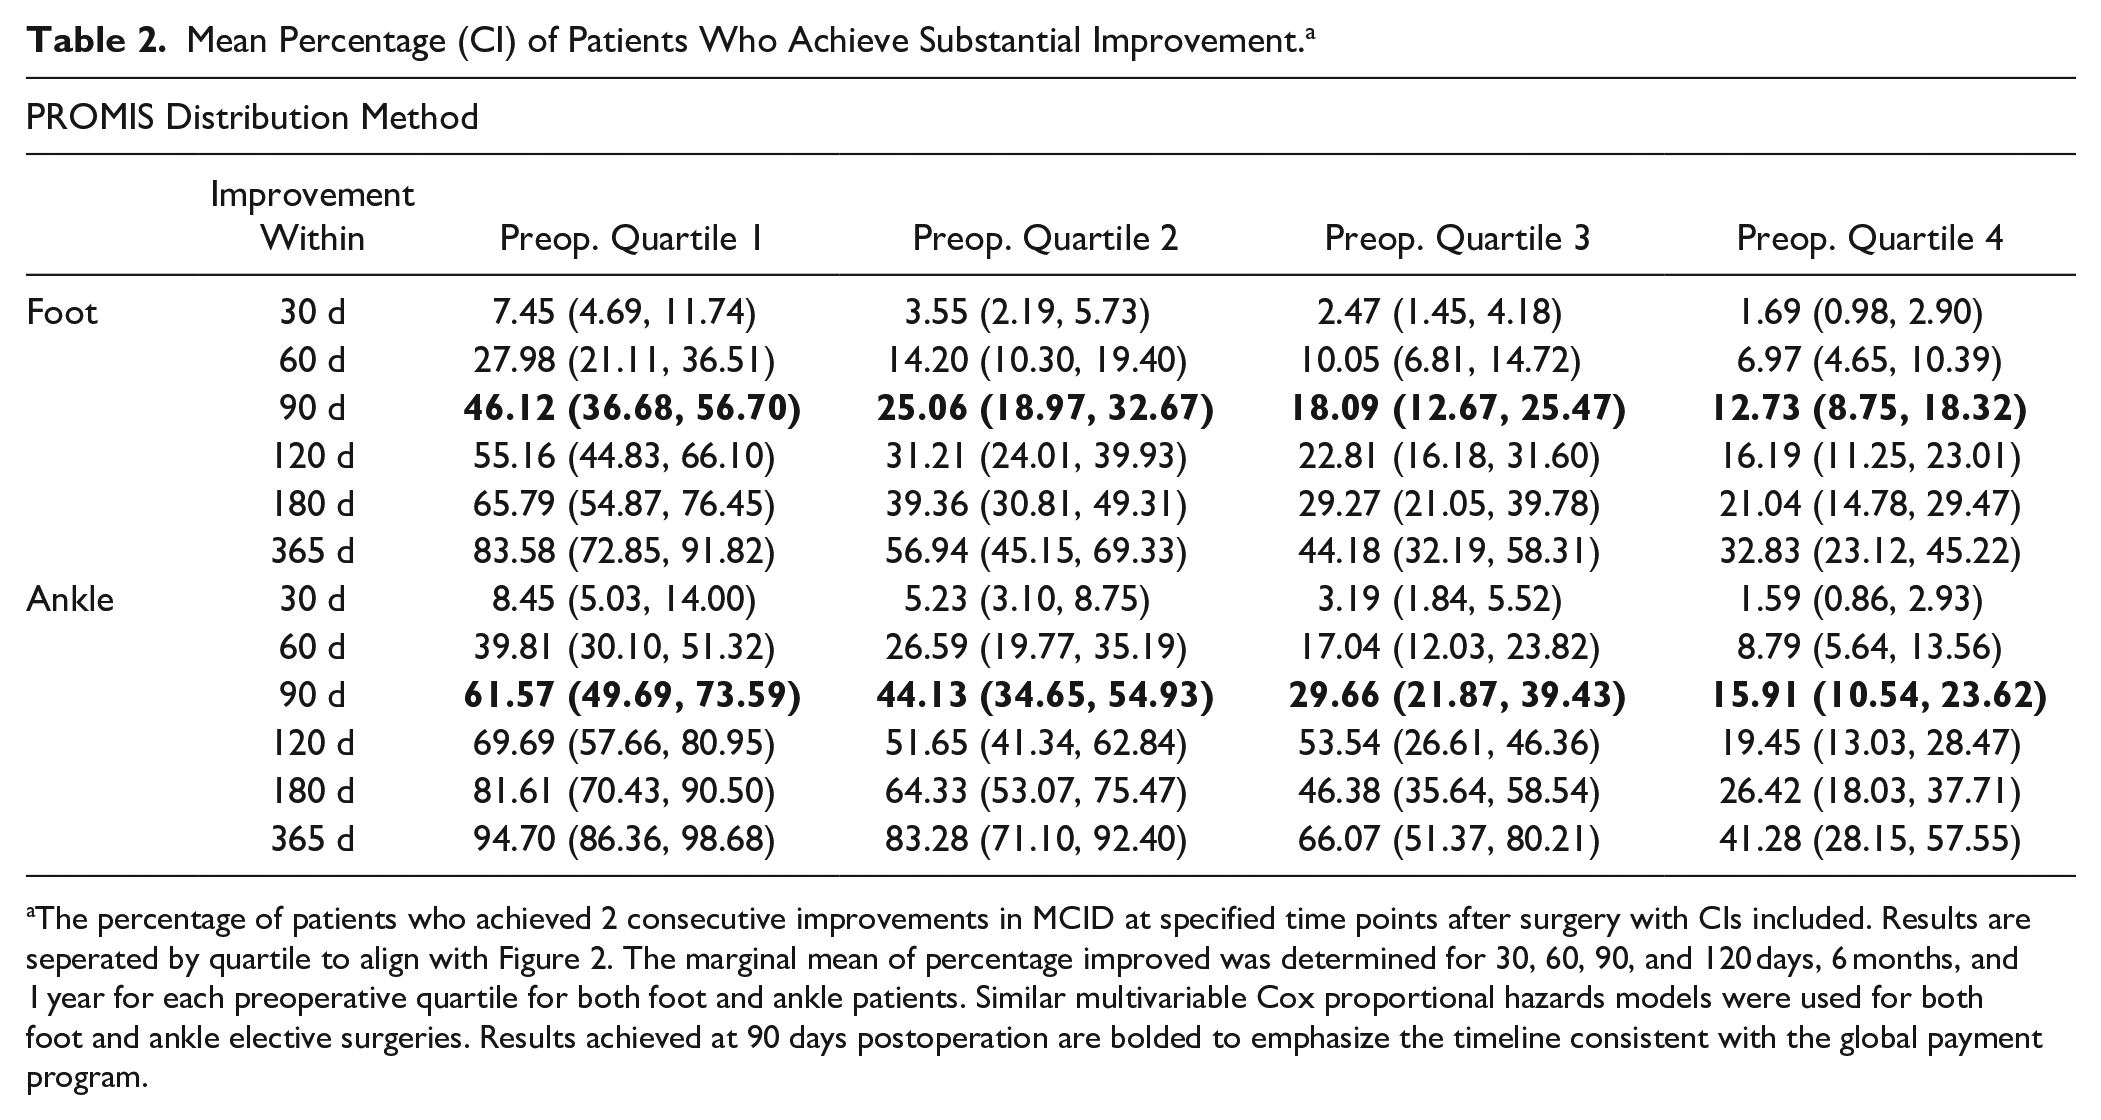
The percentage of patients who achieved 2 consecutive improvements in MCID at specified time points after surgery with CIs included. Results are seperated by quartile to align with Figure 2. The marginal mean of percentage improved was determined for 30, 60, 90, and 120 days, 6 months, and 1 year for each preoperative quartile for both foot and ankle patients. Similar multivariable Cox proportional hazards models were used for both foot and ankle elective surgeries. Results achieved at 90 days postoperation are bolded to emphasize the timeline consistent with the global payment program.
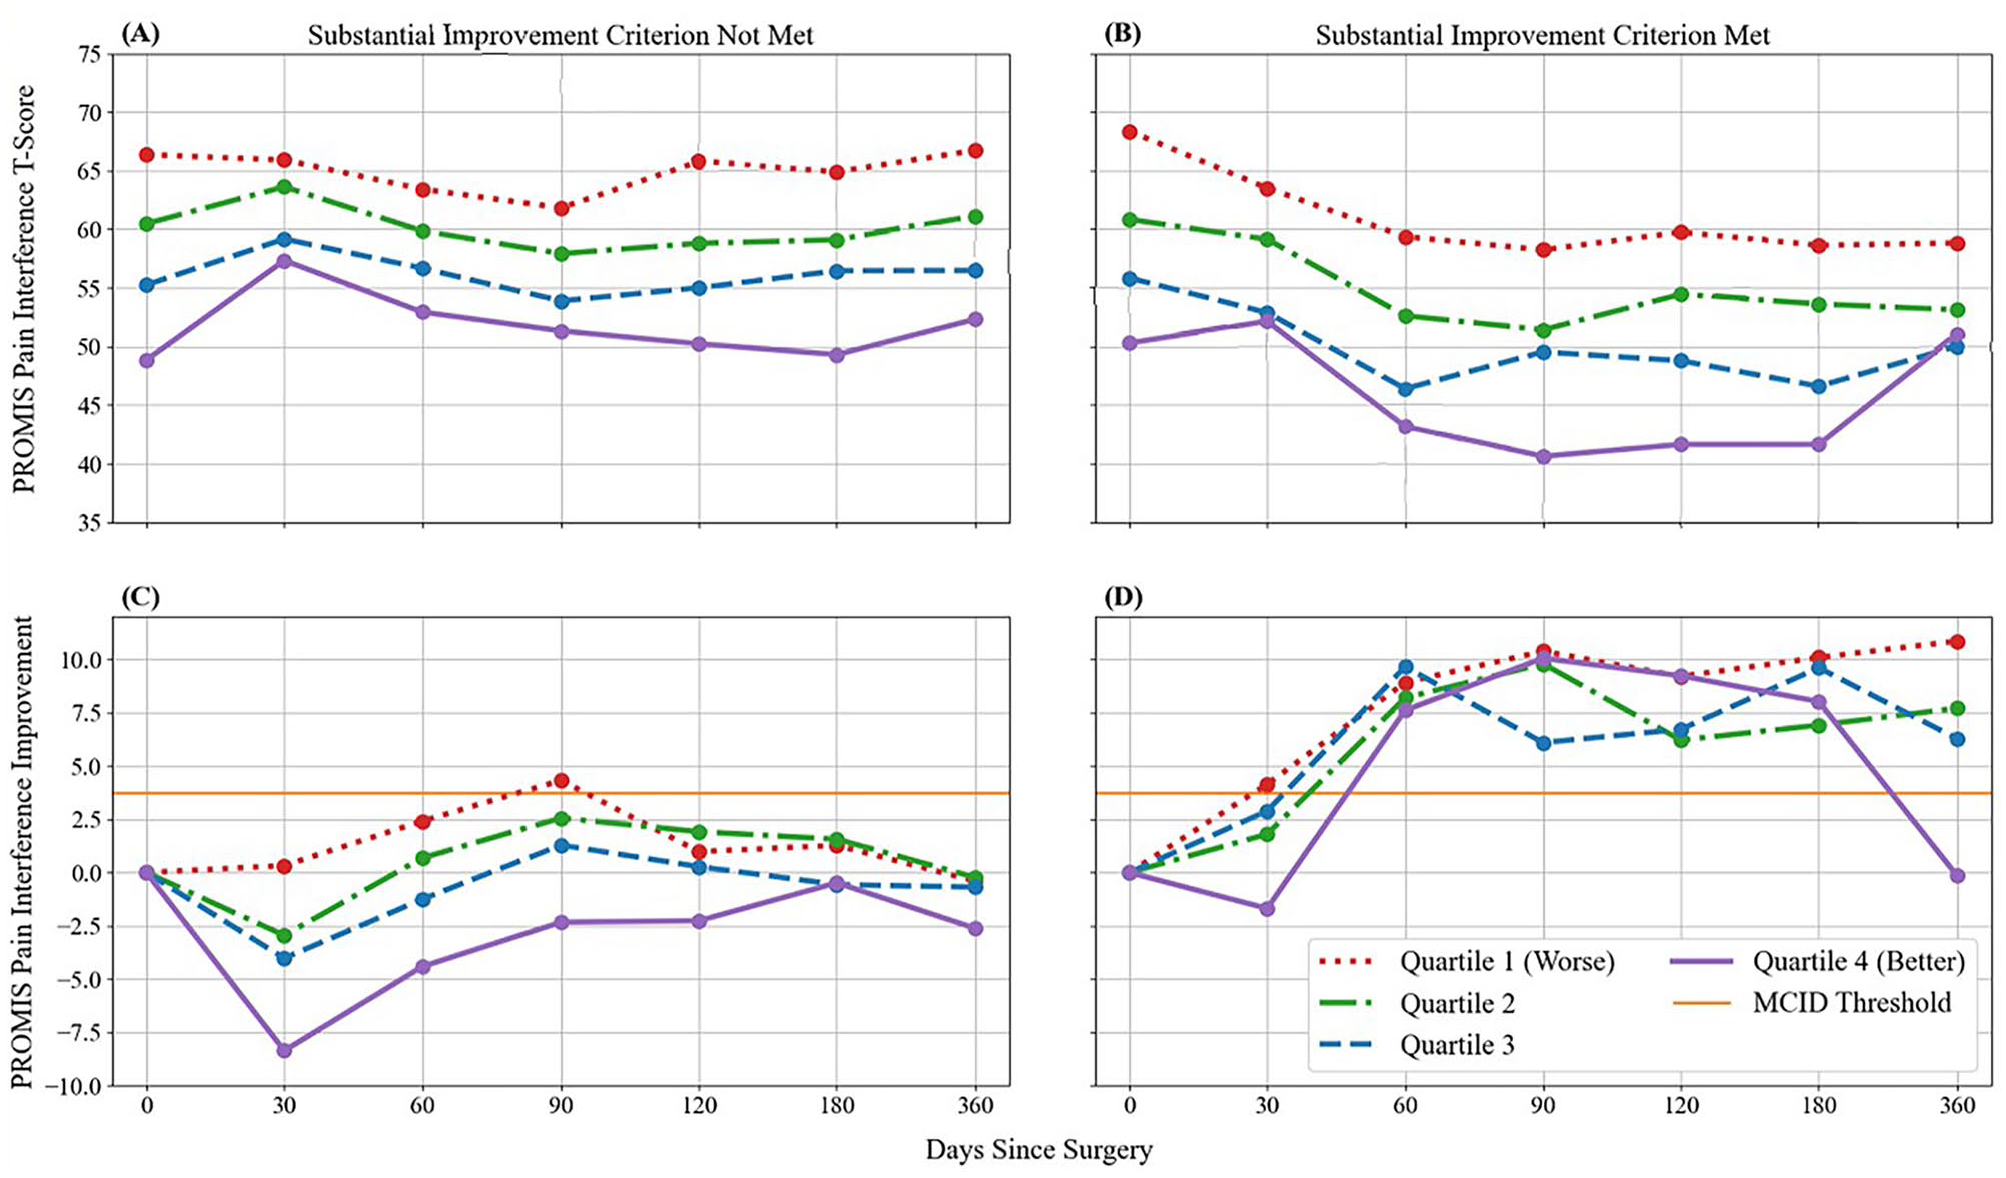
Unadjusted mean PROMIS PI t score (top row) and PROMIS PI improvement scores (bottom row) of elective foot surgery patients. Positive improvement scores indicate lower postoperative t scores relative to their respective preoperative scores. The substantial improvement criterion was defined as 2 consecutive postoperative improvement scores exceeding the distribution-based MCID threshold (shown in orange). Patients are categorized by preoperative t score quartile, with quartile 1 comprising patients with the most severe PI t scores. (A) The unadjusted mean PROMIS PI t scores of patients that did not meet the substantial improvement criterion. (B) The unadjusted mean PROMIS PI t scores of patients that did meet the substantial improvement criterion. (C) The unadjusted mean PROMIS PI improvement scores of patients who did not meet the substantial improvement criterion. (D) The unadjusted mean PROMIS PI improvement scores of patients who did meet the substantial improvement criterion.
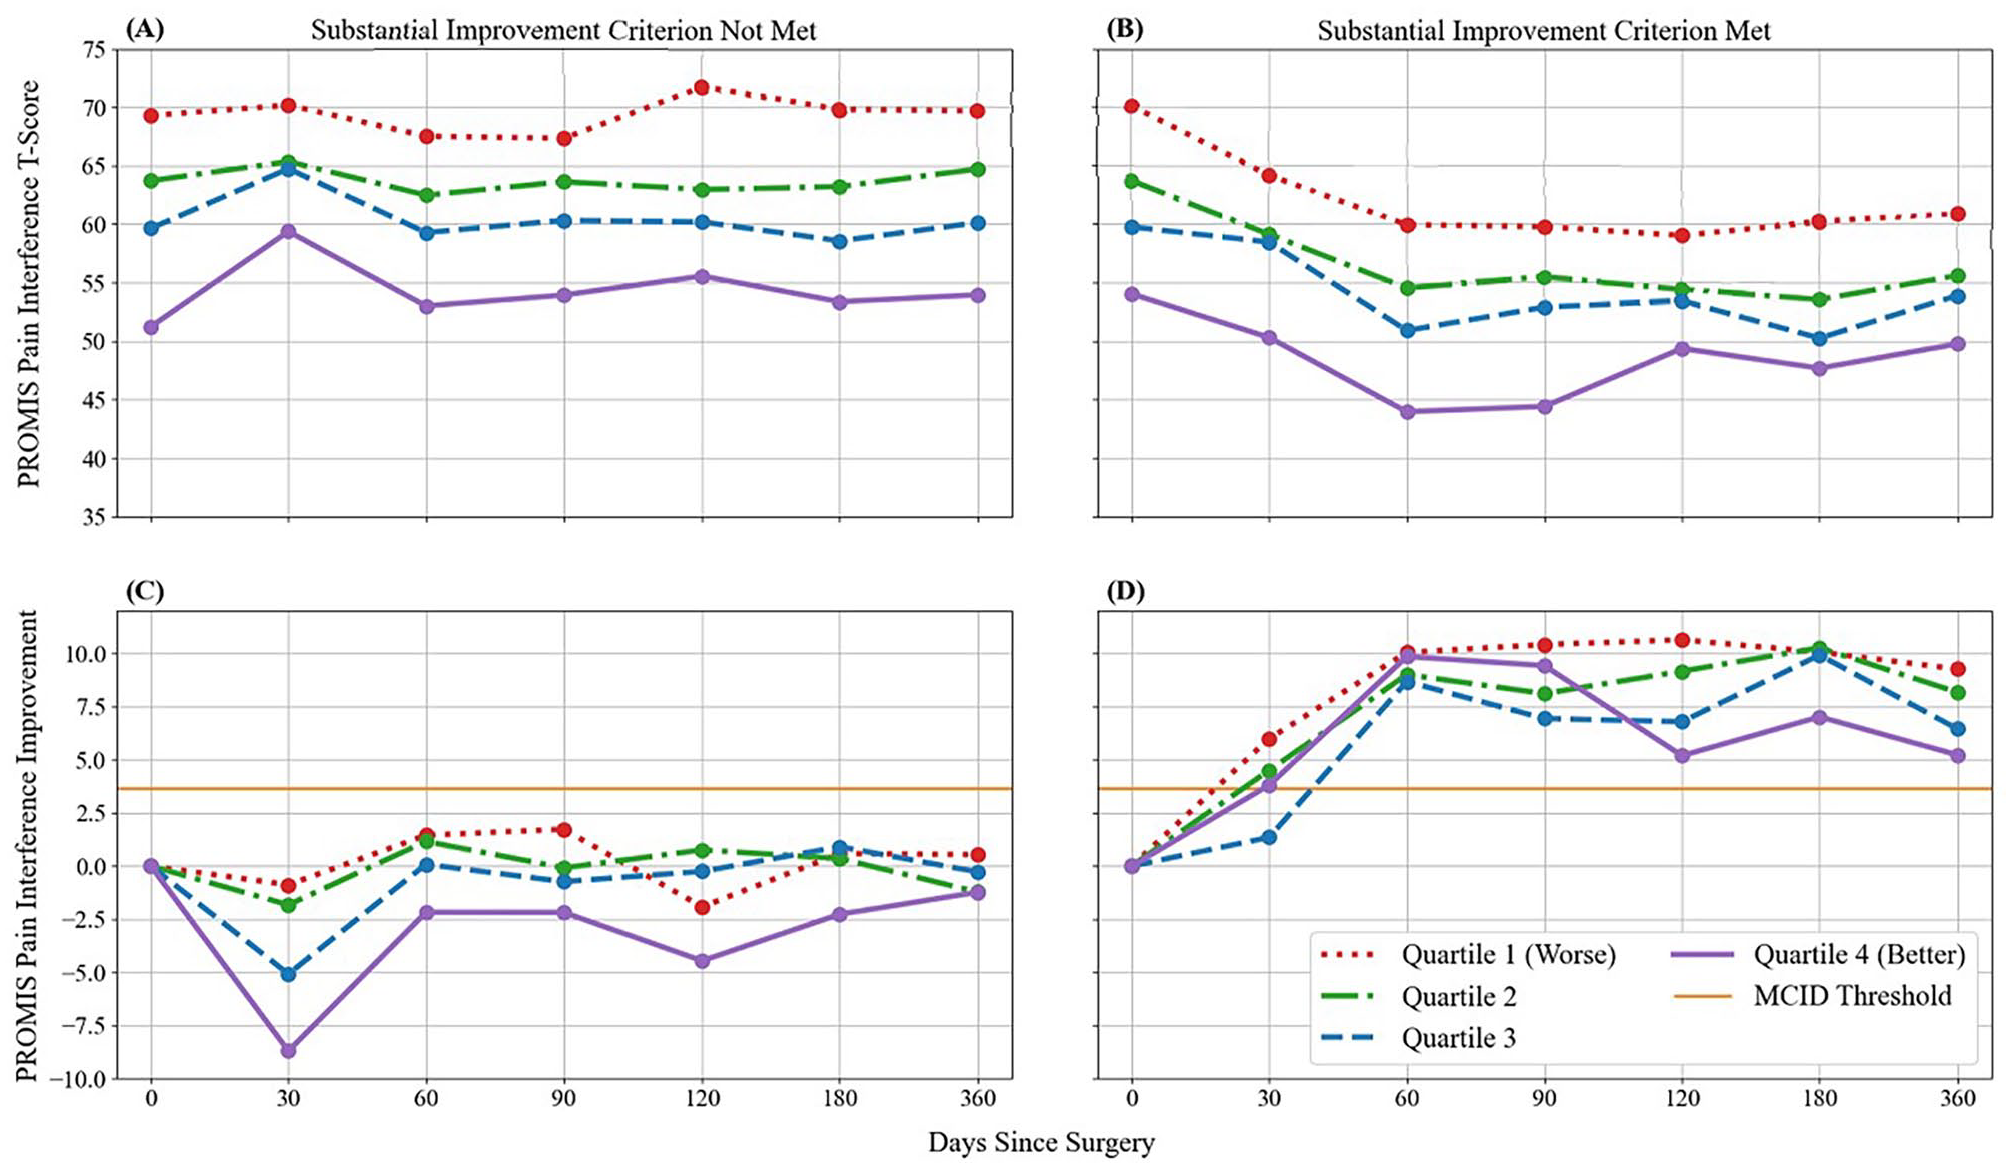
Unadjusted mean PROMIS PI t score (top row) and PROMIS PI improvement scores (bottom row) of elective ankle surgery patients. Positive improvement scores indicate lower postoperative t scores relative to their respective preoperative scores. The substantial improvement criterion was defined as 2 consecutive postoperative improvement scores exceeding the distribution-based MCID threshold (shown in orange). Patients are categorized by preoperative t score quartile with quartile 1 comprising patients with the most severe PI t scores. (A) The unadjusted mean PROMIS PI t scores of patients that did not meet the substantial improvement criterion. (B) The unadjusted mean PROMIS PI t scores of patients that did meet the substantial improvement criterion. (C) The unadjusted mean PROMIS PI improvement scores of patients that did not meet the substantial improvement criterion. (D) The unadjusted mean PROMIS PI improvement scores of patients that did meet the substantial improvement criterion.
Comparing Percentage of Improved Patients Between Quartiles. a
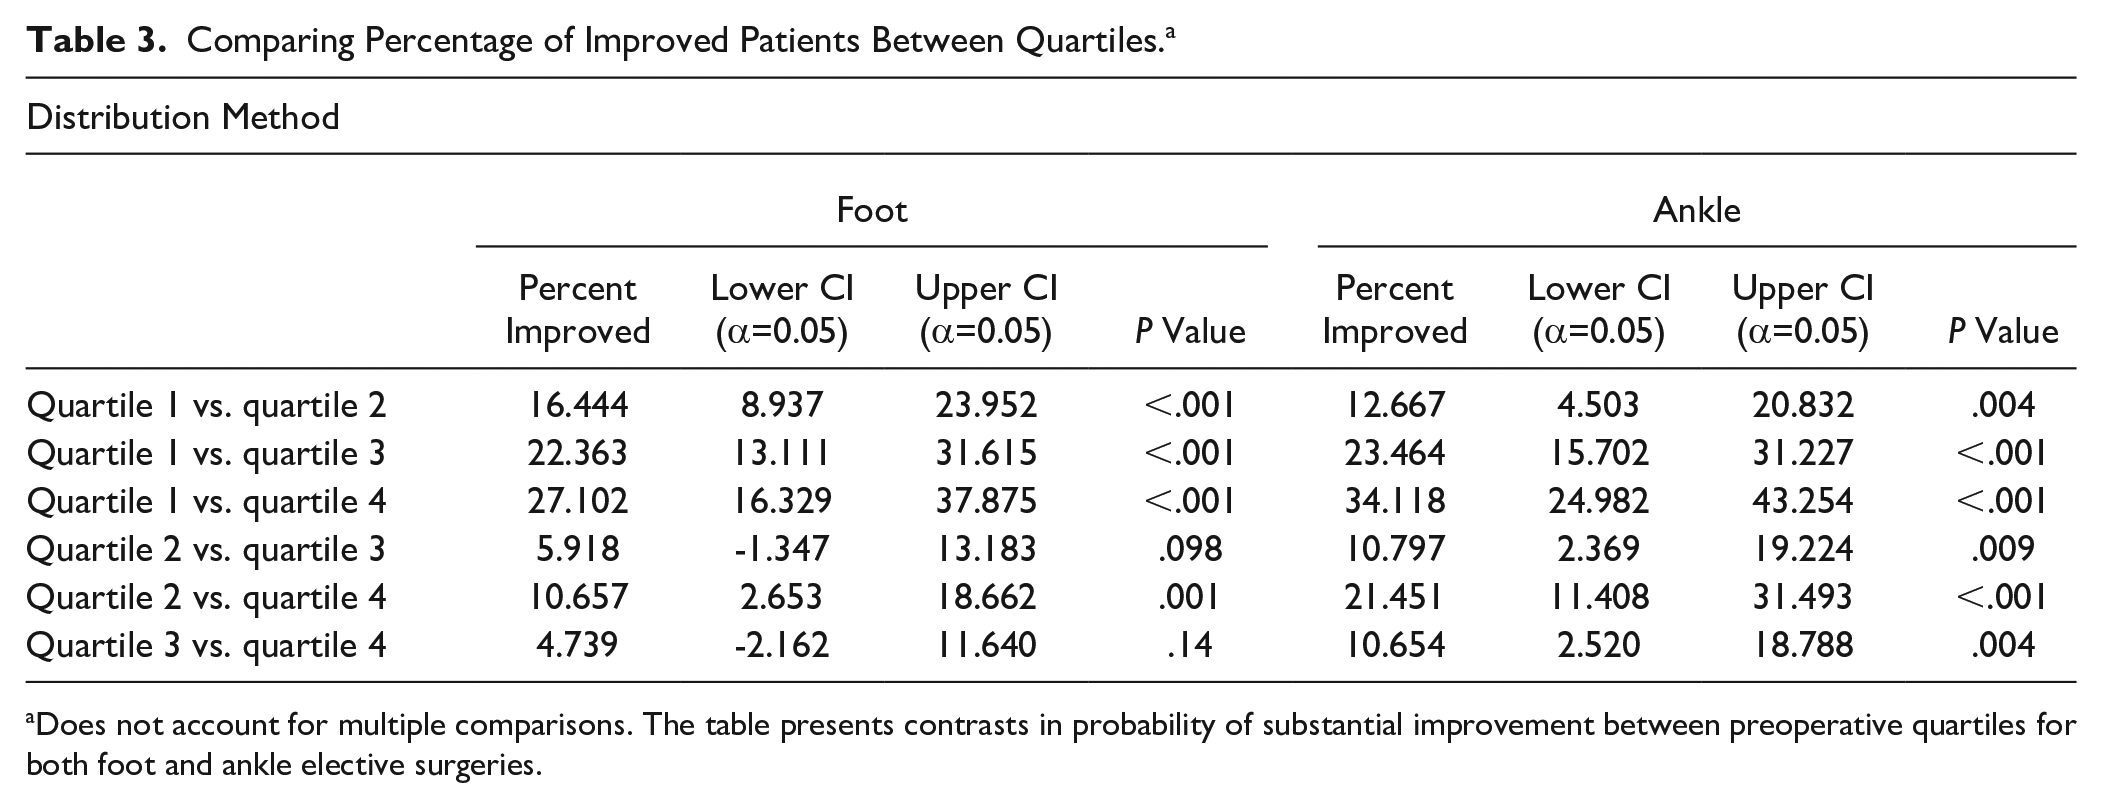
Does not account for multiple comparisons. The table presents contrasts in probability of substantial improvement between preoperative quartiles for both foot and ankle elective surgeries.
Number of Visits and Cost per Visit
On multivariable analysis, the negative binomial regression models showed an overall average of 3.60 (95% CI 3.07, 4.13; P < .001) follow-up visits for foot patients and 4.01 (95% CI 3.70, 4.31; P < .001) visits for ankle patients 9 months after achieving 2 consecutive improvements in MCID (Table 4). The costs of these visits to payors average $266 and $322 per foot and ankle patient, respectively. Total estimated costs for this foot and ankle cohort total to $120 797.
Mean (CI) Number of Visits After Achieving Substantial Improvement by 90 Days Postoperation PROMIS Distribution Method. a
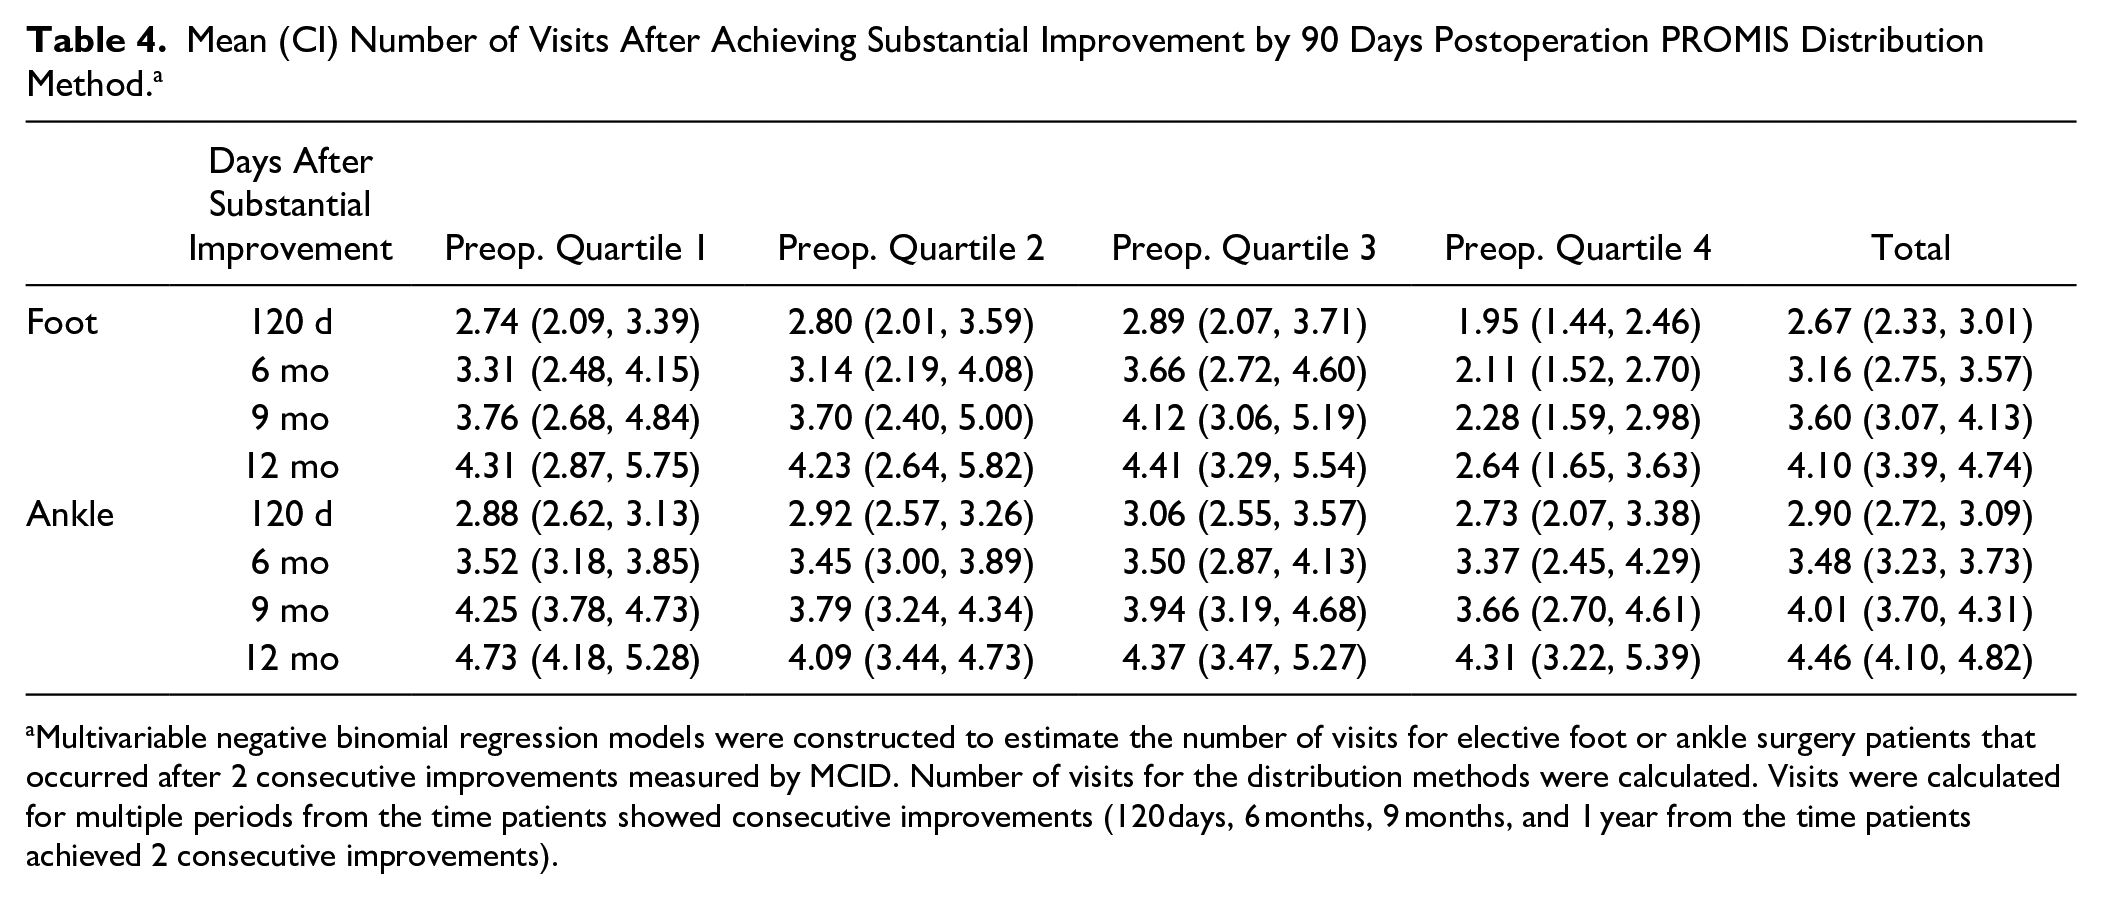
Multivariable negative binomial regression models were constructed to estimate the number of visits for elective foot or ankle surgery patients that occurred after 2 consecutive improvements measured by MCID. Number of visits for the distribution methods were calculated. Visits were calculated for multiple periods from the time patients showed consecutive improvements (120 days, 6 months, 9 months, and 1 year from the time patients achieved 2 consecutive improvements).
Sensitivity Analysis
The MCIDs calculated with anchor questions were 5.52 (SD 3.93) for foot and 6.45 (SD 5.45) for ankle patients. Results using the anchor question–based method for foot and ankle show a lower percentage achieving 2 consecutive improvements when compared to the distribution method. Substantial improvement was achieved by 34% (95% CI 25.11%, 45.68%), 21% (14.87%, 28.65%), 12% (7.72%, 19.25%), and 10% (6.37%, 15.43%) of foot patients at 90 days postoperation whereas ankle patients reported 51% (37.83%, 66.26%), 30% (21.02%, 41.53%), 18% (11.77%, 27.76%), and 12% (6.82%, 19.21%) for quartiles 1 through 4, respectively. Results using anchor-based questions to determine visits after substantial improvement were similar to the distribution method with 3.63 (95% CI 2.96, 4.31; P < .001) visits for foot patients and 4.20 (95% CI 3.84, 4.57; P < .001) visits for ankle patients.
Discussion
High-value care is achieved when a favorable outcome is provided at a relatively low cost. PROMIS PI scores were used to track postoperative progress in patients receiving elective foot and ankle surgery to determine when patients achieved a favorable outcome as measured by 2 consecutive improvements in MCID. Reimbursement rates were used to estimate the cost of visits after patients achieved substantial clinical improvement. Our analysis revealed MCID changes of 3.74 and 3.65 for foot and ankle patients, respectively; these values align with current literature. 17 Two MCID improvements above preoperative scores were more frequently achieved by patients reporting the most preoperative pain: 46.12% of foot and 61.57% of ankle patients in the highest preoperative pain quartile reported improvements by 90 days compared with 12.74% and 15.91% of respective patients in the lowest pain quartile. Additionally, after patients had already achieved these standards, foot and ankle patients continued to attend an average of 3.60 and 4.01 additional follow-up visits during the remaining 9 months of the year. Costs of these visits to payors average $266 and $322 per foot and ankle patient, respectively. Sensitivity analysis using anchor questions to calculate the MCID were consistent with the distribution method, although fewer patients reported improvement, suggesting it to be a more conservative method of predicting postoperative progress.
The correlation between preoperative PROMIS scores and postoperative improvement in this study is in line with prior literature and suggests stratification is necessary when considering future follow-up visits.15,30 Our data suggest those with the lowest preoperative pain are the least likely to report substantial improvement by 90 days postoperation and had the greatest increase in pain during the first year. One possible explanation for the variation within the preoperative pain quartiles is that patients with higher pain may have more potential for improvement. Although a secondary finding of the study, this information may be useful in setting patient expectations prior to surgery, and physicians may caution patients with low preoperative pain against surgery.
These results call into question the value of visits to after substantial improvement is achieved. Some may suppose all visits that occur after substantial improvement is achieved should cease because they are of little value; however, patient care is more nuanced requiring physicians to consider individual patient needs and act accordingly. The current study is helpful in identifying current costs, follow-up patterns, and prevalence of visits after substantial improvement has occurred. Although further research is needed to implement and compare alternatives to in-person follow-up, this study highlights a potential inefficiency in postoperative follow-up. We provide a time table of when such inefficiencies start to occur. Additionally, we propose a method in which PROs can be used as a tool to guide management and help physicians identify when to have discussions about reducing the number of follow-up visits.
Patients typically end postoperative assessment when physicians tell them to “follow up as needed,” or by scheduling a follow-up visit when patients are doing well. Leaving patients to choose to return or not based on whether they think it is worth their time and money poses several concerns. First, if patients were to take this advice, a physician may be left with a “no-show” appointment, which causes inefficiencies. Second, patients may not be spending their own money on these visits. Depending on copays, deductible schedules, and insurance type, patients likely are not making decisions purely based on personal economics. Such visits may be accruing unnecessary costs to the health system. Third, if patients are lost to follow up, physicians may conclude patients stopped follow-up because they are doing well, but it may be the result of other reasons including socioeconomic challenges, commuting distance to the physician office, lack of transportation or financial resources, or inability to take time off work.1,10,12,23,35 Fourth, the knowledge gap between physicians and patients can be vast. Suggesting to a patient to follow up as needed can pose difficulties when patients are unaware of indications for subsequent follow-up.
Alternatively, patient follow-up can continue without in-person clinic visits. When patients are making significant improvements, remote follow-up may be just as effective and more cost efficient for both the patient and physician. Electronic collection of PROs through email, online patient dashboards, or text messaging can assess complications and determine the need for additional interventions. Additionally, many research publications require a minimum of 1 or 2 years of postoperative follow-up.1,8,25,32 Although this standard allows for adequate understanding of recovery, results may be biased because healthy patients are less likely to continue medical assessment after substantial improvement. 19 Remote collection of PROs could support this or even longer follow-up. Although challenges exist in obtaining remote follow-up data, additional research can lead to more effective methods of obtaining postoperative outcomes remotely.1,19
Payment methods may influence postoperative care. In a fee-for-service model, follow-up visits after the global period provide additional revenue. In value-based care models, health systems financially benefit when patients recover in the global period and are not seen after 90 days.7,15 Such incentives may influence health systems’ utilization of remote postoperative visits, which are less costly than in-person visits. 1
Limitations
This is a retrospective study, limiting conclusions regarding causation. When estimating the cost of follow-up appointments, reimbursement rates were used and out-of-pocket payments by patients were not calculated. Direct costs of imaging and supplies in addition to indirect costs such as travel, lost work, and child care were not included in the cost analysis. Patients received a wide variety of foot and ankle surgeries including fusions, amputation, tendon repairs, and arthroplasty. Although some may view heterogeneity with concern, it is likely not a limitation as MCID is not dependent on disease severity, and the concept of MCID is not intended to be disease specific. 17 This study was limited to a single health system and geographic region limiting generalizability. Finally, MCIDs are statistical constructs and may over- or underestimate a patient’s perceived improvement. Although the included anchor questions and sensitivity analysis provide additional context to the distribution-based MCID, some patients may not be completely satisfied with 2 consecutive improvements above preoperative levels. Future studies should consider adding the validated Patient Acceptable Symptom State (PASS) question, which obtains a binary (yes/no) response by asking patients when they feel adequately recovered. 21
Conclusion
Postoperative follow-up visits are time-consuming and costly. Physicians should consider objective measures, such as PROMIS PI, to determine the need, timing, and alternatives for in-person follow-up visits for elective foot and ankle surgeries after patients demonstrate reliable clinical improvement.
Supplemental Material
sj-pdf-1-fai-10.1177_10711007241230544 – Supplemental material for Using PROMIS Scores to Provide Cost-Conscious Follow-up After Foot and Ankle Surgery
Supplemental material, sj-pdf-1-fai-10.1177_10711007241230544 for Using PROMIS Scores to Provide Cost-Conscious Follow-up After Foot and Ankle Surgery by Jefferson Hunter, Gabriel Ramirez, Caroline Thirukumaran and Judith Baumhauer in Foot & Ankle International
Supplemental Material
sj-xlsx-2-fai-10.1177_10711007241230544 – Supplemental material for Using PROMIS Scores to Provide Cost-Conscious Follow-up After Foot and Ankle Surgery
Supplemental material, sj-xlsx-2-fai-10.1177_10711007241230544 for Using PROMIS Scores to Provide Cost-Conscious Follow-up After Foot and Ankle Surgery by Jefferson Hunter, Gabriel Ramirez, Caroline Thirukumaran and Judith Baumhauer in Foot & Ankle International
Supplemental Material
sj-xlsx-3-fai-10.1177_10711007241230544 – Supplemental material for Using PROMIS Scores to Provide Cost-Conscious Follow-up After Foot and Ankle Surgery
Supplemental material, sj-xlsx-3-fai-10.1177_10711007241230544 for Using PROMIS Scores to Provide Cost-Conscious Follow-up After Foot and Ankle Surgery by Jefferson Hunter, Gabriel Ramirez, Caroline Thirukumaran and Judith Baumhauer in Foot & Ankle International
Supplemental Material
sj-xlsx-4-fai-10.1177_10711007241230544 – Supplemental material for Using PROMIS Scores to Provide Cost-Conscious Follow-up After Foot and Ankle Surgery
Supplemental material, sj-xlsx-4-fai-10.1177_10711007241230544 for Using PROMIS Scores to Provide Cost-Conscious Follow-up After Foot and Ankle Surgery by Jefferson Hunter, Gabriel Ramirez, Caroline Thirukumaran and Judith Baumhauer in Foot & Ankle International
Footnotes
Ethical Approval
Ethical approval for this study was obtained from the University of Rochester School of Medicine and Dentistry (IRB #69111; CLICK # 1427).
Declaration of Conflicting Interests
The author(s) declared the following potential conflicts of interest with respect to the research, authorship, and/or publication of this article: Judith Baumhauer, MD, MPH, reports leadership or fiduciary role in other board, society, committee, or advocacy group from PROMIS Health Organization, with no payment. Disclosure forms for all authors are available online.
Funding
The author(s) received no financial support for the research, authorship, and/or publication of this article.
Supplemental Material
Supplementary material is available online with this article.
References
Supplementary Material
Please find the following supplemental material available below.
For Open Access articles published under a Creative Commons License, all supplemental material carries the same license as the article it is associated with.
For non-Open Access articles published, all supplemental material carries a non-exclusive license, and permission requests for re-use of supplemental material or any part of supplemental material shall be sent directly to the copyright owner as specified in the copyright notice associated with the article.