
Abstract
Background:
Ankle osteoarthritis (OA) mainly arises from trauma, particularly lateral ligament injuries. Among lateral ligament injuries, ankles with calcaneofibular ligament (CFL) injuries exhibit increased instability and can be a risk factor ankle OA progression. However, the relationship between CFL injury and OA progression remains unclear. Therefore, this study aims to assess the relationship between CFL injuries and ankle OA by investigating stress changes and osteophyte formation in subtalar joint.
Methods:
We retrospectively reviewed the magnetic resonance imaging (MRI) and plain radiographic evaluations of 100 ankles of 91 patients presenting with chronic ankle instability (CAI), ankle OA, or other ankle conditions. The association between CFL injuries on the oblique view of MRI and the severity of ankle OA (based on Takakura-Tanaka classification) was statistically evaluated. Additionally, 71 ankles were further subjected to CT evaluation to determine the association between the CFL injuries and the Hounsfield unit (HU) ratios of the subtalar joint and medial gutter, and the correlation between the subtalar HU ratios and osteophyte severity were statistically evaluated.
Results:
CFL injury was observed in 35.9% (14/39) of patients with stage 0, 42.9% (9/21) with stage 1, 50.0% (10/20) with stage 2, 100% (9/9) with stage 3a, and 90.9% (10/11) with stage 3b. CFL-injured ankles exhibited higher HU ratios in the medial gutter and lower ratios in the medial posterior subtalar joint compared to uninjured ankles. A negative correlation was observed between medial osteophyte severity and the medial subtalar joint HU ratio.
Conclusion:
Our findings suggest that CFL injuries are common in severe ankle OA impairing the compensatory function of the subtalar joint through abnormal stress distribution and osteophyte formation.
Introduction
Ankle osteoarthritis (OA) can impair daily life activities because of severe pain and functional disability. 22 This condition develops due to trauma, especially ligament injuries.2,25 Notably, 85% of post-traumatic ligamentous ankle OA is caused by the lateral ankle ligament injury. 24 The lateral ankle ligament can be injured by inversion sprain, which commonly occurs during activities of daily living, including sports and recreational activities. 3 Therefore, treating lateral ligament injury before progressing to ankle OA is important. However, detecting early OA is challenging, and the risk factors for progression of ankle OA remain unclear.
The lateral ankle ligaments are composed of the anterior talofibular ligament (ATFL), calcaneofibular ligament (CFL), and posterior talofibular ligament. Following an ankle sprain, 10% to 30% of ankles advance to chronic ankle instability (CAI). 1 Among these cases, 80% have been associated with an isolated tear of ATFL and 20% with a combined rupture of the ATFL and CFL. 1 Ankles with combined rupture of the ATFL and CFL exhibit greater instability than those with isolated tears of the ATFL, 11 potentially becoming a risk factor for the progression of ankle OA because of the unbalanced load exerted on the ankle joint. 17 However, the role of CFL injuries in ankle OA progression has not yet been explored.
The subtalar joint has the function of compensating for imbalanced stress in the ankle joint and plays a key factor in preventing OA progression. 5 Because CFL is a strong stabilizer of the ankle and subtalar joints, dysfunction in the CFL significantly affects the kinematics of the subtalar joint, potentially disrupting the compensatory mechanism during OA progression. We hypothesized that the frequency of CFL injury complications might increase and stress distribution in the ankle and subtalar joints would alter as OA progresses. The purpose of this study was to investigate the relationship among CFL injury, OA progression, and morphologic changes including stress distribution in the ankle and subtalar joints.
Material and Methods
Patients
A retrospective review was conducted on a total of 100 ankles of 91 patients with CAI, ankle OA, and other ankle diseases between November 2019 and April 2023. They comprised 32 men and 59 women, with a mean age of 37.2 ± 21.1 (range, 14-87) years. Fifty-seven ankles were diagnosed with CAI, 20 with ankle OA, and 23 with other ankle conditions, including peroneus dislocation, synovitis of the peroneus tendon, hallux valgus, or unidentified ankle pain. All patients with CAI and ankle OA were confirmed to have ATFL injuries through magnetic resonance imaging (MRI). The inclusion criteria encompassed patients who underwent weightbearing plain radiography of the ankle and MRI with a 0.8-mm slice, including an oblique view. Exclusion criteria comprised patients with valgus ankle OA and those with a history of ankle joint fracture. Additionally, 71 ankles of 65 patients who underwent a computed tomography (CT) scan were analyzed. They comprised 24 men and 41 women with a mean age of 38.8 ± 20.9 (range, 14-87) years (Table 1). CAI diagnosis was confirmed through medical history documentation, physical examination, stress radiography, and MRI. Ankle OA was confirmed via plain radiography in the standing position. This study was approved by the local ethics committee of our university and was conducted in accordance with the Declaration of Helsinki. Informed consent was obtained from all participants included in this study.
Patient Demographics.
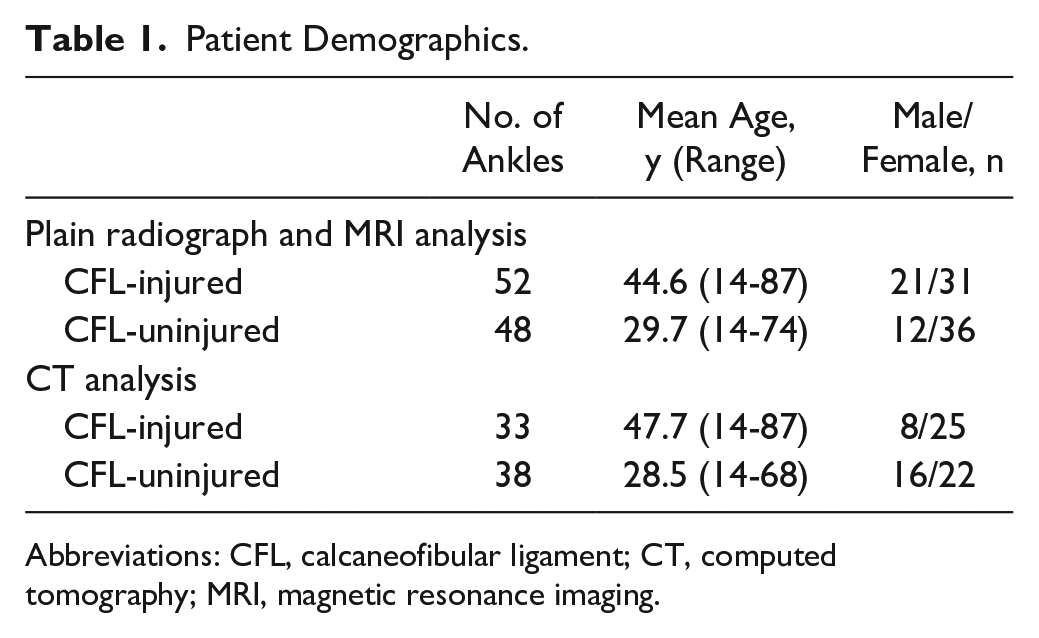
Abbreviations: CFL, calcaneofibular ligament; CT, computed tomography; MRI, magnetic resonance imaging.
Plain Radiograph Evaluation
Plain anteroposterior ankle radiographs were acquired in a standing position. The tibial anterior surface (TAS) angle formed between the tibial axis and the articular surface of the distal tibia was measured. Additionally, the severity of ankle OA was classified using the Takakura-Tanaka classification: (1) stage 1: no narrowing of the joint space, but early sclerosis and formation of osteophytes; (2) stage 2: narrowing of the medial joint space; (3) stage 3a: obliteration of the joint space was limited to the medial malleolus; (4) stage 3b: the obliteration extended to the roof of the dome of the talus; and (5) stage 4: obliteration of the whole joint space with complete bone contact. 20
MRI Evaluation
MRI was performed using a 1.5-tesla (T) MR unit (PHILIPS 1.5 T Achieva Release 3.2.3.4) using a dedicated foot/ankle coil. The following sequences were obtained: 3D T2-weighted images, a repetition time (TR) of 1500 ms, echo time (TE) of 75 ms, a field of view (FOV) of 150 mm, matrix dimensions of 240 × 240, and a slice thickness of 0.8 mm with a 0.4-mm gap. During the MRI scan, the ankle joint was held at 0 degrees parallel to the long axis of the ATFL, and axial images were acquired. The CFL was evaluated on MRI, following established methodologies16,18 The fibular obscure tubercle, a bony landmark for identifying the footprints of the CFL, was identified on the sagittal images. The CFL was identified in the oblique CFL view based on the sagittal image scanning line, which indicated each slice level. The CFL on MRI was classified into one of the following 5 categories: (1) intact; (2) absent; (3) thin (less than 1 mm diameter); (4) normally thick CFL but that appears stretched, irregular, or wavy; and (5) a thickened CFL (more than 3.2 mm diameter) with or without an increase in intraligamentous signal intensity. A CFL injury was defined on the MRI scans as the CFL being absent, thin, irregular, wavy, or thick.
CT Evaluation
Images of all ankles in the coronal, sagittal, and axial planes were acquired using a 64-multidetector-row CT scanner (LightSpeed QX/I; GE Medical System, Milwaukee, WI). After scanning, 2D images were reconstructed with a 25-cm field of volume, a 1.25-mm retrospective slice thickness, and a 0.63-mm overlap. Calibrations of the CT to guarantee standardized image quality were carried out monthly. Subsequently, the Hounsfield unit (HU) values were quantitatively evaluated to assess the stress distribution on the talar and calcaneal joint surfaces of the subtalar joint and talar and tibial joint surfaces of the medial gutter. The talar and calcaneal surfaces of the subtalar joints were divided into 4 regions (medial anterior, lateral anterior, medial posterior, and lateral posterior). Within each region, 3 points of regions of interest (ROIs) in a 6.2-mm2 area in the subarticular spongiosa, just below the subchondral bone plate, were set in each talar and calcaneal subtalar joint surface areas in the sagittal slice, and talar and tibial medial gutter joint surface in the axial slice, and the HU values of the ROIs were measured. Additionally, the HU values at the center of the tibial interosseous edge in the same slice of the subtalar joint surface and at the center of the fibula in the same slices of the medial gutter were measured as references. The HU values of the subtalar joint surface and medial gutter are divided by the reference HU values to calculate HU ratios (Figure 1).
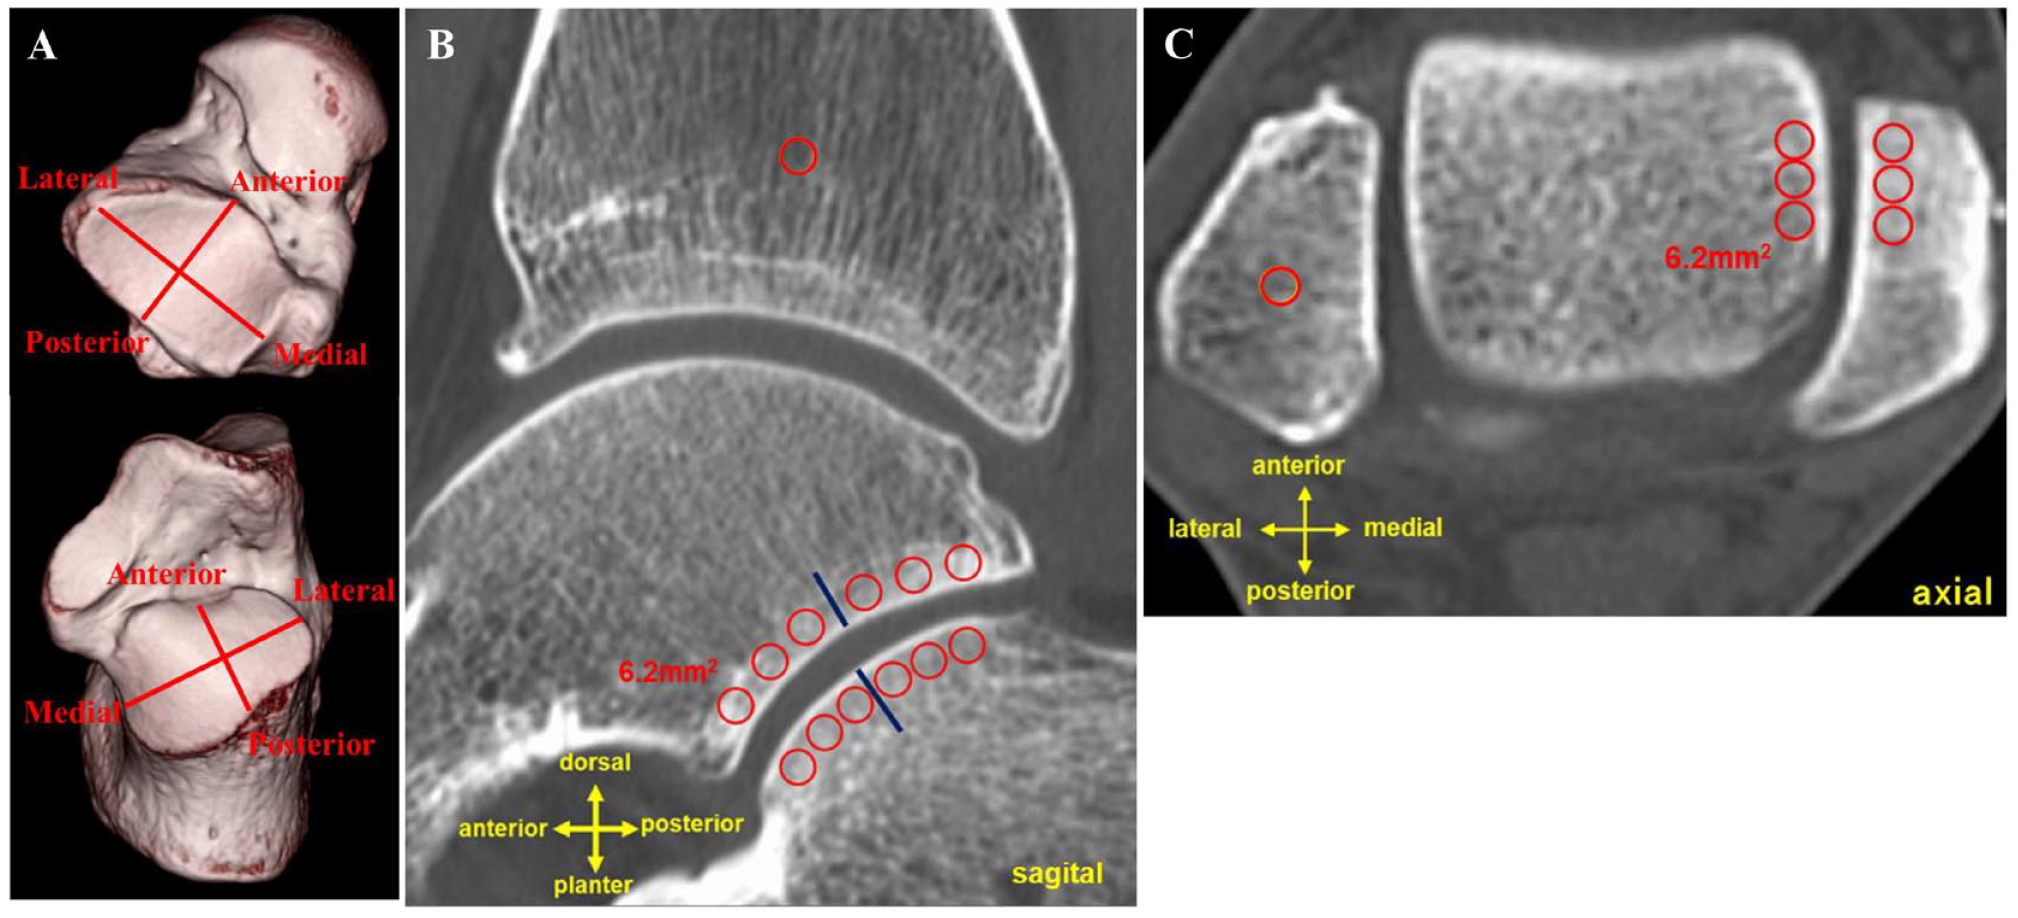
The region of interest (ROI) was set in computed tomography (CT) images to measure the Hounsfield units. (A) The subtalar joint was divided into 4 areas. (B) ROIs of the subtalar joint. The ROI was also set at the center of the tibial interosseous edge in the same slice as the reference. (C) ROIs in the medial gutter. The ROI was also set at the center of the fibula in the same slice as the reference.
Furthermore, we classified the severity of the osteophyte of the subtalar joint on 3D CT. The severity was graded on the talar and calcaneal joint surfaces using a scale from 0 to 3 in 4 regions, following the Kraus classification. 9 The osteophyte score was calculated as the total osteophyte severity in the subtalar joint (ranging from 0 to 24) (Figure 2).
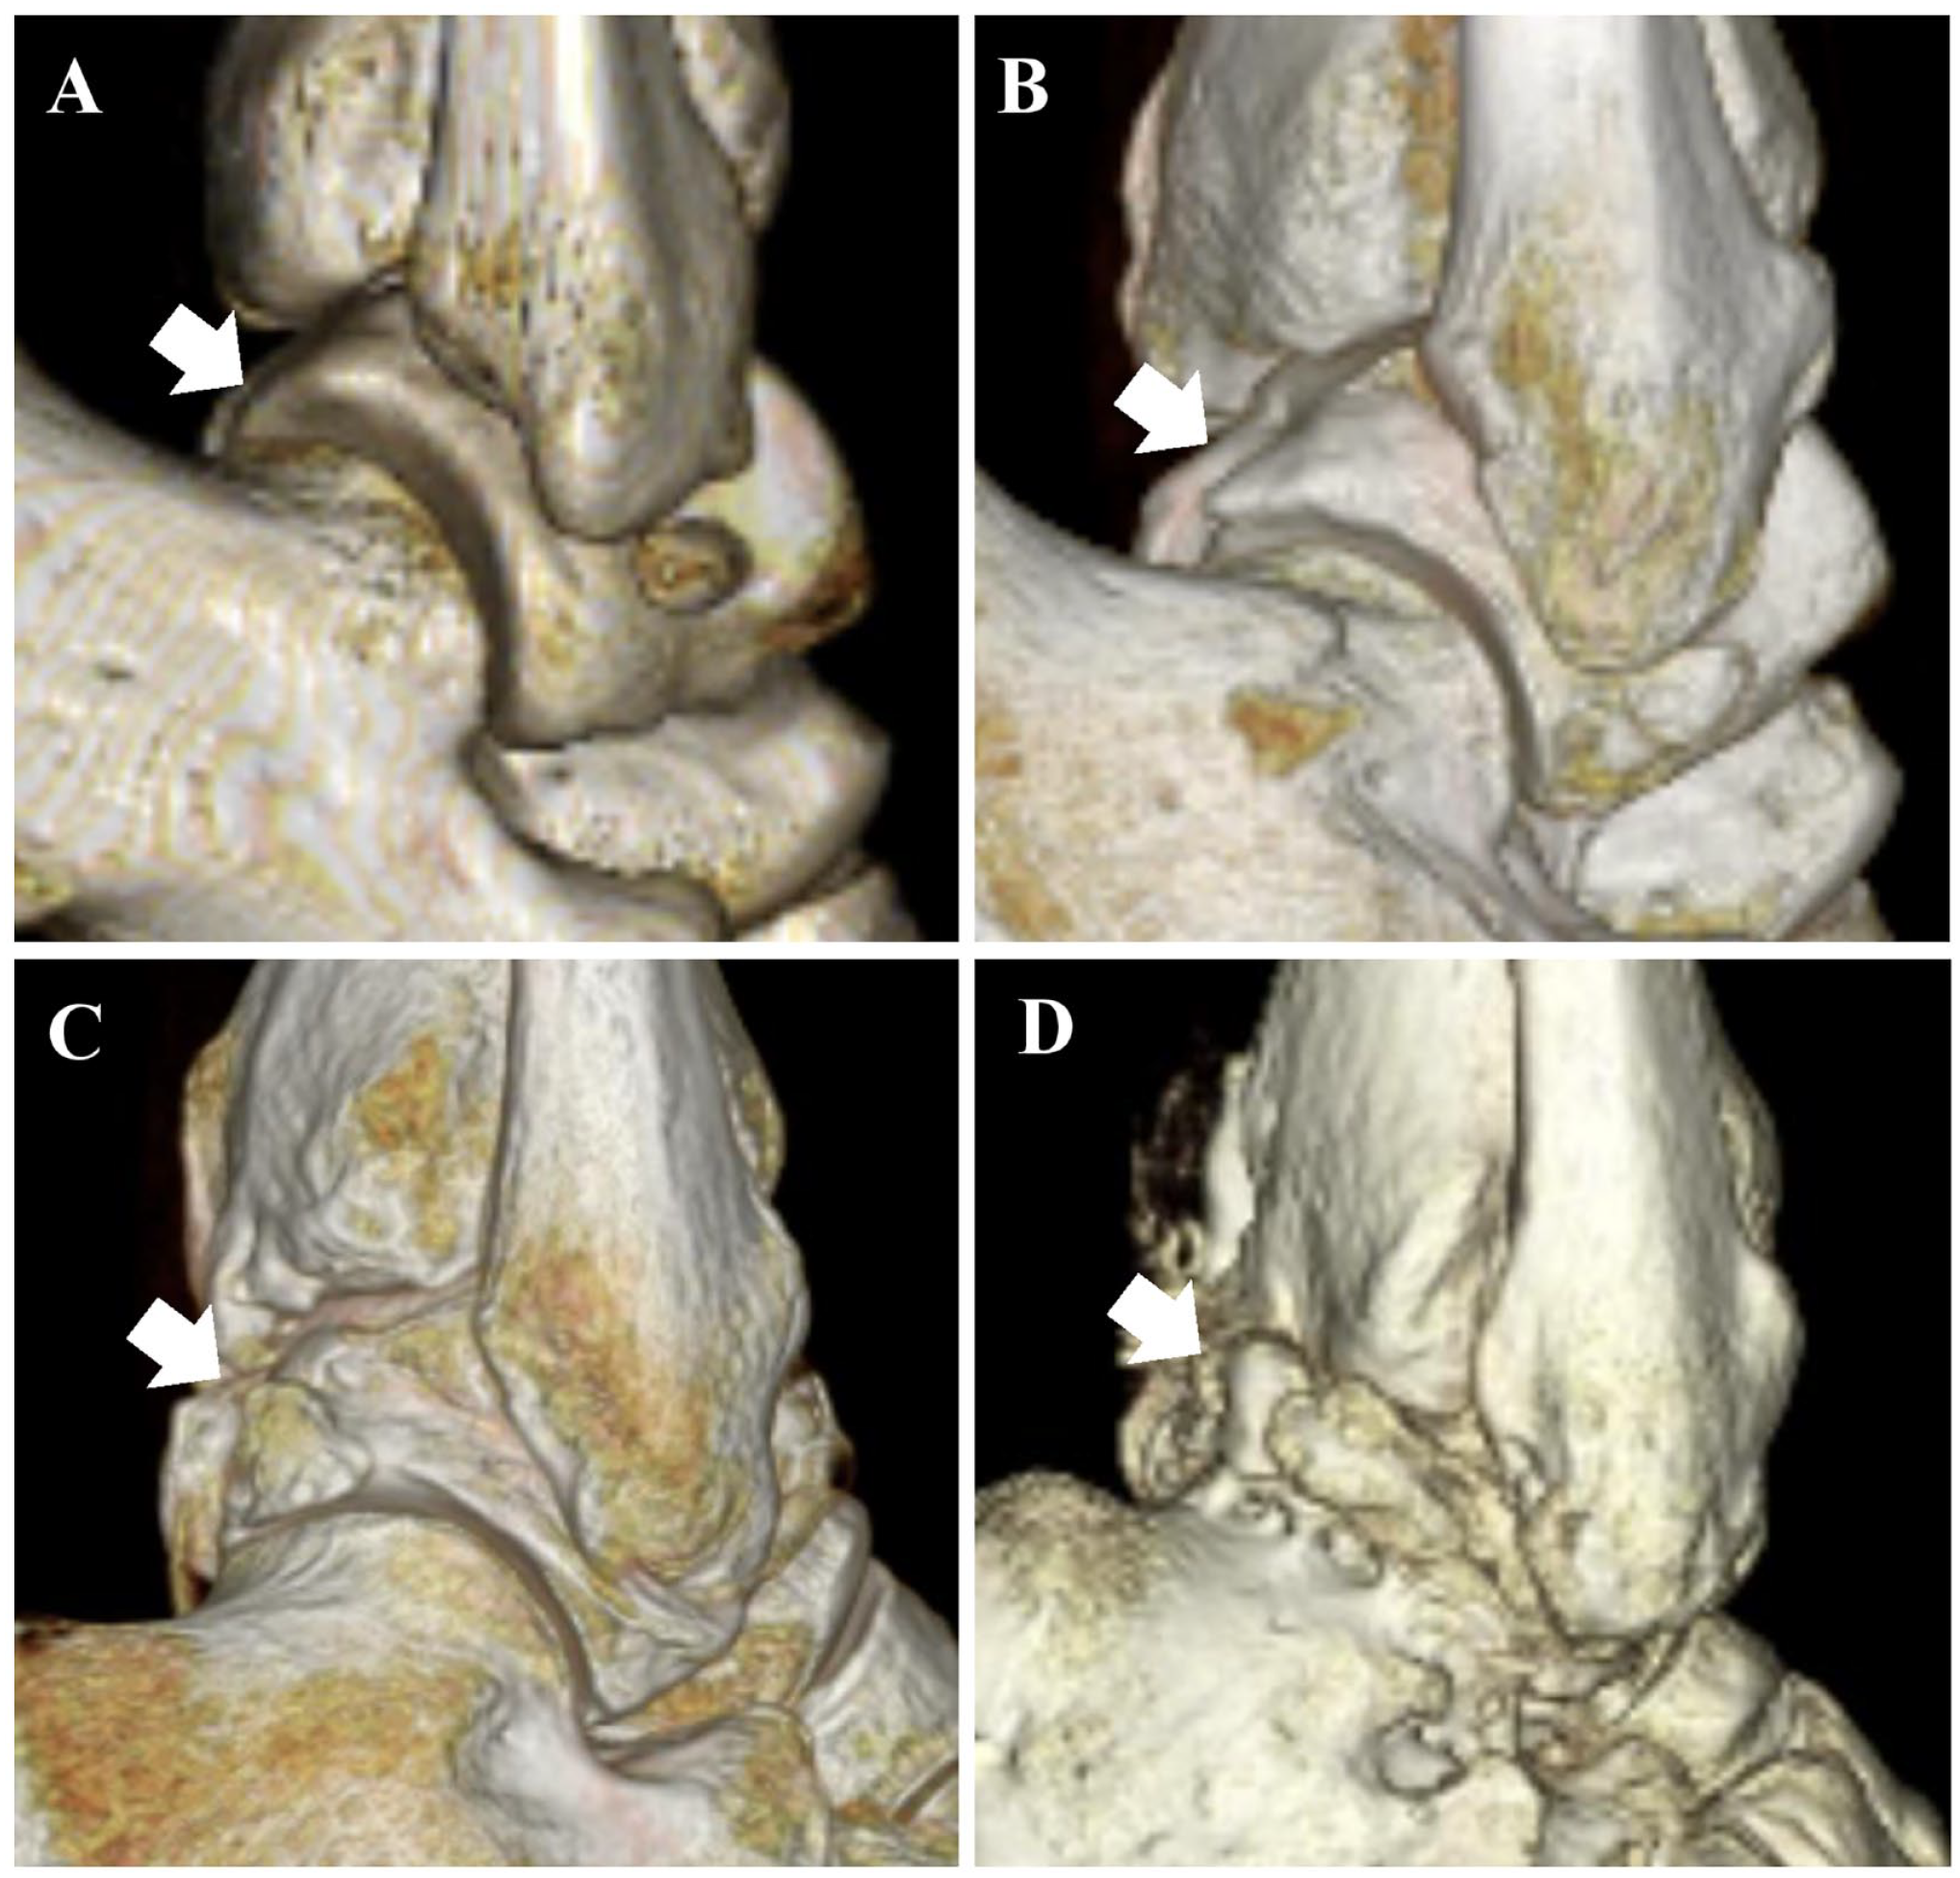
Scoring the severity of the osteophyte at the subtalar joint (arrow). (A) 0 = absent, (B) 1 = small, (C) 2 = moderate, and (D) 3 = large.
Statistical Analysis
The TAS angles of each Tanaka-Takakura classification and the HU ratios in the CFL injured and uninjured groups were compared using the Kruskal-Wallis test. The correlation between the TAS angle and the subtalar HU ratio, the TAS angle and osteophyte score, and the subtalar HU ratios and osteophyte score was examined using the Spearman correlation coefficient. Statistical significance was set at a P value of less than .05. The intrainter reliability of HU ratios was evaluated using the intraclass correlation coefficient (ICC). The ICC values were interpreted as follows: less than 0.40, poor agreement; between 0.40 and 0.75, fair to a good agreement; and greater than 0.75, excellent agreement. All statistical analyses were performed with EZR (Saitama Medical Center, Jichi Medical University, Saitama, Japan), which is a graphical user interface for R (The R Foundation for Statistical Computing, Vienna, Austria). More precisely, it is a modified version of R commander designed to add statistical functions frequently used in biostatistics.
Results
CFL injuries were observed in 35.9% (14/39) of ankles in stage 0, 42.9% (9/21) in stage 1, 50.0% (10/20) in stage 2, 100% (9/9) in stage 3a, and 90.9% (10/11) in stage 3b (Table 2) (Figure 3). The mean TAS angles were 88.6 ± 1.7 degrees in stage 0, 87.5 ± 2.6 degrees in stage 1, 86.8 ± 2.3 degrees in stage 2, 84.3 ± 2.5 degrees in stage 3a, and 85.8 ± 2.5 degrees in stage 3b. The TAS angles of the ankle with CFL injury (mean; 86.3 ± 2.5 degrees) are significantly larger than that without CFL injury (mean, 89.1 ± 1.9 degrees) in stage 1 (P < .05).
The Number of CFL Injuries per Takakura-Tanaka Classification.
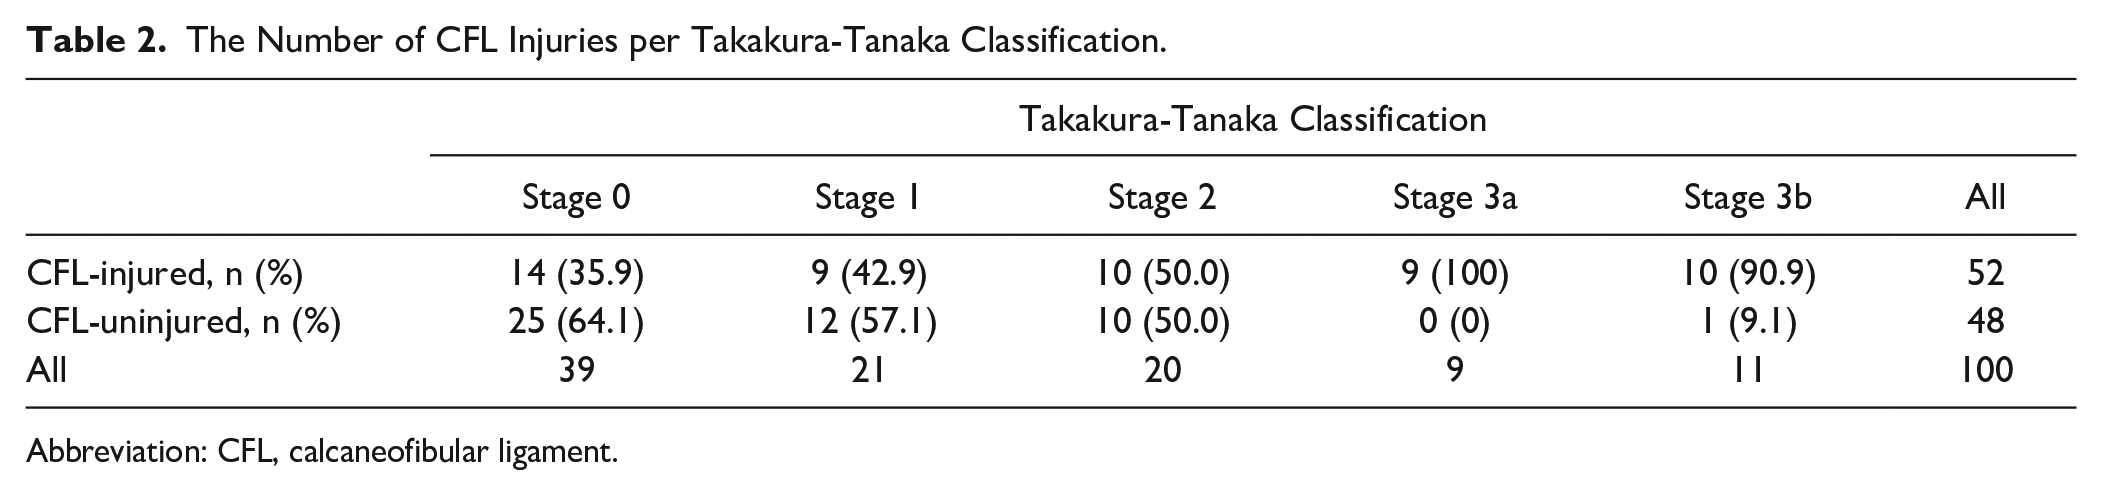
Abbreviation: CFL, calcaneofibular ligament.
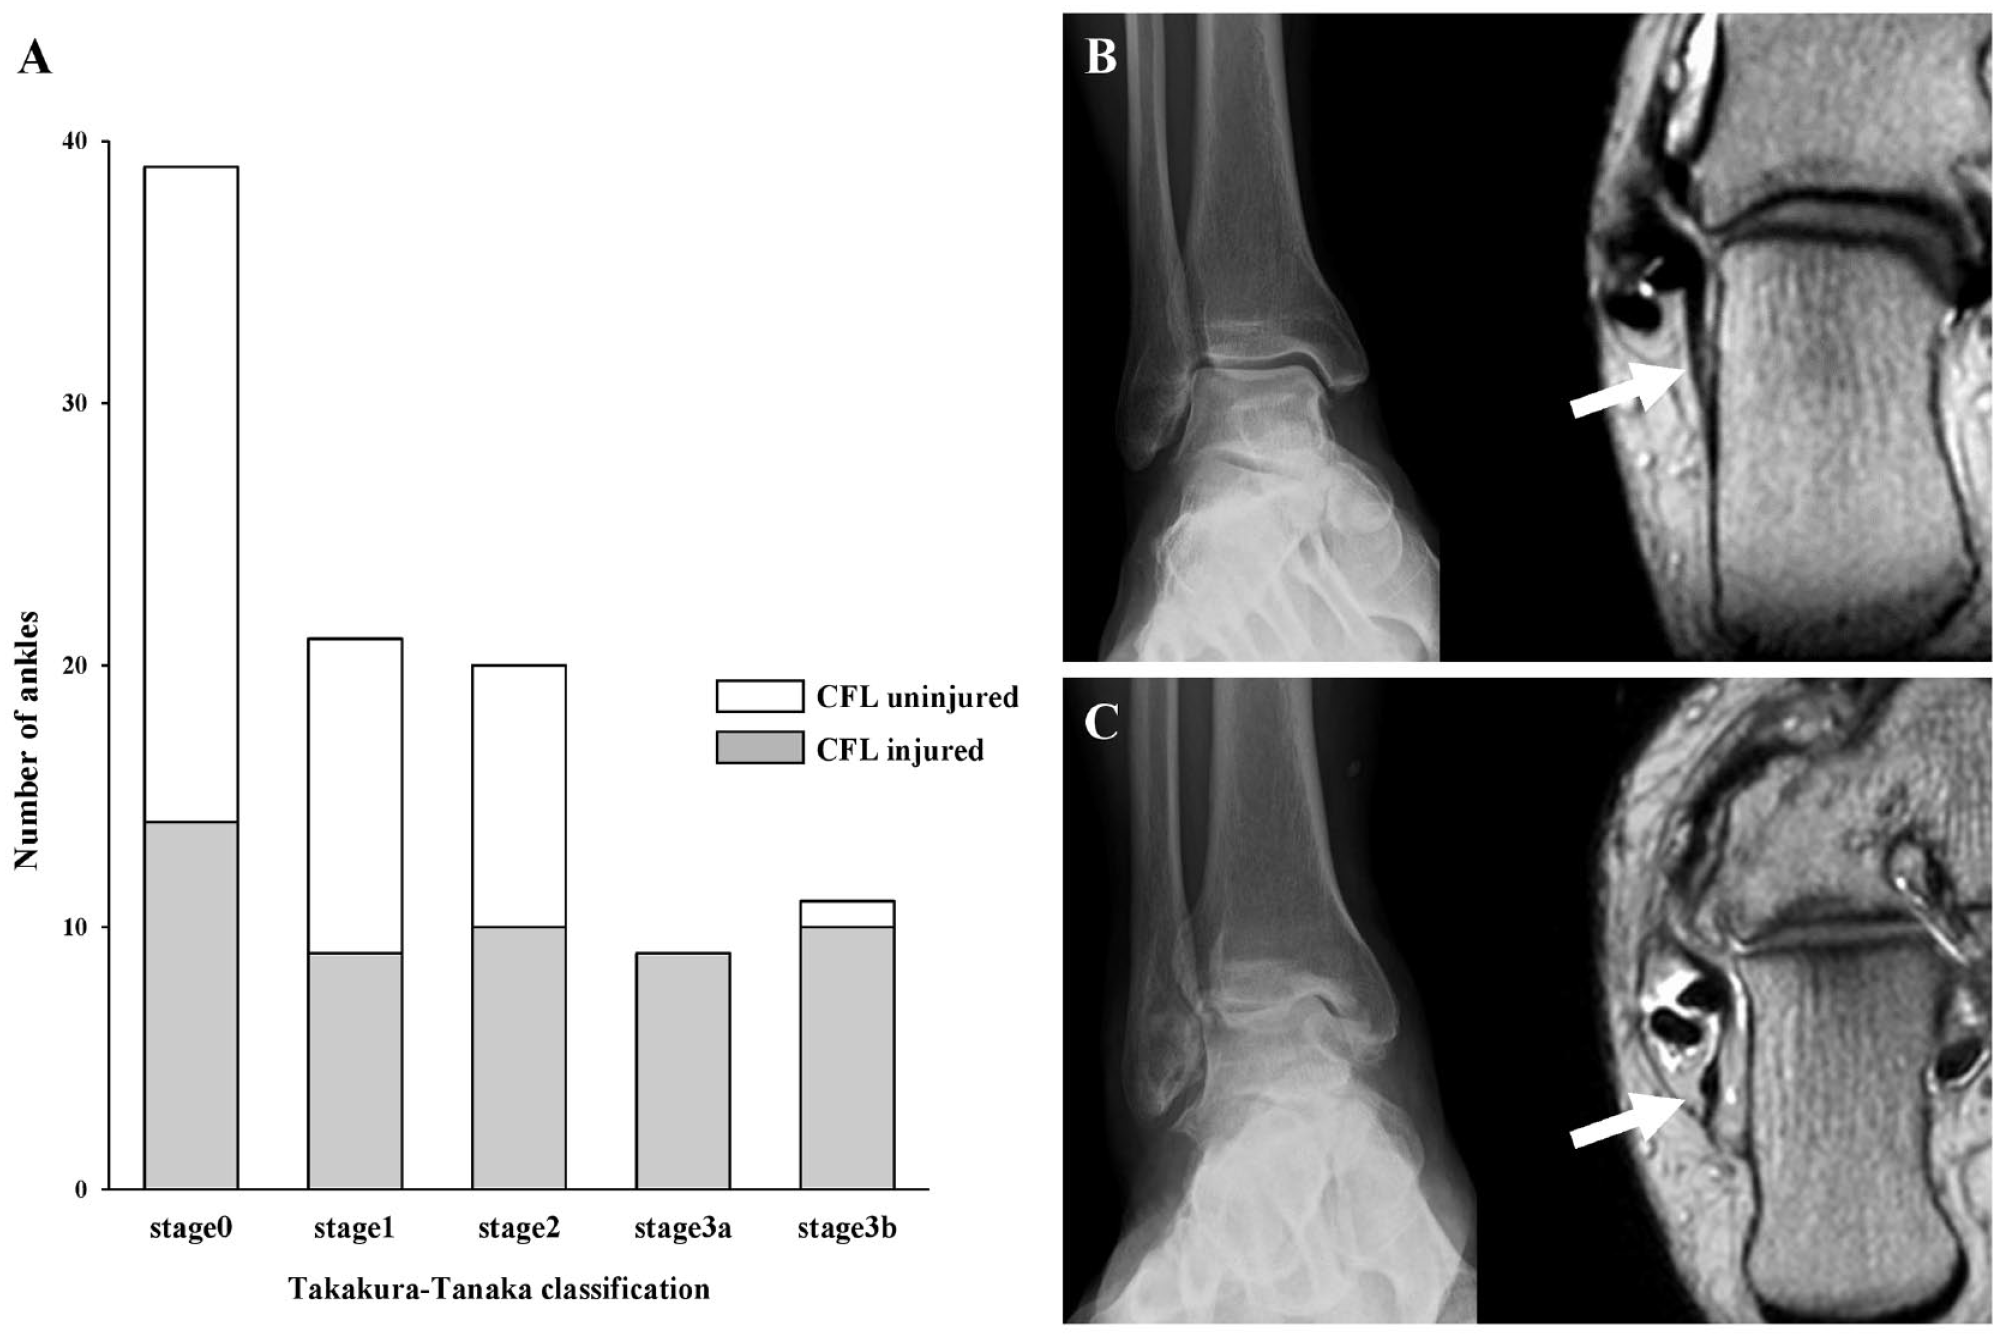
The frequency of calcaneofibular ligament (CFL) injury and ankle osteoarthritis (OA) complications. (A) Numbers of CFL-injured and uninjured ankles in each Takakura-Tanaka classification stage. (B) Representative image of plain radiograph and MRI oblique view of CFL-uninjured group: 53-year-old man. (C) Representative image of CFL-injured group: 57-year-old man. The arrow indicates the CFL.
Regarding the stress distribution in the medial gutter, the mean HU ratio of the tibial medial gutter joint surface was 4.5 ± 4.3 in the CFL-injured group (n = 33) compared with 2.8 ± 2.4 in the CFL-uninjured group (n = 38). Similarly, the mean HU ratio of the talar medial gutter joint surface in the CFL-injured group was 4.6 ± 4.1 compared with 3.3 ± 3.4 in the CFL-uninjured group. Notably, the HU ratio of the medial gutter in the CFL-injured group was significantly higher than that in the CFL-uninjured group (P < .01) (Figure 4). Although the mean HU ratios of the medial anterior and medial posterior sides of the subtalar joint in the CFL-injured group were significantly lower than those in the CFL-uninjured group, no significant difference in the mean HU ratios of the lateral anterior and posterior sides of the subtalar joint was observed between the CFL-injured and uninjured groups with the numbers available (P < .05) (Figure 5). The TAS angle was significantly correlation with the mean HU ratio of the medial gutter joint surface and lateral posterior side of talar joint surface of subtalar joint (tibial medial gutter: r = −0.44, P < .01, talar medial gutter: r = −0.54, P < .01, talar posterior lateral: r = −0.24, P < .05). Both intraobserver (0.93, 95% CI 0.91-0.94) and interobserver (0.91, 95% CI 0.88-0.93) ICCs in the measurement of HU ratios were excellent.
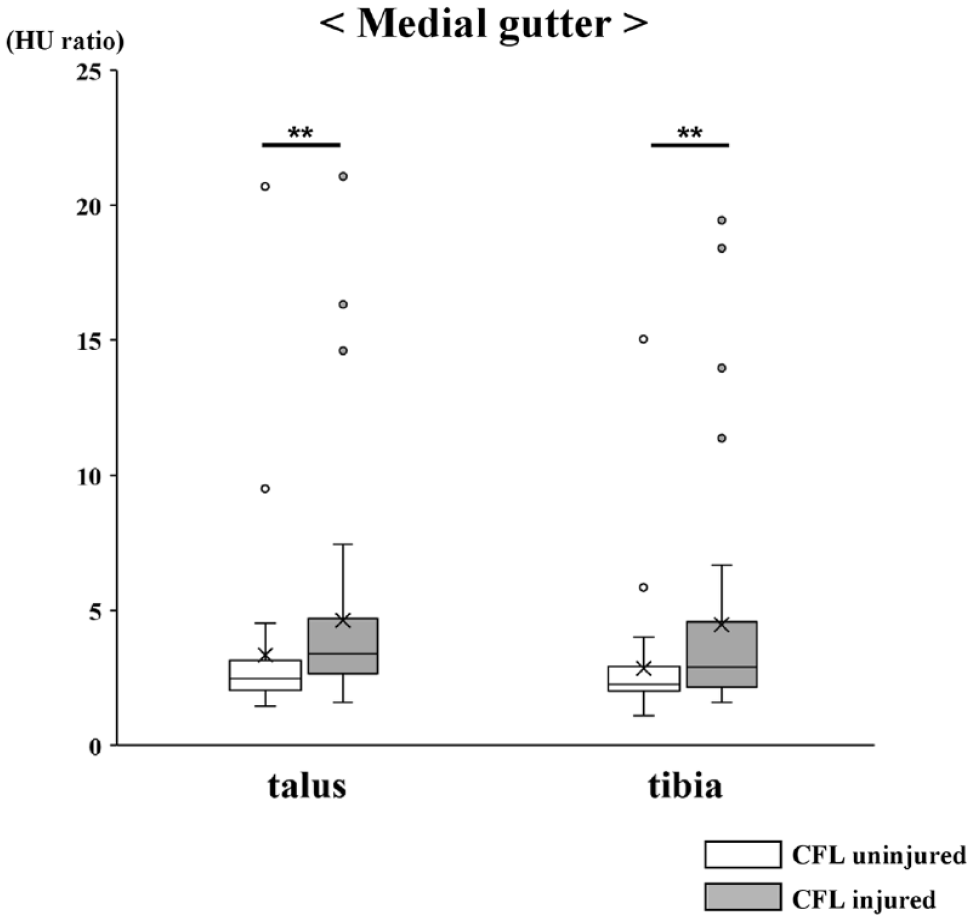
Box-and-whisker plots. The Hounsfield unit (HU) ratios of talar and tibial medial gutter joint. **P < .01.
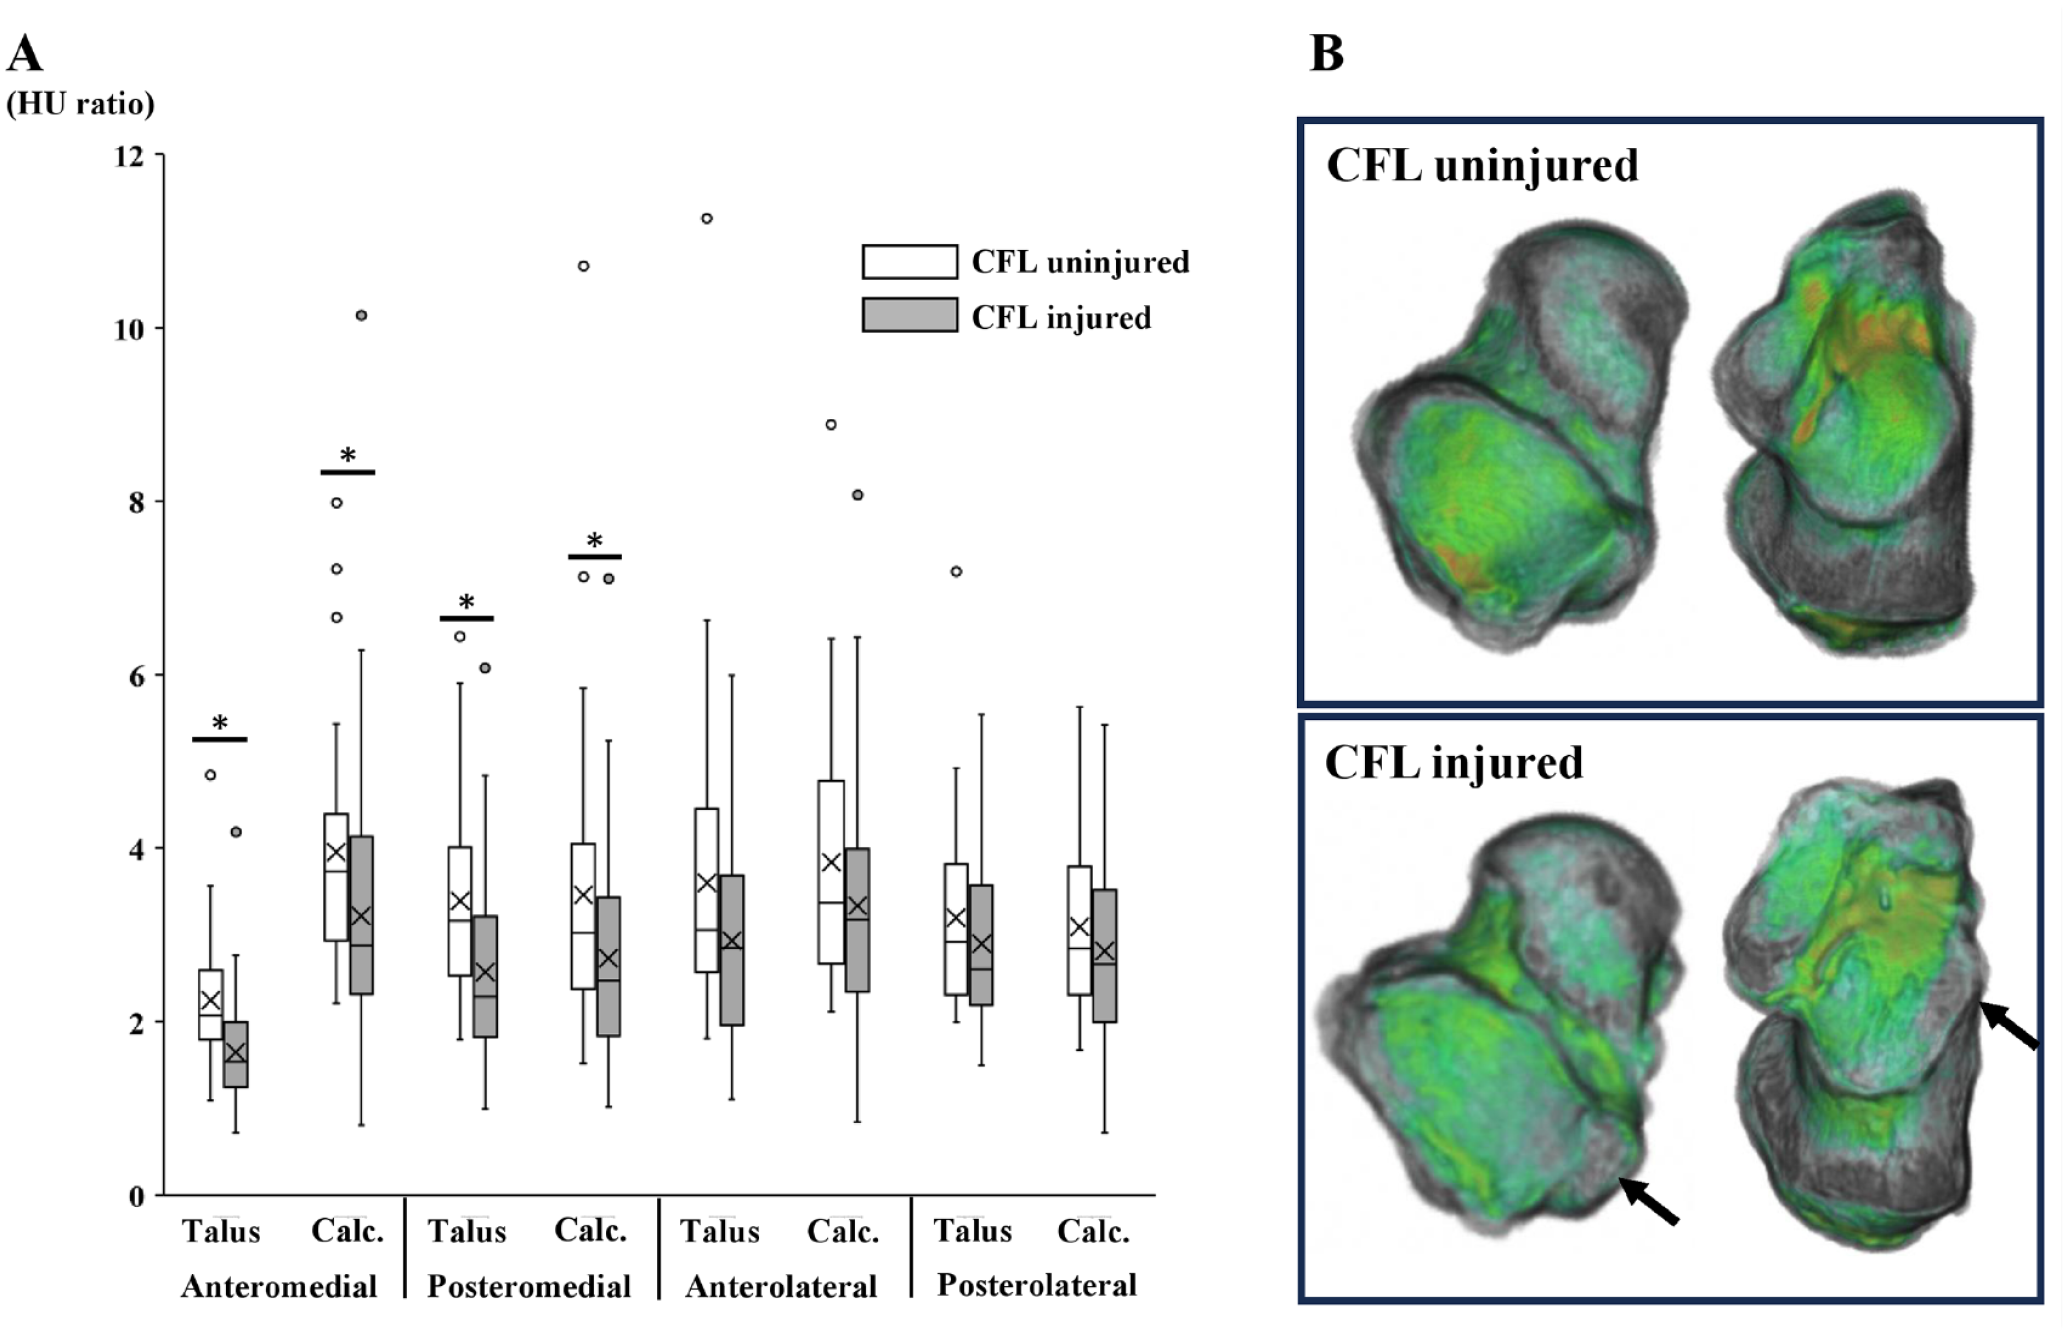
Evaluation of the HU ratio in the subtalar joint. (A) Box-and-whisker plots of the HU ratios at the 4 areas of talar and calcaneal articular surfaces in the subtalar joint. *P < .05. (B) Representative images of the subtalar joint in the ankles with and without the CFL injury. Arrows indicate low-stress distribution on the medial side.
Severe osteophytes (grade 3) were mainly observed on the posterior side of the talus in the subtalar joint. Among the 4 regions of the talar and calcaneal subtalar joint, the posteromedial side of the talus exhibited the most severe osteophytes (Table 3). The TAS angles were significantly correlation with the osteophyte score (r = −0.39, P < .01). Furthermore, on the medial side of the subtalar joint, there was a significant correlation between the HU ratios and osteophyte score (talar medial anterior: r = −0.459, P < .01; talar medial posterior: r = −0.403, P < .01; calcaneal medial anterior: r = −0.33, P < .01; calcaneal medial posterior: r = −0.305, P < .01) (Figure 6).
Osteophyte Severity of 4 Regions of the Talar and Calcaneal Subtalar Joints.
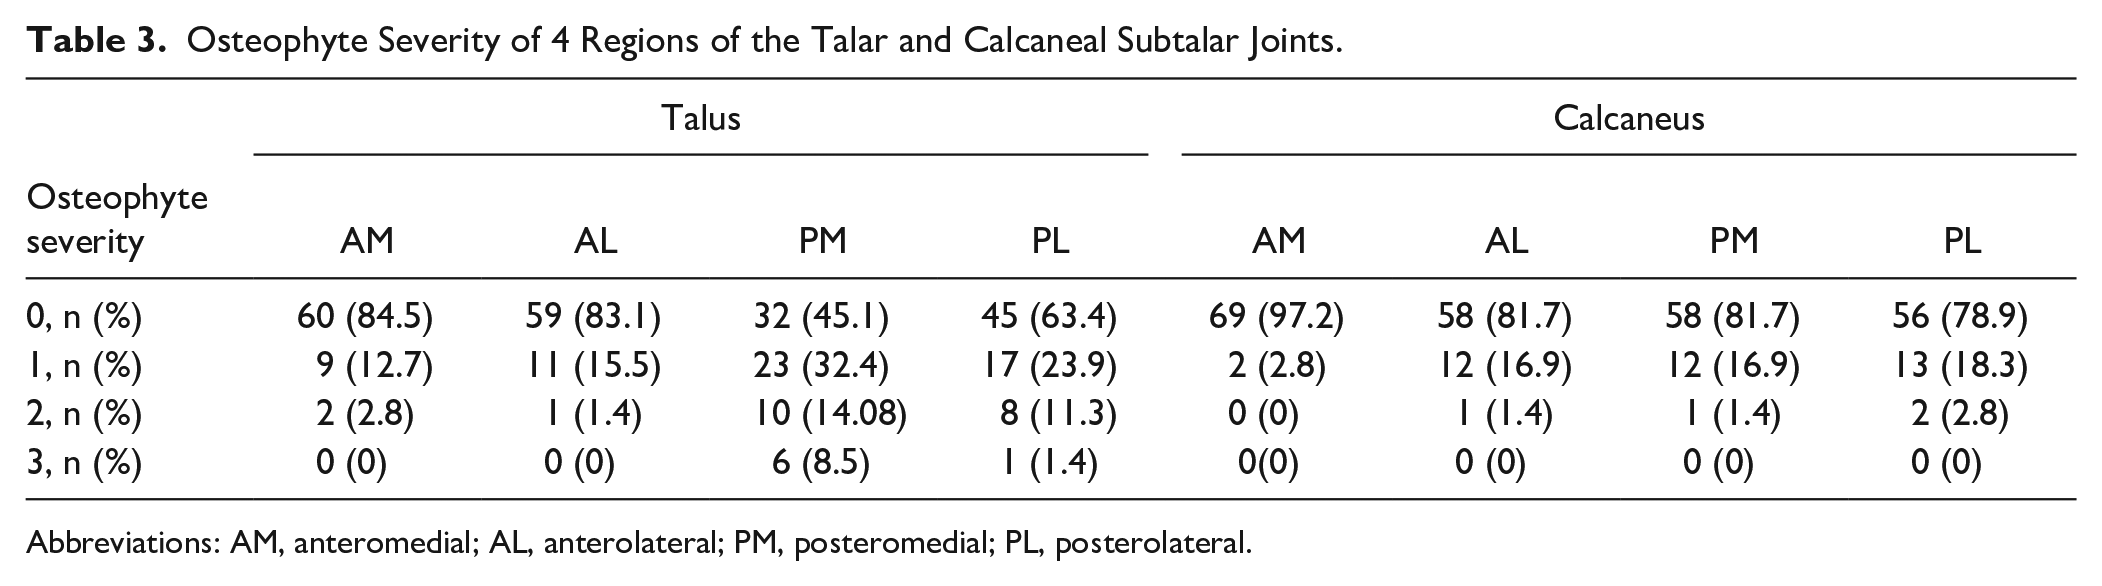
Abbreviations: AM, anteromedial; AL, anterolateral; PM, posteromedial; PL, posterolateral.
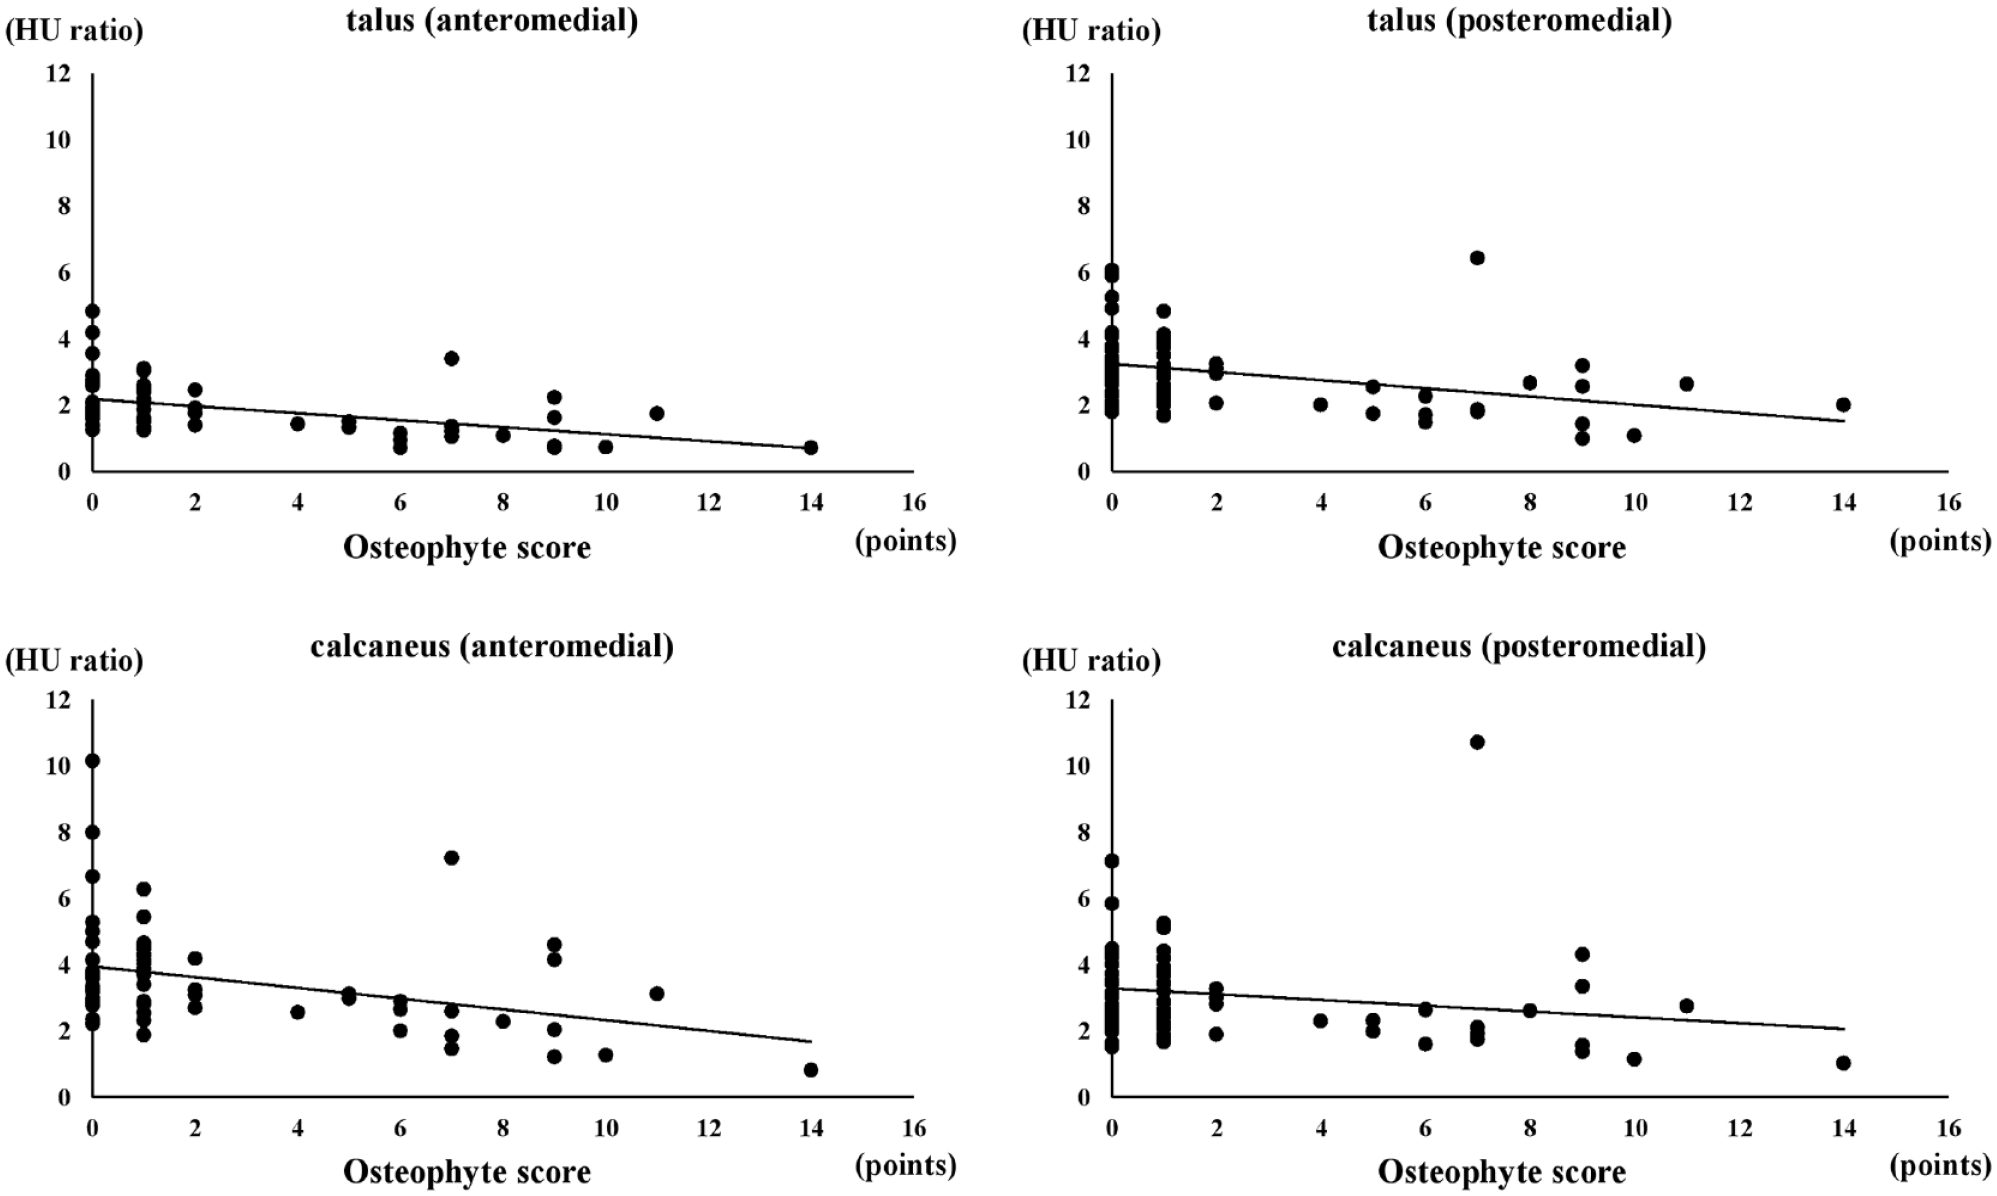
Scatter plot graph of the Hounsfield unit (HU) ratios at the medial side of the subtalar joint and osteophyte score.
Discussion
This study showed that CFL injury was associated with ankle OA severity and that most patients with severe ankle OA had an injured CFL. In particular, CFL injury was observed in 100% of the patients with stage 3a ankle OA. Additionally, the HU values of the medial gutter in the CFL-injured group were higher than those in the uninjured group, whereas those of the medial side of the subtalar joint in the CFL-injured group were lower than those in the uninjured group. Furthermore, the HU values of the medial side of the subtalar joint were negatively associated with the osteophyte severity. Taken together, these results suggest that patients with CFL injuries have altered stress in the subtalar joint, and the mobility of the subtalar joint is reduced as a result of osteophyte formation, resulting in increased stress in the medial gutter. Our findings suggest that there is the possibility that the ATFL and CFL injuries in the CAI could be one of the factors that induce the progression of ankle OA.
Although several studies have investigated the association between lateral ligament complex injuries and ankle OA,12,20,24 not all CAIs progress to ankle OA; consequently, there is a need to identify the factors contributing to OA. The CFL is the primary ligamentous stabilizer of the ankle joint against force inversion and provides stability to the talocrural joint during plantarflexion, and ankles with combined ruptures of the ATFL and CFL exhibit greater instability than those with isolated ATFL ruptures. 11 Hunt et al 6 reported that more inversion of the talus and calcaneus and calcaneal medial displacement was seen in ankles with ATFL and CFL injuries than in ankles with ATFL-isolated injuries in a cadaver experiment. Additionally, a study has suggested that OA changes at the medial gutter and chondral/osteochondral lesions in the talus are observed more frequently in ankles with ATFL and CFL injuries than in ankles with an ATFL injury. 15 These findings suggest that cartilage degeneration in the ankle joint is more severe in CFL-injured ankles than in uninjured ankles.
In this study, the HU values of the medial gutter were higher in the CFL-injured ankles than in the uninjured ankles. Generally, HU is recognized as a CT value corresponding to the average amount of radiation absorbed by tissues and has been used to examine subchondral mineralization as a measure of the mechanical adaptability of joints.4,8,13,14 A previous study on CAI showed that HU values in the medial gutter in the ankles with ≥10 degrees of talar tilt angle were significantly higher than those with <10 degrees. 14 Given that ankles with combined rupture of the ATFL and CFL exhibit greater instability than those with isolated ATFL ruptures, our results that CFL-injured ankles had higher HU values in the medial gutter by higher stress due to the instability are reasonable.
The CFL contributes stability of not only the talocrural joints but also of the subtalar joints.6,19,20 During OA progression, the subtalar joint plays a crucial role in the compensatory mechanisms. 5 Therefore, this study investigated stress distribution and osteophyte formation in the subtalar joint. Our findings revealed that the HU values on the medial side of the subtalar joint were lower in the CFL-injured ankles and were negatively associated with osteophyte severity. It has been suggested that immobilization of the subtalar joint due to osteophyte formation in the lateral region might render the medial region unstressed. A previous report indicated that ankles with CAI had high HU values in the lateral region of the subtalar joint, especially in ankles with ATFL and CFL injuries in patients with high activity levels. 17 Osteophyte formation is caused by abnormal impaction and traction and can induce a range of motion in the joint. 26 It is reported that osteophyte formation was observed on the lateral side of the subtalar joint in severe varus ankle OA and would cause a decrease in subtalar mobility, which may cause the impairment of the compensatory mechanism in varus ankle OA. 7 Thus, our results indicate that CFL injury in patients with CAI may contribute to the loss of compensatory mechanisms due to osteophyte formation.
Furthermore, we investigated the relationship of CFL injury and varus deformity of the articular surface of tibia. In this study, the TAS angle is negatively associated with HU values of the medial gutter and talar lateral posterior subtalar joint and osteophyte severity. This result suggests that varus deformity of the articular surface of the distal tibia causes the high-stress distribution on the medial gutter and talar lateral posterior subtalar joint. That is consistent with previous observations that the TAS angle is considered to be the important predisposing factor for varus osteoarthritis and the valgus compensatory mechanism of the subtalar joint.5,21 On the other hand, the TAS angle of the ankle with CFL injury is larger than that without CFL injury in stage 1 ankle OA. This result suggests that CFL injury has the possibility to be the distinct risk factor of early ankle OA than TAS angle.
This study has several limitations. First, the CFL injuries were evaluated using only MRI, and research has shown that CFL is difficult to identify on conventional axial, sagittal, and coronal MRI. 23 Kumar et al 10 reported that conventional MRI had a sensitivity and specificity of 47% and 84%, respectively. However, our method of evaluating CFL injury with an oblique view and classifying it into 4 groups had been demonstrated to have a sensitivity of 84.2% to 94.7% and a specificity of 84.6% to 92.3%, which were clinically useful for diagnosis. 16 Nevertheless, the diagnosis of CFL injuries using MRI is not 100% sensitive or specific, and further confirmation of CFL injury under direct visualization is warranted. Second, because of the cross-sectional nature of our study, it was difficult to ascertain whether CFL injury directly caused ankle OA progression. A longitudinal study comparing isolated ATFL injuries and combined ATFL and CFL injuries is needed to explore that. Finally, the number of ankles in each grade of OA was relatively small. The inclusion criteria required patients to undergo both 3D MRI and CT; however, some patients refused to undergo MRI or CT because of concerns about radiation exposure or financial constraints. Therefore, further longitudinal studies with larger sample sizes are required to explore the relationship between CFL injuries and the OA progression.
In conclusion, our results revealed that CFL injury is more common in patients with severe ankle OA, disrupting the compensatory function in the subtalar joint, leading to osteophyte formation and abnormal stress distribution. Based on these findings, it is recommended that both the CFL and the ATFL should be repaired in ankles with ATFL and CFL injuries to prevent OA progression.
Supplemental Material
sj-pdf-1-fai-10.1177_10711007241245363 – Supplemental material for The Relationship Between Calcaneofibular Ligament Injury and Ankle Osteoarthritis Progression: A Comprehensive Analysis of Stress Distribution and Osteophyte Formation in the Subtalar Joint
Supplemental material, sj-pdf-1-fai-10.1177_10711007241245363 for The Relationship Between Calcaneofibular Ligament Injury and Ankle Osteoarthritis Progression: A Comprehensive Analysis of Stress Distribution and Osteophyte Formation in the Subtalar Joint by Satoru Sakurai, Tomoyuki Nakasa, Yasunari Ikuta, Shingo Kawabata, Dan Moriwaki, Saori Ishibashi, Asyumaredha Asril Silan and Nobuo Adachi in Foot & Ankle International
Footnotes
Ethical Approval
Ethical approval for this study was obtained from the ethics committee of Hiroshima University (approval number: E-14).
Declaration of Conflicting Interests
The author(s) declared no potential conflicts of interest with respect to the research, authorship, and/or publication of this article. Disclosure forms for all authors are available online.
Funding
The author(s) received no financial support for the research, authorship, and/or publication of this article.
References
Supplementary Material
Please find the following supplemental material available below.
For Open Access articles published under a Creative Commons License, all supplemental material carries the same license as the article it is associated with.
For non-Open Access articles published, all supplemental material carries a non-exclusive license, and permission requests for re-use of supplemental material or any part of supplemental material shall be sent directly to the copyright owner as specified in the copyright notice associated with the article.