
Abstract
Background:
Osteochondral lesions (OCLs) of the talus involve damage to both the articular cartilage and underlying subchondral bone, which may range from compression injury to complete fragment separation. Treating large lesions may necessitate osteochondral allograft transplantation (OCA) to ensure cartilage congruence and minimize articular step-off. However, current allograft selection techniques rely largely on gross size estimation rather than precise contour matching, which may increase the risk of graft incongruity and suboptimal clinical outcomes. This study evaluates the correlations between the talar dome posteromedial (PM) and central lateral (CL) radii of curvature (ROC) with age, articular width (AW), and articular length (AL) in a young patient group to optimize graft selection and matching.
Methods:
Twenty-nine patients, aged 9-18 years, and 30 ankles were included. Magnetic resonance imaging was used to measure talar dome ROC, AW, and AL. The ROC was measured on sagittal images at the PM and CL regions, whereas AW and AL were measured on coronal and sagittal planes, respectively. Three independent reviewers assessed all measurements using Sectra PACS software. Reliability was evaluated using intraclass correlation coefficients (<0.50, poor; 0.50-0.75, moderate; 0.75-0.90, good; >0.90, excellent). Correlations (R2) between ROC with age, AW, and AL were assessed.
Results:
The mean PM ROC was 20.55 mm and CL ROC 17.20 mm. The mean AW and AL were 27.84 mm and 36.25 mm, respectively. Intraobserver reliability was good to excellent for PM ROC and AW, and moderate to excellent for CL ROC and AL. Interobserver reliability was good to excellent for PM ROC and AW, and moderate to good for CL ROC and AL. For PM ROC, R² values were 0.29 (age), 0.18 (AW), and 0.62 (AL); for CL ROC, R² values were 0.06 (age), 0.54 (AW), and 0.78 (AL).
Conclusion:
Articular length demonstrated stronger correlations with talar dome PM and CL ROCs compared with AW and age. AL may be a useful parameter for optimizing graft selection, particularly contour and size matching, in OCA.
This is a visual representation of the abstract.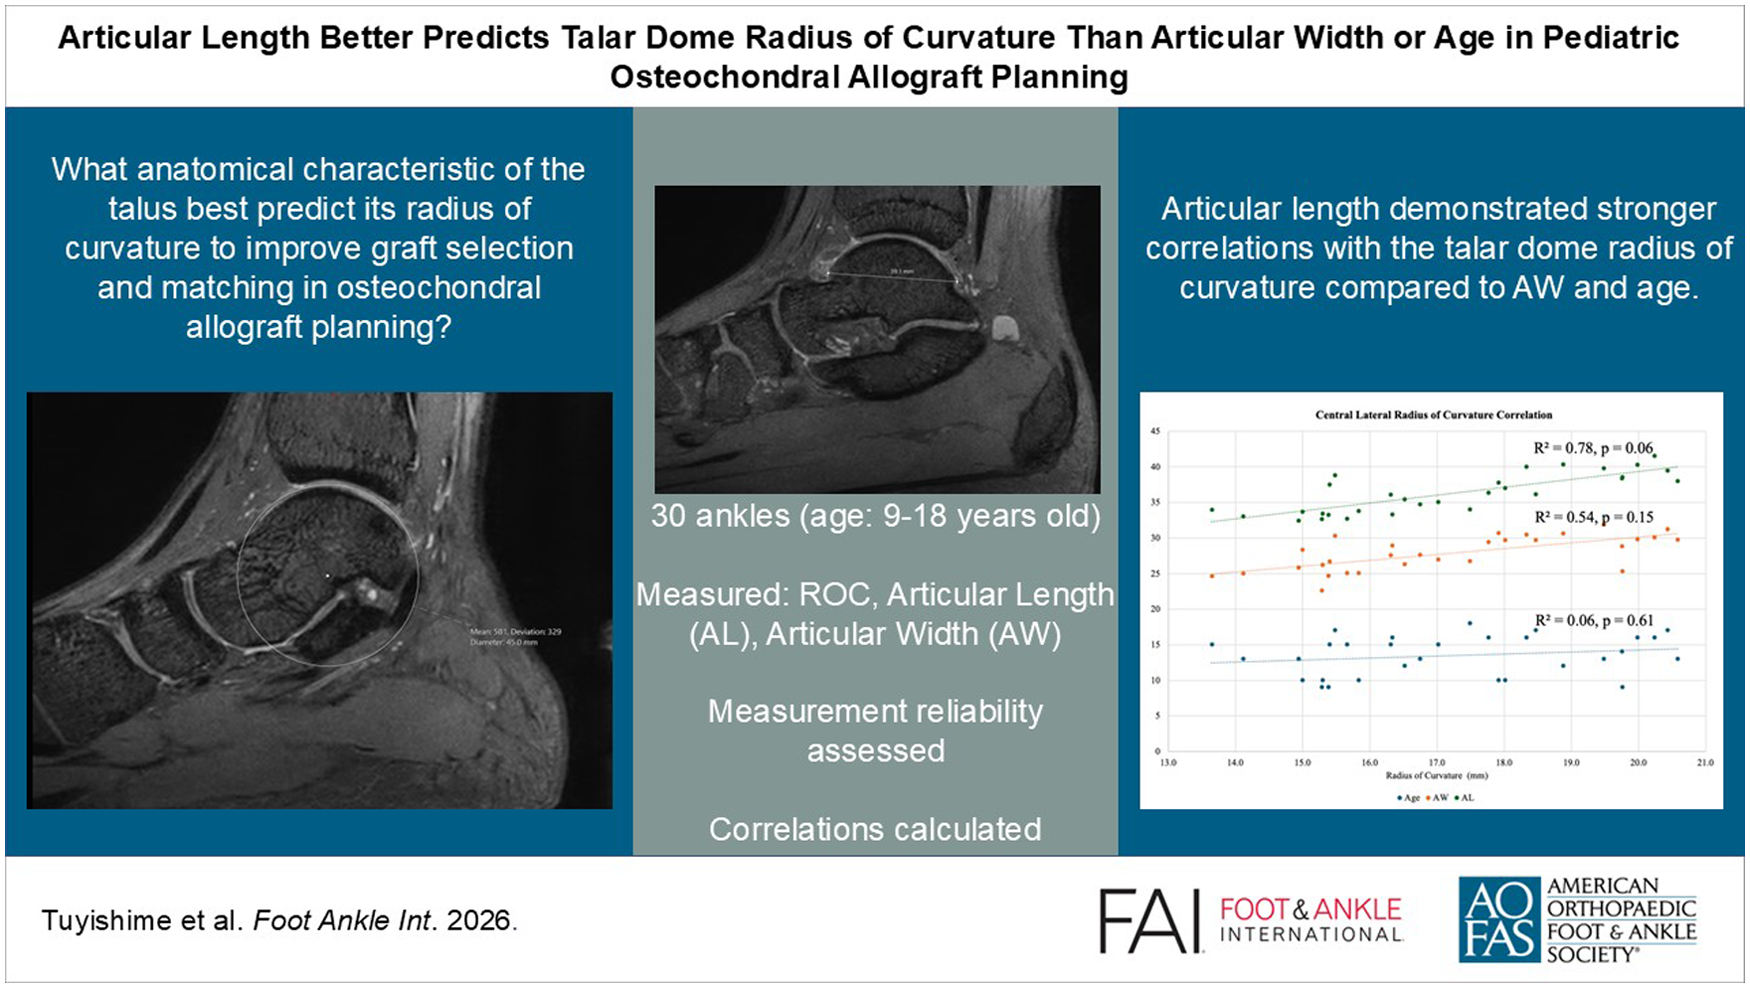
Keywords
Introduction
Osteochondral lesions (OCLs) of the talus are characterized by the separation of cartilage from the subchondral bone. The talus OCLs are frequently associated with ankle trauma, with an incidence of 6.8 per 100 000 in young adolescents (12-19 years), with 22.9% of the cases necessitating surgical intervention.1,2 Commonly affected sites include the medial (53%-58%) and lateral (34%-42%) talar dome rims, notably the posteromedial (26%) and central lateral (21%) aspects using the Raikin classification.1,3 -5 Conservative management is typically the first-line treatment for nondisplaced lesions, involving immobilization and protected weightbearing. However, large OCLs (>15 mm) often require osteochondral autograft or allograft transplantation to restore articular congruence and maintain long-term joint function.6,7
Previous studies have reported various criteria for graft selection for osteochondral transplantation. Anatomical matching is essential to restore joint congruity and minimize contact pressures. Latt et al 8 showed that flush graft placement could restore near-normal joint contact pressure while elevated grafts lead to increased contact pressures and recessed grafts transfer pressure to the opposite facet of the talus. Other studies have focused on contour sizing. Marymont et al 9 used computer software to reconstruct articular surfaces of donor femoral condyle grafts and of the recipient’s talus. There has also been research on measuring coronal and sagittal talar edge radii and frontal talar profile to create custom-made tissue-engineered grafts according to the location of the lesion, and incorporating size and depth of the lesion, patient’s age and body mass index.6,10 -12 Despite these advancements, graft-sizing remains largely nonstandard and often depends on intraoperative gross size estimation, freehand contouring, and gradual graft downsizing to achieve congruency within 2 mm.1,2 Knowledge about the most accurate parameters for ensuring adequate graft sourcing and matching in osteochondral allograft procedures remains limited.
This study aimed to investigate the anatomical characteristics of the talus to optimize graft sourcing and matching. To achieve this aim, we assessed the correlations between the talar dome posteromedial (PM) and central lateral (CL) radius of curvature (ROC) with the patient’s age, talar dome articular width (AW), and talar dome articular length (AL). We hypothesized that AW and AL would demonstrate stronger correlations with the PM and CL ROCs compared with age. By identifying the strongest matching criteria, we aim to provide surgeons with improved criteria to optimize graft selection and improve surgical outcomes for OCL repairs.
Methods
Participants
This retrospective cohort study included 29 patients and 30 ankles. One patient contributed both left and right ankles. Inclusion criteria included patients’ ages ranging from 9 to 18 as well as magnetic resonance imaging (MRI) scans obtained for evaluation of ankle injuries, between 2022 and 2023, acquired using a 3-tesla scanner under a single-center MRI protocol. Exclusion criteria included the presence of oncologic conditions, infectious diseases, or congenital abnormalities. Institutional review board (IRB) approval was obtained prior to the study, and informed consent was waived because of its retrospective nature.
Data Collection
Three reviewers, including 2 medical students who have been longitudinally working in pediatric orthopaedic clinics and 1 board-certified pediatric orthopaedic sports surgeon, independently conducted measurements of MRI studies using the Sectra PACS software. 13 The students underwent measurement training from the surgeon prior to the study. The sagittal ROC, AW, and AL were measured using a standardized approach to ensure consistency and minimize variability. To establish a uniform baseline across measurements, reference lines were aligned perpendicular to the axial, coronal, and sagittal planes (Figure 1). Measurements were conducted at the posteromedial (PM) and central lateral (CL) aspects of the talar dome, corresponding with zone 7 and zone 6, respectively, in the Raikin classification for OCLs. 14 To measure the sagittal ROC on the PM aspect of the talus, the reference line was positioned at the medial quarter of the talus on the coronal plane. Then, the Sectra PACS Region of Interest (ROI) function was used to fit a circle to the posterior one-third of the talus on the sagittal image, and the ROC was calculated from the measured diameter (Figure 2). The exact process was applied for the CL aspect of the talus, with the reference line positioned at the lateral quarter of the talus on the coronal plane and the circle fitted to the central third of the talus on the sagittal image (Figure 3). Using the Sectra PACS Distance measurement tool, the AW was measured in the coronal plane as the linear distance from the talus medial to lateral articular margins on the midcoronal slice, and the AL was measured in the sagittal plane as the linear distance from the anterior to posterior articular margins on the midsagittal slice (Figures 4 and 5). Both AL and AW were measured at midpoints ensuring orthogonality of the axial, coronal, and sagittal planes as previously demonstrated (Figure 1).
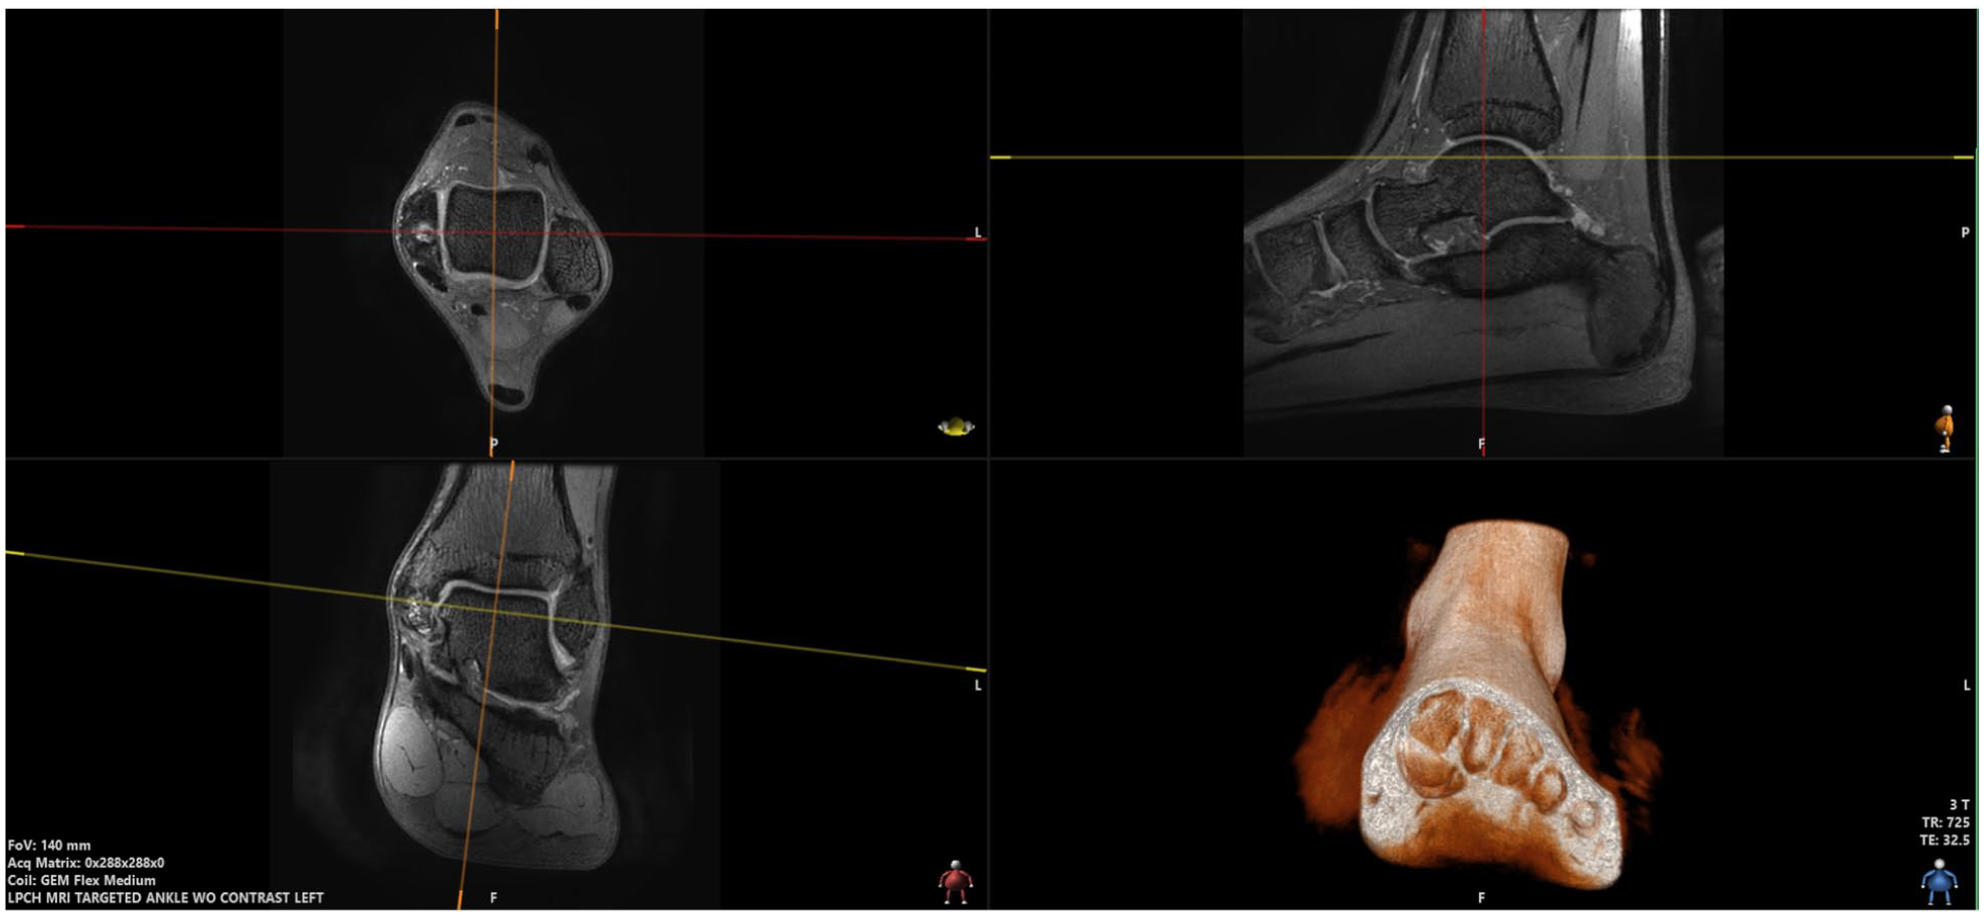
Perpendicular alignment of reference lines in the axial, sagittal, and coronal planes.
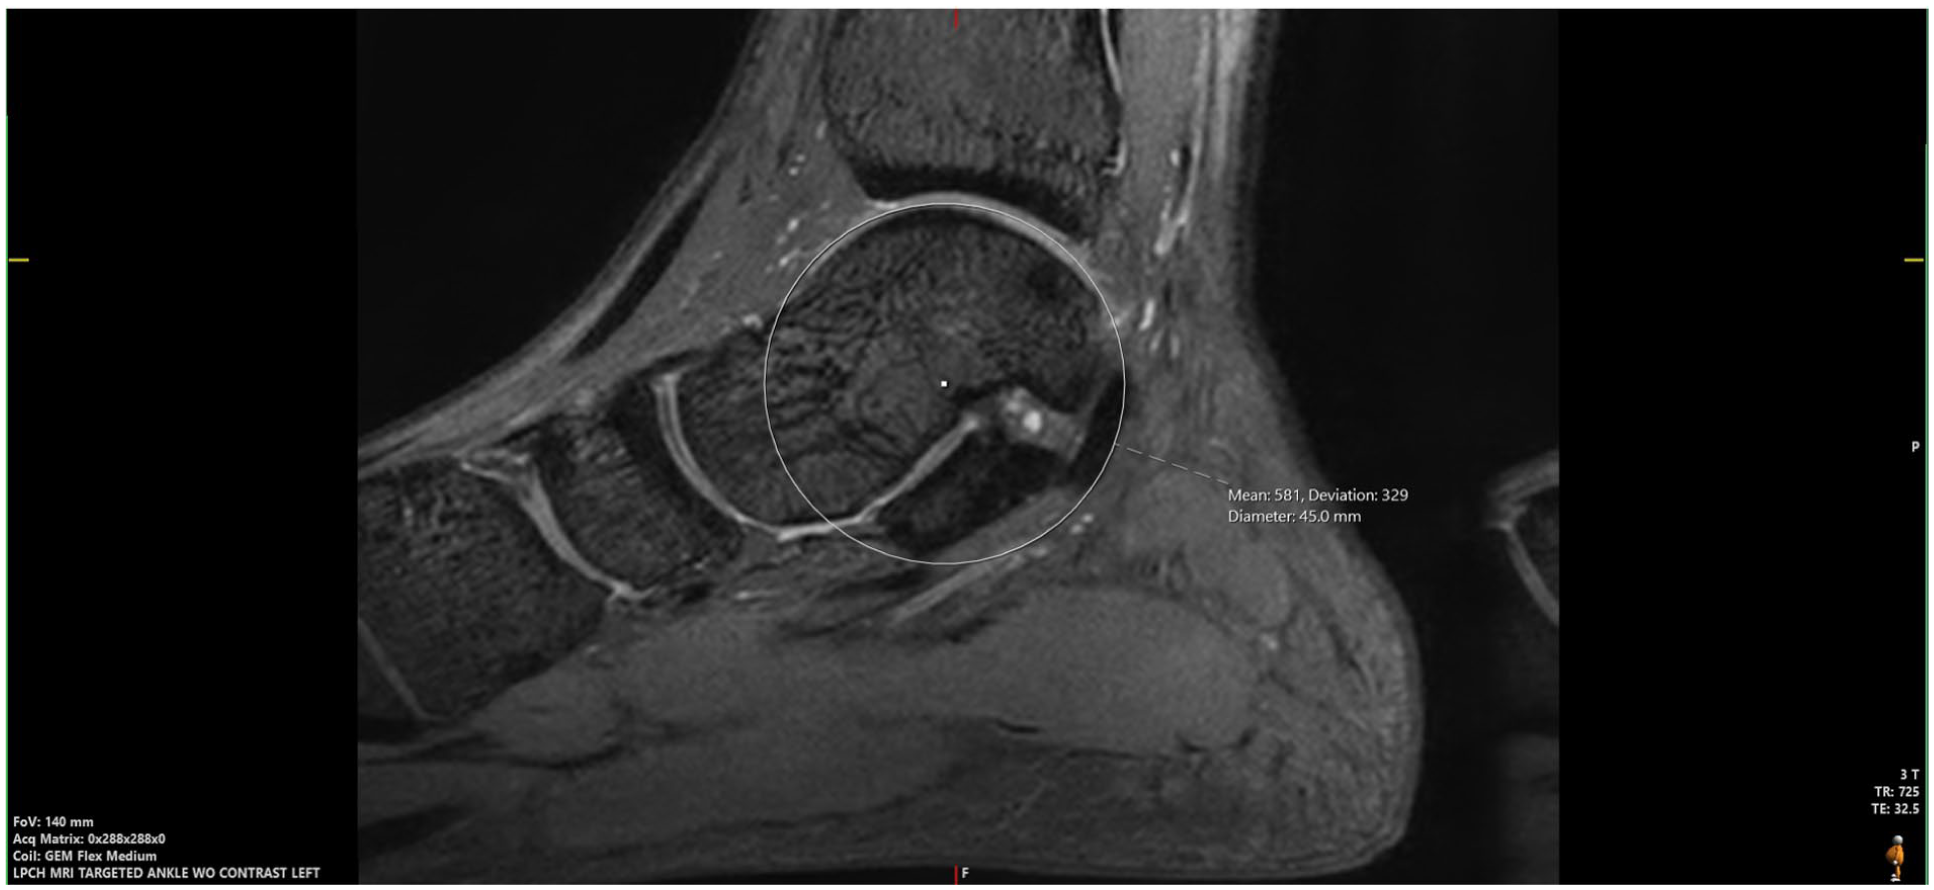
Posteromedial measurement of the radius of curvature (ROC) using the PACS Sectra ROI function. The ROC was calculated from the measured diameter.
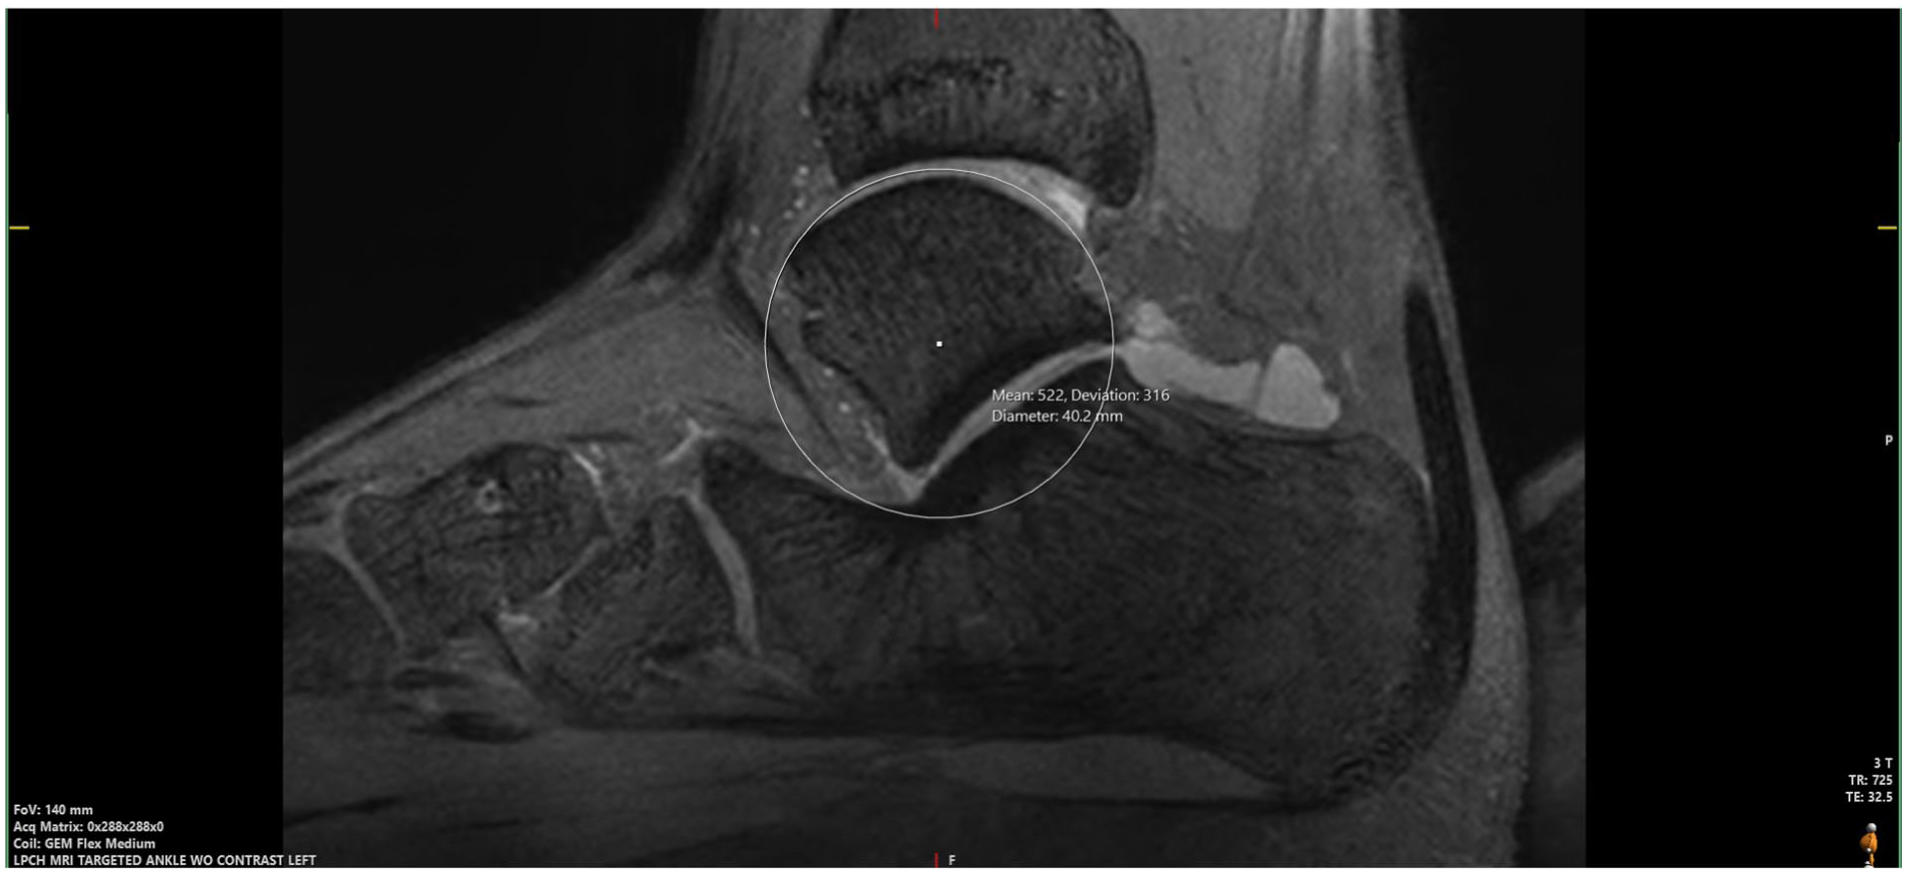
Central lateral (CL) measurement of the radius of curvature (ROC) using the PACS Sectra ROI function. The ROC was calculated from the measured diameter.
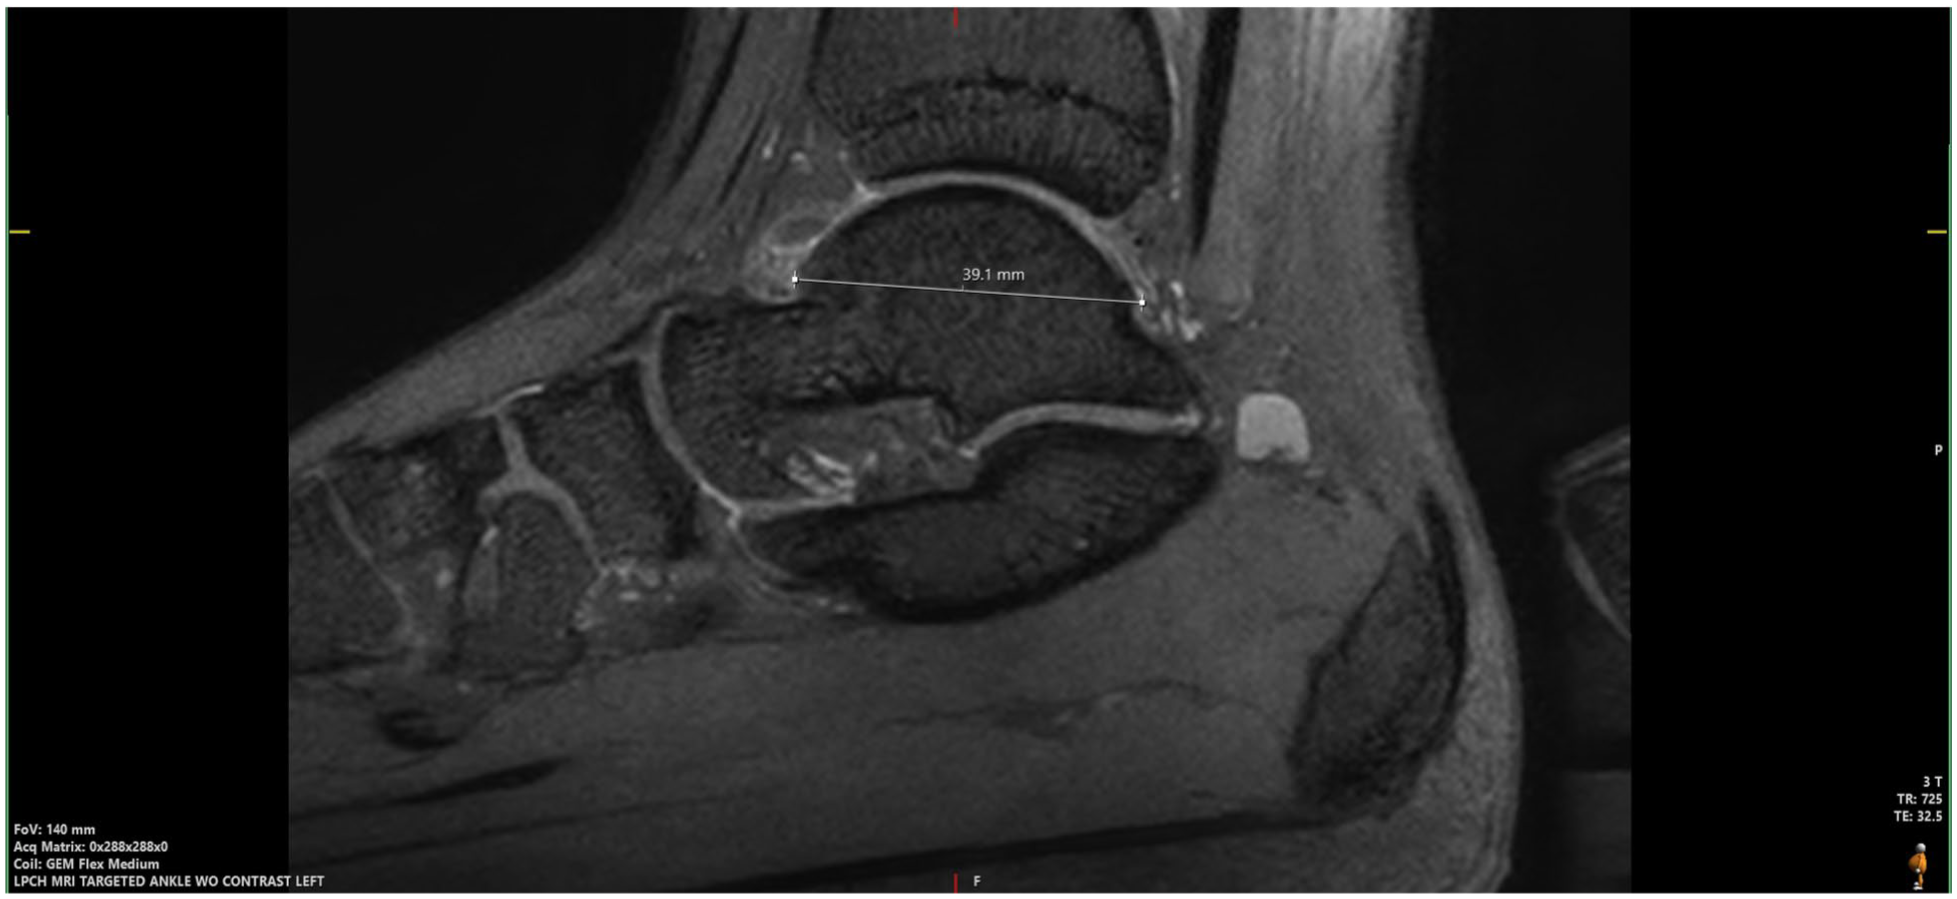
Measurement of the articular length (AL) in the sagittal plane.
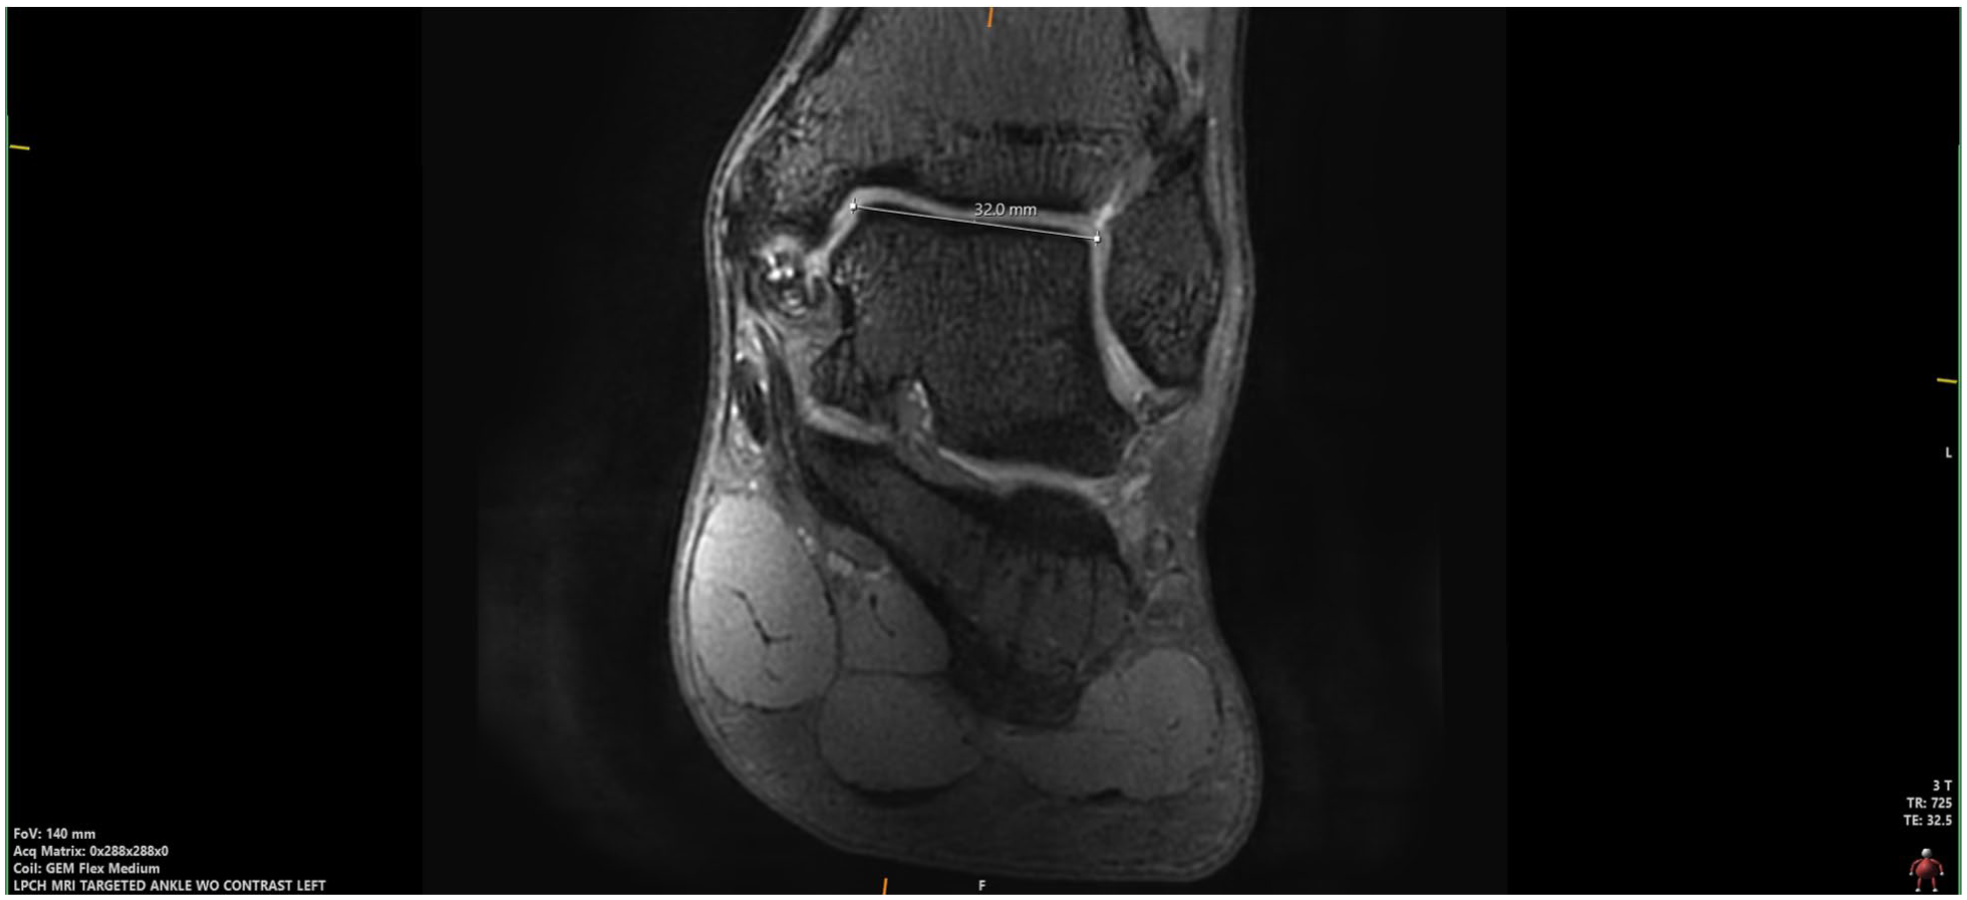
Measurement of the articular width (AW) in the coronal plane.
Statistical Analysis
Intraobserver and interobserver reliability was assessed using Koo and Li’s 15 guide for reporting intraclass correlation coefficients (ICCs): poor, <0.50; moderate, 0.50-0.75; good, 0.75-0.90; excellent, >0.90. Pearson correlation coefficients (R²) and P values were also calculated to evaluate the correlations between ROC and age, AW, and AL. Two-sample t tests were used to compare the ROC between sexes. Power analysis indicated that for a sample size n = 29, the minimum detectable correlation coefficient at 80% power and α = 0.05 was R² > 0.25.
Results
Twenty-nine patients were included in the study. Ages ranged from 9 to 18 years, with a mean age of 13.5 years and an SD of 2.8 years. Thirty MRI scans were analyzed, with 1 patient providing bilateral ankles. Twelve ankle MRI scans were from male patients, and 18 were from female patients. Twelve ankles were from the left leg whereas 18 were of the right leg.
The mean sagittal ROC was 20.55 mm for the PM region and 17.20 mm for the CL region. The mean AW and AL were 27.84 mm and 36.25 mm, respectively. The AL showed the strongest correlation with ROC (PM: R² = 0.62; CL: R² = 0.78), followed by AW (PM: R² = 0.18; CL: R² = 0.54) (Figures 6 and 7). Age demonstrated minimal predictive strength (PM: R² = 0.29; CL: R² = 0.06). PM and CL talar dome ROC were significantly greater in male patients compared to female patients (PM: 22.97 [SD = 3.08] vs 19.33 [1.55] mm, P = .002; CL: 20.16 [2.03] vs 15.87 [1.46] mm, P < .001).
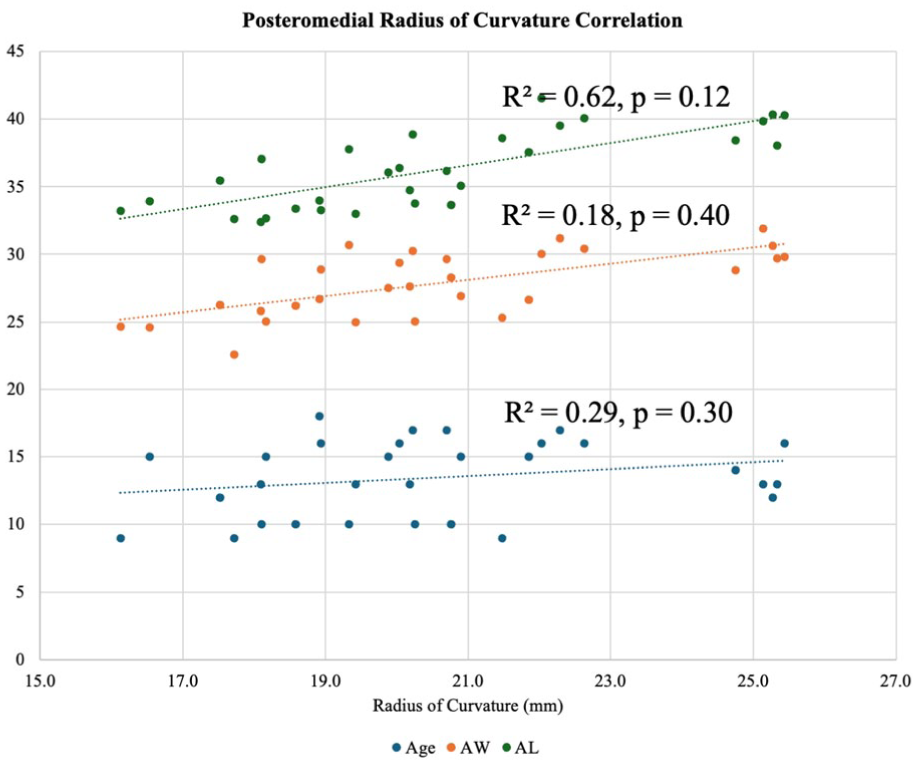
Association between the posteromedial radius of curvature with age, articular width (AW), and articular length (AL). The correlation coefficients (R2) and corresponding P values are shown in the figure.
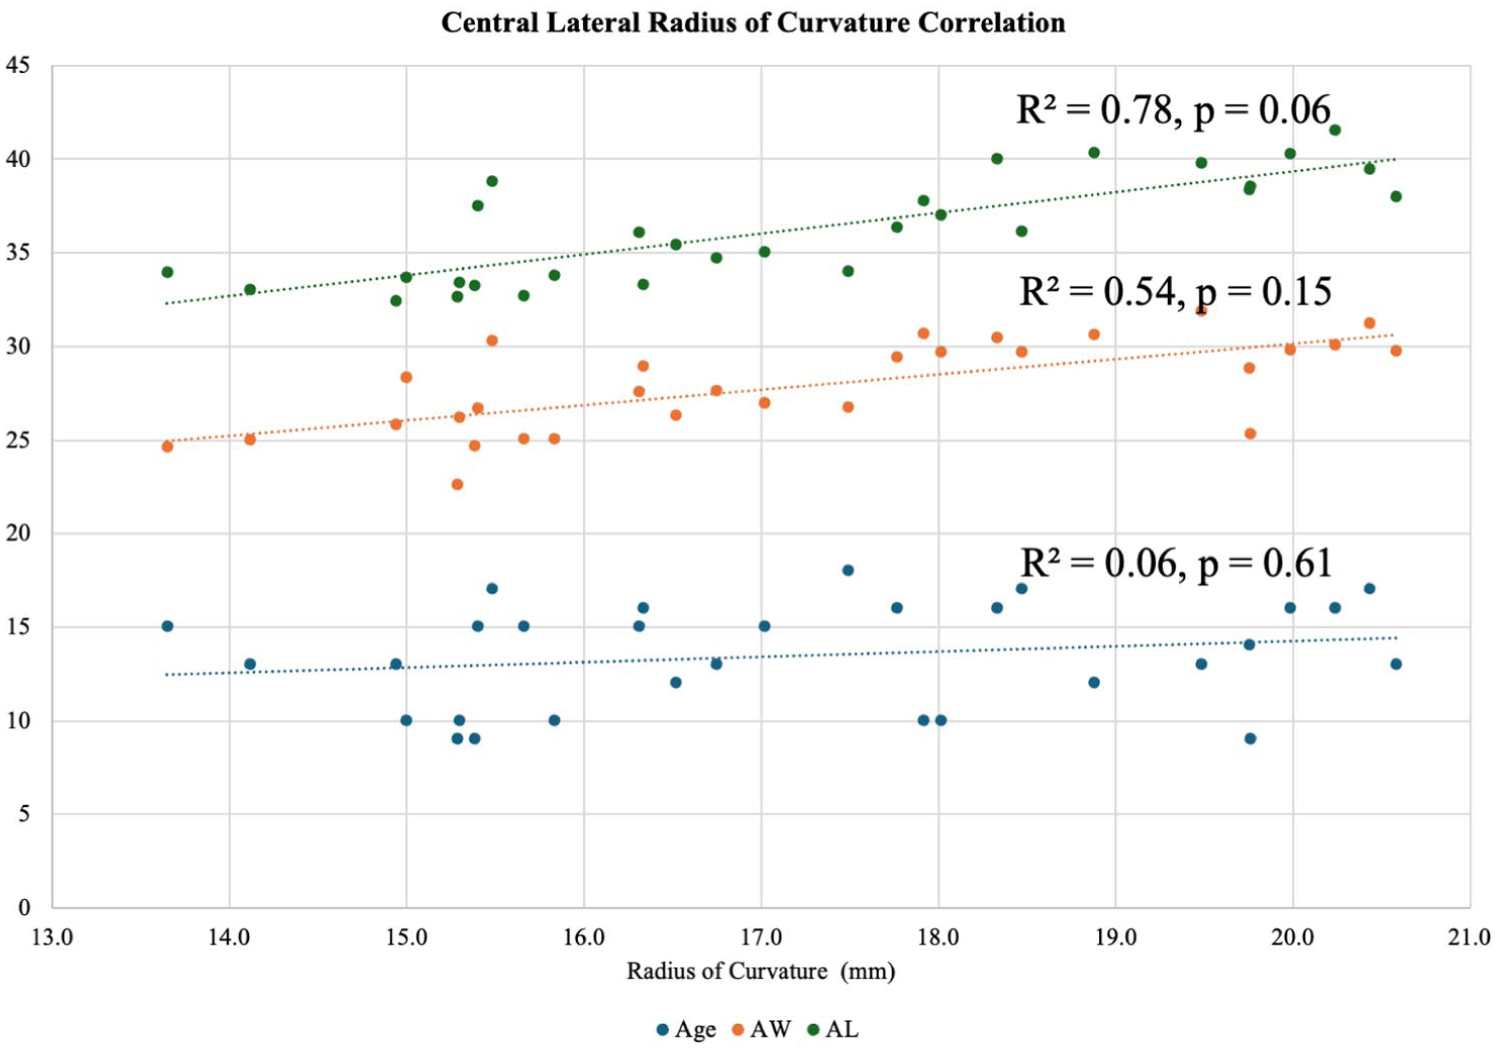
Association between the central lateral (CL) radius of curvature with age, articular width (AW), and articular length (AL). The correlation coefficients (R2) and corresponding P values are shown in the figure.
The 3 independent rater intraobserver reliability was assessed. The PM ROC measurements showed good to excellent reliability (ICC: 0.87, 0.91, 0.94). The CL ROC measurements showed moderate to excellent reliability (ICC: 0.64, 0.87, 0.90). The AW exhibited good to excellent reliability (ICC: 0.89, 0.91, 0.92). The AL ranged from moderate to excellent reliability (ICC: 0.69, 0.91, 0.95).
The 3 independent rater interobserver reliability was assessed as well. The PM ROC measurements showed good to excellent reliability (ICC: 0.88, 0.84, 0.90). The CL ROC measurements demonstrated moderate to good reliability (ICC: 0.61, 0.68, 0.84). The AW demonstrated good to excellent reliability (ICC: 0.88, 0.90, 0.90). AL ranged from moderate to good reliability (ICC: 0.68, 0.76, 0.87).
Discussion
Achieving congruence between the donor graft and the recipient site in osteochondral allograft transplantation for large talar dome lesions is critical to ensure adequate restoration of articular curvature and preservation of joint biomechanical integrity. Findings from our study suggest that, when compared to AW and age, AL may be a better candidate in approximating PM and CL talar dome ROC. These findings highlight the importance of incorporating quantitative anatomical measurements in selecting donor grafts, as age alone may not capture the heterogeneity of the talar dome topography.
Our findings are consistent with prior research that investigated aspects of graft contour sizing and matching in restoring joint biomechanics. Wiewiorski et al 12 described using sagittal talar radii to measure and match grafts for OCL repair with favorable results. Our results extend this knowledge by identifying the talar dome AL as the most accurate predictor of ROC, offering an anatomical parameter that can be readily applied in planning OCA for talar dome OCLs. This is consistent with Jerban et al’s 16 study that demonstrated strong correlation between femoral condyle ROC and anterior-posterior length. Using AL as a proxy for talar dome ROC may improve size matching and minimize incongruity and associated consequences or unnecessary tests or procedures. For instance, Latt et al.’s 8 study showed that a mismatch of sagittal measurement can lead to articular step-off and significantly affect articular contact pressures, with elevated grafts increasing peak pressures and recessed grafts redistributing forces to adjacent joint surfaces. Using the AL as a proxy for talar dome size matching may also eliminate the need to scan the contralateral side in case the bulk of the talus collapses.
The weaker correlation of AW with ROC in our study contrasts with prior literature that used coronal width as a matching criterion. Bisicchia et al 17 describe a medial-to-lateral approach in measuring the osteochondral defect and its corresponding plug-shaped grafts. Although articular width may be useful in comprehensive measurements of recipient site and donor graft, a possible explanation for the lower correlation may be that the sagittal curvature, rather than the coronal width, plays a more critical role in maintaining the talar dome articular congruency. Additionally, our findings suggest that age may have the least predictive value of the talar dome ROC. This may be explained by discrepancies between skeletal and chronological ages as noted by Calfee et al. 18 Although age may be a proxy for skeletal maturity, emphasizing anatomical parameters may provide more accurate estimates of measurements to ensure donor and recipient site fit. The observed larger ROC in males compared to females is consistent with prior literature and is attributed to allometric variation rather than intrinsic differences in talar bone shape.19,20
To further refine graft selection criteria, we propose a theoretical model for guiding and evaluating the congruence of the graft’s and recipient’s sagittal ROC. This framework aligns with Latt et al’s 8 study on graft height mismatches and their implications on contact pressures in the talocrural joint, as well as Vezeridis and Bae’s 21 guide for osteochondral autologous transplantation surgery for the treatment of capitellar OCD using donor knee sites in adolescents (Figure 8). Ensuring sagittal ROC matching and using AL to achieve that may result in improved outcomes in surgical repairs of large talar lesions.
Graft ROC = Talar dome ROC → Optimal fit
Graft ROC < Talar dome ROC → Potential protrusion, altered load distribution
Graft ROC > Talar dome ROC → Risk of flattening
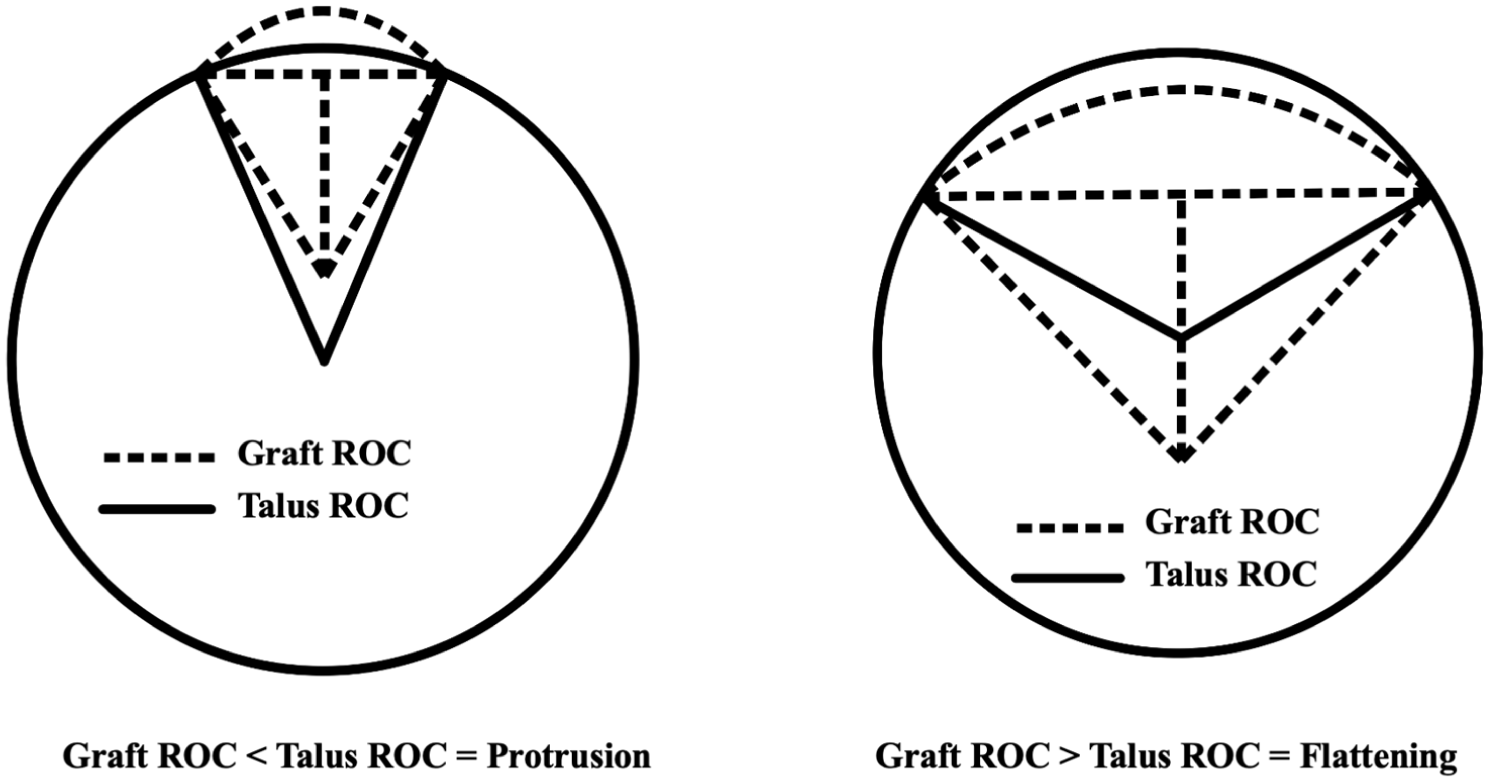
Geometrical visualization of graft ROC and talar dome ROC mismatch in the evaluation of curvature congruence. The full bolded circle represents the sagittal curvature of the talar dome. The dotted curvature represents the graft curvature.
In addition to demonstrating strong correlations with the sagittal ROC, the AL may serve as a clinically relevant and applicable parameter for surgical planning. JRF Ortho, one of the most prominent tissue banks in the United States, uses articular length and articular width to match a bulk allograft size to the recipient’s talus size. 22 Other tissue banks ensure donor-recipient site matching using demographic parameters including age, height, weight, and sex, as well as advanced 3-dimensional software comparing overall shape, size, and articular surface geometry.23 -25 Although these systems may incorporate parameters including AL, AW, and sagittal or coronal ROC, there remains limited evidence for which parameters best predict the talus ROC. This may result in measurement variability and intraoperative manual surgeon measurement. 2 Our findings support AL as a reproducible anatomical proxy for talar dome ROC to help guide efficient graft selection and matching while reducing variability in practices.
The AL can be measured using standard preoperative MRI scans. The AL is defined as the linear distance from the anterior to posterior articular margins of the talar dome on the midsagittal slice. To ensure reproducibility of AL measurements, the anterior and posterior margins should be identified using the most anterior and most posterior points of the talar dome articular cartilage as visualized on MRI midsagittal slice. As the AL is measured in the sagittal plane of the talar dome, it may serve as a reproducible proxy for talar dome curvature and contour measurement. Incorporating the AL measurement into donor graft selection may improve geometric congruency by matching the recipient’s native talar dome anatomy with the donor graft morphology. Clinically, this may be achieved by indexing donor graft databases with sagittal AL measurements and selecting grafts that approximate the recipient’s AL. This is particularly relevant in pediatric patients where using age to estimate the curvature may be less predictive because of variations in skeletal maturity.
This study presents some limitations. The retrospective study design and single-institution setting may limit the generalizability of findings. Additionally, the study of 29 patients consisted exclusively of pediatric and adolescent patients (aged 9-18 years), which may not comprehensively capture the heterogeneity of talar dome anatomy and be generalizable to adult cohorts undergoing osteochondral allograft transplantation. The observed moderate intraobserver reliability in one rater may be attributed to rater’s experience in MRI measurements or measurement variation. Comparison with 2 other raters including a board-certified orthopaedic surgeon was conducted to ensure reliability. The moderate to good AL interobserver reliability likely reflects measurement variation in defining articular margins. We recommend establishing standardized protocols to minimize variation. With the calculated minimum detectable correlation of R² >0.25, the study was sufficiently powered to detect moderate to strong correlations. Lower correlation values may have been underpowered and should be cautiously interpreted. Finally, given the observational nature of the study, the findings remain exploratory and require future investigation.
Future studies may investigate the role of AL and ideal differences in graft/talus sagittal ROC measurements in OCA sourcing and matching and assess their impact on clinical outcomes following transplantation. Characterizing anatomical predictors of the lateral femoral condyle—a common site for graft sourcing—ROC, associated segmental variations in ROC from proximal to distal down to the sulcus terminalis, and mapping optimal graft sites congruent with the talar dome ROC may provide more insights to optimize graft selection and matching for the repair of talar lesions. Finally, integrating artificial intelligence (AI), machine learning algorithms, and computational 3D modeling techniques in OCL-graft measurements may further enhance the precision of topographic matching and enhance surgical outcomes for patients.
Conclusions
This study demonstrated that the AL correlates more strongly with the talar dome PM and CL ROCs than AW and age in pediatric patients. Therefore, the AL may be a practical and reproducible parameter for optimizing graft contour sourcing and matching in osteochondral allograft transplantation. Future studies may investigate the role of AL in accurately measuring OCLs, selecting donor sites, and preparing allografts, and may also develop other approaches to establish standard 3D models of the talar dome to inform surgical plans and improve outcomes.
Supplemental Material
sj-pdf-1-fai-10.1177_10711007251405243 – Supplemental material for Articular Length Better Predicts Talar Dome Radius of Curvature Than Articular Width or Age in Pediatric Osteochondral Allograft Planning
Supplemental material, sj-pdf-1-fai-10.1177_10711007251405243 for Articular Length Better Predicts Talar Dome Radius of Curvature Than Articular Width or Age in Pediatric Osteochondral Allograft Planning by Hubert Tuyishime, Olivia Okoli, Tetsuro Sueyoshi, Chiamaka Obilo, Kevin G. Shea and Charles M. Chan in Foot & Ankle International
Footnotes
Acknowledgements
The authors of this study would like to acknowledge Nicole S. Pham for her assistance with statistical analysis.
Ethical Considerations
Ethical approval for this study was obtained from the Stanford University IRB Administrative Panel on Human Subjects in Medical Research (eProtocol: 65352, IRB 61).
Funding
The authors received no financial support for the research, authorship, and/or publication of this article.
Declaration of Conflicting Interests
The authors declared no potential conflicts of interest with respect to the research, authorship, and/or publication of this article. Disclosure forms for all authors are available online.
Informed Consent
No informed consent was required as this was a retrospective study.
References
Supplementary Material
Please find the following supplemental material available below.
For Open Access articles published under a Creative Commons License, all supplemental material carries the same license as the article it is associated with.
For non-Open Access articles published, all supplemental material carries a non-exclusive license, and permission requests for re-use of supplemental material or any part of supplemental material shall be sent directly to the copyright owner as specified in the copyright notice associated with the article.