
Abstract
This study examined how transitions in traffic density and speed affect drivers’ risk perception over time. Nineteen participants viewed driving simulation recordings featured urban-highway transitions: high-to-low and low-to-high transitions in traffic density and speed. Subjective risk perception ratings were collected at three time points: before the transition (Pre), shortly after (Transition), and following a short adaptation period (Post). Results indicated that risk perception dropped rapidly when traffic density decreased and spiked immediately when density increased, followed by gradual adaptation. Speed reductions unexpectedly increased perceived risk, while speed increases led to delayed decreases in perceived risk. Findings highlight the need for traffic systems and driver assistance technologies to consider how perceived risk shifts asymmetrically during environmental transitions. Future work should employ interactive simulations and control for visual and structural variables to isolate contributing factors more precisely.
Introduction
Road safety remains a critical global concern. According to a report by the World Health Organization (2023), countries with varying income levels account for different percentages of total traffic fatalities worldwide. These differences often align with differing road complexities. Among the various factors contributing to road complexity, traffic density stands out as one of the influential factors (Teh et al., 2014). Traffic density conditions can directly influence a driver’s perception and comprehension of the surrounding environment. Kaber et al. (2012) found that increased roadway complexity negatively impacts driver situation awareness (SA). Moreover, simply the knowledge of higher traffic density in the opposite direction can reduce SA (Jia et al., 2024). Additionally, traffic density influences critical driving behaviors such as merging (Li & Cheng, 2019), lane-changing, and overtaking maneuvers (Yang et al., 2018). Notably, the complexity that arises during transitions in traffic density can be fundamentally different from that in steady-state traffic conditions due to potential shifts in drivers’ risk perception, which can compel updates in underlying mental models, SA of the surroundings, and subsequently driving behaviors (Lyu et al., 2017). Despite its significance, little research has investigated how transitions in traffic density affect drivers’ perceived risk and driving behaviors.
Drivers’ risk perception significantly influences how they recognize and respond to potential hazards. Common methods for measuring risk perception include video-based hazard perception tests, static image assessments, driving simulations, and real-world driving tests (Moran et al., 2019). One widely used approach for risk perception modeling involves field-based models that quantify the geometric contour of surrounding objects into risk potential fields, which direct driver behavior through gradient descent. Examples of this integrated approach include the Drivers’ Risk Field Model (Kolekar et al., 2020) on drivers’ steering responses, considering factors such as driver states while excluding environmental variables, and Driving Safety Field Model (Wang et al., 2015) that incorporates “static” factors (e.g., adhesion, slope, visibility, weather). However, existing models often use a fixed set of “weights” tied to specific characteristics of environmental components, and omit the role of “dynamic” factors such as transition in traffic density on risk perception.
To address this research gap, this study aims to investigate how the time-series change in traffic density condition shapes drivers’ risk perception. In addition to traffic density, speed changes in the traffic flow can also affect one’s risk perception (Yao et al., 2019). Considering that transitions in traffic density often coincide with speed variations, these two factors are examined individually in this study. Findings will inform the future development of comprehensive driver risk perception models that incorporate shift in risk perception due to dynamic changes such as traffic density transitions.
Methods
Participants
Nineteen participants (10 males, 9 females) were recruited for this experiment. All participants hold a valid U.S. driver’s license. The average age was 28.95 years (SD = 4.92, range: 22–42 years). The driving experience was 8.13 years on average (SD = 5.85, range 1–26 years). This study was approved by the Institutional Review Board (IRB #: IRB2025-31) at Texas Tech University.
Apparatus
This study used fixed-based driving simulator, equipped with a Logitech G29 steering wheel, pedals, and gear shifter kit (see Figure 1). The driving scene was displayed on a 65-inch monitor (resolution: 3840 × 2160), positioned at eye level to replicate the view through a windshield. The driver’s view included the left and center rear-view mirrors. In this study, driving controls were not functionally connected to the driving scene, their physical presence aimed to maintain a realistic driving posture and promote engagement in the driving task. Driving scenarios were created using American Truck Simulator (ATS) (SCS Software, Prague, Czech Republic). A virtual Audi A6 Avant served as the ego vehicle.
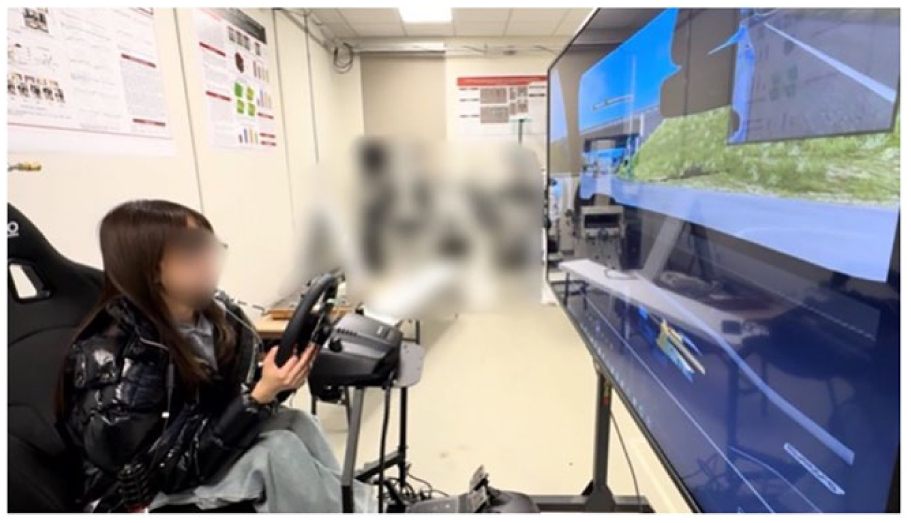
Experimental setup.
Video recordings were used to ensure consistency in traffic density and speed conditions across participants. This approach offered effective experimental control while preserving key ecological elements necessary for examining dynamic risk perception during transitions.
Driving Scenarios
The simulated route including urban roads in downtown Galveston, TX and a segment of Interstate 45 (I-45) between Galveston and Dallas, TX. The locations were selected for inherent familiarity of roadway geometry for the participants and for a realistic urban-highway interface that justifies the traffic density and speed transitions needed in this study.
To allow participants to acclimate to the driving environment, each video began with 8 to 10 min of stable driving conditions before the critical transition occurred. This design consideration was based on previous research indicating that adaptation to simulated environments typically requires 8 to 15 min (Charlton & Starkey, 2013; Godley et al., 2002).
Two of the four scenarios were designed to manipulate traffic density. In the first scenario, traffic transitioned from high density (Level of Service—LOS D; >30 to 40 passenger cars per mile per lane) to low density (LOS A; <10 pc/mi/ln). In the second, traffic transitioned in the opposite direction, from LOS A to LOS D. In both conditions, vehicle speeds were held constant. These transitions were implemented using the ATS editor mode, which allowed direct control over the density of surrounding vehicles while maintaining visual consistency across all scenarios. Due to software limitations, we were unable to independently control the density of larger vehicles (e.g., trucks); however, since all traffic was randomly generated by the same system within ATS, similar compositions of each vehicle types can be assumed. The remaining two scenarios manipulated traffic speed while keeping vehicle density constant at LOS C (20–30 pc/mi/ln). These were created by selecting roadway segments within ATS that exhibit natural speed transitions. Specifically, the route entering Galveston via I-45 highway ramps served as the high-to-low speed condition (transitioning from 60 to 75 mph interstate to 35 mph urban roads), and the reverse path—from the city of Galveston merging back onto I-45—was used for the low-to-high speed condition.
Procedures
Participants were instructed to adopt the role of a driver throughout each video session, maintaining continuous engagement as the vehicle progressed through varying traffic scenarios. Participants first completed a 2-minute training session to become familiar with the driving tasks and the rating process. Each participant experienced all four scenarios once, with randomized orders to minimize potential learning effects.
Perceived risk was measured using verbal risk ratings collected at three predefined time points during each driving scenario (Figure 2). At each probe, a prompt appeared on the screen asking: “As a driver, how risky would you judge the current situation?” (De Winter et al., 2023). Participants were instructed to verbally report a number from 0 (no risk) to 10 (extreme risk) immediately upon seeing the question displayed on the screen, without pausing the simulation. This approach ensured spontaneous, real-time responses aligned with the unfolding traffic context.
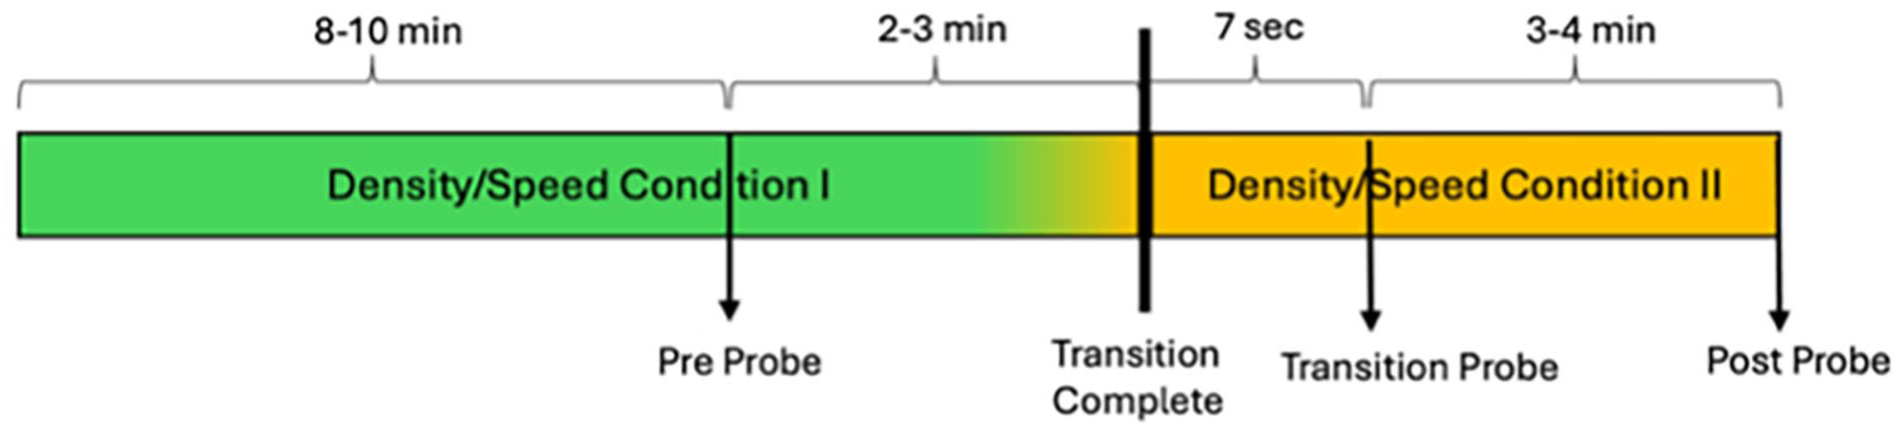
Overview of experiment design.
The second probe (Transition) was triggered exactly 7 s after the traffic condition changed, a timing informed by prior research on situation awareness adjustment windows (Liang et al., 2021). The final probe (Post) was administered 3 to 4 min after the transition to assess risk perception once participants had had sufficient time to adapt to the new environment (Endsley, 2017).
Data Analysis
Risk perception ratings were analyzed using linear mixed-effects models (LMMs) to examine how participants’ perceived risk changed across different traffic transition conditions. This approach allowed for the assessment of within-subject changes over time while accounting for individual variability. The analysis focused on
Bar plots with standard error bars were generated to illustrate the mean risk ratings at each probe time across conditions. All statistical analyses were conducted in R, and the lme4 package (Bates et al., 2015). Significance was determined at the p < .05 level for all fixed effects. As a general guideline, partial η2 values of 0.01, 0.06, and 0.14 are considered small, medium, and large effects, respectively (Cohen, 1988).
Results
For traffic density transitions, when density decreased from High to Low, perceived risk dropped significantly from the Pre to the Transition phase (β̂ =
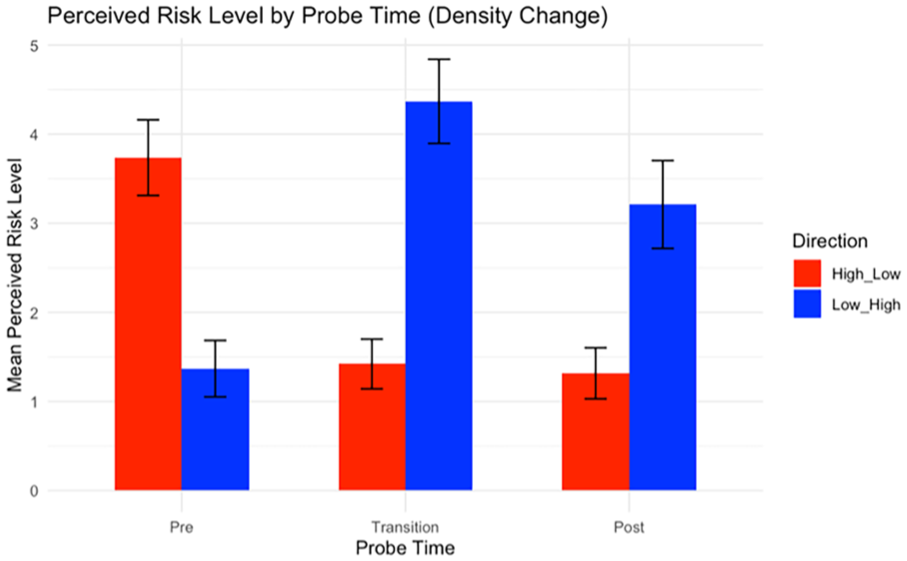
Perceived risk level across probe times for traffic density changes.
A different pattern emerged for traffic speed transitions. When speed decreased from High to Low, perceived risk increased significantly from Pre to Transition (β̂ =
In contrast, when speed increased from Low to High, there was no significant change in perceived risk from Pre to Transition, suggesting that drivers did not immediately interpret higher speeds as more dangerous. However, perceived risk did decline significantly from Transition to Post (β̂ =
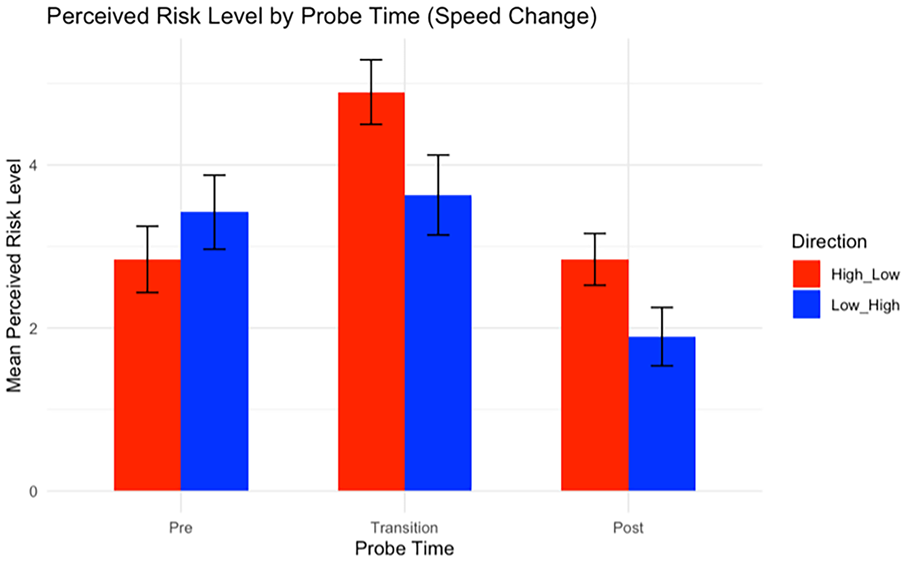
Perceived risk level across probe times for traffic speed changes.
As shown in Figure 3, perceived risk levels varied notably across transition directions in the density condition. However, in the speed condition, these differences were visually less pronounced, particularly at the Pre phase (see Figure 4). To further clarify these observations, we conducted a set of exploratory comparisons using linear mixed-effects models, with
Discussion
The study investigated fluctuations in drivers’ perceived risk during transitions in traffic density and speed. Significant changes in risk perception were observed for both transition types. Notably, the patterns of these changes diverged, indicating that drivers may cognitively process transitions in traffic density and speed differently.
As expected, drivers’ perceived risk increased during traffic density transitions from low to high and decreased during transitions from high to low. Our findings also highlight a subtle asymmetry in the dynamics of how drivers’ perceived risk evolve in response to environmental change. While the directional effects themselves may appear intuitive, the temporal characteristics of adaptation diverged. For instance, decreases in density elicited an immediate and sustained reduction in perceived risk, suggesting rapid assimilation of the simplified environment. In contrast, increases in density caused a sharp initial spike in perceived risk, followed by a moderate but significant drop.
This slight asymmetry caused by a small spike during transition from low to high density can be explained by fluctuations in cognitive workload. Drivers may initially rely on heuristics to interpret environmental changes (Slovic et al., 2004), but the direction of change—toward greater or lesser perceived demand—modulates the rate and stability of their recalibration. Rapid adjustments following a reduction in traffic density reflect reduced cognitive demands and minimal discrepancy between expectation and perception. In contrast, transitions toward more complex or unexpected scenarios will likely violate existing mental models, thereby increasing cognitive workload and requiring greater mental effort for integration and adaptation.
Contrary to our expectations, the asymmetry observed in speed transitions was different than the one observed in density transitions: a reduction in speed increased perceived risk in the short term, which then declined over time. On the other hand, increased speed did not provoke immediate concern. This short-term spike can be explained by contextual factors. Specifically, the transition into a lower-speed condition was accompanied by a shift from freeway to urban environment, where headways are typically shorter, despite the constant density. We speculate that this looming visual cue—despite matched vehicle counts—may have led to elevated perceived risk immediately following the speed reduction (Liu et al., 2022; Park et al., 2024). In this sense, vehicle count alone may not fully capture the perceived complexity of the environment. Spatial layout and contextual cues, such as road geometry and visual clutter, could also influence how drivers interpret situational risk (Cox et al., 2017). Future studies are needed to isolate these factors and evaluate their individual contributions to risk perception. It is also possible that the knowledge of being in an urban area could have contributed to the risk perception spike in High-to-Low speed transition. However, there was no significant difference in perceived risk during the Pre phase, suggesting that the impact of environment (urban vs. highway) alone was limited, and the spike was mainly attributed to dynamic changs during the transition.
Collectively, these findings emphasize that risk perception is not only sensitive to current driving conditions, but also to the trajectory of change—how the environment is evolving over time.
Limitations and Future Work
One limitation of this study is the use of video-based simulations rather than interactive driving tasks. Although videos offer high control and consistency, they lack the cognitive and sensorimotor demands of active driving. Participants passively observed scenarios without controlling the vehicle, which may have influenced how risk was perceived and updated.
Additionally, while traffic density and vehicle count were held constant during speed transitions, contextual factors—such as inter-vehicle distance, road layout—may have varied unintentionally across scenarios. Future research should better isolate the effects of speed by controlling for these environmental variables. Incorporating physiological and eye-tracking data in future work may offer deeper insights into affective and attentional processes underlying risk perception.
Finally, the participant sample was limited in demographic and socio-technical diversity. Since risk perception can be shaped by cultural background, driving experience, and technological familiarity, future studies should test generalizability across broader populations.
Conclusion
This study examined how drivers’ risk perception evolves during transitions in traffic density and speed. The results revealed significant temporal effects and highlighted subtle but meaningful asymmetries in perceived risk. Building on these findings, future traffic management and driver assistance systems should also consider how drivers’ risk perception shifts across different transition phases to better support safe and adaptive behavior in dynamic driving environments.
Footnotes
Declaration of Conflicting Interests
The authors declared no potential conflicts of interest with respect to the research, authorship, and/or publication of this article.
Funding
The authors received no financial support for the research, authorship, and/or publication of this article.