
Abstract
Many user studies are unable to produce quality data because, either the designed questions or the desired scale is not comprehended by participants. In the context of in-person climate studies, providing a broad range of climatic conditions and practice with the evaluation scale is an ideal, but rarely utilized procedure, allowing participants to understand the range and granularity of their own perceptions. This study compares three climate scales at different levels of granularity between groups with and without training. Comparisons of comfort ratings of each scale on each scenario were made between their training and no training subsets. Comparisons were also made between the workload and comprehension for each scale for each scenario to their training and no training subsets. The responses between training versus no training subsets were not significant except for a few scenarios and groups. Survey completion time between those were not significant, in this self-paced study. The appearance of significant differences for individual groups and lowered frustration rating indicates that low-resource training documents with examples may be a useful methodology to improve data quality especially for human factor surveys with limited participant availability.
Introduction
Background
Storyboarding is a design method and a unique way of identifying the use cases and context of use of a specific product or a process. It was created in 1930 by Walt Disney to communicate ideas cheaper and faster to save time and resources (Whitehead 2004). This method has been used since at least 1969, when researchers at John Hopkins University published on using computer animation to create stories for academic purposes (Huggins et al. 1969). There are numerous thermal scales used in literature. The oldest and most widely used is the Bedford Scale and its associated formulations. A condensed form of the Bedford Scale, sometimes called the ASHRAE Scale or PMV (Percent Mean Vote) scale, named after a model output on the same scale, is commonly used in literature and is a simple scale (ASHRAE, 2021). Both scales are ostensibly thermal sensation scales where neutral is comfortable. The Bedford Scale (Bedford and Council; Bedford, 1936) does contain a neutral, hot but comfortable, and cold but comfortable metric to denote the comfort range, but as it was transformed into the PMV/ISO/ASHRAE its scales assumes maximum comfort occurs at 0 without a value metric as it is a scale of sensation only. It has to be paired with the PPD (Percent Persons Dissatisfied) metric to provide a judgment of percentage of dissatisfied persons. The work at the Center for the Built Environment at UC Berkeley was instrumental in promoting the separation of at least two parts of thermal environmental perception: sensation and comfort. The Berkeley Comfort and Sensation Scale (Zhang, 2003) (Figures 1 and 2), sometimes known as BCS Scale or Berkeley scale, has a separate scale for comfort and a separate scale for sensation. Sensation is like an expanded ASHRAE Scale and is continuous. The comfort scale is bifurcated around comfort or discomfort, forcing the participant to pick either comfort or discomfort with no central or neutral value. The theory is that there is no state of neither comfort nor discomfort. Along with the Berkley Scale, the other two scales under consideration are Mean Thermal Vote (MTV) Scale that is essentially Nilsson’s and Holmer (2004) description of the Bedford Scale (7-point scale) and a Modified MTV, a 11-point scale described below. To validate the climate scales, surveys to were used to collect data from the users using imagined scenarios expected to be relatable and that span different ranges of thermal comfort and sensation. The theory depends on the imagination, memory and the commonality of the experiences in people experiencing the thermal environment. This study is going to make use of this scenario-based method for studying the climate scales.
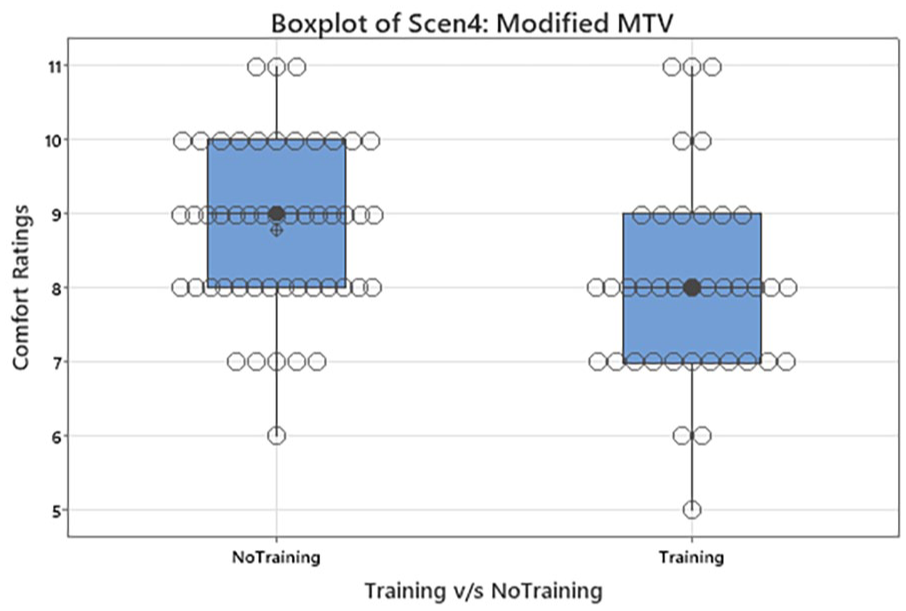
Boxplot of Comfort Ratings for Scenario 4: Modified MTV Scale.
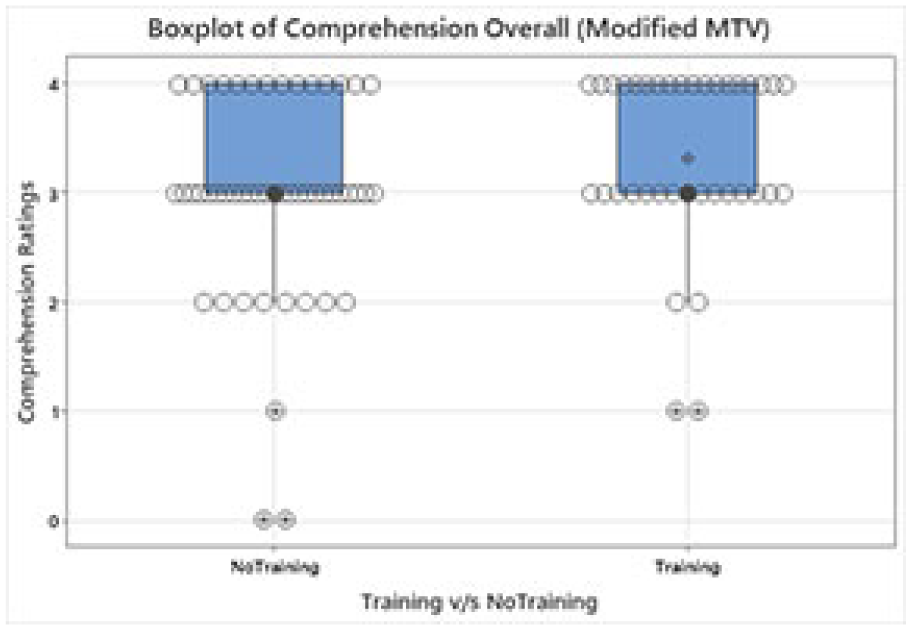
Boxplot of Overall Comprehension Ratings: Modified MTV Scale.
Problem Statement
Climate studies, like other in-person human factor studies, are very resource intensive. These studies usually take place in controlled test facilities including instrumentation and significant controls. These facilities are generally a shared resource, and availability is limited in academia and industry. The studies are time intensive, and specifically in automotive research, only about four to seven people can be tested due to the vehicle seating arrangement. Participants must be onsite for these studies and the minimum time in the author’s experience is 45 min of work. The test proctoring, data transcription, and data analysis are also very time intensive processes.
When testing specific iterations of environmental conditions comfort studies are the only method to get subjective feedback. In the authors’ experience with internal climate studies participants have experience confusion, misunderstanding, or misuse of thermal scales during testing and this has significantly affected test results. There are times when the participants are called for weekly testing and their understanding of the scale is developed at the later stages i.e. the second time they come for testing or when they experience different conditions resulting in an internal adjustment to their self-calibration of the scale. If the test is done within-participant, the responses will have time-based drift and then stabilize, however this can take varying time between participants. The assumption is that with practice, experience, and proper test setup this problem can be minimized.
These are some of the problems associated with climate studies. To solve a few of these concerns we propose a survey-based solution. In this study, we used a survey to collect participant responses on a few climate scenarios as well as some baseline information. The data collected is analyzed in phases. In the first phase, we look to release the results of comparing the three industry scales with and without prior training on using these scales. We report significant results. Our hypothesis for this study is: Training will significantly change the responses of the population on the questionnaire and can improve our data quality by training participants. In addition to the above we also studied the comprehension of these scales and hypothesize as follows: MTV (Mean Thermal Vote) scale and Modified MTV Scale are easier to use than the Berkeley Model.
Experimental Design
Method
Surveys were used to collect participant responses. The surveys followed between-subjects design. The training (T) group was given a document with an explanation of the scales, the fundamentals behind the perception of thermal comfort and examples that would help them take the survey. The non-training (NT) group was given the same survey with none of these aids. The survey questionnaire was the same for both the groups. The following are the main rating values for the surveys used in the T versus NT comparison. The scales under consideration were a slightly modified Berkeley scale of comfort and sensation, Modified MTV Scale, and MTV Scale. The Nilsson and Holmer (2004) MTV Scale with a modified numerical system:
Much too cold
Too cold
Cold but comfortable
Neutral
Hot but Comfortable
Too Hot
Much Too Hot
The Modified MTV Scale expands the MTV formulation to include more granularity, attempting to bridge between the detail of the Berkely Scale and the simplicity of the MTV:
Extremely cold
Much too cold
Too Cold
Cold and Comfortable
Cool and Comfortable
Neutral
Warm and Comfortable
Hot and Comfortable
Too Hot
Much Too Hot
Extremely Hot
The Berkely scale employed the formulation proposed by Zhang (2003) with extra values in between the comfort ratings of Just Comfortable and Very Comfortable to attempt to provide more definition for the participants. This required moving the usual “Very (Un)Comfortable” from the ±4 positions to the ±3 position and adding “Extremely” to the ±4 positions. The Berkely Sensation and then Comfort Scale formulations, respectively, are as follows:
Sensation:
1.Very Cold
Cold
Cool
Slightly Cool
Neutral
Slightly Warm
Warm
Hot
Very Hot
Comfort:
−4. Extremely Uncomfortable
−3. Very Uncomfortable
−2. Uncomfortable
−1. Somewhat Uncomfortable
−0. Just Uncomfortable
0. Just Comfortable
1. Somewhat Comfortable
2. Comfortable
3. Very Comfortable,
4. Extremely Comfortable
There were three surveys corresponding to each of the scales. Each survey had the same set of questions and scenarios. Each survey had a different scale. Out of the two documents that were sent out the training version had examples of scenarios and explanations on ratings as well as a link to the form. The no training document just had the link to the survey form. The survey had a section on demographics and some questions on their initial comfort rating. The participants had to conceptually put themselves in the scenarios and give their comfort ratings.
At the end were comprehension and workload questions. The survey had a set of scenarios with rating scales to help participants rate their level of thermal comfort. The ten scenarios were based on different static and transient levels. The scenarios were constructed using levels of clothing, outside estimation of temperature, inside estimation of temperature and an estimation of humidity levels. The scenarios were very detailed to make it easier for the participants to imagine themselves in these scenarios. Comprehension was based on a five-point Likert scale.
Demographics
Overall, there were 279 participants took the survey. All participants were Ford Motor Company employees, who completed this study as part of their workday with no other compensation. There were respondents from United States, Canada, Mexico, United Kingdom and Germany. There were 102 responses for Berkely Scale out of which 82 were males and 20 were females. There were 90 responses for Modified Mean Thermal Vote (MTV) Scale out of which 74 were males and 18 were females. The others did not qualify to be included in the data. There were 87 responses for MTV Scale out of which 73 were males and 14 females. Berkely scale had 51 training responses and 51 no training responses. Modified MTV Scale had 49 no training responses and 37 training responses.
Data Collection
A recruitment email was sent out to gauge the interest in the topic and participation across the globe. We received 736 responses out of which (680) answered “Yes” and (56) answered “No”.
The survey was divided into sections based on the first initial of the last names of the participants, so each section would have almost an equal number of participants. This rubric was followed to randomize the assignments. Berkely Scale with training document (Participant:104); Berkley Scale with no training document (Participant:111); Modified MTV Scale document with training (Participant:105); Modified MTV Scale document with no training (Participant:100); MTV Scale document with training (Participant:105); MTV Scale document with NT (Participant: 110).
The survey was organized as follows: Demographics, Pre-survey subjective responses for baseline temperature; Pre-survey comprehension (5 Point Likert Scale); Subjective responses to the scenarios using the respective scales; post-survey comprehension (5 Point Likert Scale); Post-survey modified workload using NASA-TLX (Mental, Physical and Frustration) (Hart, 2006).
The scales were renumbered for the purpose of data analysis. The rubric for numbering was as follows: Comprehension scale was a Likert scale being Strongly Disagree (0) and Strongly Agree (4). The Berkely Comfort scale was also a Likert scale from Extremely Comfortable (8) to Extremely Uncomfortable (0). The new numbers can be used to read the graphs given in the paper for comprehension.
Results
The results were analyzed using Kruskal-Wallis analysis, adjusted for ties, and visualized in boxplots to compare training (T) versus no training (NT) data. The results reported here are the ones that were significant, and the results not mentioned in this paper were not significant.
Overall, for each scenario the T and NT variable was compared across every scenario for each scale. Workloads with respect to mental, physical and frustration were also compared for the T variable for each scale. The Berkely scale showed no significant results (p = .06) with respect to the scenarios. Scenario 4 showed a significant rating for Modified MTV Scale (p < .05; p = .01; T N = 37 with Median 8 and NT N = 50 with Median 9) (Figure 1). MTV scale showed no significant results (p = .09) with respect to scenarios. Overall comprehension was also compared for the T and NT variables for each scale and did not show any significance between the T and NT subsets for each scale except for Modified MTV Scale. Overall comprehension for Modified MTV Scale showed significant rating (p < .05; p = .04; NT: N = 50 with median = 3; T = 37 with median 3) (Figure 2). Overall workloads with respect to mental, physical and frustration were also compared for the T and NT variable for each scale with no significant differences. However, the number of people experiencing extreme Frustration on the Berkeley scale was reduced (Figure 3).
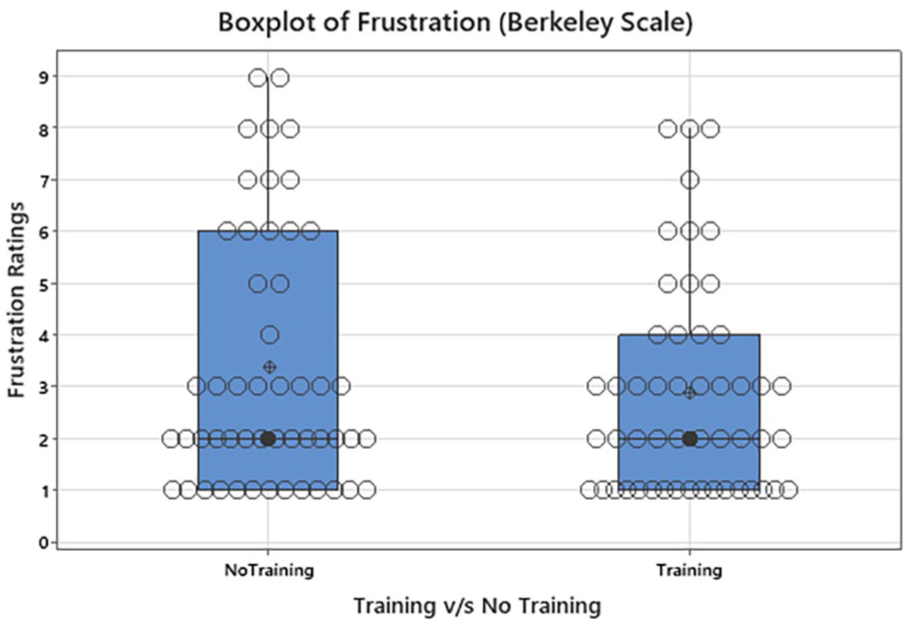
Boxplot of Workload Frustration Ratings: Berkley Scale.
Comparisons were also made between T versus NT with respect to Gender for each scale and scenario. Overall data was categorized into gender buckets of Male and Female. Within the gender, the data was categorized into Females who received training and Females who did not receive training. Similar approach was followed for Male dataset. In Scenario 4, among women using the Berkely Scale, there was significance with respect to T versus NT for scenario-based comfort ratings (p < .05; p = .03; NT: N = 10 with median = 2; T: N = 10 with median 3.95) (Figure 4). Modified MTV Scale and MTV scale showed no significant results with respect to scenarios and gender.
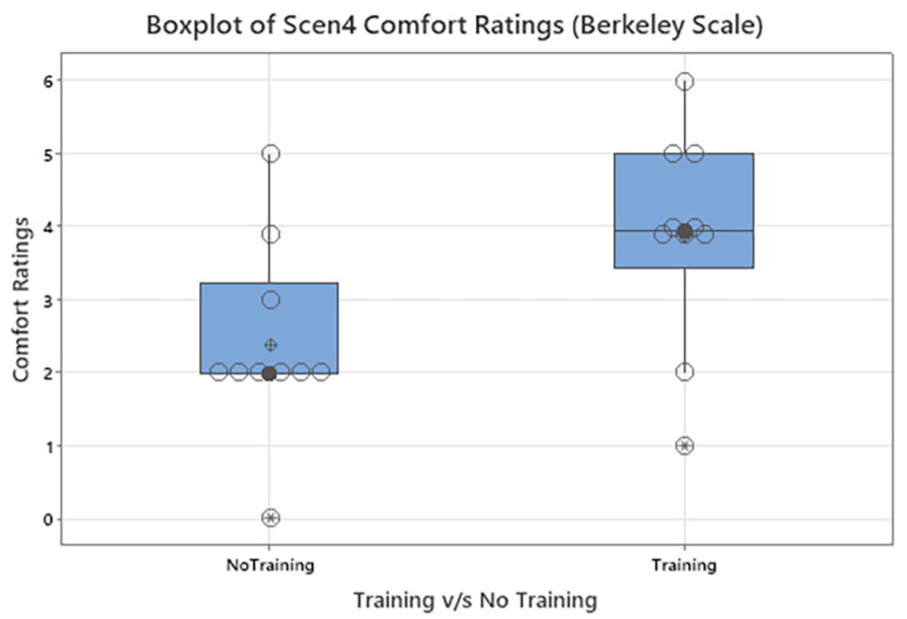
Boxplot of Comfort Ratings Scenario 4: Berkeley Scale.
Each comprehension rating was compared to the T and NT variable for each scale and gender. Similar to above, overall data was categorized into gender buckets of Male and Female. Modified MTV Scale showed significance with respect to overall comprehension within the male group (p < .05; p = .04; NT: N = 41 with median = 3 and T: N = 28 with median = 3.5) (Figure 5). Each workload rating for mental, physical and frustration was compared to the T and NT variable for each scale with respect to Gender. Similar to above the scenario and comprehension data, overall data was categorized into gender buckets of Male and Female. With respect to workload for mental, physical and frustration rating in females and males, the results were not significant between T versus NT across all the scales. It was noted that, many woman participants in the NT group, gave higher frustration ratings than the participants in the T group across all the scales (Figures 6–8).
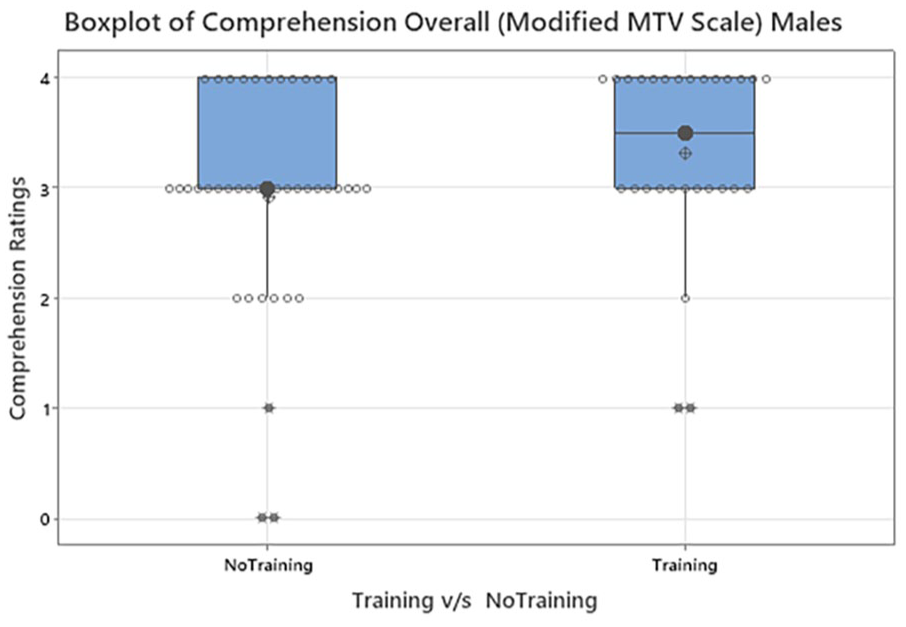
Boxplot of Overall Comprehension Ratings for Males: Modified Mean Thermal Vote Scale.
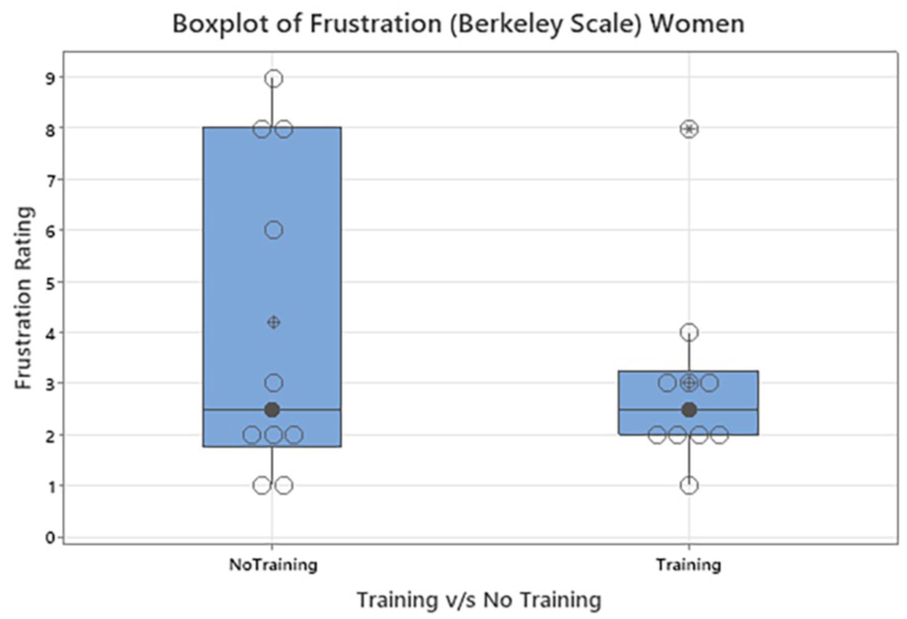
Boxplot of Workload Frustration Ratings for Women: Berkely Scale.
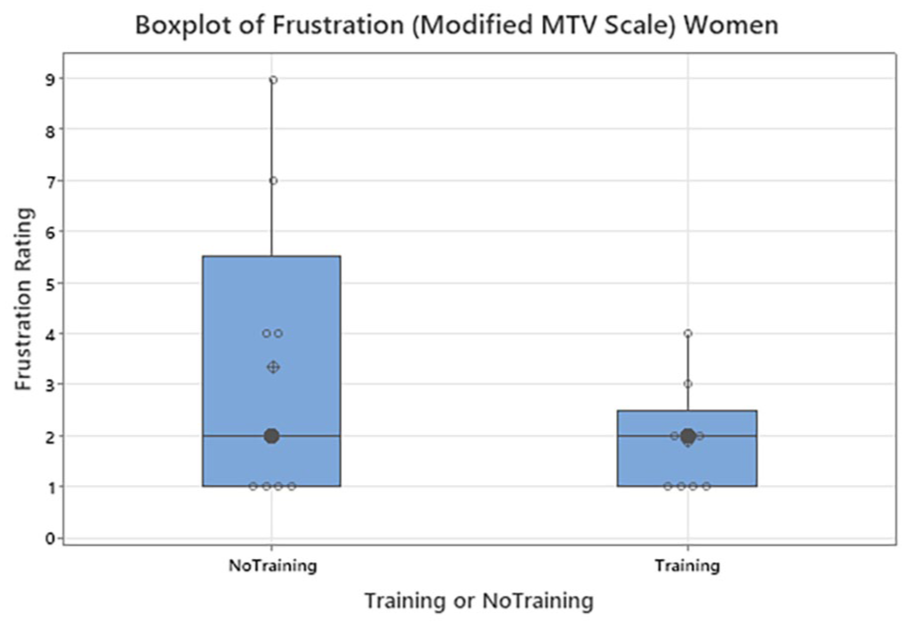
Boxplot of Workload Frustration Ratings for Women: Modified Mean Thermal Vote Scale.
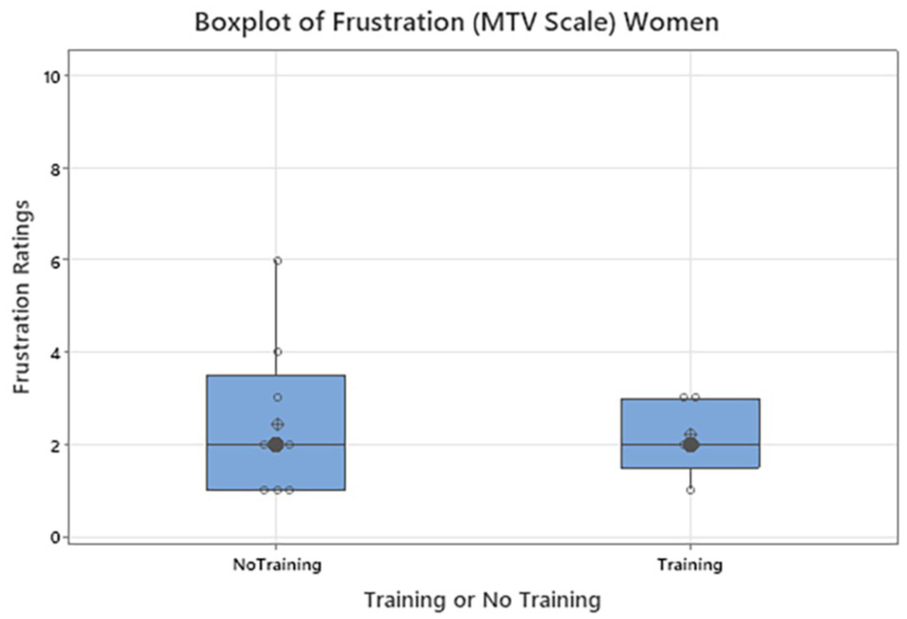
Boxplot of Workload Frustration Ratings for Women: Mean Thermal Vote Scale.
No significance was found between the scenario ratings of T versus NT for men across all the scales. We also looked at the survey completion time. No significance was reported for T versus NT data for each scale with respect to the completion time. The experiment was self-timed.
Discussion
This work explores using a scenario survey method to determine if training participants on thermal scales would have a significant impact on the results. The general lack of significance between most of the other parameters may also seem to indicate that the scales were mostly usable without training, especially the base MTV, further investigation is needed to determine why Scenario 4 and Scenario 8 showed significance, which requires further investigation.
When using original Berkeley scale is where the experimenters have observed the most difficulty in use with participants experiencing changes in their reported perception over time. It is interesting that the training dataset for the Berkeley scale decreased the overall number of people experiencing extreme frustration. Conceivably the additions to the scale may have helped make the scales more useful and negated some confusion in the NT cohort that was seen by the experimenters in previous studies.
The Modified MTV scale is an 11-point scale, slightly outside of the “best practices” of 5 to 10 points that are reviewed in Kweon and Park (2023). It is possible the 11-point scale was too much information to process. It may be that the Modified MTV scale and this formulation of the Berkeley scale require training for use with unexperienced populations or need further work.
This test was also self-paced; therefore, the impact of workload and comprehension were not sufficiently tested, other than the participant’s patience/impatience to finish the study. This factor was not controlled for and may have impacted workload metrics. It is quite possible that under time constraints this additional workload, lower comprehension, and higher frustration found in the NT may grow and become significant. By making the study self-paced, unlike being asked a series of rapid questions during a climatic study, the participants had more time to think about their answers.
It is acknowledged that the ability to use this type of survey method to evaluate actual cases is unproven and one of the purposes of this continuing work is to evaluate its efficacy. More work is needed to evaluate how well the scales matched the expectations for the scenarios. In comparing each survey scale against each other with a constant stimulus there were some significant differences, which may indicate viability for this survey methodology. Other limitations such as the self-paced aspect and the inability to determine if the participants read the training material are not accounted for in this methodology, nor are any unknown translation issues for global participants. Finally, it is recognized that using the modified Berkeley scale and additional descriptors may have confounded the results by making the method more understandable than the original versions and may need to be evaluated.
The pressures of in-person human factors evaluation can result in low participant numbers due to resource constraints and recruitment. One or two participants who are experiencing issues with the scale comprehension and/or workload in a small study can vastly skew the results. The impact of lowered overall frustration, indicates if working with a limited participant set it may be prudent to provide training for more complicated scales or utilize a simpler scale
Conclusion
This work presents the first part of a seemingly promising investigation into a novel scenario-based survey method for a human factors study with a large cohort using low-resources. Specifically, three climate evaluation scales were compared each with a written training document and without and showed significance for some groups in different scenarios. The effect of training measures within each scale was evaluated and the comprehension and workload of training within each scale was evaluated as was the overall differences for the training method. The effect of training on the aggregate of a large cohort appears to be small on average, but not necessarily for distribution. A key finding was that extreme frustration was reduced with training. These results may seem to indicate low-resource training may be useful for in-person subjective testing with small sample sizes. The effect on response accuracy, the self-paced nature of the study that may limit the impact of both the workload and training as well as the impact of “improved” scales all warrant further investigation.
Footnotes
Declaration of Conflicting Interests
The authors declared no potential conflicts of interest with respect to the research, authorship, and/or publication of this article.
Funding
The authors received no financial support for the research, authorship, and/or publication of this article.