
Abstract
This study explores the relationship between Information Communications Technology (ICT), social connectedness, and perceptions of COVID-19 in the United States following the official end of the public health emergency in 2023. Responses from 400 online survey respondents were analyzed. Logistic regression analyses identified predictors of (1) the perceived importance of social connectedness and (2) whether participants perceived COVID-19 as an ongoing health threat. Social connectedness was positively associated with extraversion, agreeableness, self-regulation, need to belong, phone attachment, and social media use, and negatively associated with number of ICT devices. Perceiving COVID-19 as a threat was negatively associated with boredom and need to belong and positively associated with openness and ICT usage. Sankey diagrams were used to visualize changes in ICT usage from 2020 to 2023. Findings contribute to ongoing longitudinal research on post-pandemic technology use and psychosocial adaptation.
Introduction
In May 2023, the U.S. Department of Health and Human Services (2023) declared the end of the COVID-19 public health emergency that was first announced in January 2020. The preceding 27 months saw rapid and unprecedented societal changes in the era of modern digital communication. ICTs such as smartphones, computers, and social media became essential for news reports, working remotely, and maintaining social relationships (Lee et al., 2021). Globally, society transitioned toward increased ICT usage in businesses, education, and personal communication (Ratten, 2023). Given the rapid change in ICT usage due to COVID-19, we seek to better understand changes in adaptations to technology usage, and how this affects overall social connectedness in the long run. This research examines the relationships between ICT usage, social connectedness, and perceptions of COVID-19 in the context of this evolving digital landscape.
Background
COVID-19 escalated rapidly into a global pandemic by early 2020, with cases rising exponentially (Columbia University, 2021). By 2022, while schools and restaurants began slowly reopening, many jobs remained remote, contributing to a lasting shift in ICT dependence. Additionally, educational institutions faced similar challenges following the switch to remote learning, and many recognized the need for more involved methods of teaching than recorded lectures and virtual meetings (Ratten, 2023). Despite vaccine distribution and ongoing public health efforts, new COVID-19 cases continued into 2023 (Centers for Disease Control and Prevention, 2024). Communities faced ambiguity and mixed responses—some people wore masks, others did not.
During the COVID-19 pandemic, ICTs became essential as individuals shifted to remote work, virtual learning, and digital socialization (Barrero et al., 2023). As restrictions eased and the world entered a period of re-adaptation, less is known about how ICT usage and users’ psychosocial characteristics shaped perceptions of threat and connectedness in the post-pandemic period. This study explored how psychosocial traits and ICT behaviors are associated with (1) feelings of social connectedness and (2) perceived threat from COVID-19 in the early post-pandemic era. By comparing our findings to patterns identified in 2020 (Lee et al., 2021), we seek to assess whether the psychological and technological dynamics observed during the pandemic have persisted or changed.
Method
An online anonymous survey, programmed in Qualtrics, was posted on Prolific between April 23 and May 5th, 2023, for this study. The study received the Institutional Review Board approval from the authors’ university.
Measures
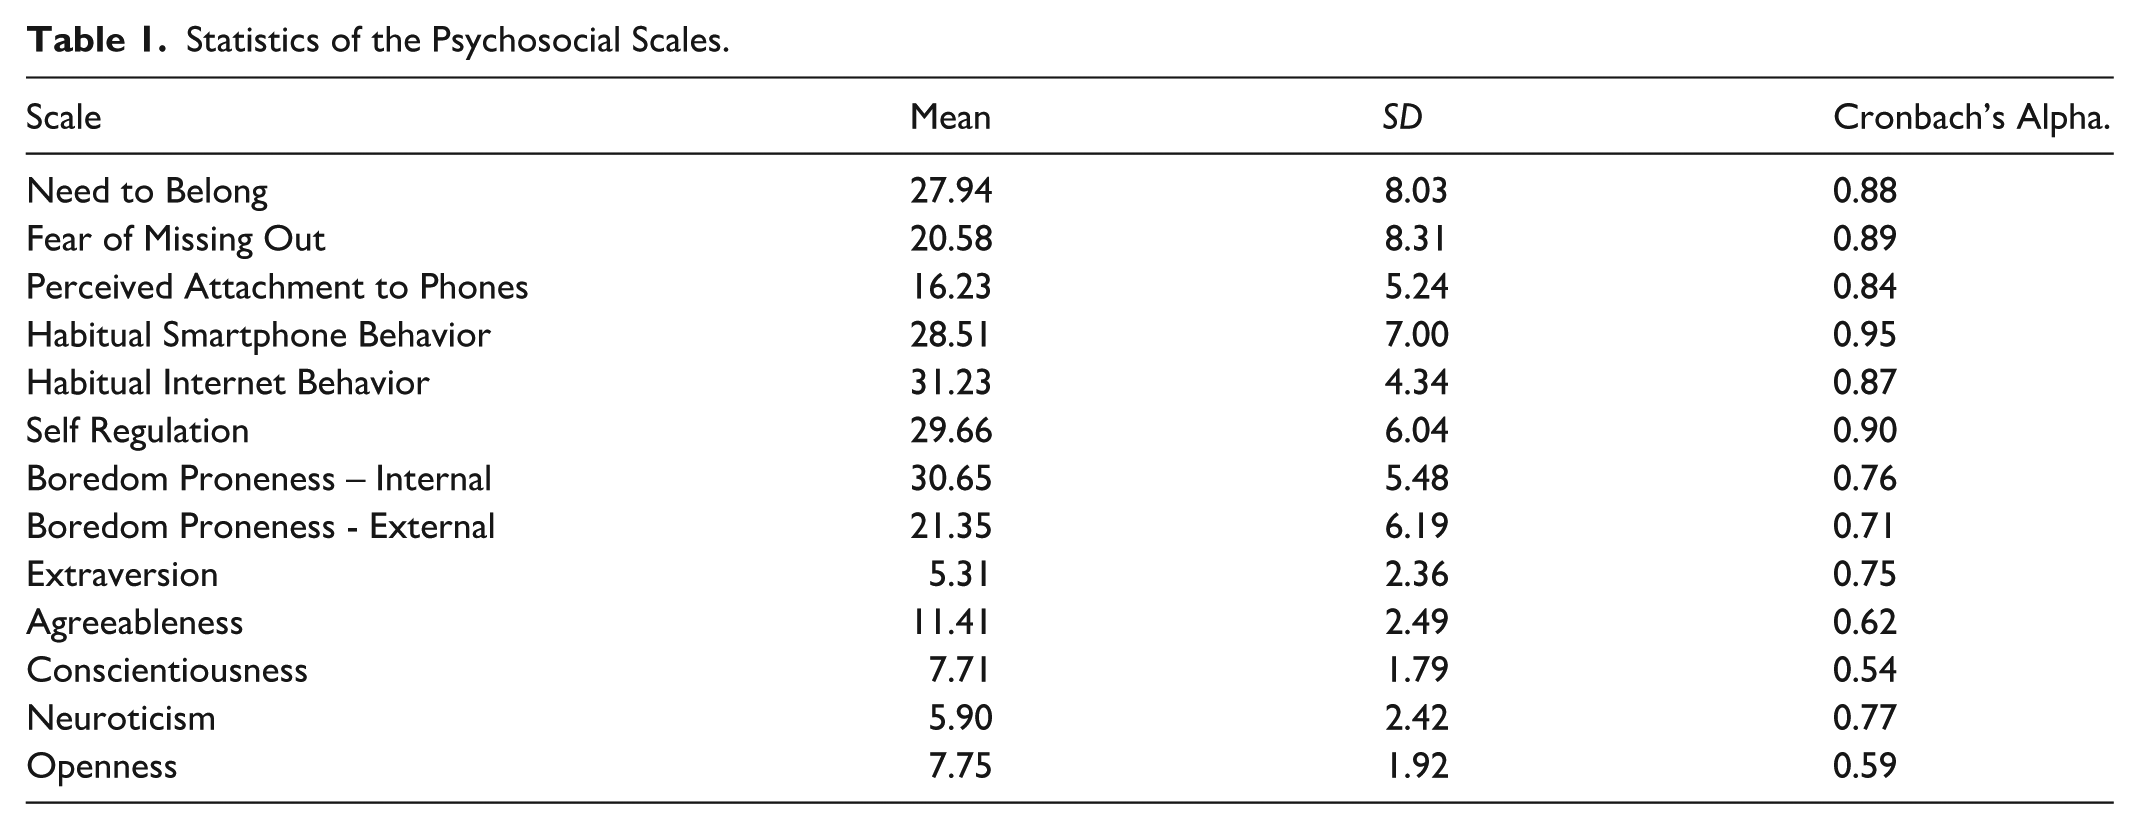
This study was part of a longitudinal effort to understand the interactions between COVID-19 and ICT usage. Previously validated psychosocial scales within the collected 2020 and 2023 data included: The Need to Belong Scale (Baumeister & Leary, 1995; Leary et al., 2013), The Fear of Missing Out Scale (Przybylski et al., 2013), the Perceived Attachment to Phone Scale (Weller et al., 2013), the Habitual Smartphone/Internet Behavior Scale (Limayem et al., 2003; Van Deursen et al., 2015), the Self-Regulation Scale (Diehl et al., 2006), the Boredom Proneness Scale (Farmer & Sundberg, 1986; Vodanovich et al., 2005), and the Abbreviated version of the Big Five Inventory (Rammstedt & John, 2007). Statistics on the psychosocial scales are summarized in Table 1.
Statistics of the Psychosocial Scales.
In addition, ICT related survey items asked about (1) overall ICT devices used on a daily basis, (2) time spent using ICTs for obtaining news on a daily basis, and (3) the sources for obtaining news on a daily basis (e.g., news channels, radio, etc.). These questions were presented twice—for participants to indicate their answers from two time periods: during the pandemic and after the pandemic. Further, reactions related to COVID-19 items asked participants to report their perceptions about the future given the status of the disease, the time spent on ICT applications for the purpose of staying connected with their social network, and the importance of staying connected. There were also demographic questions that asked for participants’ age, sex, residence, state of residence, race and ethnicity, education, income, and employment status. Please see Lee et al. (2021) for details about these survey items.
Participants
Inclusion criteria included being an adult (18 years of age or older) and residing in the U.S. All participants had an active Prolific account, through which they received an invitation to participate in the study. A total of 400 responses were collected, with 200 males and 200 females via the use of Prolific’s balanced sample feature. This sample size was used to match the sample size from the 2020 dataset and to limit costs (Lee et al., 2021).
Procedures
Participants agreed to complete the entire survey and provided consent. Following this, participants were presented with the instructions and definitions of the terminology (e.g., ICT) used in the survey. Participants were informed that there were no right or wrong answers and that they were encouraged to answer all the questions. The median completion time across all participants was 13 min and 9 s.
Analysis and Visualization
Logistic regression was used to model the relationship between the perceived importance of social connectedness (low vs. high), the psychosocial traits, ICT use, the relationship between participants’ perception about the future (positive vs. negative) and demographic variables. Logistic regression was chosen to analyze the relationship of binary outcomes rather than continuous values. Sankey graphs were created and used to visualize changes on ICT related items from during the pandemic to after the pandemic. JASP version 0.19.3 was used for the analysis and the pandas and plotly package in Python were used for the visualization. A Sankey graph visualizes the flow of data by representing different categories as nodes and their relationships as links (flows). The proportion of movement between categories is reflected in the width of each link.
Results
Data were analyzed from all 400 participants, who ranged in age from 18 to 81 (M = 42.36, SD = 14.46). The sample was made up of participants from nearly all U.S. states, except Alaska, Connecticut, Montana, South Dakota, and Vermont. Most participants reported living in suburban areas (n = 211), followed by urban (n = 96) and rural (n = 93) areas. The sample was predominantly White/Caucasian (n = 317), with the remainder identifying as Black/African American (n = 33), Latino/Hispanic (n = 29), South/East Asian (n = 16), Native American (n = 1) or Other (n = 1). Educational attainment was relatively high; many held graduate degrees (n = 63), almost half held a college degree (n = 184), and many others had some college education (n = 102). Slightly over ten percent of the sample reported only having a high school diploma (n = 47), with the remaining reporting only some high school education (n = 4). Annual household income was reported through one of five categories: less than $25,000 (n = 72), $25,000–$44,999 (n = 85), $45,000–$69,999 (n = 80), $70,000–$109,999 (n = 87), and $110,000 or more (n = 76). Employment status varied, with close to half the sample reporting that they were employed full-time (n = 180). Additional employment categories represented in the sample were part-time or casual work (n = 75), self-employed (n = 61), unemployed (n = 57), retired (n = 22), student (n = 22), and other (n = 13).
Social Connectedness Model
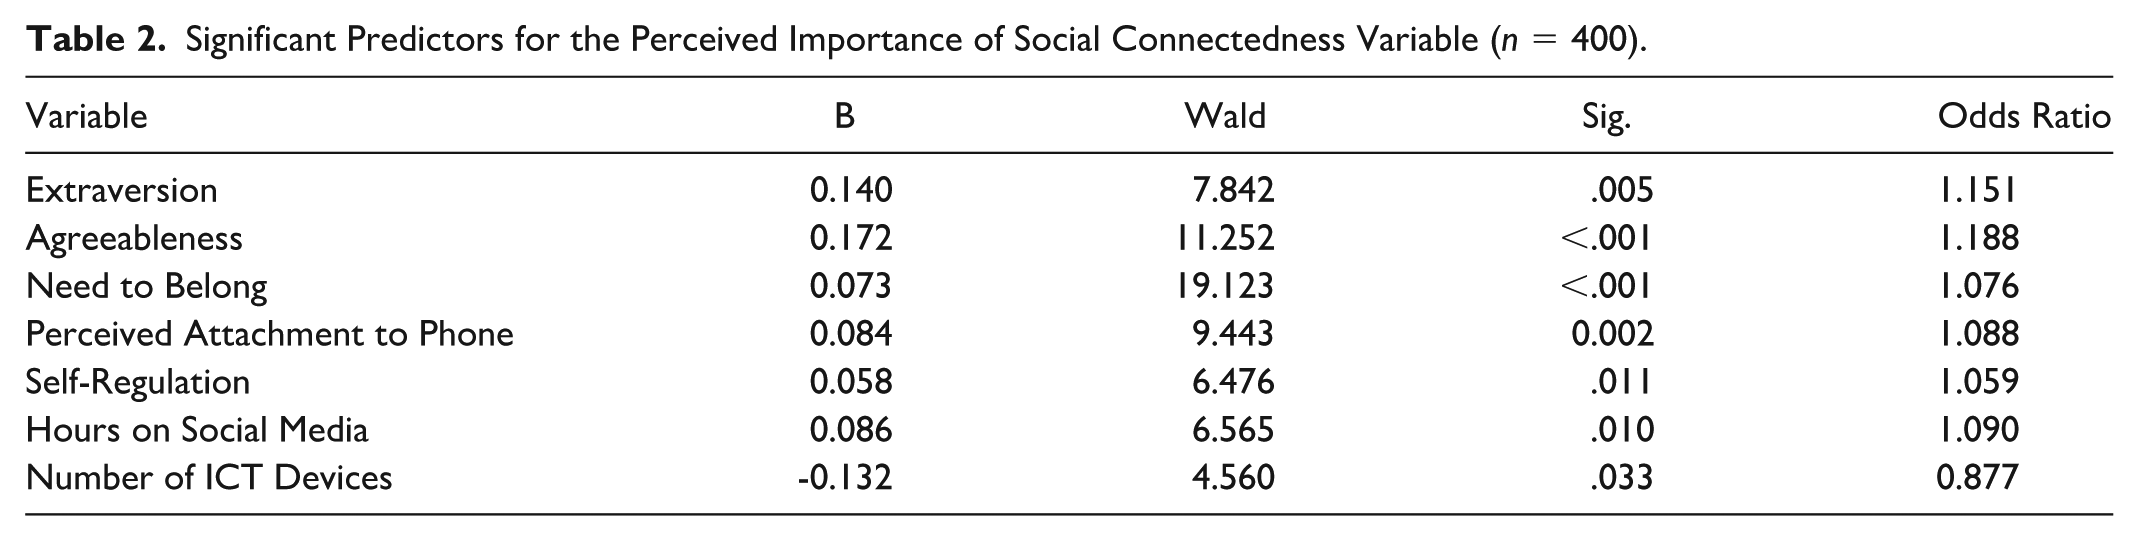
A logistic regression was used to model the relationship between the perceived importance of social connectedness (low vs. high) and the psychosocial, ICT use, and demographic variables. The final model had a Nagelkerke R2 = 0.25, χ2 (391) = 82.51, p < .001. The classification accuracy was 73.33% for predicting low-importance and 11.45% for predicting high-importance, with the overall accuracy being 94.42%. Table 2 shows the logistic regression coefficient, Wald test, and odds ratio for each of the predictors for the importance of the social connectedness variable. Using p < .05 as a threshold, ratings of extraversion, agreeableness, need to belong, perceived attachment to phone, self-regulation, and hours spent on social media had significant positive partial effects with the perceived importance of social connectedness. Participants who rated themselves higher in extraversion, agreeableness, need to belong, self-regulation, and perceived attachments to their phones were significantly more likely to spend more time on social media. Similarly, those who spent more time on social media were also more likely to place high importance on staying socially connected.
Significant Predictors for the Perceived Importance of Social Connectedness Variable (n = 400).
COVID-19 Perception Model
A second logistic regression was used to model the relationship between the perception about the COVID-19 (negative feelings coded as 1) and the psychosocial, and ICT use variables. The final model had a Nagelkerke R2 = 0.56, χ2 (396) = 217.69, p < .001. The overall classification accuracy was 67.75%. Ratings of boredom proneness—lack of internal stimulation and need to belong had significant negative partial effects with the perceptions of COVID-19, suggesting that people with higher ratings on boredom proneness and need to belong were less likely to perceive COVID-19 negatively. Openness from the big five inventory and number of ICT devices used daily had positive partial effects, suggesting that people with higher rating on openness and who used more ICT devices were more likely to rate their perception about COVID-19 negatively.
Visualizations
Figure 1 visually represents how the number of devices used by participants changed between 2020 and 2023. Each section on the left of the diagram represents how many devices participants reported using daily during 2020 while each section on the right represents the same for 2023. The thickness of the line flows between the sections represents the number of participants who transitioned from one level of device usage to another. For example, the thick band connecting During four to After three indicates that a substantial number of participants reported using fewer devices daily compared to during the pandemic.
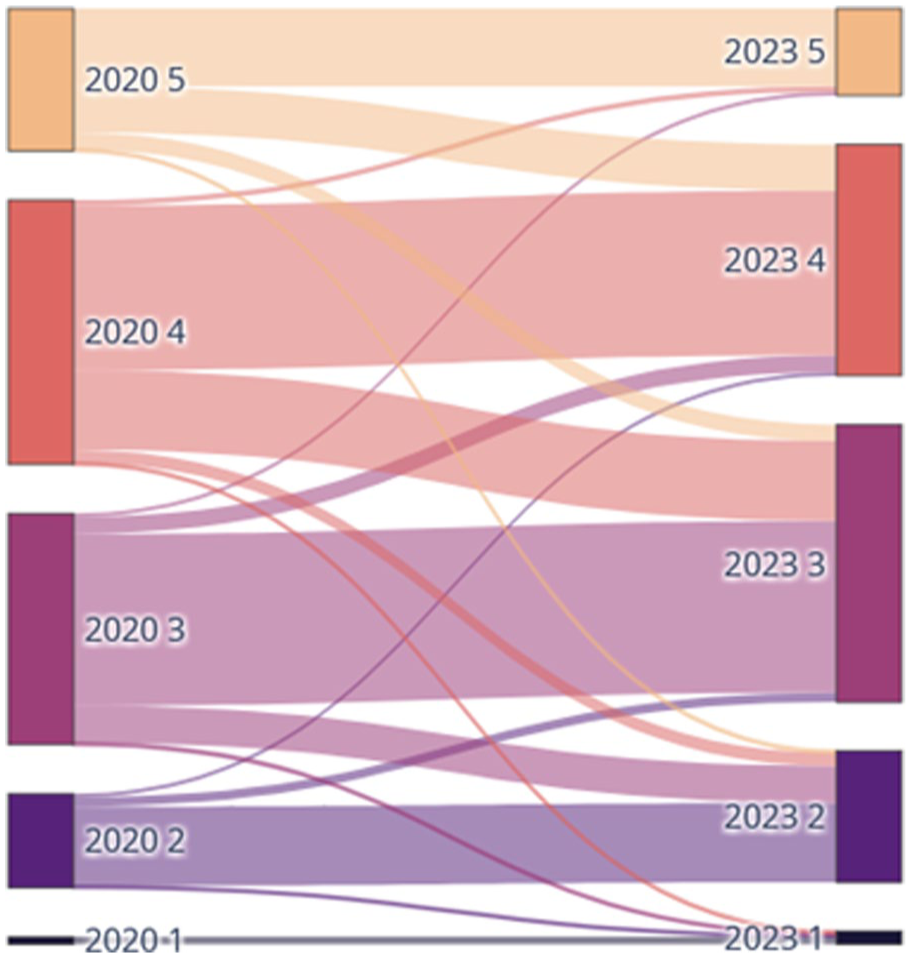
Sankey diagram for change in number of ICT devices used by participants between timepoints.
Discussion
This study explored how psychosocial traits and ICT behaviors were associated with (1) perceptions of social connectedness and (2) perceptions of COVID-19 at the beginning of the post-pandemic period. Findings from the logistic regression were similar to findings from the 2020 dataset (Lee et al., 2021); however, there were also differences between the two datasets, potentially reflecting the societal changes in remote work regulations, status of the pandemic, perceptions of the treatment and management of COVID-19. Past literature demonstrates that there was higher acceptance of technology to support remote work in 2023 with COVID-19 which may explain some of the differences between datasets (Barrero et al., 2023).
Both datasets revealed that levels of certain personality traits were predictive of perceived importance of social connectedness (Lee et al., 2021). In the data collected in 2020, higher levels of extraversion and conscientiousness were found to be predictive of higher levels of perceived social connectedness. In the present study, higher levels of extraversion and agreeableness were found to be significant predictors of perceived importance of social connectedness in 2023. While there is some evidence that the pandemic led to changes in individuals’ personality traits as a result of the pandemic itself, this difference may also be explained by some individuals feeling acutely inclined to maintain social connections as society has adapted to a post-pandemic context (Rudolph & Zacher, 2023; Sutin et al., 2022). The continued predictive value of extraversion as a factor that drives sociable behaviors – possibly even those that are mediated through ICTs like texting and using social media – aligns with Harari et al., 2020, who found that the most extraverted people in a population more frequently engage in behaviors that strengthen social connections. The persisting relationship between extraversion and perceived importance of social connectedness may also represent an enduring adaptation among highly extraverted individuals who may have developed ICT based strategies to maintain, or in some cases even improve, their sense of social connection during the COVID-19 pandemic (Folk et al., 2020). The differences between both datasets and timepoints highlight how certain personality traits can influence the perceived importance of social connectedness across the timeline of COVID-19.
Some factors were found to be negatively associated with perceived importance: notably participants who reported using fewer ICT devices daily were more likely to consider social connectedness important. The negative relationship with ICT device usage may suggest that heavier technology users did not necessarily equate technological engagement with social connectedness. This may be a reflection of different patterns of technology use: individuals using many devices for work or entertainment may not be using them to build or maintain social relationships.
The second regression model revealed that certain psychosocial factors and ICT usage were predictive of whether participants indicated that they still perceived COVID-19 as a threat to their health or safety. The analysis determined that high scores on a measure of boredom proneness were predictive of individuals being less likely to view COVID-19 as a threat which may indicate a reduced capacity to maintain awareness of prolonged stressors like pandemics, thereby reducing the perceived threat. A similar negative relationship was observed with high scores on a measure of the participants’ social need to belong. Individuals with a lower need to belong may engage in fewer in-person social interactions, which may reduce both actual and perceived risk of COVID-19 exposure, therefore lowering their perception of the disease as a threat. Conversely, high scores on openness to new experiences and reports of using greater number of ICT devices daily were associated with a greater likelihood of perceiving COVID-19 as a threat, possibly due to increased exposure to pandemic-related information that heightened their awareness of ongoing risks. Additionally, participants with high levels of social connectedness and extraversion demonstrated more hours spent on social media, which aligns with the study in 2020 (Lee et al., 2021).
Examining differences between the retrospective account and the contemporaneous reporting of the number of ICT devices used daily reveals a pattern of decreasing the number of daily ICT devices used from 2020 to 2023. A similar pattern is demonstrated in past literature: individuals who felt pressured to utilize technology during COVID-19 decreased their ICT usage following the pandemic (Polyakova et al., 2024).
Taken together, these findings reflect how individual differences and ICT behaviors contribute to broader perceptions of the importance of social connectedness and public health risks. Compared to results from 2020 (Lee et al., 2021), the present dataset shows potentially new divergences in the role of ICTs—what may have initially been a compensatory tool for isolation may now function as a filter for risk perception and social prioritization.
Limitations and Future Directions
First, due to the correlational nature of the research design, causal relationships cannot be established between technology usage, psychosocial variables, and outcomes such as perceived social connectedness or perceptions of the COVID-19 threat. Second, the sample was recruited through Prolific, which may have resulted in a biased participant pool that was more educated and technologically literate than the general population. Furthermore, Prolific participants are more likely to be biased in their use of ICT and participation in social media due to increased digital literacy. This may limit the generalizability of the findings to broader or less digitally engaged groups, resulting in an overestimation of ICT usage. This study represents the second wave in a longitudinal effort, with a third wave of data collection planned for 2025. Continued examination of temporal trends in ICT usage and psychosocial variables will contribute to a deeper understanding of the evolving dynamics of post-pandemic life.
Conclusion
This study offers insight into how psychosocial traits and ICT behaviors continue to shape individuals’ perceptions of social connectedness and public health risks in a post-pandemic context. While some findings echoed those observed in 2020, others suggest evolving patterns as societal norms and technology use shift. The predictive roles of personality traits, such as extraversion and agreeableness, and technology-related behaviors, including the number of ICT devices used and time spent on social media, underscore the complex interplay between individual differences and broader sociocultural changes. As this research progresses into its third wave, tracking these dynamics over time will be critical for understanding how people adapt to and navigate life beyond the pandemic.
Footnotes
Funding
The authors received no financial support for the research, authorship, and/or publication of this article.
Declaration of Conflicting Interests
The authors declared no potential conflicts of interest with respect to the research, authorship, and/or publication of this article.