
Abstract
Before it is possible to test whether men and women differ in impulsivity, it is necessary to evaluate whether impulsivity measures are invariant across sex. The UPPS-P Impulsive Behavior Scale (negative urgency, lack of premeditation, lack of perseverance, and sensation seeking, with added subscale of positive urgency) is one measure of five dispositions toward rash action that has shown to have robust and clinically useful relationships among risk-taking outcomes. In the current research, the author examined (a) the psychometric measurement invariance of the UPPS-P across sex, (b) the scale’s structural invariance across sex, and (c) whether the five impulsivity traits differentially relate to risk outcomes as a function of sex. In a sample of 1,372 undergraduates, the author found evidence for measurement and invariance across sex: Thus, comparisons of men and women on the UPPS-P can be considered valid. Additionally, although males tend to report higher levels of sensation seeking and positive urgency (and possibly lack of perseverance), the relationships between the UPPS-P traits and risk outcomes were generally invariant across sex. The UPPS-P appears to function comparably across males and females, and mean differences on this scale between the sexes can be thought to reflect trait-level differences.
Keywords
The UPPS-P Impulsive Behavior Scale (Lynam, Smith, Cyders, Fischer, & Whiteside, 2007) is a multifaceted scale of five dispositions to rash action: sensation seeking, lack of deliberation, lack of perseverance, negative urgency, and positive urgency. The overall scale, as well as its components, has shown validity evidence in multiple populations including undergraduate and young adult populations (see Cyders et al., 2007; Cyders & Smith, 2007; Magid & Colder, 2007; Whiteside & Lynam, 2001), clinical samples (Claes, Vandereycken, & Vertommen, 2005; Cyders et al., 2007; Fischer, Smith, Annus, & Hendricks, 2007, Jacob et al., 2010; Mobbs, Crepin, Thiery, Golay, & Van der Linden, 2010; Verdejo-García, Lozano, Moya, Alcázar, & Pérez-García, 2010; Whiteside, Lynam, Miller, & Reynolds, 2005), and adolescent/child samples (D’Acremont & Van der Linden, 2005; Gunn & Smith, 2010; Van der Linden et al., 2006; Zapolski, Stairs, Settles, Combs, & Smith, 2010). However, little research to date has examined measurement invariance and between-group differences of the scale across males and females. The UPPS-P traits cannot be validly compared across the sexes without first establishing the measurement invariance of this measure across sex. The goals of this article are threefold: (a) to examine psychometric measurement invariance of the UPPS-P across sex, (b) to examine the scale’s structural invariance across sex, and (c) to test whether the five impulsivity-related traits differentially relate to risk outcomes, as predicted by sex.
Sex Differences in Impulsivity
The research literature on impulsivity has long acknowledged that sex differences in impulsivity exist, although few studies have addressed these differences systematically, choosing, instead, to examine the role of impulsivity in risk taking after controlling for the effects of sex. In general, it is usually recognized that males show higher levels of impulsivity, which is often associated with increased use of alcohol, nicotine, and caffeine (Waldeck & Miller, 1997), although this assumption does not always hold true. Costa, Terracciano, and McCrae (2001) found, using the NEO Personality Inventory–Revised (NEO-PI-R; a measure of Extraversion, Agreeableness, Conscientiousness, Neu-roticism, and Openness to Experience; Costa & McCrae, 1992), that men tend to be higher in excitement seeking (which is related to the sensation-seeking facet on the UPPS-P), whereas women scored higher on the impulsiveness facet (which is related to the negative urgency trait on the UPPS-P). No significant sex differences were found for self-discipline and deliberation facets (thought to be related to the lack of perseverance and lack of deliberation facets of the UPPS-P; Costa et al., 2001). Additional studies have failed to find significant differences between males and females on impulsivity (e.g., Patton, Stanford, & Barratt, 1995), including no meta-analytic effect size differences on the impulsiveness facet of the NEO-PI-R (Feingold, 1994). However, some evidence suggests that females make more effective use of delay of gratification than males and that this use is more advantageous in the long run (Silverman, 2003).
Reasons for sex differences in personality in general have mostly centered on biological, sociocultural, and biosocial models for sex differences (see Feingold, 1994, for a general discussion on sex differences in personality). Biological bases of sex differences suggest chromosomal differences between males and females that relate to differences in behavioral impulsive tendencies, sociocultural bases suggest that these differences are related more to social or cultural factors that form or condition these traits differentially in males and females, whereas biosocial bases suggest that biological and sociocultural influences interact to produce sex differences in personality (see Feingold, 1994, for a full discussion). Thus, much interest has existed in sex differences in impulsivity and the underlying mechanisms for these differences. It is important to determine whether or not males and females differ in their levels of impulsivity as it could shed light on mechanistic and risk factor differences between males and females, which could ultimately lead to more specific and effective treatment and prevention strategies.
Specific to impulsivity, some research has supported these underlying bases, whereas others have not. Some biological bases of impulsivity differences have been found. For instance, researchers have posited that these differences could be tied to higher binding capacity of 5HT(2) receptor in men than in women (Biver et al., 1996), which is related to increased impulsive action (Walderhaug et al., 2007), but this finding is not universally accepted. Other studies have failed to support differential roles of the interaction between biological and sociocultural effects for males and females in the development of impulsivity traits (e.g., Gunn & Smith, 2010). Notably, a recent study by Carver, Johnson, Joormann, Kim, and Nam (2011) found that the serotonin transporter polymorphism interacts with childhood adversity to predict increased levels of positive and negative urgency, regardless of sex.
A recent meta-analysis has once again brought to the forefront the issue of whether or not males and females exhibit different levels of impulsivity across multiple self-report and behavioral measures of impulsivity (Cross, Copping, & Campbell, 2011). Findings from 277 studies that included both an impulsivity measure and a measurement of participant sex indicate that men show higher levels of sensation seeking and behavioral risk taking, whereas women exhibit more punishment sensitivity; however, there was heterogeneity among the effect sizes found across studies (Cross et al., 2011). One reason for these inconsistent findings could be related to an unclear definition of what is meant by the term impulsivity. Research with sex differences using the UPPS-P traits could help clarify these discrepancies and add clarity to potential differential prediction of outcomes by sex. Additionally, one major limitation of this meta-analysis was the lack of establishment of measurement invariance across sex on the studied measures prior to the examination of group differences, thus questioning the meaningfulness of these findings. Therefore, the current study seeks to do these two things with one well-validated measure of impulsivity, the UPPS-P.
Measurement Invariance and Structural Invariance
Measurement invariance is determined to exist between two groups if the trait scores between the two groups are comparable and have the same meaning across the groups—in other words, whether or not the measure assesses the same trait in the same way across groups (Reise, Widaman, & Pugh, 1993). Until it is determined that a measure assesses the same trait across two separate groups, comparisons across the two groups on the measure have uncertain meaning (see Drasgow, 1984, 1987; Meade & Lautenschlager, 2004.). Methods to determine measurement invariance below are discussed below. However, if it is found that the measure is not invariant across groups, then comparisons between the two groups (e.g., on mean differences) are not meaningful, because group differences could be because of the different performance of the measure in the two groups (Reise et al., 1993; Windle, Iwawaki, & Lerner, 1998). Interestingly, despite considerable interest in possible sex differences in impulsivity traits, there has been little appreciation of the importance that measurement invariance plays in attempt to evaluate possible sex differences. Thus, although findings seem to suggest group differences on some aspects of impulsivity (see Cross et al., 2011), it is not clear whether these differences are because of actual trait-level differences or because of noninvariance of the psychometric properties measured.
To examine measurement invariance of a scale, multiple statistical tests and methods have been proposed. This procedure has been discussed in length elsewhere (see Byrne & Shavelson, 1987; Byrne & Watkins, 2003; Cheung & Rensvold, 2002; Drasgow, 1984, 1987; Hoyle & Smith, 1994; Meredith, 1993); here, I briefly outline the general procedures and hypotheses. One examines a series of increasingly stringent hypotheses of invariance, using either confirmatory factor analysis (CFA; e.g., in a structural equation modeling framework; Joreskog, 1971) or through item response theory (IRT; Lord, 1980). 1 Measurement-level invariance is determined through the examination of the following aspects of measurement across the groups: (a) invariance of factor structure across groups (configural invariance), (b) invariance of factor loadings across groups (metric or “weak” factorial invariance), and (c) invariance of intercepts across groups (scalar or “strong” invariance; see Byrne, Shavelson, & Muthén, 1989; Cheung & Rensvold, 2002).
After the determination of measurement invariance, structural invariance is assessed. Structural invariance concerns whether or not the two groups differ in their distribution and/or mean. If measurement invariance holds, structural differences can be thought to be real and interpretable group differences. Structural invariance is determined by examining the following aspects of measurement across groups: (a) factor variance invariance and (b) factor mean invariance (see Chueng & Rensvold, 2002). Structural invariance cannot be adequately assessed until measurement invariance has been shown.
Little has been published about the measurement invariance of any impulsivity-related measures, including the UPPS-P. To date, some research has examined configural invariance and structural (mean) invariance of the UPPS-P, and this research will be reviewed next.
Configural Invariance: Evidence for the Existing Factor Structure of the UPPS-P Scale
The UPPS-P Impulsive Behavior Scale (Lynam et al., 2007) is a five-factor measure of dispositions toward rash action. Early results with the UPPS-R Impulsive Behavior Scale (which did not include positive urgency; Whiteside & Lynam, 2001) found that four separate, though related, first-order factors loaded on three different factors of the five-factor model: lack of deliberation and lack of perseverance loaded negatively onto a factor that included NEO-PI-R Conscientious facets, sensation seeking loaded with NEO-PI-R facets measuring Extraversion, and (negative) urgency loaded onto NEO-PI-R facets measuring Neuroticism (Whiteside & Lynam, 2001). Additional studies have supported four separate first-order factors in both undergraduate and adolescent samples (D’Acremont & Van der Linden, 2005; Van der Linden et al., 2006; Magid & Colder, 2007; Smith et al., 2007; Whiteside et al., 2005; Whiteside & Lynam, 2003), sometimes with a higher order domain related to deficits in conscientiousness (as in Smith et al., 2007). When the UPPS-R was expanded to include the Positive Urgency Measure (PUM; from Cyders et al., 2007) and was renamed the UPPS-P (Lynam et al., 2007), factor analyses supported the presence of five separate, though related, first-order factors in undergraduates (Cyders & Smith, 2007) and young adolescents (Gunn & Smith, 2010), with three higher order factors: an overall deficit in conscientiousness factor (lack of deliberation and lack of perseverance as subfactors), a sensation-seeking factor, and an urgency factor (with positive urgency and negative urgency as subfactors).
In general, there is consensus that the UPPS-P measures five separate, though related, dispositions toward rash action that are best understood as represented by three second-order factors: lack of conscientiousness, sensation seeking, and emotion-based dispositions (Cyders & Smith, 2007). However, research has yet to determine whether or not this factor structure is invariant between males and females, despite a large interest in how impulsivity traits might differ between males and females, as discussed above. Therefore, this analysis will test the invariance of this five-factor measure with three second-order factors across males and females for configural invariance, as a first step of the examination of measurement invariance across these groups.
Structural (Mean) Invariance: Sex Differences on the UPPS-P Traits
Research that has examined sex differences in impulsivity using the UPPS-R or the UPPS-P has offered some clarification on the heterogeneity of sex differences findings that have been found in the literature (e.g., Cross et al., 2011). This research makes it is clear that sex differences in impulsivity depend on the specific disposition toward rash action that is measured. In general, males self-report higher levels of sensation seeking (correlation between sex and sensation seeking: r = 0.33, p < .001, in D’Acremont & Van der Linden, 2005; r = 0.25, p < .001, and r = 0.24, p < .001, for a questionnaire and interview version, respectively, in Cyders & Smith, 2007), whereas there are no sex differences in self-reported lack of deliberation (r = 0.04, p = .33, for D’Acremont & Van der Linden, 2005; r = −0.04, p = .46, and r = 0.40, p = .58, for a questionnaire and interview version, respectively, in Cyders & Smith, 2007) or lack of perseverance (r = 0.00, p = .99, for D’Acremont & Van der Linden, 2005; r = −0.07, p = .19, and r = 0.00, p = .98, for a questionnaire and interview version, respectively, in Cyders & Smith, 2007). The picture of negative urgency is less clear. Although some research has supported higher rates of negative urgency among females (r = −0.14, p < .001, in D’Acremont & Van der Linden, 2005), other research has found mixed support for this relationship (r = −0.03, p = .95, and r = −0.15, p < .05, for a questionnaire and interview version, respectively, in Cyders & Smith, 2007). To date, only one study has addressed whether or not sex differences in positive urgency exist; this study reported no sex differences in positive urgency (r = 0.06, p = .27, and r = −0.12, p < .88, for a questionnaire and interview version, respectively, in Cyders & Smith, 2007).
Differential Prediction of Outcomes by Sex
Miller, Flory, Lynam, and Leukefeld (2003) were interested in how the relationship between impulsivity traits and risk taking might be modified by sex. They demonstrated differential correlations between the UPPS-R facets and risk outcomes between males and females for the following relationships: urgency and the variety of conduct problems (males, r = 0.31, p < .001; females, r = 0.25, p < .001) and borderline symptoms (males, r = 0.08, p = n.s.; females, r = 0.34, p < .001); sensation seeking with borderline symptoms (males, r = −0.11, p = n.s.; females, r = 0.08, p = n.s.); lack of perseverance with crime and delinquency (males, r = 0.26, p < .001; females, r = 0.46 p < .001), alcohol use (males, r = −0.06, p = n.s.; females, r = 0.26, p < .001), number of sexual partners (males, r = −0.07, p = n.s.; females, r = 0.15, p < .05), and age of sexual debut (males, r = 0.17, p < .05; females, r = −0.12, p = n.s.); lack of deliberation and crime and delinquency (males, r = 0.32, p < .001; females, r = 0.52, p < .001).
In general, there is high interest in how males and females might differ in impulsivity and the implications of such possible differences. However, this research is premature and has begun to examine construct-level invariance before first establishing measurement invariance on assessment procedures. To be clearer, one explanation for sex differences in impulsivity could be that males and females have different levels of impulsivity traits; this hypothesis has mixed support in the literature. An alternative explanation is that the items on the UPPS-P are answered differently by males and females or that the items translate into different levels of the trait at various response levels (both questions of measurement invariance across the groups). Therefore, one cannot answer questions concerning group differences or differential prediction of a trait without first examining measurement invariance across the groups, both at the scale and individual item levels.
The Current Study
Given the high interest in impulsivity group differences between males and females and the coexisting paucity of research examining measurement invariance in impulsivity across males and females, the current study seeks to examine both measurement invariance and construct invariance of one well-validated measure of impulsivity, the UPPS-P, across males and females. This study used a CFA in structural equation modeling in MPlus (Asparouhov & Muthén, 2009), examining for psychometric measurement invariance by testing the following: the examination of (a) invariance of factor structure across groups (configural invariance), (b) invariance of factor loadings across groups (metric or “weak” factorial invariance), and (c) invariance of thresholds across groups (scalar or “strong” invariance; see Byrne et al., 1989; Cheung & Rensvold, 2002). After the determination of measurement invariance across groups as described above, structural invariance was assessed, by examining the following: (a) factor variance invariance and (b) factor mean invariance (see Chueng & Rensvold, 2002). Finally, relationships between the UPPS-P traits and outcome criteria traditionally of interest in impulsivity research for invariance in these predictor–outcome relationships were examined for differential prediction.
Method
Participants
Data for these analyses were combined from participants from three previously reported studies (see Cyders et al., 2010; Cyders, Flory, Rainer, & Smith, 2009; Cyders & Smith, 2010). A total of 1,372 undergraduate students from a Midwestern university who completed the UPPS-P alone or the combination of the UPPS-R and the PUM were considered for the current study. Of these individuals, 98 did not indicate their sex and thus were excluded from analyses, resulting in a total sample of 1,274 participants. Participants in these studies were compensated through course credit and/or through payment ($10 per session). The final sample included 827 females (64.9%) and 447 males (35.1%).
Measures
The UPPS-P
The UPPS-P (Lynam et al., 2007) is a 59-item scale designed to assess lack of deliberation, lack of perseverance, negative urgency, positive urgency, and sensation seeking. Items are assessed from 1 (agree strongly) to 4 (disagree strongly). The five scales have good convergent validity across assessment method, good discriminant validity within assessment method and different external correlates (see Cyders & Smith, 2007; Smith et al., 2007). The UPPS-P is a combination of the UPPS-R (Whiteside & Lynam, 2001) and the PUM (Cyders et al., 2007). Initial estimates of internal consistency reliability for the UPPS-R and the PUM indicate that each scale has an internal consistency greater than .80. In the current sample, the internal consistency coefficients indicated unidimensionality: positive urgency (.94), negative urgency (.89), sensation seeking (.85), lack of deliberation (.83), and lack of perseverance (.82).
The Drinking Styles Questionnaire
The Drinking Styles Questionnaire (Smith, McCarthy, & Goldman, 1995) gathers information about an individual’s alcohol use. This scale provides information about an individual’s frequency of alcohol use (e.g., from I have never had a drink of alcohol to I drink alcohol almost daily), quantity of alcohol use (e.g., from I don’t drink alcohol at all to I usually drink a lot of alcohol [more than nine beers or drinks] on any given occasion), and extreme problems associated with alcohol use (e.g., experiencing blackouts, having trouble with the law because of drinking, committing illegal acts while intoxicated, etc.). The negative outcome composite scale includes 10 items that individuals may experience as negative outcomes from drinking alcohol, each rated on a dichotomous “yes/no” scale. Drinking quantity and drinking frequency were correlated r = .87, p < .001, in the current sample. Drinking quantity (r = 0.47, p < .001) and drinking frequency (r = 0.38, p < .001) were correlated with drinking problems in the current sample.
The Mood-Based Questionnaire
The Mood-Based Questionnaire (MBQ; Cyders & Smith, 2007) is a 14-item scale designed to measure, both quantitatively and qualitatively, an individual’s self-reported participation in risky behaviors during both a positive and a negative mood state. The MBQ asks participants to report on their experiences of being in an unusually positive mood and then check off which of 27 risky behaviors they have engaged in while being in a very positive mood. Items include the following: drank alcohol, used drugs, got arrested, broke the law, had sexual intercourse with an unfamiliar person, drove a car while intoxicated, drove very fast, vandalized property, started a fight, and so on. The measure separately asks participants to report on their experiences of being in an unusually bad mood. Participants then check off which of the same 27 behaviors they have engaged in while being in a very negative mood. In the developmental sample, the scale was shown to be both internally consistent (α = .84 for positive mood-based risky behaviors; for negative mood–based risky behaviors, α = .82). The two scales were highly correlated, r = 0.64, in that sample. In the current sample, the values were similar (α = .87 for positive mood–based risky behaviors; for negative mood-based risky behaviors, α = .88; the scales were correlated r = 0.71 (p < .001); however, it is important to note that a portion of the sample used in the current study was included in the developmental sample).
The Risky Behavior Questionnaire
The Risky Behavior Questionnaire (Fischer & Smith, 2004) is an 83-item scale that assesses the frequency with which individuals participate in a wide range of risk-taking behaviors. Items were coded on a 5-point Likert-type scale, with 1 indicating never participating in the behavior and 5 indicating often participating in the activity. The average score on the items was used to index general risk-taking in the current study. Participants reported an overall average of 2.89 (SD = 0.33) on the scale, indicating that they “sometimes” participated in these behaviors. Internal consistency was adequate (α = .92 in the current sample).
Procedures
Participants in each of the three studies completed either the UPPS-P or both the UPPS-R and the PUM via a self-report anonymous questionnaire as part of a larger battery of questionnaires. All data were coded with a number and names were not linked to their responses. Individuals with missing data did not differ from those who did not have missing data on any study variable; we therefore concluded that data were missing at random and imputed missing data using the expectation maximization procedure (Enders, 2006). Monte Carlo studies have compared traditional means of handling missing data and have found that expectation maximization procedures produce less biased estimates of full sample values (Enders, 2006). As noted above, study hypotheses were conducted in an incremental fashion, starting with hypotheses related to measurement invariance and following with questions related to structural invariance.
Results
Measurement Invariance Across Sex
To examine the incremental measurement invariance hypotheses, as presented earlier, a CFA approach in structural equation modeling was conducted with MPlus 5.2.1 (Asparouhov & Muthén, 2009). Weighted least squares mean- and variance-adjusted estimation was used, as the UPPS-P items are ordered categorical data. The following fit indices for the analyses are reported: the comparative fix index (CFI; Bentler, 1990), the Tucker–Lewis index (TLI; Tucker & Lewis, 1973), and the root mean square error of approximation (RMSEA; Browne & Cudeck, 1993). Guidelines for what constitutes a good fit vary, although a CFI greater than either .90 or .95, a TLI equal to or greater than .96, and an RMSEA equal to or less than .06 are thought to represent good fit for categorical data (Schreiber, Stage, King, Nora, & Barlow, 2006). Women served as the reference group in all invariance models.
Configural invariance
A hierarchical three-factor model of the UPPS-P was examined for configural invariance, separately in males and females. Individual items were used as indicators of latent factor variables, and all latent variables were allowed to intercorrelate. Reverse-coded items were allowed to have correlated error residuals. Factor loadings and item thresholds were freely estimated in both groups. Item residual variances were fixed to 1 and factor means were set to 0. Factor variance was fixed to 1 for identification. This model served as the baseline configural model for subsequent analyses. Overall, this hierarchical model fit the data well, although not ideally: χ2(df = 241) = 2531.55, p < .001; CFI = .86; TLI = .96; RMSEA = .11.
When tested separately, the model fit similarly for males and females: χ2(df = 187) = 2113.20, p < .001; CFI = .83; TLI = .96; RMSEA = .10 for females; and χ2(df = 40) = 7238.14, p < .001; CFI = .85; TLI = .95; RMSEA = .12 for males. Although the CFI had slightly better fit for males than females, the RMSEA showed the opposite pattern, and since the TLI was unchanged between the groups, it was determined that, relatively speaking, the models fit equally well in each group. Additionally, estimates between the two groups were did not appear to be markedly different. Thus, there was sufficient evidence to support configural invariance across males and females, despite the overall slightly lower than ideal fit with the CFI and the RMSEA fit indices.
Of note is that the use of parcels with this model significantly improved the fit of the model, especially pertaining to the CFI and the RMSEA, χ2(df = 160) = 661.49, p < .001, CFI = .95, TLI = .94, RMSEA = .06 for females; and χ2(df = 160) = 473.99, p < .001, CFI = .94, TLI = .93, RMSEA = .07 for males, thus replicating the support of this model in previous studies, many of which also used parceling, 2 and to exhibit the effect of the number of individual item indicators of fit indices (although much of this support has been within maximum likelihood estimation; see Cook, Kallen, & Antmann, 2009; Kenny & McCoach, 2003; Marsh, Hau, Balla, & Grayson, 1998); however, individual items were retained for invariance testing in the current study because of the controversial nature of parceling and for the clear clinical utility of examining the individual items for measurement invariance analyses. Additionally, although the fit of this overall model was not optimal and was likely deflated, due, in part, to the use of individual item indicators, the goal of invariance testing is to test change in model fit with increasing constraints, and thus modification indices that suggested cross-loadings of items were examined but were not retained in the final model because (a) individual sample modification indices are likely not to be robust (MacCallum, Roznowski, & Necowitz, 1992) and (b) when they were applied to the model in an exploratory analysis, CFI model fit improved, but only slightly, whereas RMSEA model fit decreased. Finally, given the large sample size of the current study, more weight was placed on the fit of the TLI, which appears to be relatively independent of sample size (although this is better established in the maximum likelihood estimation framework; see Marsh et al., 1998). Therefore, it was determined that the application of these modification indices would introduce more uncertainty to the model with very little benefit to the overall fit indices, especially within the context of a well-fitting TLI value.
Thus, a series of model constraints were then applied to the baseline model, which used individual item indicators, in a successive fashion to examine potential decreases in fit resulting from lack of measurement or structural invariance. Fit indices for this model and for the models tested in the remaining measurement invariance hypotheses are presented in Table 1. The ΔCFI test was used to evaluate fit changes with increasing constraints, using a criterion of ΔCFI < .01 to indicate no significant reduction of fit, as suggested by Cheung and Rensvold (2002).
Measurement Invariance Summary Fit Statistics
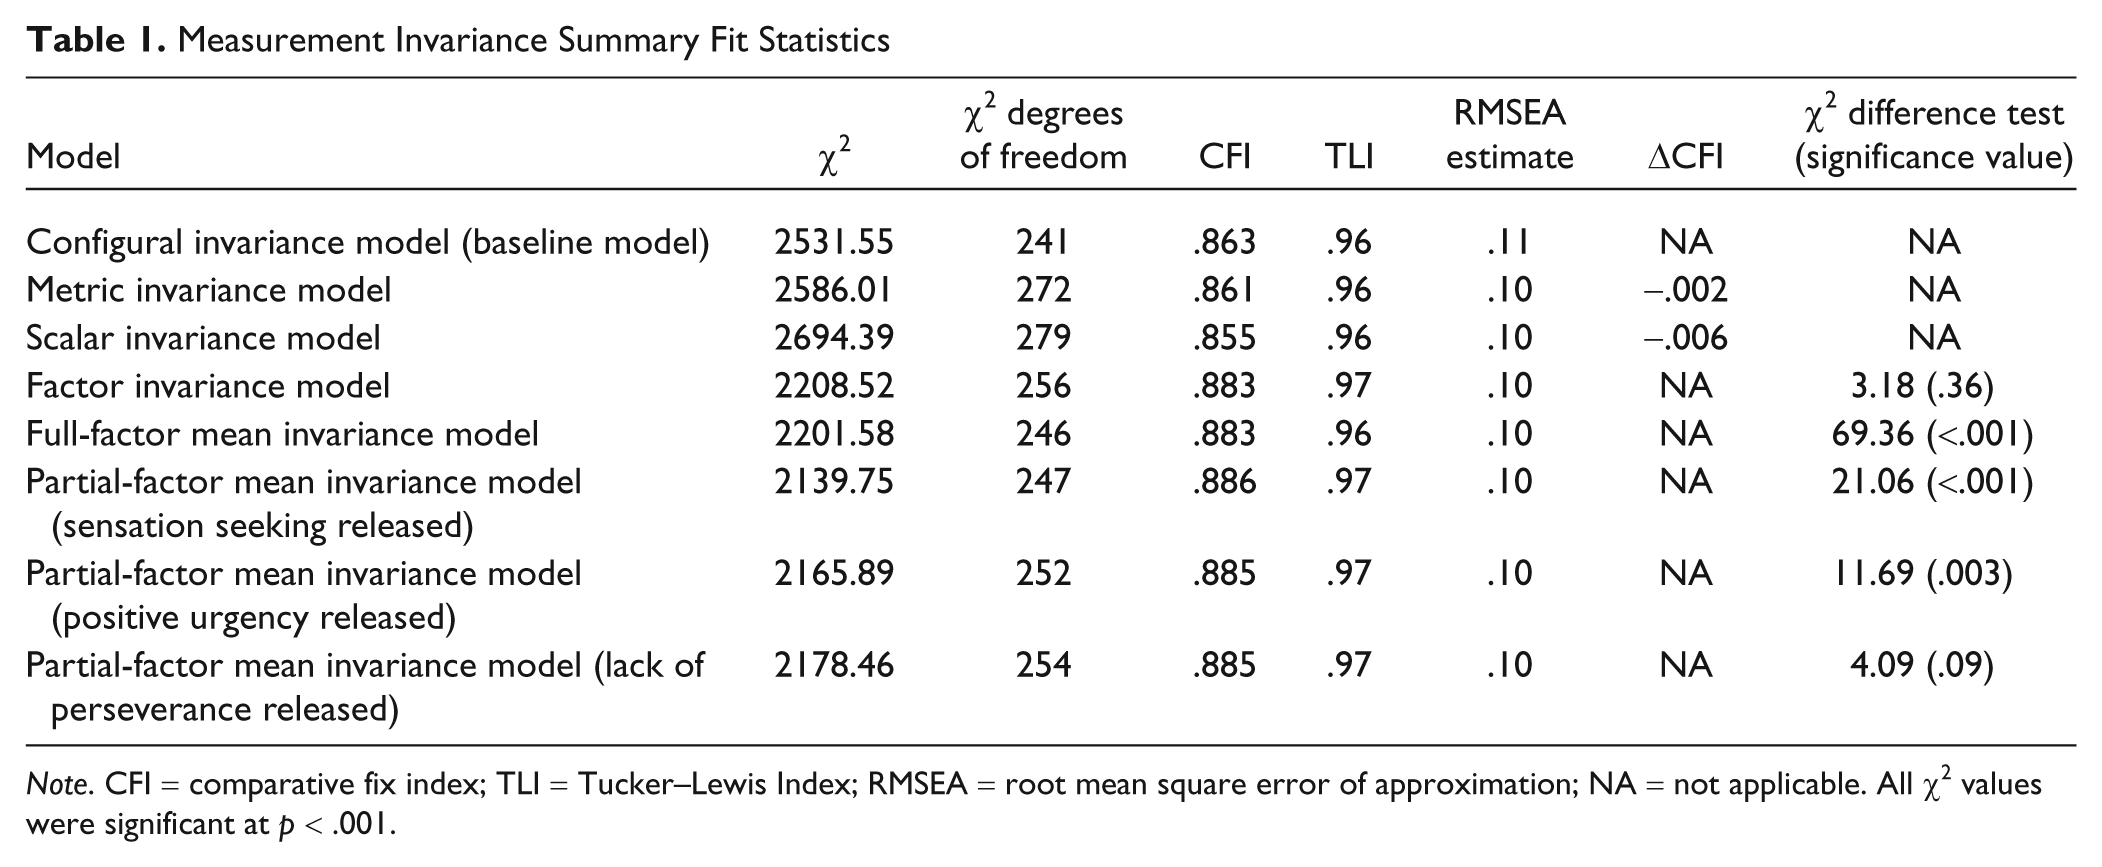
Note. CFI = comparative fix index; TLI = Tucker–Lewis Index; RMSEA = root mean square error of approximation; NA = not applicable. All χ2 values were significant at p < .001.
Metric invariance
Equality of the unstandardized item factor loadings across groups was then examined in a metric invariance model in which the factor loadings were estimated freely in women but were in men set to equal the freely estimated parameters from the women. Individual items were used as indicators. The factor variance was fixed to 1 in women but was freely estimated in men, and the factor means were fixed to 0 in both groups. Residual variances were freely estimated in each group. The metric invariance model did not result in significantly decreased fit as compared with the configural invariance model (see Table 1), ΔCFI < .01. The fact that metric invariance held indicates that the items related to the latent factor equivalently across groups or, more simply, that the same latent factor was being measured in each group.
Scalar invariance
Equality of the unstandardized item thresholds across groups was then examined in a scalar invariance model. The factor variances and means were fixed at 1 and 0, respectively, for identification in the women, but the factor variance and mean were then estimated in the men. All factor loadings and item intercepts were freely estimated in females but constrained to be equal to females in the male group; all residual variances were still freely estimated in both groups. The scalar invariance did result in a significantly decreased fit of the model over the metric invariance model (see Table 1), ΔCFI < .01. This finding suggests a lack of response bias between the groups and allows comparisons of factor means across groups to be made.
Structural Invariance Across Sex
Thus, since measurement invariance was found to hold between males and females, a series of tests was conducted to examine the structural invariance of the UPPS-P between males and females. To compare these latent parameters, a chi-square difference test (Δχ2) was examined.
Factor variance invariance
The equality of factor variances was now examined in a model in which factor variances were set to be equal across groups. Factor means were set to 0 in women but were allowed to be freely estimated in the male group. This constraint did not significantly lower the fit of the model (see Table 1), Δχ2 = 3.18, df = 3, p = .36. This finding supports factor variance invariance across sex.
Factor mean invariance
Next, the equality of factor means across groups was tested by constraining the factor means to be equal across groups. This model did have a significantly lower fit than the previous model (see Table 1), Δχ2 = 69.36, df = 3, p < .001. Therefore, factor means were released singularly, and change in fit was reevaluated. Modification indices suggested that releasing factor mean for sensation seeking still resulted in a significantly worse fit (Δχ2 = 21.06, df = 2, p < .001). Modification indices next suggested releasing the mean of positive urgency; this also resulted in a significant chi-square difference test (Δχ2 = 11.67, df = 2, p = .003). Modification indices next suggested releasing lack of perseverance; this resulted in a nonsignificant chi-square difference test (Δχ2 = 4.09, df = 2, p = .09). Independent sample t tests somewhat supported this finding, showing that in a subset of the participants, males report significantly higher levels of positive urgency and sensation seeking than females (see Table 2). Although nonsignificant, the difference between males and females on lack of perseverance was trending toward higher levels in males (see Table 2).
Mean Levels and t Tests for Impulsivity Traits by Males and Females
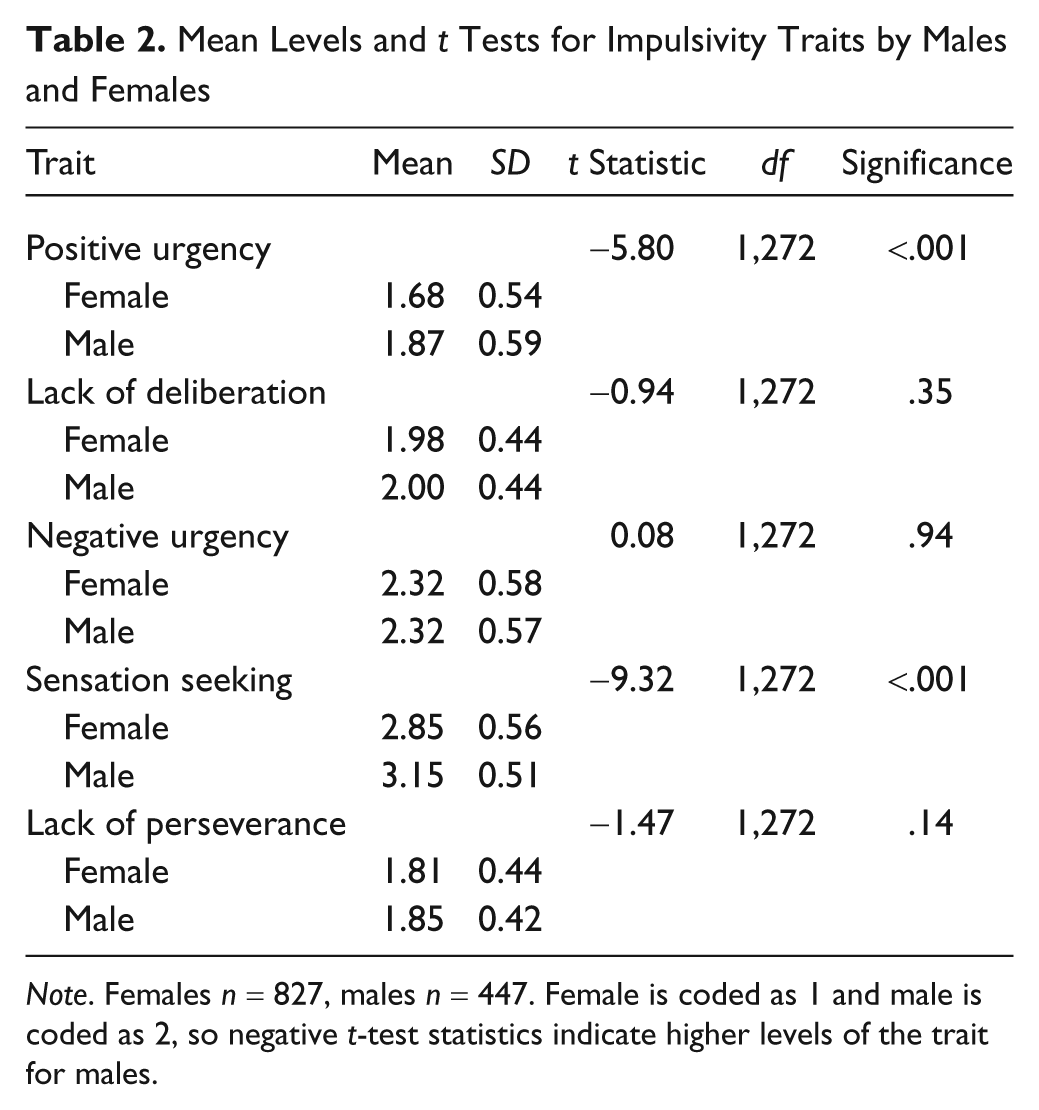
Note. Females n = 827, males n = 447. Female is coded as 1 and male is coded as 2, so negative t-test statistics indicate higher levels of the trait for males.
Differential Relationships of Impulsivity Traits to External Outcomes by Sex
Given the findings of full measurement invariance and higher rates of positive urgency and sensation seeking in males (and potentially lack of perseverance), differential prediction of the impulsivity traits by sex was next examined, using a subset of the overall sample to analyze how the impulsivity traits might be differentially related to risk outcomes, by sex.
First, using a subsample of n = 418 participants, we examined the relationships among the impulsivity traits and (a) drinking frequency, (b) drinking quantity, (c) drinking problems, (d) positive emotion–based risk taking, (e) negative emotion–based risk taking, and (f) general risk taking. This subsample consisted of first-year college students, with a mean age of 18.52 (SD = 8.08). In all, 25% (n = 105) of the sample was male. A total of 88% percent of the sample was European American (n = 368), 8% African American (n = 35), and 4% was of another race (n = 15).
Correlations among the impulsivity traits and sex in this sample are presented in Table 3. Overall, correlations among the impulsivity traits replicated previous findings and ranged from r = 0.62 (between negative urgency and positive urgency) to r = −0.11 (between lack of perseverance and sensation seeking). Sex was significantly correlated with sensation seeking (r = 0.18, p < .001), lack of perseverance (r = 0.14, p < .01), and positive urgency (r = 0.15, p < .01).
Bivariate Correlations of Study Variables (n = 1,274)
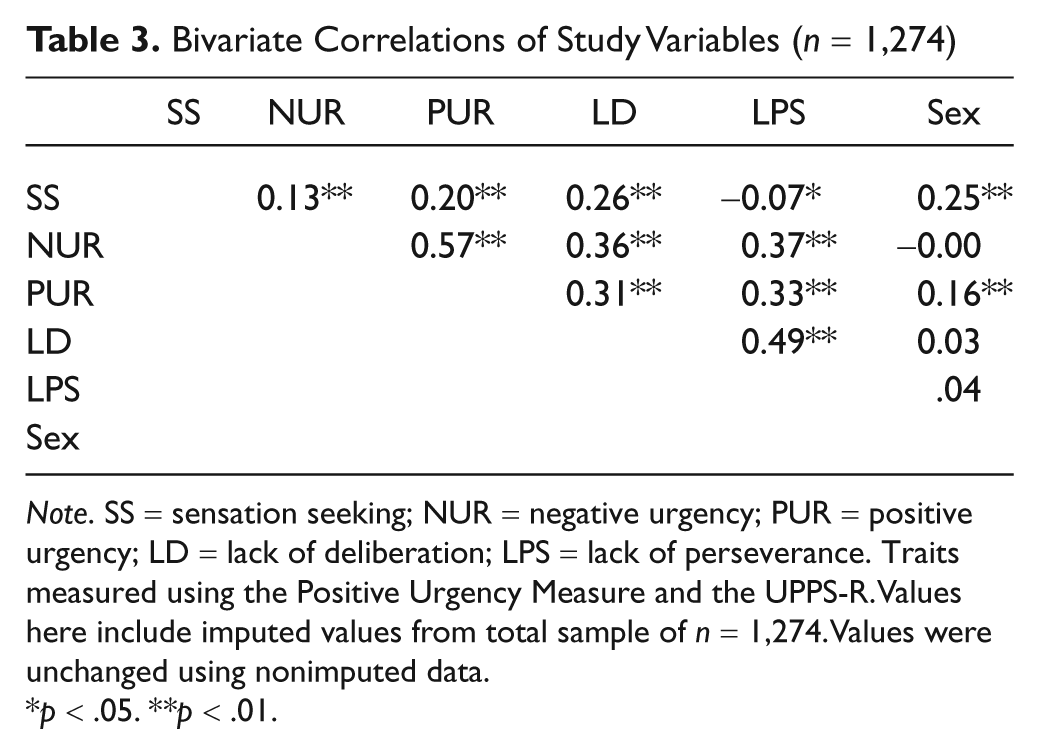
Note. SS = sensation seeking; NUR = negative urgency; PUR = positive urgency; LD = lack of deliberation; LPS = lack of perseverance. Traits measured using the Positive Urgency Measure and the UPPS-R. Values here include imputed values from total sample of n = 1,274. Values were unchanged using nonimputed data.
p < .05. **p < .01.
Correlations among the impulsivity traits and the risk outcomes by sex, for the subset of the total sample, are presented in Table 4. A series of z tests were performed comparing the correlations among the traits and risk outcomes between males and females (see Table 5). Overall, results indicate that, for the variables measured, the relationships between the self-reported traits and the risk outcomes did not differ by sex, with one exception: There was a significant difference between lack of deliberation and general risk taking (z = −2.27, p = .02). Additionally, these correlations appear to support the convergent and discriminant validity of the impulsivity traits, replicating previously reported correlational patterns. For example, as previously reported, sensation seeking, negative urgency, and positive urgency all related to drinking quantity (see Cyders et al., 2009), whereas lack of perseverance and lack of deliberation were unrelated. All impulsivity traits were significantly related to drinking frequency and drinking problems, which does replicate other findings, although other research focusing on the incremental utility of these traits suggests that specificity of prediction occurs not at the bivariate level but at the incremental level, which controls for the effects of the other traits (see Cyders et al., 2009, for an example of this). As found in other studies, positive mood and negative mood–based rash action was bivariately related to all the traits, although other research has found specificity in incremental validity (e.g., Cyders & Smith, 2010).
Correlations Among the Impulsivity Traits and Sex in Sample Subset (n = 418)
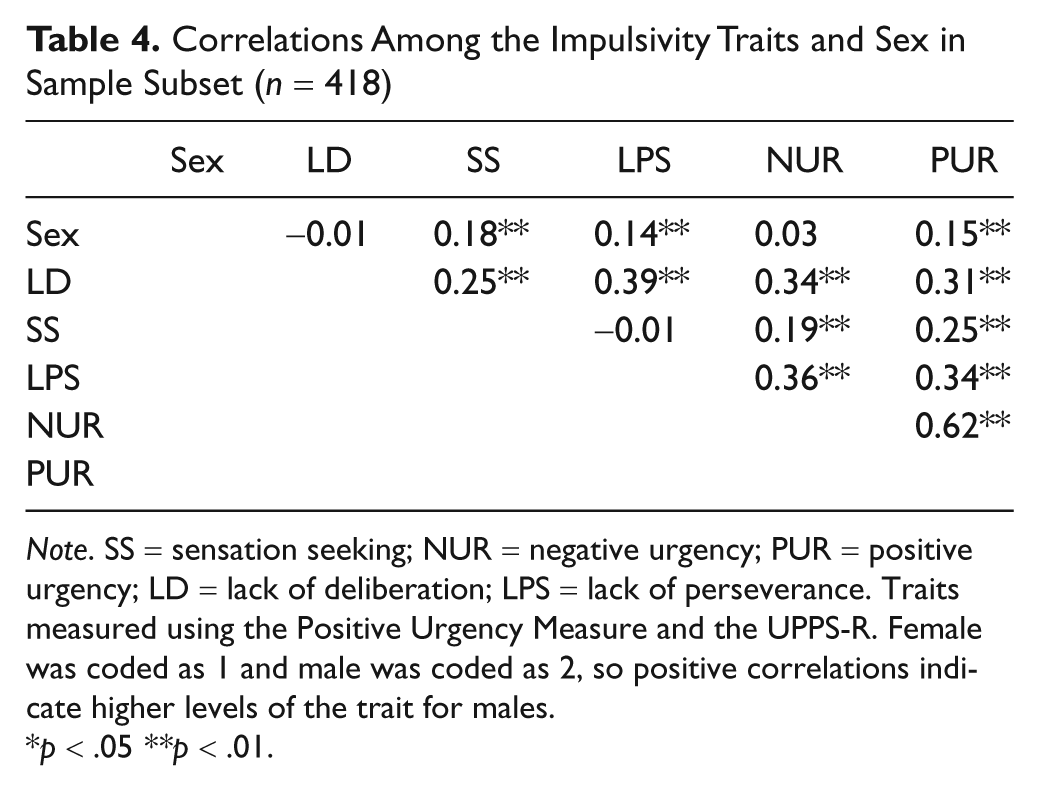
Note. SS = sensation seeking; NUR = negative urgency; PUR = positive urgency; LD = lack of deliberation; LPS = lack of perseverance. Traits measured using the Positive Urgency Measure and the UPPS-R. Female was coded as 1 and male was coded as 2, so positive correlations indicate higher levels of the trait for males.
p < .05 **p < .01.
Correlations and Differences Among Impulsivity Traits and Risk Outcomes by Sex in Sample Subset (n = 418)
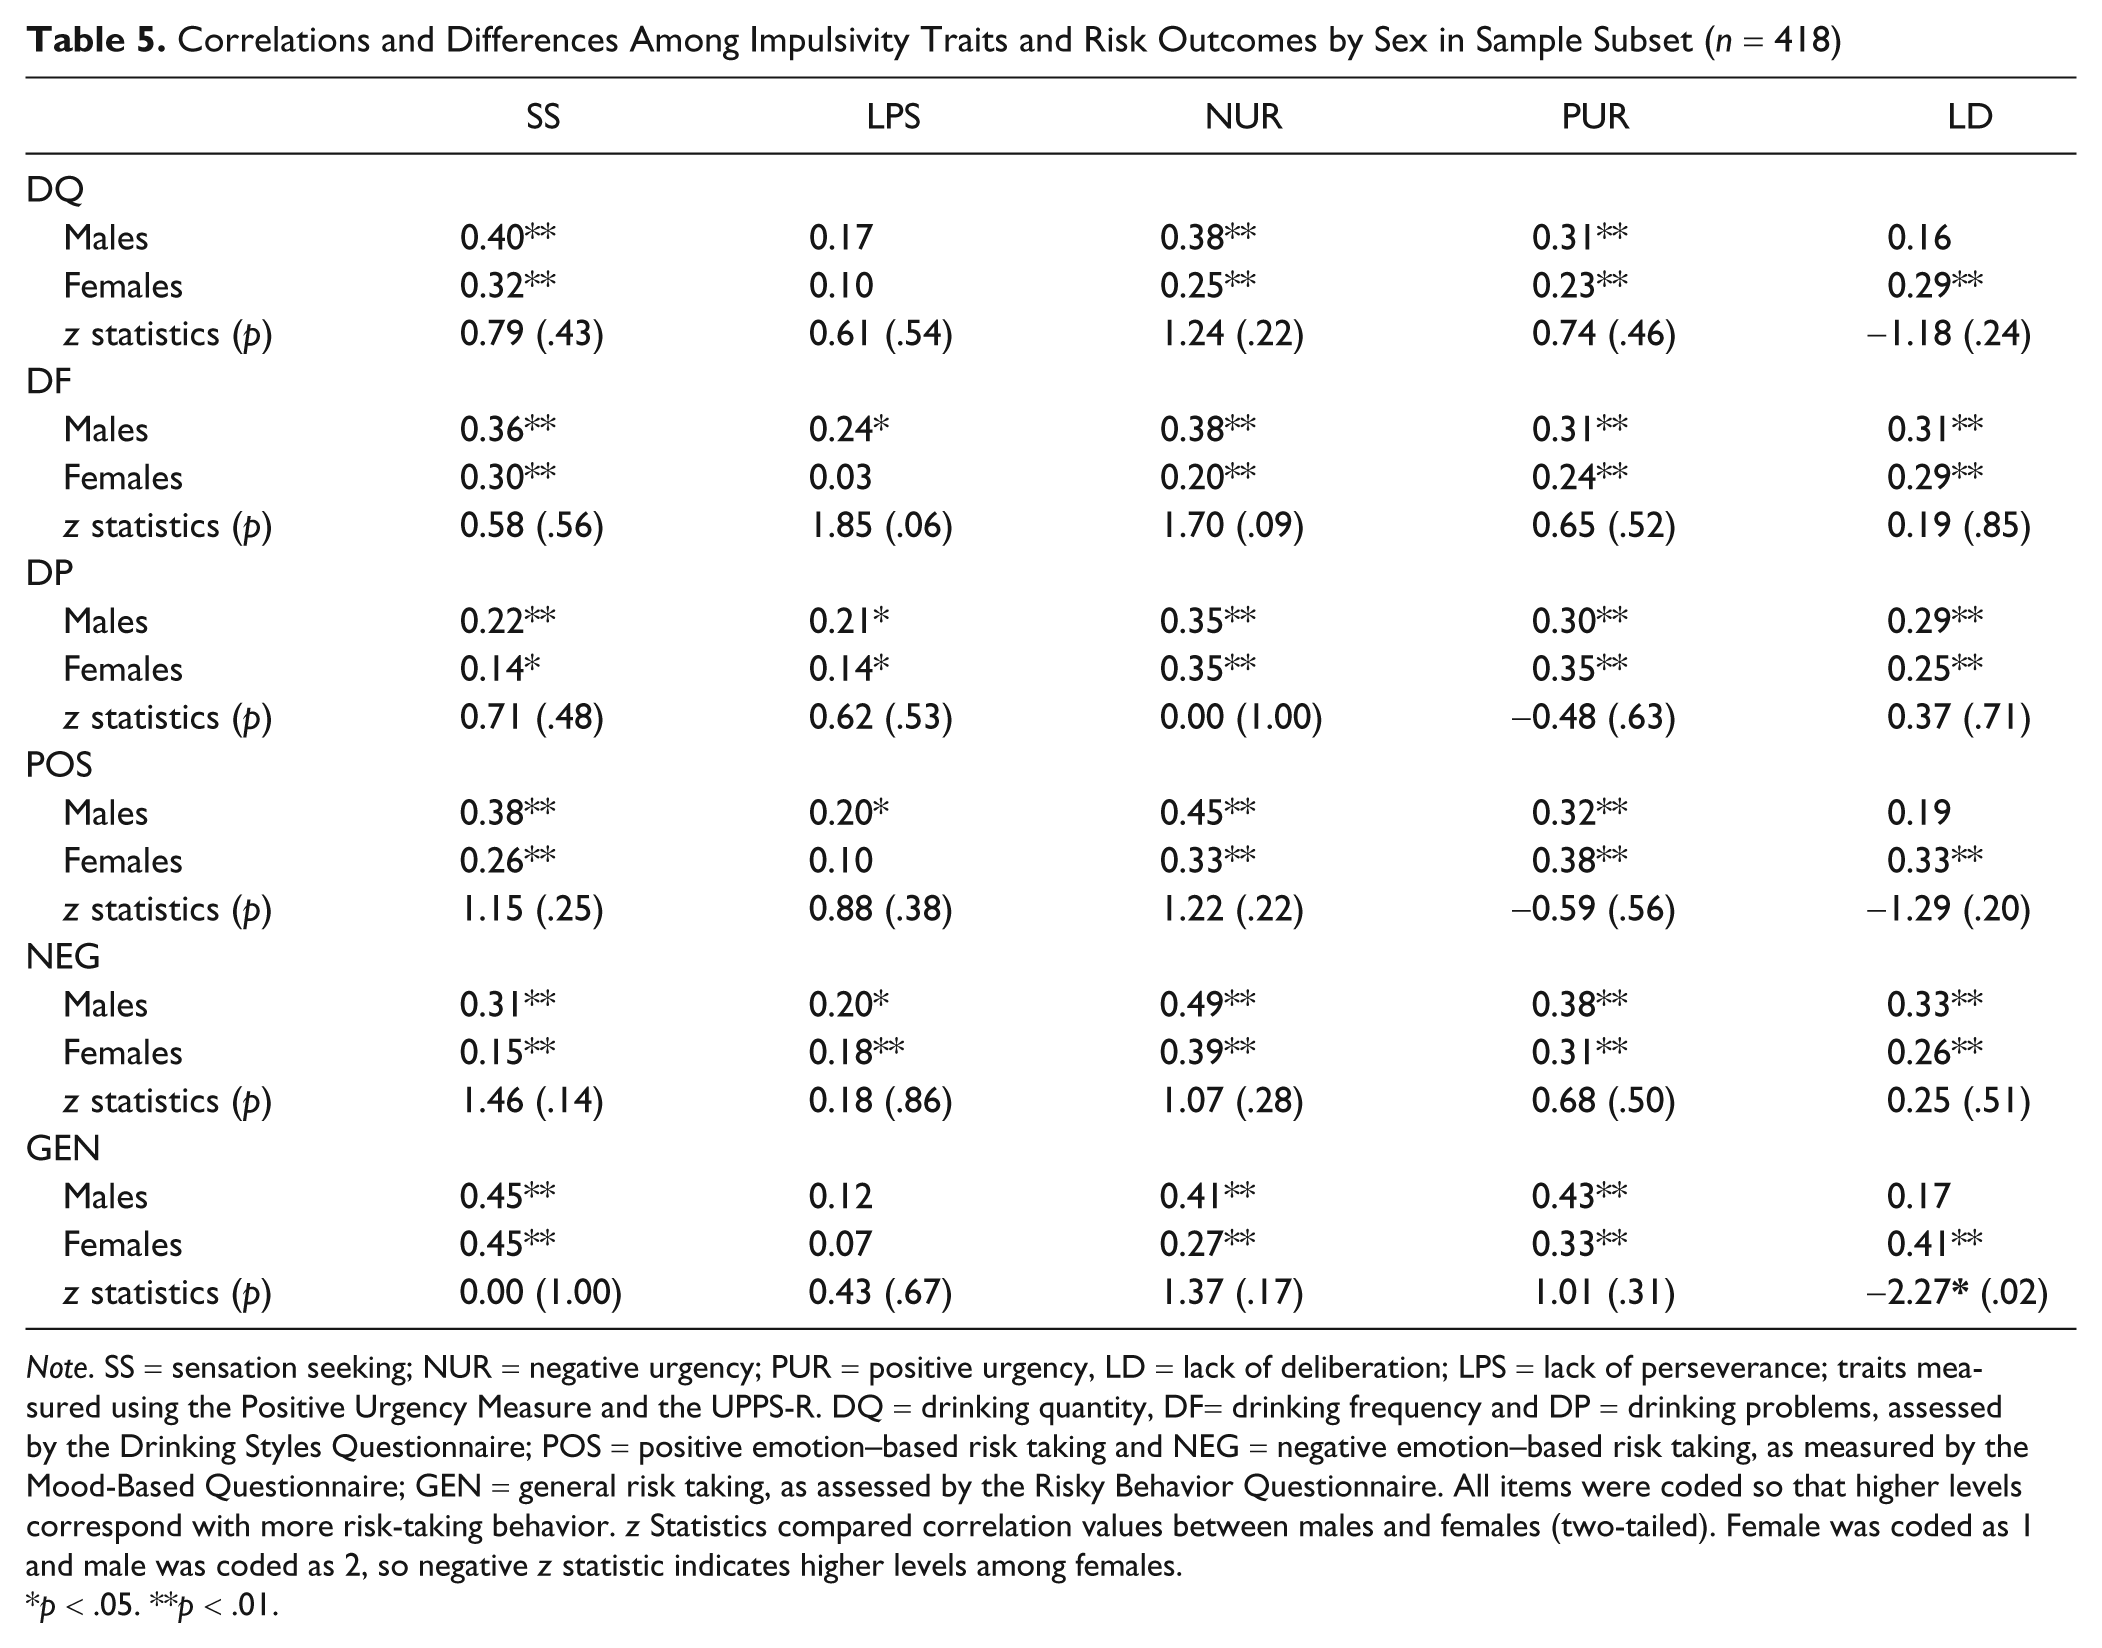
Note. SS = sensation seeking; NUR = negative urgency; PUR = positive urgency, LD = lack of deliberation; LPS = lack of perseverance; traits measured using the Positive Urgency Measure and the UPPS-R. DQ = drinking quantity, DF= drinking frequency and DP = drinking problems, assessed by the Drinking Styles Questionnaire; POS = positive emotion–based risk taking and NEG = negative emotion–based risk taking, as measured by the Mood-Based Questionnaire; GEN = general risk taking, as assessed by the Risky Behavior Questionnaire. All items were coded so that higher levels correspond with more risk-taking behavior. z Statistics compared correlation values between males and females (two-tailed). Female was coded as 1 and male was coded as 2, so negative z statistic indicates higher levels among females.
p < .05. **p < .01.
Discussion
The current study sought to meet three aims: (a) to examine psychometric measurement invariance of the UPPS-P for males and females, (b) to examine the structural invariance across males and females, and (c) to examine how the impulsivity traits might differentially relate to risk outcomes, as predicted by sex. These questions are important as they speak to the appropriateness and the validity of using the UPPS-P to measure trait levels of the dispositions toward rash action and to predict risk for males and females. In fact, although research has previously suggested trait-level differences between males and females on impulsivity, determination of whether or not there are trait differences could not be fully answered until measurement invariance between the two groups was established. This is the first study to conduct a comprehensive evaluation of the use of the UPPS-P to measure self-report impulsivity for measurement invariance, construct invariance, and differential criterion-related validity.
The findings generally indicate that the UPPS-P is a valid and reliable scale for the measurement of impulsivity traits for both males and females. In other words, the UPPS-P can be administered and scored as recommended by its authors for both males and females; no modifications are necessary. However, the results of this study should be replicated with other samples to determine the validity of the UPPS-P in, for instance, clinical samples. Additional outcomes of interest should be examined for differential prediction as well. The current study also suggest that although validly assessed across males and females, it appears that males report higher levels of both positive urgency and sensation seeking than females, although these mean-level differences do not translate into differential prediction of risk outcomes, in general. The findings also suggest that males likely have higher levels of lack of perseverance than females, although data from the current study do conflict to some extent and this should be replicated in other research.
More generally, this study supports the usefulness and importance of examining the validity of using and comparing the results of questionnaires across groups. Much interest exists in the field of psychology concerning group differences, including not only males and females but also group differences based on race, socioeconomic status, and sexual orientation (e.g., Reynolds, 1983). Researchers and practitioners alike must appreciate the need to establish measurement invariance across groups in order to have confidence in the meaning of purportedly substantive differences in group means (see Cleary, Humphreys, Kendrick, & Wesman, 1975). Testing for measurement invariance is, unfortunately, rarely done (see Vandenberg & Lance, 2000). This has been recently seen in the case of impulsivity research: A recent meta-analysis that found group differences in impulsivity (Cross et al., 2011), in short, should be understood and interpreted within the context of measurement invariance. Until measurement invariance can be found to hold between males and females on the wide array of measures assessed in that study, a conclusion concerning the existence of differences between males and females is premature. Therefore, conclusions posited by the authors (Cross et al., 2011) could reflect trait-level differences, as the authors suggest; however, these findings are also consistent with the existence of measurement noninvariance across males and females, and thus, this should be examined empirically.
Additionally, examination of measurement invariance is especially important in multicultural research or in industrial/organizational psychology, where construct validity limitations of a measure can result in group differences that are psychometric in nature (e.g., related two noninvariant factor loadings) but are interpreted as substantive group mean differences and potentially biased prediction, treatment assignment, hiring, promotion, or diagnosis. This psychometric test bias can result in biasing because of metric noninvariance or scalar noninvariance. If metric invariance does hold but scalar invariance does not, the groups cannot be compared, since the constructs themselves account for the mean differences across the groups. The use of different cutoff scores could be used to better predict for or assign individuals from different groups (see Cleary et al., 1975; Cole, 1981). It is important to note that this solution is not without controversy, and is often illegal; different cutoff scores for groups should only be used with caution and only when the measure demonstrates clear scalar noninvariance (see Cleary et al., 1975; Cole, 1981). One more widely accepted solution (although still not free of controversy) in industrial/organizational psychology is known as score banding, in which scores within a certain range are treated as equivalent (see Campion et al., 2001), with the goal of more representative hiring or promotion decisions.
However, if scalar invariance holds, but metric invariance does not, the construct factor itself is different. In this case, different predictive relationships would exist between the predictor and the criterion based on group membership (see Cleary et al., 1975). Again, this type of bias could be overcome with the use of different regression equations (with different weights) for prediction, as long as both relationships are positive, although, similar to above, this could be quite controversial. This type of bias is known as psychometric test bias (see Cleary et al., 1975) and is thought of as extremely problematic for any measure or item holding this characteristic. The measure could be potentially used to study within group differences, but any analysis of between group differences using this measure would be considered differentially valid or biased. Use of the same regression weight across groups would not be appropriate, and use of the measure at all across groups could be considered unsuitable.
In conclusion, the current study supports the measurement invariance of the UPPS-P across males and females and suggests that comparisons in impulsivity levels (as assessed by the UPPS-P) across males and females can be validity interpreted as representing underlying mean differences in the traits. The current study clarifies research concerning sex differences in impulsivity, suggesting that males and females differ in sensation seeking and positive urgency facets of impulsivity, as well as possibly in lack of perseverance, thus clarifying some of the research inconsistencies in this area. Importantly, these mean differences in traits between males and females do not translate in differential prediction of a variety of risk outcomes assessed.
Footnotes
Acknowledgements
The author would like to acknowledge Dr. Gregory T. Smith and Dr. Denis M. McCarthy for their helpful comments on an earlier draft of this article.
Declaration of Conflicting Interests
The author declared no potential conflicts of interest with respect to the research, authorship, and/or publication of this article.
Funding
The author disclosed receipt of the following financial support for the research, authorship, and/or publication of this article: This research was supported in part by a National Research Service Award (F31AA021036) awarded to Melissa Cyders by the National Institutes on Alcohol Abuse and Alcoholism.