






Abstract
Although it is understood that assessment tools require evaluation using diverse samples, such evaluations are relatively rare. There are obstacles to such work, but it remains important to pursue psychometric data in broad samples. As such, we evaluated measurement invariance and population heterogeneity of two versions of a widely used measure in the anxiety literature—the Intolerance of Uncertainty Scale (IUS)—among self-identifying White (N = 1,185) and Black (N = 301) students. Data from multiple-groups confirmatory factor analysis supported the equivalence of the equal form and factor loadings of both IUS versions in White and Black respondents. However, specific IUS items functioned differently in the two groups, with more IUS items appearing biased in the full-length relative to the short-form version. Correlations between IUS factors and worry were equivalent among White and Black respondents. We discuss the implications of these results for future research.
Intolerance of uncertainty (IU) represents an individual’s negative beliefs about uncertainty and its implications, and is considered a core cognitive vulnerability for symptoms of generalized anxiety disorder, particularly worry (Dugas & Robichaud, 2007; Freeston, Rheaume, Letarte, Dugas, & Ladouceur, 1994). Koerner and Dugas (2006) reviewed a substantial literature that supports the IU–worry link, supporting IU as a central target within psychological treatments for generalized anxiety disorder (Dugas & Robichaud, 2007). Despite its status as a vulnerability putatively specific to the experience of generalized anxiety disorder (e.g., Dugas, Gosselin, & Ladouceur, 2001), an emerging body of research implicates IU as a transdiagnostic phenomenon. For example, IU also appears relevant to social anxiety and obsessive–compulsive symptoms (e.g., Fergus & Wu, 2011). Overall, the available literature reflects that IU is a construct of broad interest for clinical researchers, particularly within the realm of anxiety symptomatology.
To understand how IU relates to various clinical phenomena, it is of course necessary to develop valid assessment tools. To date, the Intolerance of Uncertainty Scale (IUS; Buhr & Dugas, 2002; Freeston et al., 1994) has been the most commonly used measure of IU. The IUS is a 27-item questionnaire with a 5-point response scale. Data from several studies have supported its psychometric properties, including internal consistency (Cronbach’s α = .91; Buhr & Dugas, 2002), retest reliability (5-week r = .74; Buhr & Dugas, 2002), convergent validity (rs of .68 and .72 with another index of IU; Gosselin et al., 2008), discriminant validity (r = .40 with an index of responsibility, another anxiety-related belief domain; Dugas et al., 2001), criterion validity (rs ranging from .60 to .70 with worry; Buhr & Dugas, 2002; Dugas et al., 2001; Gosselin et al., 2008), and sensitivity to treatment (Dugas et al., 2003).
Factorial Validity
In contrast to the clear and promising findings above, the adequacy of the IUS’s factorial validity has been less clear. Freeston et al. (1994) originally proposed a five-factor IUS solution; however, subsequent studies have not replicated this—or multiple alternative—solutions. For example, Buhr and Dugas (2002) identified a four-factor IUS solution, but Berenbaum, Bredemeier, and Thompson (2008) subsequently endorsed a different four-factor solution. Moreover, Norton (2005) found that differing five-factor solutions best represented the IUS items among different racial groups, all of which differed from Freeston et al.’s original five-factor solution (see, Birrell, Meares, Wilkinson, & Freeston, 2011, for a tabular presentation of IUS solutions). Given these inconsistent findings, researchers have concluded that the IUS provides only limited utility as a multidimensional operationalization of IU and advocate for the use of a total scale (Norton, 2005). However, Norton noted that the factorial validity of the IUS, and consequently its utility as a multidimensional operationalization of IU, might be improved through item removal.
Carleton, Norton, and Asmundson (2007) later developed a short form of the IUS. Specifically, Carleton et al. examined factor loadings and interitem correlations among the original 27 IUS items, retaining 12 of these items. The 12-item short-form correlated strongly with the full-length IUS (r = .96) and both versions evidenced statistically equivalent correlations with the key criterion of worry. Carleton et al. identified (and later replicated) a two-factor structure for the short-form, with the factors sharing a strong intercorrelation (r = .73). The two factors originally were labeled Prospective (seven items) and Inhibitory (five items) Anxiety, but others prefer the labels Prospective and Inhibitory Uncertainty (McEvoy & Mahoney, 2011).
Despite its promise for improving the factorial validity of the IUS, Sexton and Dugas (2009) criticized Carleton et al.’s (2007) short-form for failing to fully capture the original IU construct, as represented by the full-length IUS. Furthermore, Sexton and Dugas proposed that the previous inconsistencies regarding the full-length IUS factor structure likely were the result of relatively small samples (which led to unreliable factor structures and oversampling of factors). To remedy such concerns, Sexton and Dugas sought to identify a replicable full-length IUS factor structure using two large nonclinical samples (Ns of 1,230 and 1,221). Using a combination of exploratory factor analysis (EFA) and confirmatory factor analysis (CFA), Sexton and Dugas identified a two-factor full-length IUS solution. Factor I was labeled Uncertainty Has Negative Behavioral and Self-Referent Implications (15 items) and Factor II was labeled Uncertainty Is Unfair and Spoils Everything (12 items). These two factors were strongly intercorrelated (r = .87), but still showed distinct correlates: Factor I had significantly higher correlations with depression, trait anxiety, and somatic symptoms relative to Factor II (Sexton & Dugas, 2009). Of note, all items from Carleton et al.’s (2007) Prospective Uncertainty factor loaded on Sexton and Dugas’s Uncertainty Is Unfair and Spoils Everything factor (Factor II) and all items from Carleton et al.’s Inhibitory Uncertainty factor loaded on Sexton and Dugas’s Uncertainty Has Negative Behavioral and Self-Referent Implications (Factor I). Despite this substantial overlap, Sexton and Dugas advocated using their full-length two-factor IUS solution in future studies.
Among the IUS factor structures, there is strongest empirical support for Carleton et al.’s (2007) two-factor short-form solution and Sexton and Dugas’s (2009) two-factor full-length solution (see, Birrell et al., 2011). As such, studies have directly compared these two operationalizations of the IUS. For example, because of the extensive item overlap, Khawaja and Yu (2010) found that Carleton et al.’s Inhibitory Uncertainty Scale and Sexton and Dugas’s Uncertainty Has Negative Behavioral and Self-Referent Implications Scale were strongly intercorrelated (r = .90), as were Carleton et al.’s Prospective Uncertainty Scale and Sexton and Dugas’s Uncertainty Has Negative Behavioral and Self-Referent Implications Scale (r = .97). Furthermore, Khawaja and Yu found that both sets of scales showed a similar pattern of correlations with theoretically relevant criteria (e.g., worry) and concluded that “clinicians and researchers may choose either version without any serious limitations” (p. 105).
Cross-Cultural Applicability
A remaining issue surrounding the comparability of these two IUS models relates to the cross-cultural applicability of both versions, that is, do they perform similarly in diverse respondent groups. More than a decade ago, Sue (1999) argued that our discipline has “not followed good scientific principles in assuming that findings from research on one population can be generalized to other populations” (p. 1073) and that it is simply good science to study any groups to which we intend to apply our results. Norton (2005) heeded this call, examining the issue and concluding that the IUS was factorially unstable across racial groups. An informative study, one limitation was that the sample sizes of the racial minority groups had fewer than 150 participants. Comrey (1988) cautioned against interpreting factor analytic work conducted on relatively small samples, opining that “investigators drop below a sample size of 200 . . . at their peril” (p. 759). Moreover, because Norton did not have in 2005 access to the more replicable IUS factor structures identified in 2007 and 2009, respectively, he (appropriately) used an exploratory approach. However, a confirmatory approach might now be used to examine the viability of Carleton et al.’s and Sexton and Dugas’s IUS solutions. Such an analysis would test Khawaja and Yu’s conclusion that either version of the IUS might be used without any serious limitations. For example, finding that only one of the two solutions demonstrates cross-cultural applicability would lend support for using that version of the measure.
Another reason to evaluate the IUS in diverse groups is, quite plainly, the limitation forced on researchers when such information is lacking. For example, Rucker, West, and Roemer (2010) found that IU—measured with the IUS—fully mediated the relationship between perceived racial stress and worry in a sample of Black respondents. Rucker et al. (2010) expressed interest in operationalizing IU as a multidimensional construct, but the lack of data speaking to the adequacy of multidimensional IUS models among Black respondents led them to use only the IUS total scale. Thus, the state of the literature precluded separate examination of the two IUS scales and, in turn, replication of findings of distinct correlates of each IUS factor (e.g., Sexton & Dugas, 2009). Such an analysis is warranted, but before it can be attempted, it first is necessary to validate both two-factor IUS solutions in the specific groups of interest.
Relations With Worry
As noted, IU is central to the phenomenology of worry (Koerner & Dugas, 2006). Thus, it is important to examine the cross-cultural equivalence of associations between the IUS and worry. This issue was examined by Norton (2005) using the IUS total score, which correlated with a measure of worry equivalently among White and Black respondents (rs of .62 and .66, respectively). However, and despite interest in a finer grained analysis of relations between IUS subscales and worry among Black respondents (Rucker et al., 2010), no such data are available regarding either the Carleton et al. (2007) or Sexton and Dugas (2009) models. Extending Norton’s findings, we addressed this gap in the literature by examining whether the correlations between worry and the two major sets of IUS factors (those identified by Carleton et al. and Sexton & Dugas) were equivalent among White and Black respondents.
Current Study
We had two primary aims in completing the current study. One aim was to examine the measurement invariance and population heterogeneity of the IUS among self-identifying White and Black respondents. This specific group comparison was chosen for two reasons. First, the IUS factor structures identified by Carleton et al. (2007) and Sexton and Dugas (2009) were derived from largely White samples (e.g., 67.2% and 67.9%, respectively, of Sexton & Dugas’s, 2009, respondents self-identified as White). Thus, self-identifying White respondents provide a benchmark group for comparing the IUS factor structures in relation to (a) independent samples of White respondents and (b) respondents from other racial groups. Second, examining the IUS factor structure among self-identifying Black respondents will assist research efforts specifically interested in understanding the role of IU within this population (e.g., Rucker et al., 2010). The second aim was to investigate whether the IUS factors correlated equivalently with worry in White and Black respondents.
The extant literature allowed for certain a priori predictions. First, we predicted that we would find equal form for the IUS among self-identifying White and Black respondents. This prediction was based on Norton’s (2005) finding that the same number of factors (five) represented the IUS items among White and Black respondents. However, IUS items loaded on different factors in these two groups, with several items showing salient loadings on multiple factors. Following from Sexton and Dugas (2009), Norton’s findings might have represented an oversampling of IUS factors. As such, we predicted that a more parsimonious (two-factor) solution would provide a more stable structure and, thus, we would find equal form among these two groups. Regarding tests of population heterogeneity, we predicted that we would find equivalent latent means among the two groups. This prediction was based on Norton’s (2005) finding that White and Black respondents did not significantly differ in their average IUS score. Because the extant literature did not allow us to make predictions regarding other aspects of measurement invariance (equivalence of factor loadings or indicator intercepts) and population heterogeneity (equivalence of either factor variances or the factor covariance), these tests were considered exploratory. Finally, based on Norton’s findings using the IUS total score, we predicted that the IUS factors would correlate with worry equivalently in the two groups. Given the noted overlap between Carleton et al.’s (2007) two-factor solution and Sexton and Dugas’s two-factor solution, we predicted a similar pattern of results when examining either version of the measure.
Method
Participants, Measures, and Procedure
The initial sample consisted of 1,796 undergraduate students recruited through introductory psychology courses at a Midwestern U.S. university. Students received partial course credit for participation. The sample had a mean age of 19.4 years (SD = 2.4) and consisted of 51.7% females. Among the total sample, 1,185 (66.2%) self-identified as White and 301 (16.8%) self-identified as Black. Among the remaining participants, 120 (6.7%) self-identified as Hispanic, 106 (5.9%) self-identified as Asian, and 77 (4.4%) self-identified as “Other.” The 1,486 self-identifying White and Black participants retained for analysis had a mean age of 19.4 years (SD = 2.4) and consisted of 51.4% females. There were no significant age, t(1795) = 0.22, ns, or gender, χ2(1) = 0.02, ns, differences between those participants retained versus not retained for inclusion in the present study.
In addition to the 27-item IUS (Buhr & Dugas, 2002), participants completed the Penn State Worry Questionnaire (PSWQ; Meyer, Miller, Metzger, & Borkovec, 1990), a 16-item assessment of the tendency to engage in excessive and uncontrollable worry. The PSWQ has shown convergent correlations with other indices of worry (rs of .59 and .67; Davey, 1993). After written informed consent stressed that participation was voluntary and anonymous, participants completed both measures in small-group sessions in a university classroom.
Data Analytic Strategy
We initially examined two separate measurement models. The first was a multiple-groups CFA identical to Carleton et al.’s (2007) two-factor short-form IUS model. This model consisted of seven items (Items 7, 8, 10, 11, 18, 19, 21) with primary loadings on Factor I and five items (Items 9, 12, 15, 20, 25) with primary loadings on Factor II. The second model was a multiple-groups CFA identical to Sexton and Dugas’s (2009) two-factor full-length IUS model. This model consisted of 15 items (Items 1, 2, 3, 9, 12, 13, 14, 15, 16, 17, 20, 22, 23, 24, 25) with primary loadings on Factor I and 12 items (Items 4, 5, 6, 7, 8, 10, 11, 18, 19, 21, 26, 27) with primary loadings on Factor II. No secondary loadings were modeled, but the factors were allowed to intercorrelate in each measurement model. The metric of the latent constructs was set by fixing one of their unstandardized factor loadings to 1.0 (Brown, 2006; Kline, 2010).
Tests of measurement invariance and population heterogeneity were based on these measurement models and consistently followed the steps recommended by Brown (2006). First, each measurement model was tested separately among White and Black respondents to ensure it demonstrated an adequate fit in each group. Next, a series of increasingly restrictive models was examined. These models included testing for equivalent (a) factor structures (equal form), (b) factor loadings, and (c) indicator intercepts. 1 When testing (a), we simultaneously examined the adequacy of the respective IUS factor structure in both groups; when testing (b), we constrained parameters to equality in the lambda-x matrix; and when testing (c), we constrained parameters to equality in the tau-x matrix, as well as fixed the latent factor mean among White respondents to zero and freely estimated the latent factor mean among Black respondents. These three tests comprised the tests of measurement invariance. If the above tests supported measurement invariance, we then completed tests to examine population heterogeneity. These tests examined equivalent (d) factor variances, (e) factor covariance, and (f) latent means. When testing (d), we constrained the latent factor variances to equality in the phi matrix; when testing (e), we extended this equality constraint to include the latent factor covariance in the phi matrix; and when testing (f), we constrained parameters to equality in the kappa matrix. Model comparisons included comparing the fit of increasingly restrictive models. These comparisons included (b) versus (a), (c) versus (b), (d) versus (c), (e) versus (d), and (f) versus (e). Measurement invariance and population heterogeneity are supported via a lack of significant decrement in model fit among comparisons.
Finally, another measurement model was tested that included a latent worry construct (operationalized using the 16 PSWQ items). This model was developed to test the equivalence of relations between IUS factors and worry in White and Black respondents. The model consisted of either of the measurement models described above, as well as the latent worry construct. The PSWQ was modeled with all its 16 items loading on a single latent factor. Relations between Carleton et al.’s (2007) IUS model and worry and between Sexton and Dugas’s (2009) IUS model and worry were tested in separate measurement models. The metric of the latent constructs was again set by fixing one of their unstandardized factor loadings to 1.0 (Brown, 2006; Kline, 2010). The three factors in the respective models were allowed to intercorrelate. The respective model was initially tested separately in each group to ensure its adequacy and to obtain estimates of the relationship between each IUS factor and worry in the two groups. Next, the model was simultaneously tested in both groups, which served as a baseline model. This baseline model subsequently served as the comparison model for the model that equated the covariance (in the phi matrix) between each IUS factor and the worry factor across the two groups. If the model in which the covariances were equated did not show a significant decrement in model fit relative to the baseline model, then the relationship between the IUS factors and the worry factor could be considered equivalent in magnitude among the White and Black respondents.
All models were tested by inputting covariance matrices into LISREL 8.80 (Jöreskog & Sörbom, 2006) and using maximum likelihood estimation. Six commonly recommended (Brown, 2006; Hu & Bentler, 1999; Kline, 2010) fit statistics were used to evaluate the models: comparative fit index (CFI), nonnormed fit index (NNFI), root mean square error of approximation (RMSEA), standard root mean square residual (SRMR), Akaike information criterion (AIC), and Expected Cross-Validation Index (ECVI). Hu and Bentler’s guidelines were used to evaluate fit: CFI and NNFI should be close to .95, RMSEA should be close to .06, and SRMR should be close to .08. Furthermore, the upper limit of the 90% RMSEA confidence interval (CI) should not exceed .10 and lower AIC and ECVI values indicate better model fit (Kline, 2010). In addition to these fit statistics, model comparisons were evaluated as follows. First, the chi-square difference (χ2D) test was used. A significant χ2D test between two models indicates a significant decrement in model fit. However, because the χ2D test is affected by sample size, model testing completed with large samples might result in significant χ2D tests when differences in parameter estimates are trivial in magnitude (Brown, 2006). As such, and following the recommendations of Kline (2010), we also used alternative tests for comparing models. One alternative test included examining the change in CFI (ΔCFI). Meade, Johnson, and Braddy (2008) identified a ΔCFI value of less than or equal to .002 as representing functionally trivial differences in parameter estimates among models. The other model comparison test was examining RMSEA 90% CIs. Differences in model fit are considered nonsignificant if models have overlapping 90% RMSEA CIs (Wang & Russell, 2005).
Results
Two-Factor IUS Measurement Models
Goodness-of-fit statistics from the measurement model based on Carleton et al. (2007) are presented in Table 1. This two-factor correlated model generally provided an adequate fit to the data in both the White and Black samples. With the exception of the RMSEA associated with the two-factor correlated model in the Black sample, all goodness-of-fit statistics exceeded the specified guidelines. All the factor loadings were significant (p < .01) for both groups. The latent correlation between the two IUS factors was .81 (p < .01) among White respondents and .91 (p < .01) among Black respondents.
Goodness-of-Fit Statistics for Tested Models Using Carleton et al.’s (2007) 12-Item IUS.
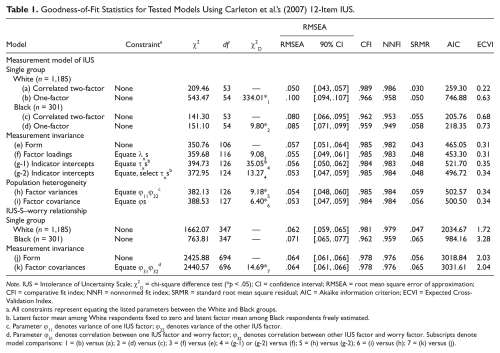
Note. IUS = Intolerance of Uncertainty Scale; χ2D = chi-square difference test (*p < .05); CI = confidence interval; RMSEA = root mean square error of approximation; CFI = comparative fit index; NNFI = nonnormed fit index; SRMR = standard root mean square residual; AIC = Akaike information criterion; ECVI = Expected Cross-Validation Index.
All constraints represent equating the listed parameters between the White and Black groups.
Latent factor mean among White respondents fixed to zero and latent factor mean among Black respondents freely estimated.
Parameter ϕ11 denotes variance of one IUS factor; ϕ22 denotes variance of the other IUS factor.
Parameter ϕ31 denotes correlation between one IUS factor and worry factor; ϕ32 denotes correlation between other IUS factor and worry factor. Subscripts denote model comparisons: 1 = (b) versus (a); 2 = (d) versus (c); 3 = (f) versus (e); 4 = (g-1) or (g-2) versus (f); 5 = (h) versus (g-2); 6 = (i) versus (h); 7 = (k) versus (j).
Given the high latent factor intercorrelation, we tested in both samples a model in which all 12 IUS short-form items had primary loadings on a single latent factor. However, in both samples, all goodness-of-fit statistics were better for the two-factor model relative to the one-factor model (Table 1). Furthermore, in the White sample, the significant χ2D test, nonoverlapping RMSEA 90% CIs, and the ≥.002 ΔCFI from the two-factor model to one-factor model suggested that the two-factor model provided a better fit to the data than did the one-factor model. In the Black sample, although there were overlapping RMSEA 90% CIs, the significant χ2D test and the ≥.002 ΔCFI from the two-factor model to one-factor model suggested that the two-factor model provided a better fit to the data than did the one-factor model. Based on these findings, Carleton et al.’s (2007) two-factor short-form IUS model was retained for the subsequent tests of measurement invariance and population heterogeneity.
Goodness-of-fit statistics from the measurement model based on Sexton and Dugas (2009) are presented in Table 2. Sexton and Dugas’s two-factor correlated model generally provided an adequate fit to the data in both the White and Black samples. With the exception of the RMSEA associated with the two-factor correlated model in the Black sample, all goodness-of-fit statistics exceeded the specified guidelines. The factor loadings were significant (p < .01) for both groups. The latent correlation between the two IUS factors was .88 (p < .01) among White respondents and .93 (p < .01) among Black respondents.
Goodness-of-Fit Statistics for Tested Models Using Sexton and Dugas’s (2009) 27-Item IUS.
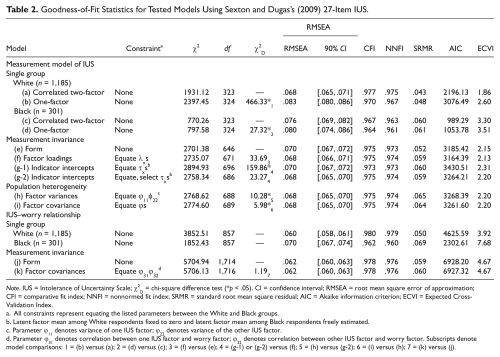
Note. IUS = Intolerance of Uncertainty Scale; χ2D = chi-square difference test (*p < .05). CI = confidence interval; RMSEA = root mean square error of approximation; CFI = comparative fit index; NNFI = nonnormed fit index; SRMR = standard root mean square residual; AIC = Akaike information criterion; ECVI = Expected Cross-Validation Index.
All constraints represent equating the listed parameters between the White and Black groups.
Latent factor mean among White respondents fixed to zero and latent factor mean among Black respondents freely estimated.
Parameter ϕ11 denotes variance of one IUS factor; ϕ22 denotes variance of the other IUS factor.
Parameter ϕ31 denotes correlation between one IUS factor and worry factor; ϕ32 denotes correlation between other IUS factor and worry factor. Subscripts denote model comparisons: 1 = (b) versus (a); 2 = (d) versus (c); 3 = (f) versus (e); 4 = (g-1) or (g-2) versus (f); 5 = (h) versus (g-2); 6 = (i) versus (h); 7 = (k) versus (j).
Again, given the high latent factor intercorrelation, we tested in both samples a model in which all 27 IUS items had primary loadings on a single latent factor. In both samples, all goodness-of-fit statistics were better for the two-factor model relative to the one-factor model (Table 2). Furthermore, in the White sample, the significant χ2D test, nonoverlapping RMSEA 90% CIs, and the ≥.002 ΔCFI from the two-factor model to one-factor model suggested that the two-factor model provided a better fit to the data than did the one-factor model. In the Black sample, although there were overlapping RMSEA 90% CIs, the significant χ2D test and the ≥.002 ΔCFI from the two-factor model to one-factor model suggested that the two-factor model provided a better fit to the data than did the one-factor model. Based on these findings, Sexton and Dugas’s (2009) two-factor full-length IUS model was retained for the subsequent tests of measurement invariance and population heterogeneity.
Measurement Invariance of IUS
Tests of measurement invariance among White and Black respondents using either Carleton et al.’s (2007) or Sexton and Dugas’s (2009) model are presented in Tables 1 and 2, respectively. Models with constraints testing for equal form and factor loadings suggested equivalence between these two groups. However, models with constraints testing for equal indicator intercepts suggested relatively poor model fit, as evidenced by the corresponding significant χ2D test and elevated AIC and ECVI values. We used modification indices to examine specific indicator intercepts that might be freed to improve the fit of both models. We followed Raykov and Marcoulides’s (2006) recommendations for model modification and sought to free model parameters with modification indices larger than 5. We freed the model parameter with the highest modification index first. Indicator intercepts for two items (Items 7 and 25) in Carleton et al.’s model were freed (in that item order) before all modification indices relating to the indicator intercepts in that model were less than 5. Indicator intercepts from 10 items (Items 17, 23, 6, 25, 1, 22, 24, 7, 17, 26) in Sexton and Dugas’s model were freed (in that item order) before all modification indices relating to the indicator intercepts in that model were less than 5. These revised models testing for equality of indicator intercepts appeared to improve on the fit of the original models testing for this facet of measurement invariance. In particular, although the revised models still were associated with increased AIC and ECVI values, the nonsignificant χ2D test between each revised model and the model testing for equal factor loadings suggested that there was not a significant decrement in model fit in equating the remaining indicator intercepts between the two groups. Furthermore, the ΔCFI was uniformly ≤.002 and RMSEA 90% CIs were overlapping for these sets of models (Tables 1 and 2).
Population Heterogeneity of IUS
There is no consensus as to the suitability of completing tests of population heterogeneity when only partial measurement invariance is evidenced (Brown, 2006). However, given the support we found for certain aspects of measurement invariance, it was possible to complete specific tests of population heterogeneity. 2 More specifically, testing the invariance of factor variances is possible if factor loadings are found to be invariant (Brown, 2006). Given that the above tests suggested that factor loadings were invariant across the two groups, we tested models with constraints testing for equivalent factor variances. The fit of these models suggested equivalence in factor variances between White and Black respondents. Brown further noted that it is possible to test for equality of covariances if both factor loadings and factor variances are found to be invariant. Given the above findings suggesting that these criteria had been met, we tested models with constraints testing for an equivalent factor covariance. The fit of these models suggested equivalence in the IUS factor covariance between the White and Black respondents. More specifically, although the corresponding χ2D tests were significant when testing these two aspects of population heterogeneity, the ΔCFI was uniformly ≤.002 and RMSEA 90% CIs were overlapping for the models (Tables 1 and 2). Furthermore, the AIC and ECVI values were similar across the models. Following Brown, we did not compare models testing for equivalence of latent means because the indicator intercepts did not appear equivalent between the two groups.
Relations With Worry
Results from the measurement model examining IUS–worry relations in Carleton et al.’s (2007) model are presented in Table 1. Among White participants, IUS-Prospective Uncertainty correlated .64 with worry; IUS-Inhibitory Uncertainty correlated .60 with worry (ps < .01). Among Black participants, the respective values were .62 and .61 (ps < .01). Equating the correlation between the IUS factors and worry in the two groups resulted in a model whose goodness-of-fit statistics exceeded specified guidelines. Furthermore, the AIC and ECVI values of the model that equated the covariances were similar to the AIC and ECVI values of the baseline model. Moreover, although the χ2D test was significant, the ΔCFI was ≤.002 and overlapping RMSEA 90% CI indicated that equating these correlations did not produce a significant decrement in model fit.
Results from the measurement model examining IUS–worry relations in Sexton and Dugas’s (2009) model are presented in Table 2. Among White participants, IUS-Uncertainty Has Negative Behavioral and Self-Referent Implications correlated .61 with worry; IUS-Uncertainty Is Unfair and Spoils Everything correlated .72 with worry (ps < .01). Among Black participants, the respective values were .57 and .67 (ps < .01). Equating the correlation between the IUS factors and worry in the two groups resulted in a model whose goodness-of-fit statistics exceeded specified guidelines. Furthermore, the AIC and ECVI values of the model that equated the covariances were similar to the AIC and ECVI values of the baseline model. Moreover, the nonsignificant χ2D test, ΔCFI ≤ .002, and overlapping RMSEA 90% CI all indicated that equating these correlations did not produce a significant decrement in model fit.
Discussion
The primary goal of this study was to examine the measurement invariance and population heterogeneity of IUS models proposed by Sexton and Dugas (2009) and Carleton et al. (2007) among White and Black respondents. Results demonstrated that although both versions of the measure have largely equivalent structural relations in the two groups, there are specific IUS items that function differently among White and Black respondents. As such, only partial measurement invariance was demonstrated in this study, which precluded us from being able to fully test for the population heterogeneity of the measure. A secondary goal was to examine the relation between the IUS and worry among these two groups. Consistent with Norton’s (2005) results using the IUS total score, the two factors of both the short-form and full-length solutions demonstrated equivalent correlations with worry among White and Black respondents. Overall, these results provide support for treating the IUS as a multidimensional instrument when assessing IU among both White and Black respondents.
The adequacy of the IUS’s factorial validity has been a long-standing issue within the IU literature, with the strongest empirical support to date existing for the two solutions we tested (see, Birrell et al., 2011). Comparisons between these two IUS factor solutions have led to conclusions that either version of the measure can be used without serious limitations (Khawaja & Yu, 2010). The present results, however, suggest that use of Carleton et al.’s (2007) short form might be preferred when examining IU among Black respondents. This is because our results suggested that 10 items of Sexton and Dugas’s (2009) full-length IUS functioned significantly differently among White and Black respondents. Only two items (Items 7 and 25) of Carleton et al.’s short-form IUS appeared to function significantly differently between these two groups (note that these two items also functioned differently in Sexton and Dugas’s full-length IUS).
An examination of the indicator intercepts of Items 7 and 25 suggested that White respondents endorsed significantly higher mean responses on Item 7 (Unforeseen events upset me greatly) than did Black respondents and Black respondents endorsed significantly higher mean responses on Item 25 (I must get away from all uncertain situations) than did White respondents. Of note, Item 7 belongs to Carleton et al.’s (2007) IUS-Prospective Uncertainty and Item 25 belongs to Carleton et al.’s IUS-Inhibitory Uncertainty. Thus, although these two items evidenced the same relationship with the respective latent construct in both groups, the predicted scores on these two indicators will vary depending on the group of respondents. As such, these two items appear to be biased indicators of the IU construct. It will be important for future research to replicate these findings and examine whether these two IUS items are also biased indicators in other racial/ethnic minority groups.
These findings have important implications, as a burgeoning area of research is interested in examining IU among racial/ethnic minorities. As noted, Rucker et al. (2010) expressed interest in operationalizing IU as a multidimensional construct in their study using Black respondents, but the lack of data speaking to the appropriateness of multidimensional IUS operationalizations among this group of respondents precluded such an investigation. The present results support the appropriateness of operationalizing IU as a two-factor construct among Black respondents. More specifically, our tests of measurement invariance suggested that a two-factor IUS solution has the same structure among White and Black respondents and that the indicators of the IUS factors evidence comparable relationships with the latent constructs in both groups. Results further revealed that the two IUS factors share an equivalent intercorrelation, as well as an equivalent correlation with worry—a criterion of particular interest to IU researchers—among White and Black respondents when using either version of the IUS. However, as noted, particular IUS items seem to be biased indicators of the two IU factors. Given that Carleton et al.’s (2007) two-factor solution had substantially fewer biased indicators than did Sexton and Dugas’s (2009) two-factor solution, Carleton et al.’s short form might be considered the preferred version of the IUS in future studies interested in IU among Black respondents.
As noted, the two IUS factors shared an equivalent intercorrelation among White and Black respondents. However, attention should be drawn to the high IUS factor intercorrelation in the two different solutions among Black respondents (Carleton et al.’s solution, r = .91; Sexton & Dugas’s solution, r = .93). Although these values largely are consistent with those reported in prior studies using predominantly White respondents (McEvoy & Mahoney, 2011, short-form latent r = .86; Sexton & Dugas, 2009, full-length latent r = .87), it will be important for future research to support the distinctiveness of the IUS scales among racially/ethnically diverse respondents by elucidating distinct correlates of these scales in such populations.
One area of interest might relate to extending prior work examining relations between IU and psychological symptoms. For example, McEvoy and Mahoney (2011) found that Carleton et al.’s (2007) Prospective Uncertainty scale, which parallels Sexton and Dugas’s (2009) Uncertainty Is Unfair and Spoils Everything scale, shared unique relations with generalized anxiety and obsessive–compulsive symptoms. McEvoy and Mahoney further found that Carleton et al.’s Inhibitory Uncertainty scale, which parallels Sexton and Dugas’s Uncertainty Has Negative Behavioral and Self-Referent Implications, shared unique relations with depression, panic, and social anxiety symptoms. Future research might seek to investigate whether a similar pattern of relations emerges among racially/ethnically diverse respondents.
Limitations of the present study must be acknowledged. First, it is desirable to have relatively equal sample sizes among groups when conducting multiple-groups CFAs (Brown, 2006); the current samples were not. Related to this issue, it will be important for future studies to extend our findings by examining the applicability of the two-factor IUS solutions in other racial groups. We focused our study on White and Black individuals to pursue specific questions raised in the extant literature, but it also was the case that the sample sizes of the Asian and Hispanic groups in our study fell below recommended levels (Comrey, 1988). Third, the present study did not assess other aspects of cultural identification and thus the degree to which respondents were representative of their self-identified group is unknown. Self-identified race is an extremely broad variable that offers only a starting point; grouping of respondents in the present study did not allow us to examine potentially important within-group differences. Fourth, although nonclinical samples have been central in the development of the IUS (including within Carleton et al., 2007, and Sexton & Dugas, 2009), these findings warrant replication in clinical and mixed samples to ensure that they generalize to samples marked by respondents who consistently score higher than students on the IUS. Finally, it will be important to extend the present findings to community samples to help ensure that they generalize to nonclinical respondents other than students.
Limitations notwithstanding, the present results support operationalizing IU as a multidimensional construct with Black respondents. Among the assessed versions of the IUS, Carleton et al.’s (2007) short-form two-factor IUS solution appears most appropriate for use with this group of respondents. Moreover, Carleton et al.’s short-form has the advantage of providing a briefer assessment of IU, which is a desirable attribute, especially when administered within larger questionnaire batteries. In addition, the relationship between IU (as measured using either version of the IUS) and worry appears equivalent among White and Black respondents. As such, psychological treatments for worry that specifically target IU (Dugas & Robichaud, 2007) and have been shown to be efficacious in predominantly White samples (e.g., Dugas et al., 2010) might be promising for reducing worry in clients from diverse racial/ethnic groups as well. However, and as noted by Norton (2005), this empirical question remains an important area of investigation; the IUS, particularly Carleton et al.’s version of this measure, seems well positioned to help researchers and clinicians address this question.
Footnotes
Declaration of Conflicting Interests
The authors declared no potential conflicts of interest with respect to the research, authorship, and/or publication of this article.
Funding
The authors received no financial support for the research, authorship, and/or publication of this article.