
Abstract
The DSM-5 (Diagnostic and Statistical Manual of Mental Disorders, 5th ed.) Section III will include an alternative hybrid system for the diagnosis of personality disorder (PD). This alternative system defines PD types partly through specific combinations of maladaptive traits, rather than by using a set of polythetic diagnostic criteria. The current report utilizes a large sample of undergraduates (n = 1,159) to examine three dimensional methods for comparing an individual’s trait profile to each PD type. We found that the sum of an individual’s scores on the assigned traits obtained large convergent correlations (Mdn r =.61) and best reproduced the patterns of PD discriminant correlations observed within the DSM-IV measure. We also tested the DSM-5 Section III model algorithms and compared them with different thresholds for assigning categorical diagnoses. Frequency rates using the algorithms were greatly reduced, whereas requiring half of the assigned traits produced rates that more closely approximated current prevalence estimates. Our research suggests that DSM-5 Section III trait model can reproduce the DSM-IV-TR PD constructs and identifies effective methods of doing so.
Over the past two decades, research has supported conceptualizing personality disorders (PDs) in terms of a dimensional trait model (Clark, 2007; Samuel & Widiger, 2008; Widiger & Costa, 1994). This approach suggests that PDs as defined by the Diagnostic and Statistical Manual of Mental Disorders (4th ed., text rev.; DSM-IV-TR; American Psychiatric Association [APA], 2000), can be understood as specific constellations of maladaptive traits rather than discrete entities distinct from each other and from normal personality (Krueger et al., 2011; Widiger & Trull, 2007). Although the fifth edition of the DSM (DSM-5) will retain the DSM-IV-TR diagnostic categories within Section II, the revised manual will bridge to a dimensional future by including a trait model as part of an alternative hybrid diagnostic system within Section III. The DSM-5 Section III PD model necessitates further study in anticipation of future revisions to the diagnostic manual (e.g., DSM 5.1).
This alternative trait model comprises 25 traits (e.g., callousness, withdrawal, emotional lability) that represent core descriptors of personality pathology and delineate the five broad domains of negative affectivity, detachment, antagonism, disinhibition, and psychoticism (Krueger, Derringer, Markon, Watson, & Skodol, 2012). These traits were derived using empirical and conceptual considerations and represent a synthesis of a variety of existing trait models (e.g., Widiger & Simonsen, 2005) and are operationalized by a self-report measure, the Personality Inventory for DSM-5 (PID-5; Krueger et al., 2012; Wright et al., 2012). The five higher order domains resemble the Personality Psychopathology 5 (Harkness & McNulty, 1994; Harkness, Finn, McNulty, & Shields, 2012) and represent a maladaptive extension of the five-factor model (FFM; McCrae & Costa, 2003). For example, in a conjoint factor analytic study, Thomas et al. (2012) demonstrated that PID-5 negative affectivity aligns with neuroticism, PID-5 detachment with (low) FFM extraversion, PID-5 antagonism with (low) FFM agreeableness, PID-5 disinhibition with (low) conscientiousness, and PID-5 psychoticism with FFM openness.
The DSM-5 Section III model specifies that elevations on these traits, along with associated impairments, be used to diagnose a PD. The primary advantage of this system is the ability to use maladaptive traits directly (i.e., Personality Disorder–Trait Specified). Nonetheless, a compelling practical application can be realized by developing methods of reproducing the DSM-IV-TR PD constructs from the traits as this will literally bridge these two approaches (Miller, 2012). For example, DSM-5 Section III indicates that six DSM-IV-TR PD types can be defined by specific sets of maladaptive traits along with associated impairments in functioning. For example, DSM-IV-TR borderline PD (BPD) is conceptualized as elevations on the specific traits of emotional lability, anxiousness, separation insecurity, depressivity, impulsivity, risk taking, and hostility (Clark, 2012).
In addition to the trait assignments, the DSM-5 Section III model proposes unique algorithms for diagnosing each PD. Specifically, BPD is diagnosed when at least four of the seven assigned traits are present and at least one of those four is impulsivity, risk taking, or hostility. Antisocial PD is diagnosed when there are elevations on any six traits from the group of seven that includes manipulativeness, deceitfulness, callousness, hostility, irresponsibility, impulsivity, and risk taking. In order to achieve the diagnosis of Narcissistic PD, a person must elevate on both assigned traits: grandiosity and attention seeking. Obsessive–Compulsive PD (OCPD) requires the trait of rigid perfectionism as well as at least two others from perseveration, intimacy avoidance, and restricted affectivity. Similarly, Avoidant PD requires the trait of anxiousness as well as at least two others from withdrawal, anhedonia, and intimacy avoidance. Finally, Schizotypal PD is diagnosed when at least four of the traits from eccentricity, cognitive and perceptual dysregulation, unusual beliefs and experiences, restricted affectivity, withdrawal, and suspiciousness are present.
The hybrid model was originally proposed for Section II of the manual, but ultimately the APA Board of Trustees decided it should be included in Section III, with the aim of encouraging additional research to establish an empirical support before a change. One such issue that requires critical study is identifying a straightforward method of assessing PD types within the alternative hybrid system. The first step toward this goal is to determine whether the assigned trait combinations successfully capture the variance in the PD types. This goal recognizes that establishing the convergence between dimensional measures of the DSM-5 Section III trait-defined PDs and their DSM-IV instantiations is a requisite step. Only after this has been demonstrated can work on specifying the precise methods for assigning categorical diagnoses proceed.
Scoring DSM-5 PDs Dimensionally
Given that the primary advantage of utilizing a dimensional model is to avoid the reduced reliability and validity that accompany categorical indicators (Markon, Chmielewski, & Miller, 2011), it is crucial to identify effective methods of calculating continuous scores for each PD. Thus, the current study first contrasts three candidate methods for calculating a dimensional score indicating the match between an individual’s PID-5 trait profile and a PD type. These three prototype-matching methods will be compared with an existing measure of the DSM-IV-TR PDs (i.e., the Personality Diagnostic Questionnaire [PDQ-4]; Hyler, 1994) to determine which obtains the highest convergence and most closely approximates the observed patterns of discriminant correlations. It is important to note that our analyses do not evaluate whether traits should be assigned to a given PD (e.g., Hopwood, Thomas, Markon, Wright, & Krueger, 2012; Samuel, Lynam, Widiger, & Ball, 2012) but rather evaluate methods for comparing those traits that have been assigned.
Previous research has examined methods for recovering PD constructs from dimensional trait systems (e.g., Miller, Lynam, Widiger, & Leukefeld, 2001). Although this approach has been applied to other models (e.g., Benning, Patrick, Hicks, Blonigen, & Krueger, 2003), it has largely utilized the FFM. Given the trait model is a maladaptive variant of the FFM (Krueger et al., 2012), this literature is readily applicable to the current analysis. For example, Lynam and Widiger (2001) proposed that PDs could be assessed by correlating individuals’ trait profile (i.e., their scores on each trait within a model) with the prototypic trait profile for each PD. These profile-matching correlations have been used in a number of studies and have shown appreciable convergence with instruments designed to assess DSM-IV PDs (Lawton, Shields, & Oltmanns, 2011; Trull, Widiger, Lynam, & Costa, 2003). In the current report, we calculated the Pearson correlation between an individual’s full PID-5 profile and the trait profiles for each PD. The trait profiles for each PD were created by coding assigned traits as a 1 and unassigned traits as 0. Although this coding scheme lacks nuance, it has been used previously for this purpose and represents the most compelling option available (Samuel & Widiger, 2004).
An obstacle to the application of such an approach is the necessity of calculating profile correlations, which might limit its clinical utility (Miller, Bagby, Pilkonis, Reynolds, & Lynam, 2005). A more simplified option is to sum an individual’s mean or standardized scores for the traits that characterize each PD. This would create an overall score that captures the degree to which a person has traits relevant to a given PD. For example, to assess BPD using this method, one would simply add the scores from each of the seven PID-5 traits that characterize BPD. Researchers also have utilized this summing approach with the FFM and found that it corresponded quite highly with the profile-matching method and obtained significant correlations with extant measures of the DSM-IV-TR PDs (Miller et al., 2005). Nonetheless, a potential limitation of this approach is that it considers the general elevation of a profile but does not take into account its shape (Furr, 2010).
A final and even simpler method of assessing PD types using a dimensional trait model is to simply count the number of traits assigned to each PD that an individual has elevated. For example, to score BPD by this method one would simply need to examine the seven assigned traits and determine how many reached the threshold for elevation. This count could then serve as an individual’s dimensional score for the PD, similar to counting the number of diagnostic criteria endorsed. This counting method has the advantage of being extremely easy to implement, but creating dichotomous indicators from dimensional trait scores sacrifices valuable information (e.g., Markon et al., 2011).
Thresholds for Categorical Diagnosis
Because they were developed specifically for the DSM-5 Section III model, the diagnostic algorithms require validation in a variety of samples to determine how well they are able to reproduce the nomological network of the DSM-IV-TR PDs. As the DSM-5 Section III algorithms require the presence of specific traits, they can be scored only within a categorical framework. Thus, the current study tests the algorithms to determine how well they capture the categorical PD diagnoses. We also compare the performance of these algorithms with three other possible thresholds for assigning a categorical diagnosis. Although we recognize that any attempt to set boundaries between normal and abnormal personality is inherently arbitrary (Widiger, Frances, Spitzer, & Williams, 1988), we selected these alternative thresholds on the basis of continuity with past diagnostic systems and sought to balance thoroughness with the practical limits of the trait assignments themselves (e.g., there are only two possible thresholds for narcissistic PD given only two traits are assigned).
One such alternative we considered was a monothetic approach, which required elevations on all traits assigned to a given PD in order to qualify for the diagnosis. This threshold has historical precedent as it was the diagnostic approach for some PDs within DSM-III (APA, 1980) and prior editions of the manual. One practical advantage of a monothetic threshold is maximizing homogeneity with categories, as all qualifying persons would share those same traits. For example, given seven traits are used to define BPD within the Section III PD model, the monothetic option requires an elevation on all seven traits to reach the diagnosis.
A second alternative diagnostic threshold—that is most similar to the polythetic system of DSM-IV-TR—is requiring half (or one more than half) of the traits be present to signify diagnosis. For example, this would require the presence of four of the seven traits to assign a BPD diagnosis. Such an approach is most comparable with the diagnostic practices for the DSM-IV-TR PDs as well as other mental disorders. Furthermore, this polythetic approach avoids pitfalls associated with monothetic approaches (e.g., overly restrictive) and allows the inclusion of indicators that are quite helpful for assigning the diagnosis but are not always present (Widiger & Frances, 1985). We also note that a polythetic approach results in greater frequency of the PD diagnoses compared with the monothetic option. Nonetheless, an accompanying difficulty is the likelihood of significant heterogeneity within diagnoses, a criticism that has been repeatedly raised against the existing categories for the PDs (Bornstein, 1998) and across the manual.
A final threshold we considered for comparison purposes is that even a single one of the traits for a PD might be enough to signify the diagnosis. This approach lacks the historical precedent of the other two alternatives but has the advantage of maximal flexibility in assigning diagnoses. However, we anticipate it would greatly complicate differential diagnosis and dramatically increase the frequency of the diagnoses. Thus, our aim in evaluating it within this study is primarily inclusiveness as well as to provide a greater context for understanding the important trade-offs among the different thresholds.
Determining When a Given Trait Is “Elevated”
To this point we have focused on the number of traits that must be present to qualify for the diagnosis. However, the DSM-5 Section III model does not indicate precisely what level of each trait indicates clinical significance. Thus, an important consideration was determining when a given trait should be considered elevated. Here again, we sought to build on the existing literature on personality assessment and diagnosis by adopting both rational and empirical cut points. We rationally chose that a mean score of 2.0 or higher (on the 0-3 scale) indicated elevation on a given PID-5 trait because this value corresponds to the anchor sometimes or somewhat true and because it has been used in previous studies of these traits as indicating that the trait was moderately descriptive of the individual (Samuel et al., 2012). However, we also adopted an empirical cut point by calculating t scores using norms from the nationally representative sample of the PID-5 (Krueger et al., 2012). We considered t >65 to be indicative of a clinically significant elevation on a PID-5 scale as this level indicates the top 7% of a normal distribution and is consistent with the interpretive practices employed by other standardized measures (e.g., Minnesota Multiphasic Personality Inventory-2–Restructured Form; Ben-Porath, 2012). When applicable, we report results using both methods to determine how the rational and empirical cut points compared.
Study Aims
The current report has two aims regarding recapturing DSM-IV-TR PD diagnoses from the DSM-5 Section III dimensional trait model. First, we contrast three possible techniques for scoring the PD types dimensionally from the traits (i.e., correlating an individual’s trait profile with a prototype, summing the mean scores on the assigned traits, and counting the number of assigned traits that are elevated) and determine which best replicates patterns of convergent and discriminant validity. Second, having examined the ability of the DSM-5 Section III traits to capture the variance within the DSM-IV PDs, we turn our focus to categorical diagnosis. We provide an empirical test of the diagnostic algorithms specified within the DSM-5 Section III model and compare their performance with three alternative thresholds for assigning categorical diagnoses via traits to determine which produces frequency rates that most closely approximate current estimates in undergraduate (Lenzenweger, Loranger, Korfine, & Neff, 1997) and population samples (Torgersen, 2009).
Method
The current report utilized a data set combined from two independent data collections. The first sample was collected at a large Midwestern university and has been used in previous publications (Hopwood et al., 2012; Thomas et al., 2012), but the current report represents a novel analysis. It included 808 undergraduate research participants. This group had a mean age of 19.9 years (SD = 2.0) and was 71% female and 84% White. The second sample was from a large university in the Southern United States, had a mean age of 20.7 years (SD = 4.0), and was 74% female, with 70% White and 22% Hispanic. Participants in both subsamples provided informed consent before completing a series of self-report measures. The present report focuses only on the responses to the PID-5 and PDQ-4.
The PID-5 (Krueger et al., 2012) has 220 items that assess 25 maladaptive personality traits. These 25 trait scales have between 4 (submissiveness) and 14 (callousness, depressivity, and risk taking) items that are answered on a 0-to 3-point Likert-type scale. The response anchors are very false or often false, sometimes or somewhat false, sometimes or somewhat true, and very true or often true. The answers for each item within a trait scale were averaged to arrive at an overall elevation for each trait that ranged from 0 to 3.0. Cronbach’s alpha values for the combined samples ranged from .71 (suspiciousness) to .96 (eccentricity), with a median of .86.
The PDQ-4 (Hyler, 1994) is a 99-item self-report instrument that assesses each of the diagnostic criteria for the 10 DSM-IV-TR PDs using a true/false format. The PDQ-4 is widely used and has demonstrated reasonable convergence with other PD instruments (Bagby & Farvolden, 2004). PD scales were scored by counting the number of criteria endorsed, and categorical diagnoses were assigned using DSM-IV-TR algorithms. Cronbach’s alpha values in the current sample ranged from .48 (OCPD) to .77 (antisocial), with a median of .67.
Results
Table 1 presents the convergent and discriminant correlations between PD scores from the three dimensional scoring methods and the PDQ-4 PD scales. In order to provide a reference point, the first columns of the table list the range and median discriminant values for each PD within the PDQ-4 instrument. The discriminant values are summarized at the bottom of each column, and the overall median discriminant correlation across all PDs on the PDQ-4 was .40.
Convergent and Discriminant Correlations for PDQ-4 Scores and Three Methods for Scoring PDs From the PID-5.
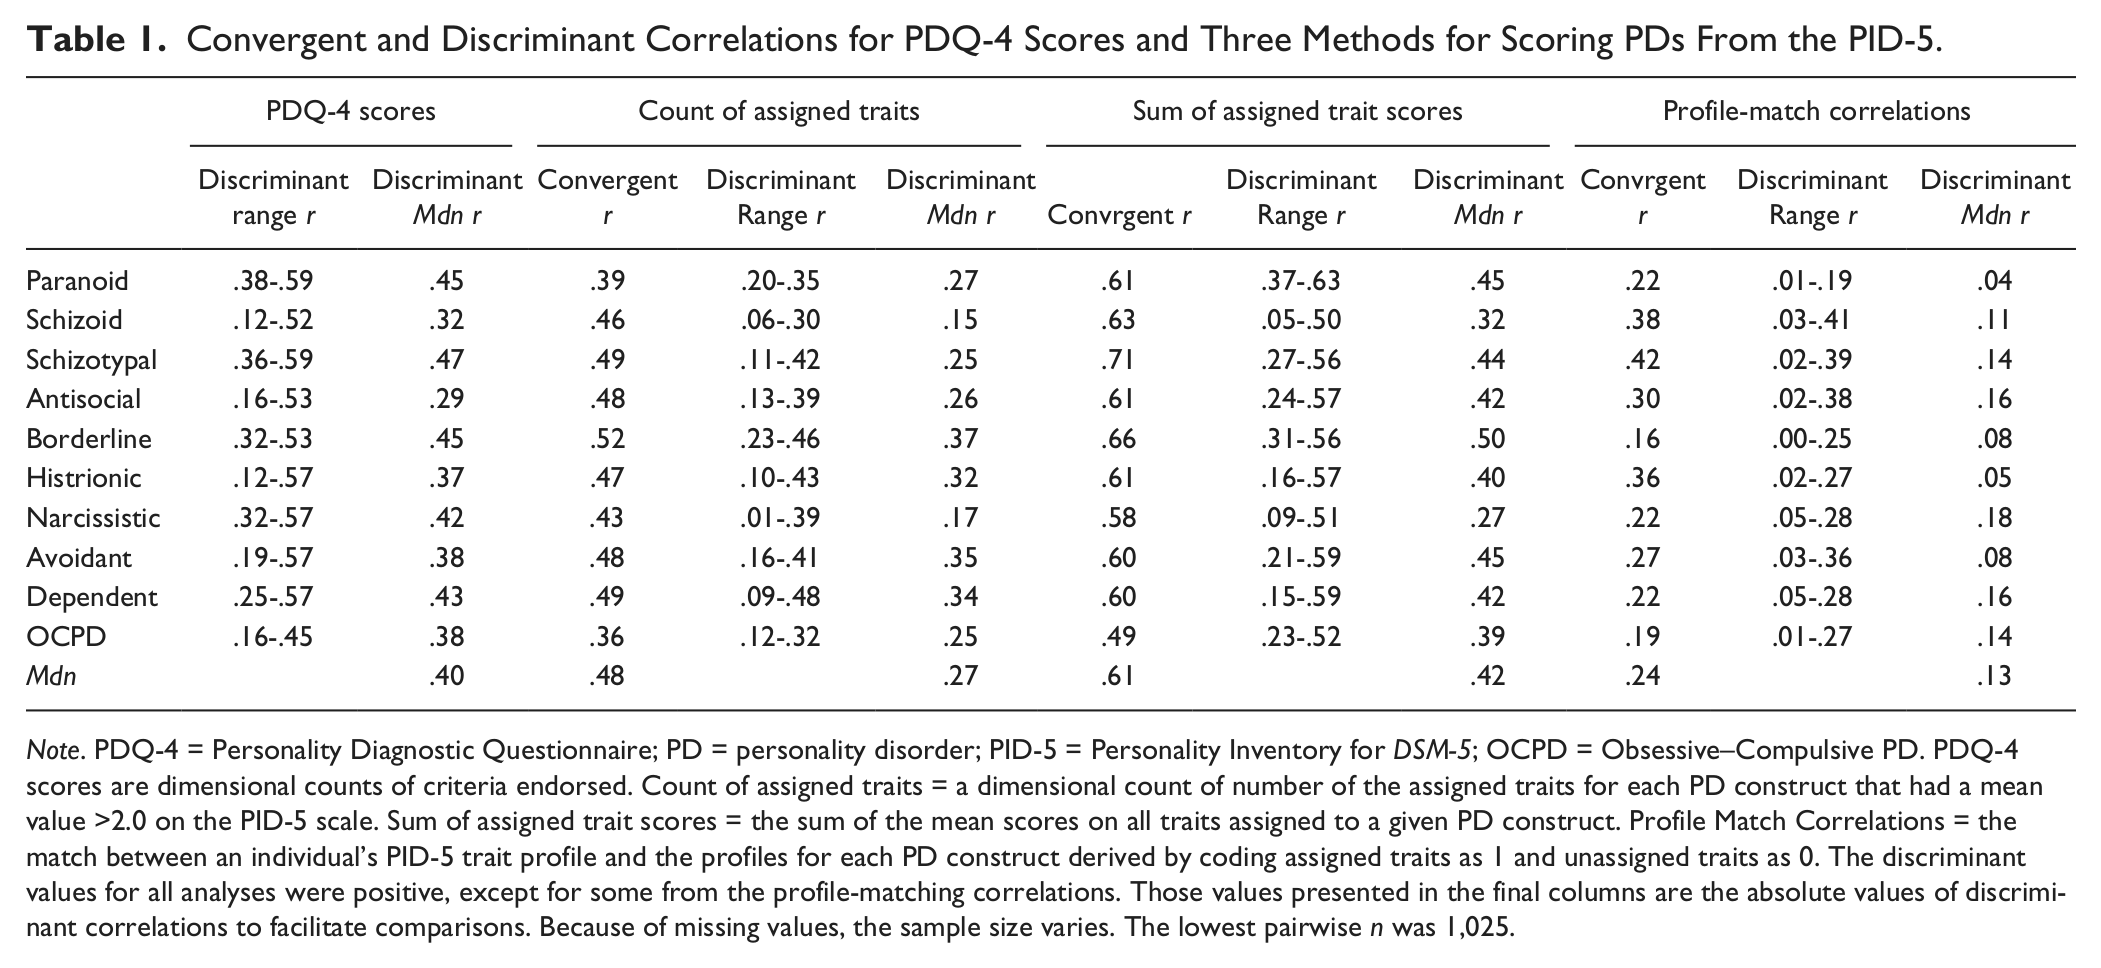
Note. PDQ-4 = Personality Diagnostic Questionnaire; PD = personality disorder; PID-5 = Personality Inventory for DSM-5; OCPD = Obsessive–Compulsive PD. PDQ-4 scores are dimensional counts of criteria endorsed. Count of assigned traits = a dimensional count of number of the assigned traits for each PD construct that had a mean value >2.0 on the PID-5 scale. Sum of assigned trait scores = the sum of the mean scores on all traits assigned to a given PD construct. Profile Match Correlations = the match between an individual’s PID-5 trait profile and the profiles for each PD construct derived by coding assigned traits as 1 and unassigned traits as 0. The discriminant values for all analyses were positive, except for some from the profile-matching correlations. Those values presented in the final columns are the absolute values of discriminant correlations to facilitate comparisons. Because of missing values, the sample size varies. The lowest pairwise n was 1,025.
We first examined the Count method by counting how many assigned traits were elevated (i.e., a mean score ≥2.0) 1 for each PD. These count scores achieved convergent correlations with their respective PDQ-4 scales ranging from .36 (OCPD) to .52 (BPD), with a median of .48. Although there was significant variability among the discriminant values, they were generally lower than the convergent correlations, with an overall median value of .27 across all 10 PDs.
The next set of columns concerns the convergent and discriminant correlations of the Sum method, which added the mean scores for the traits assigned to each PD. These convergent values were notably higher than for the Count method, ranging from .49 (OCPD) to .71 (schizotypal), with a median of .61. The discriminant values had an overall median value of .42.
The final columns concern the performance of the profile-matching method. The convergent values between the profile-matching scores and the PDQ-4 scales were lower than for the other two methods, with a range of .16 (borderline) to .42 (schizotypal) and a median of .24. This method demonstrated sharper discrimination than the others, with an overall median value of .13.
Table 2 presents the frequency of the PDs according to a variety of diagnostic approaches. The first column presents the frequency rates for the DSM-IV-TR PD diagnoses assigned by the PDQ-4. The frequency rates according to this instrument ranged from 6.8% (schizotypal) to 37.0% (OCPD) and provide a backdrop for comparing the results produced by the various PID-5 thresholds. The second set of columns provides the frequency of the six DSM-5 Section III PD types using the specified algorithms. Individuals meeting this threshold were relatively rare within this sample, with rates ranging from 0.1% (antisocial) to 2.1% (borderline) using the rational cut point and from 0.5% (antisocial) to 3.6% (borderline) using the empirical cut point. The remaining columns present the frequency of the PDs using each of the three different thresholds we examined for assigning categorical diagnoses, subdivided to present values using the rational and empirical cut points for considering a trait elevated. When all of the assigned traits were required to be elevated on the PID-5, we found that there were three PDs (paranoid, antisocial, and borderline) for which no individual in our sample met this threshold using the rational cut point. The results were quite similar using the empirical cut point except that one individual now met the criteria for borderline and antisocial. The frequency of the other PDs was only slightly higher, with eight of the PDs occurring in less than 1% of our sample. Again, the differences between rational and empirical cut points were minimal.
Categorical Frequency for PDQ-4 Diagnoses and Three Thresholds for PID-5 Diagnosis.
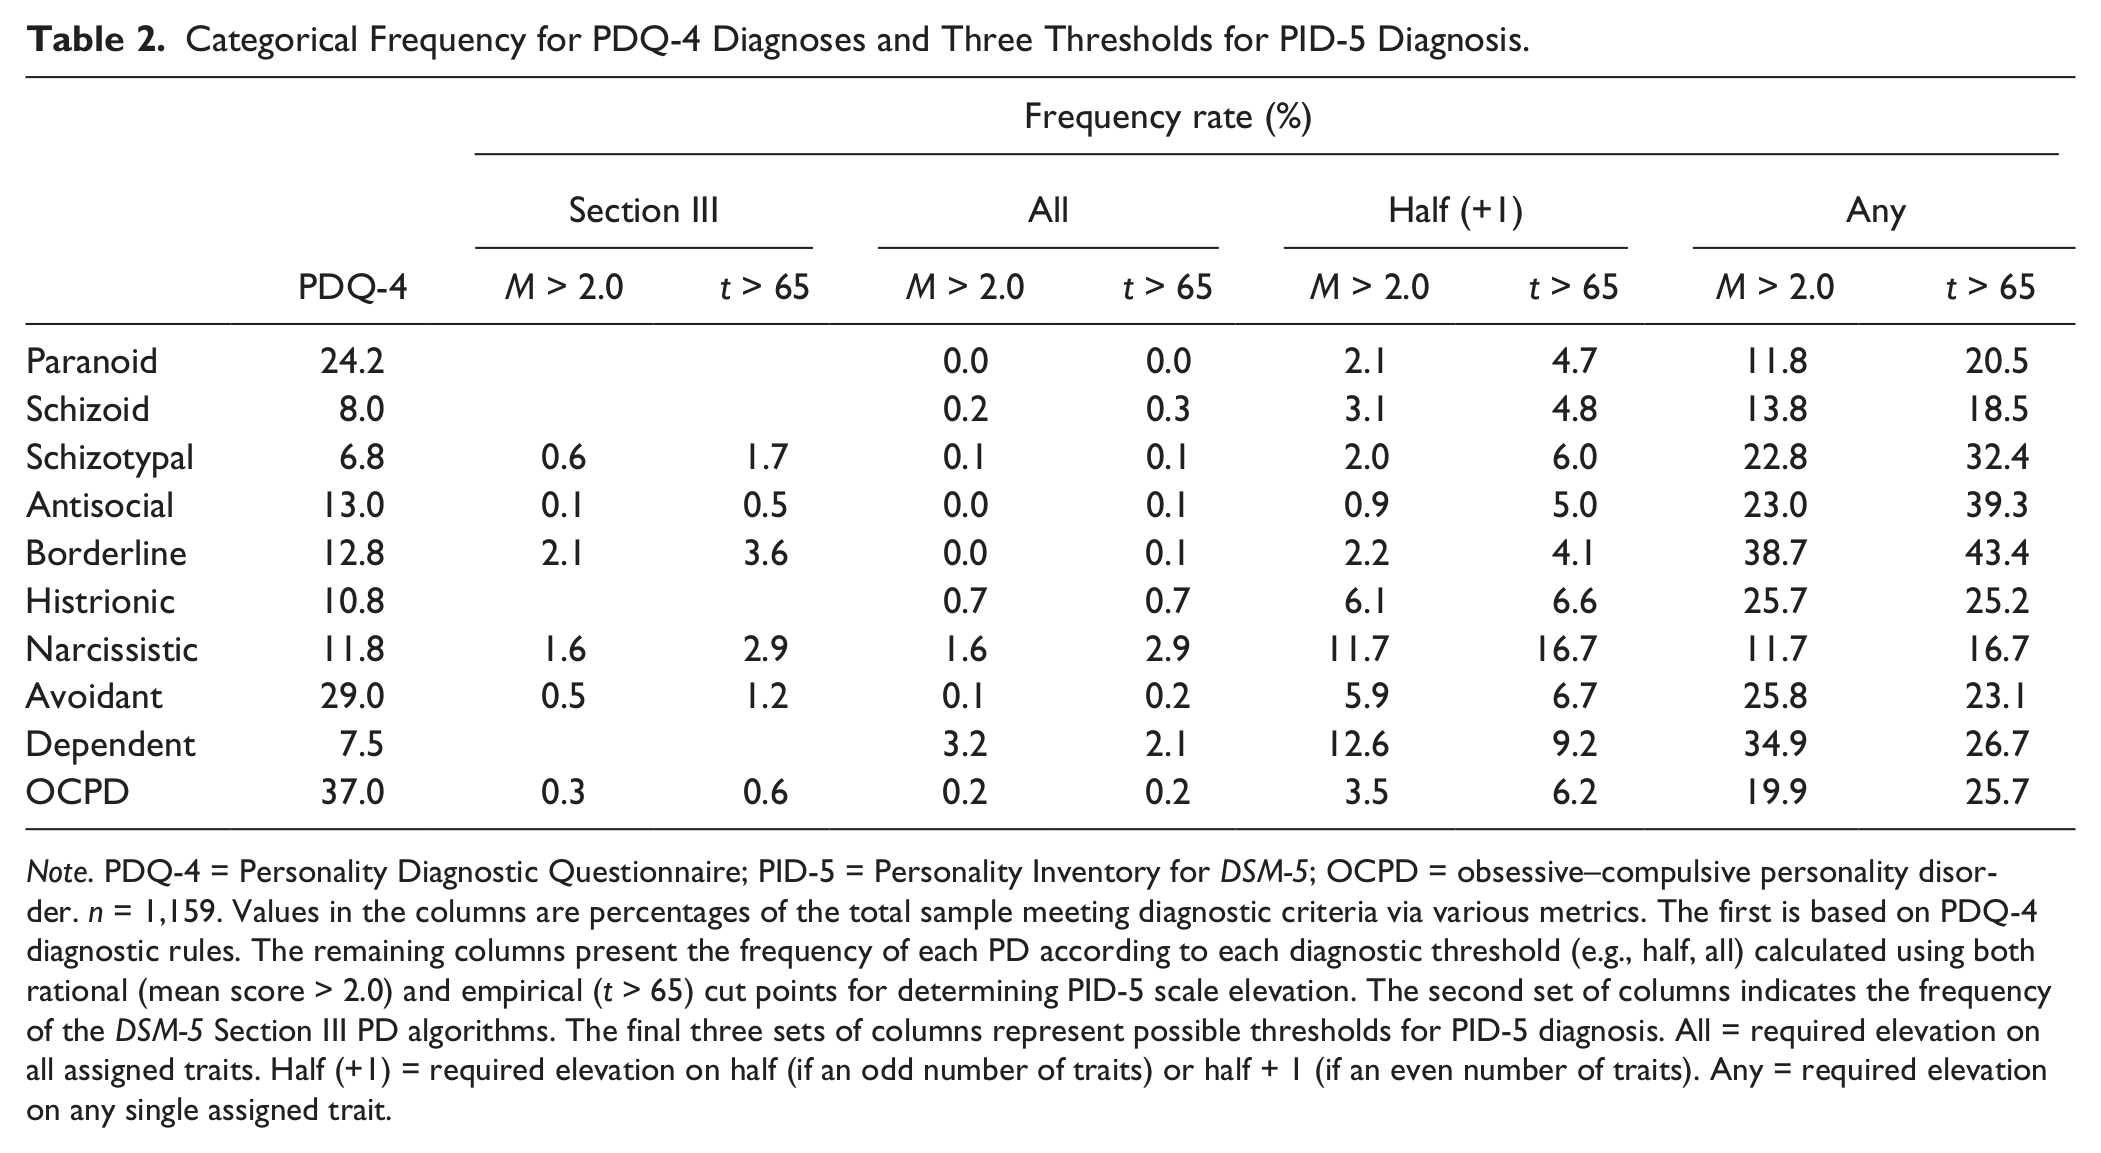
Note. PDQ-4 = Personality Diagnostic Questionnaire; PID-5 = Personality Inventory for DSM-5; OCPD = obsessive–compulsive personality disorder. n = 1,159. Values in the columns are percentages of the total sample meeting diagnostic criteria via various metrics. The first is based on PDQ-4 diagnostic rules. The remaining columns present the frequency of each PD according to each diagnostic threshold (e.g., half, all) calculated using both rational (mean score > 2.0) and empirical (t > 65) cut points for determining PID-5 scale elevation. The second set of columns indicates the frequency of the DSM-5 Section III PD algorithms. The final three sets of columns represent possible thresholds for PID-5 diagnosis. All = required elevation on all assigned traits. Half (+1) = required elevation on half (if an odd number of traits) or half + 1 (if an even number of traits). Any = required elevation on any single assigned trait.
When the threshold was relaxed to require that only half (or one more than half for those with an odd number) of the assigned traits be elevated, the frequency of the diagnoses understandably increased. Rates ranged from 0.9% (antisocial) to 13.4% (OCPD) using the rational cut point. The rates were somewhat higher for nine PDs when using the empirical cut point (dependent was the exception, decreasing from 12.6% to 9.2%). Nonetheless, the marginal increases of between 0.5% for histrionic and 5.0% for narcissistic (increasing from 11.7% to 16.7%) were notable but not substantial. Finally, we evaluated the estimated frequencies when a diagnosis would be indicated when any of the assigned traits was elevated. We note that the rate for narcissistic PD was identical to the prior columns because it has only two assigned traits and thus the threshold of “any” trait was redundant with “half” of the traits. The estimated frequency for the remaining PDs increased substantially when only one assigned trait was required. Using the rational cut point, the rates ranged from 11.8% (paranoid) to 38.7% (borderline) of our sample. The rates using the empirical cut point were somewhat higher than for the rational cut point, ranging from 16.7% (narcissistic) to 43.4% (borderline). In some cases the increase in prevalence could perhaps be considered meaningful (e.g., antisocial increased from 23.0% to 39.3%), but most were surprisingly comparable considering the independent derivations of the two cut points.
Discussion
A crucial question that any alternative model of PD must answer effectively is how well it can capture the important variance encoded within the existing diagnostic constructs. Thus, we first examined three candidate methods for calculating dimensional scores for the DSM-IV-TR PDs from the PID-5 traits. Importantly then, an overarching conclusion from our results is that all three methods for calculating PD scores from the PID-5 traits correlated at least moderately with PDQ-4 scales. This finding supports the ability of the DSM-5 Section III traits to capture variation in DSM-IV PD diagnoses, thereby attesting to the relevance of traits for delineating historically recognized forms of personality pathology.
Nonetheless, there was also significant variation in the magnitude across the three methods. It was clear that the Sum method, which added the mean scores from each of the assigned traits, achieved the highest convergent correlations (Mdn = .61). In fact, these convergent correlations were as high as, and at times even higher (i.e., schizoid, schizotypal, histrionic, and OCPD) than, the internal consistency of the PDQ-4 scales themselves, suggesting this method was quite effective at reproducing the DSM-IV-TR PD diagnoses. The Sum method also obtained relatively large discriminant correlations with the other PD constructs (overall Mdn = .42). These large discriminant values most closely approximated the discriminant correlations obtained within the PDQ-4 instrument (overall Mdn = .40). This level of overlap is by no means unique to the PDQ-4 and has long characterized the PD diagnoses (Clark, 2007). Thus, although the discriminant validity of the Sum method might be considered problematic from a construct validity perspective, this method appears most successful at replicating the PDs as they exist within DSM-IV-TR, which was the aim of the current report.
The Count method (whether computed using a rational cut point or computed using an empirical cut point) also correlated reasonably well with the PDQ-4 scores, but the magnitude of convergent and discriminant correlations was reduced. This suggests, not surprisingly, that the Count method sacrifices valuable information by converting the continuous PID-5 trait scores into categorical indicators (i.e., Markon et al., 2011), making it a less attractive scoring option.
The relatively weak convergence for the profile-matching method was perhaps surprising as it is the only method that fully utilizes the information across the PID-5 (i.e., it considers an individual’s scores on all PID-5 traits, not just those assigned to a given PD). Furthermore, when used with the FFM this method has evinced robust convergence with DSM-IV-TR PD measures (Miller, 2012). A likely explanation for its relatively poorer performance in the current study is that the calculation of profile-matching correlations in FFM studies typically compares an individual’s profile with empirical prototypes comprising dimensional ratings on each trait, such as those provided by researchers (Lynam & Widiger, 2001) or clinicians (Samuel & Widiger, 2004). In contrast, the current study utilized PD prototypes that comprised a series of 1s and 0s indicating which traits were and were not assigned to each PD. It is quite likely that the performance of the profile-matching method would be improved through the use of similar empirical prototypes (e.g., Samuel et al., 2012). Nonetheless, because these empirical prototypes differ from the official trait assignments provided in DSM-5 Section III, their use would also alter the definition of the DSM-IV-TR PDs and dilute the method comparison that we emphasized in this report. In this regard, it is also important to acknowledge that our results do not consider possible alternative conceptualizations that might include more or fewer traits assigned to each PD. Future research is needed to compare alternative descriptions and evaluate their performance.
Categorical Agreement
Although continuous scores are more valid and typically more useful in research and clinical settings, there are a variety of situations in which categorical PD diagnoses have been, and may continue to be, used (e.g., completing forms for insurance reimbursement, studying prevalence rates). Thus, having demonstrated that the PID-5 trait scores can reasonably capture the variance within the existing diagnostic constructs, we turned our attention to categorical diagnosis. Specifically, we used a large undergraduate sample to provide the first empirical cross-validation of the specific DSM-5 Section III algorithms in the published literature.
The frequency rates reported in Table 2 suggested that the specific algorithms presented in DSM-5 Section III would likely result in lower rates than have been found in epidemiological studies within community samples (Torgersen, 2009). Furthermore, this finding was consistent across two distinct methods for determining whether individual PID-5 traits were significantly elevated. Overall, this study indicated that regardless of whether trait elevation was defined by a rational cut point (i.e., a mean score indicating a person rated the items on a scale as at least sometimes or somewhat true of them, on average) or an empirical cut point (i.e., a t score >65, indicating statistical deviance from an independent normative sample), results were similar.
The pattern of lower frequency rates in our study compared with prior findings was particularly evident for some PDs. For example, antisocial occurred infrequently within our sample (i.e., 0.1% or 0.5%) compared with a median prevalence of 1.1% across 12 population-based studies. The frequency rates resulting from these algorithms are more comparable with rates of diagnosis of DSM-IV-TR PDs within another student sample (Lenzenweger et al., 1997). For example, the rate of antisocial in that sample was 0.6%. The diagnostic frequency reported by Lenzenweger et al. (1997), however, results from the application of a two-stage procedure of administering a self-report screener that was later confirmed by a semistructured interview for a randomly selected subsample of the participants. Such a procedure is more restrictive than we employed; thus, one would expect our sample to evince greater, rather than lower, frequency.
An additional point of consideration when examining the estimated frequency rates reported here is that the traits are only one aspect of the hybrid system in DSM-5 Section III. In addition to elevations on one or more pathological traits, an individual must also evince significant impairment in self- or interpersonal functioning (Criterion A) to qualify for a PD diagnosis. Thus, the frequency rates listed in Table 2 should be considered upper estimates of what might be obtained when using the Section III’s alternative diagnostic system. This provides even more support for the suggestion that frequency rates for algorithm-assigned diagnoses are likely to be lower than current prevalence estimates.
As a comparison for the DSM-5 Section III algorithms, we also evaluated three alternative thresholds for assigning categorical diagnoses. Similar to the algorithms, requiring elevations on the PID-5 for all assigned traits resulted in particularly infrequent diagnoses, with rates lower than 1% for eight PDs. For instance, our sample suggests that there are likely very few individuals who have significant elevations on all seven traits for borderline or antisocial PDs. Although there are advantages to a monothetic approach, such as enforced homogeneity within the categories, a drastic decrease in prevalence might be considered problematic (Blashfield, Blum, & Pfohl, 1992). In contrast, requiring an elevation on only one assigned trait created unrealistically high frequency rates within our sample that would only exacerbate the problem of heterogeneity. Instead, our results suggest that the threshold requiring elevation of half the traits produced estimates that were most consistent with existing prevalence rates (Torgersen, 2009). It is worth noting again that the reliance on polythetic criterion sets to define mental disorders has been criticized for producing heterogeneity within categories (Bornstein, 1998), which complicates the development and application of treatment approaches. Nonetheless, we emphasize again that our aim herein was to most closely replicate the DSM-IV-TR PD types rather than to suggest a novel or more ideal approach. Thus, the most general conclusion is that these findings provide important evidence that the DSM-IV-TR PD types can be approximated using the dimensional trait model. Furthermore, we demonstrated that the categorical frequency rates using this model can be adjusted up or down by changing cut scores. In this way, our findings are relevant within any variety of polythetic or monothetic diagnostic algorithms.
It is worth noting that the present analyses considered only the traits as they are assigned to each PD within DSM-5 Section III. This is particularly salient for the categorical diagnostic thresholds as the number of traits for each PD varies tremendously. For example, it is obviously a more stringent requirement for an individual to have all seven traits elevated for antisocial than it is to have the two traits assigned to narcissistic PD. Although some of this variation may be explained by inherent differences in the breadth of the PD constructs within DSM-IV, these unequal requirements have clear implications for the estimated frequency rates of these categorical diagnoses and could complicate public health decisions regarding the relative burdens of specific PDs.
We also note that some of our results are dependent on the score on any given PID-5 trait necessary to be considered “elevated.” In the current report, we tested rational and empirical cut points that appeared quite reasonable and defensible. Indeed, the use of standardized scores calculated on the basis of normative scores from a representative sample is the predominant method of scoring psychological tests. Nonetheless, choosing other cut points would affect the rates for categorical diagnoses in significant ways so it would be useful for research to investigate alternatives from either a rational or empirical perspective. Research might even establish norms for determining which levels of individual traits, or combination of traits, are sufficiently extreme to warrant diagnosis (Miller et al., 2008).
Limitations
This report provides an important step in the investigation of how the DSM-5 Section III trait model can be used to recapture DSM-IV-TR PD diagnoses, but it is limited in several respects. First, although the sample was relatively large, it relied solely on undergraduates. University students are more highly educated and likely to be from higher socioeconomic backgrounds than members of the overall community-dwelling population. These factors are associated with greater psychological health and reduced prevalence of most PDs (Grant et al., 2004), which affects our categorical findings.
Additionally, the results we report are predicated on self-report instruments of the DSM-IV-TR PDs and the DSM-5 Section III traits. Given a portion of our results focus on the categorical prevalence of PD diagnoses, both of these factors are important to consider when interpreting our findings. To be certain, it will be crucial for future research to examine other methods of assessment for both models, such as ratings by treating clinicians or semistructured interviews within a wide variety community and clinical samples. Finally, we note that our results rely on the measurement of the PDs provided by the PDQ-4. Although the PDQ-4 is advantaged by explicit ties to DSM-IV-TR diagnostic criteria, research has demonstrated that it diagnoses at higher levels than other instruments (Bagby & Farvolden, 2004), which complicates the comparison of frequency rates in the current sample. Nonetheless, despite these limitations, we believe the present data remain useful as no existing empirical publication has yet examined the performance of the DSM-5 Section III PD model and its algorithms. Indeed, the Section III model was originally approved for Section II of the manual by the DSM-5 Task Force, but ultimately the APA Board of Trustees decided it should be included in Section III, with the aim of encouraging additional research on this model before its possible adoption in a future version of the manual. The current results bear directly on this question and thus have potential value in building such a literature on this alternative system.
Conclusions
A primary conclusion from our results is that the dimensional trait model included in DSM-5 Section III is largely able to account for the reliable variance within the DSM-IV PDs, regardless of the scoring method one chooses. This is a crucial first step in considering a new diagnostic framework in that it provides support for a novel dimensional system and provides a bridge to existing models. Of the three methods for producing dimensional PD scores using the PID-5 traits, we found that the optimal method for scoring DSM-IV-TR PDs, in terms of convergent and discriminant validity, was to sum an individual’s scores on those specific assigned traits. Furthermore, we then applied categorical decision rules to determine the frequency of the PDs within our sample. Our results suggested that the scoring algorithms provided in DSM-5 Section III are likely to lower the prevalence of the DSM-IV-TR PDs, which has the potential to reduce the effectiveness of the Section III model for bridging with current definitions and could complicate public health decisions. Of the three alternative thresholds for categorical diagnosis that we examined, it appeared that requiring half of the assigned traits would most closely approximate current prevalence estimates. Although more research is clearly necessary that will address the limitations of this effort, our findings provide a first step toward establishing an empirical basis for guiding assessment decisions and implementing the hybrid system in DSM-5 Section III.
Footnotes
Declaration of Conflicting Interests
The author(s) declared no potential conflicts of interest with respect to the research, authorship, and/or publication of this article.
Funding
The author(s) received no financial support for the research, authorship, and/or publication of this article.