
Abstract
Research has demonstrated strong connections among working memory (WM), higher-level cognition, and academic achievement. Despite the importance of WM, currently available WM tests have practical limitations and lack comprehensive coverage of multiple WM components. The Working Memory Battery (WOMBAT) includes nine subtests measuring multiple content domains and processing demands, in accordance with contemporary WM theoretical frameworks. The current study evaluated the WOMBAT factor structure and identified misfitting items using confirmatory factor analysis and Rasch modeling with scores from 125 adolescents and 177 adults (N = 302). Overall, results indicated the WOMBAT measures separate Verbal, Static Visual-Spatial, and Dynamic Visual-Spatial dimensions, and that more than 98% of items contribute to measurement of those dimensions. This provides support for the theoretical organization of WM into three distinct content domains in the WOMBAT. Misfitting items were identified using infit and outfit indices for further review to improve reliability and stability. Results also demonstrated adequate person separation and Rasch person reliability and item reliability. Test–retest reliability and internal consistency coefficients suggest adequate reliability for early-stage research, but further refinement is needed before the WOMBAT can be used for individual decision making. Implications for future test development and research on the WM construct are provided.
Research has demonstrated working memory (WM) is one of the most important constructs in understanding higher-level cognition (Daneman & Carpenter, 1980; Engle, Kane, & Tuholski, 1999) and academic achievement (Alloway & Alloway, 2010; Dehn, 2008; Evans, Floyd, McGrew, & Leforgee, 2002; Gathercole, Alloway, Willis, & Adam, 2006; Gathercole, Tiffany, Briscoe, Thorn, the ALSPAC Team, 2005; Raghubar, Barnes, & Hecht, 2010; Swanson & Siegel, 2001; Swanson, Zheng, & Jerman, 2009). WM deficits have been implicated in numerous clinical conditions, including attention-deficit/hyperactivity disorder (ADHD), autism spectrum disorders, learning disabilities (LD), Down’s syndrome, Williams syndrome, specific language impairment, and developmental coordination disorder (Alloway, 2011; Gathercole et al., 2006; Swanson, 1993). Swanson (1993) has presented evidence for the importance of understanding WM deficits in children with LD. Most concerning is that WM places constraints on children’s learning and acquisition of academic skills (Gathercole et al., 2005). This suggests that WM deficits in individuals with learning difficulties, if gone undetected, will continue to limit skill acquisition and achievement well past the early grades. Consequently, there is a strong need for the development of theoretically driven cognitive measures that can identify children who need help early in their schooling, before cognitive difficulties begin to affect academic performance (Dehn, 2008).
Fortunately, contemporary research demonstrates WM is malleable. Children identified as a -risk for learning difficulties in reading and/or mathematics due to WM deficits can be provided interventions specific to WM (e.g., Dehn, 2008; Holmes, Gathercole, & Dunning, 2009; Klingberg et al., 2005; Olesen, Westerberg, & Klingberg, 2007; Swanson & O’Connor, 2009; Thorell, Lindqvist, Nutley, Bohlin, & Klingberg, 2009; Westerberg & Klingberg, 2007). There is some evidence that traditional interventions that aim to teach the child WM strategies—such as chunking (Parente & Herrman, 1996), organizational devices, rehearsal training (Turley-Ames & Whitfield, 2003), and mnemonic devices (Mastropieri, Sweda, & Scruggs, 2000)—can improve memory and learning in children with LD (Mastropieri et al., 2000).
In addition, new approaches for directly intervening on WM are gaining in popularity and have begun to show evidence of effectiveness for improving WM—at least in the short term. These programs target increased WM capacity through computerized WM training (Jaeggi, Buschkuehl, Jonides, & Shah, 2011; Klingberg, 2010). Computerized WM interventions such as COGMED (Klingberg, 2010) have been shown to improve WM in children with ADHD (Holmes, Gathercole, Place, et al., 2009; Klingberg et al., 2005), to improve WM and reading comprehension in children with special needs (Dahlin, 2011), and to improve mathematical instruction memory and problem solving 6 months after training (Holmes, Gathercole, & Dunning, 2009). In addition, several studies have shown near transfer effects to WM tasks not included in the COGMED program itself (Holmes, Gathercole, & Dunning, 2009; Holmes, Gathercole, Place, et al., 2009; Jaeggi et al., 2011; Klingberg et al., 2005; Klingberg, Forssberg, & Westerberg, 2002; Thorell et al., 2009; Westerberg et al., 2007). More evidence is needed to support the generalizability and sustainability of treatment gains from these programs, but this area of research is promising.
Despite the demonstrated importance of the WM construct, there are limitations in currently available measures used to estimate WM ability. Most WM measures require significant time, training, and financial resources for individual administration. For example, the Swanson Cognitive Processing Test (Swanson, 1995) and the Working Memory Test Battery for Children (Pickering & Gathercole, 2001) must be individually administered by highly trained examiners and take an hour or more to administer to each examinee. The price of test kits and protocols for these paper-and-pencil batteries may also be prohibitive for some schools and educators.
In addition to practical limitations, currently available WM measures have theoretical limitations—most important, construct underrepresentation. For example, WM tests from major cognitive batteries such as the Wechsler Intelligence Scales for Children–Fourth Edition (Wechsler, 2003) and the Woodcock–Johnson III Tests of Cognitive Abilities (Woodcock, McGrew, & Mather, 2001) are largely verbal, with little representation of visual-spatial WM. However, major theories (e.g., Baddeley, 2000) and psychometric studies of WM have consistently suggested WM includes several related but distinct processing demands and content domains, including at the least a verbal and a visual-spatial component (Buehner, Mangels, Krumm, & Ziegler, 2005; Cornoldi & Vecchi, 2000, 2003; Ferreira, Almeida, & Prieto, 2011; Oberauer, Schulze, Wilhelm, & Süß, 2005; Oberauer, Süß, Schulze, Wilhelm, & Wittmann, 2000; Oberauer, Süß, Wilhelm, & Wittmann, 2003). While verbal WM has particular importance for reading (Daneman & Carpenter, 1980; Gathercole & Pickering, 2000; Leather & Henry, 1994), visual-spatial WM is predictive of mathematics achievement (Bull, Espy, & Wiebe, 2008; Swanson, 2006). Thus, comprehensive measures of WM should include different tests for verbal and visual-spatial WM.
As an additional limitation related to construct representation, few WM tests adequately measure visual-spatial WM components. Research suggests there are at least two types of visual-spatial WM: static or simultaneous visual-spatial WM (remembering static, simultaneously presented spatial locations of static stimuli) and dynamic or sequential visual-spatial WM (remembering dynamic sequences of spatial locations; Cornoldi & Vecchi, 2000, 2003; Kesner, Hopkind, & Fineman, 1994; Lecerf & de Ribaupierre, 2005; Logie, 1995; Mammarella, Borella, Pastore, & Pazzaglia, 2013; Mammarella et al., 2006; Pazzaglia & Cornoldi, 1999; Pickering, 2001; van der Sluis, van der Leij, & de Jong, 2005). Studies examining visual-spatial WM and achievement have not included a distinction for static or simultaneous versus dynamic or sequential visual-spatial WM tasks, but the empirical evidence from cognitive investigations (that did not include achievement) suggests such a distinction may be warranted. Inclusion of separate static and dynamic visual-spatial tasks within a comprehensive WM battery would allow for examination in future studies of possible links between each specific WM domain and different academic achievement areas. In addition, including more specific measures of all the WM components demonstrated by research provides a more comprehensive approach to WM assessment.
Finally, currently available WM tests, in addition to content domains, lack adequate measurement of different processing demands represented in theories of WM. Prominent WM theories (Baddeley & Hitch, 1974; Cornoldi & Vecchi, 2000, 2003; Engle, 2002), and empirical evidence suggest different storage (STM) and processing (WM) demands compose WM (Buehner et al., 2005; Ferreira et al., 2011; Oberauer et al., 2000; Oberauer et al., 2003). In addition to traditional “storage plus manipulation” tasks, such as Digits Backward, Engle (2002) has suggested that tasks including an “interference” component are necessary to comprehensively assess the WM construct. Both STM and WM functions—including those with an interference component (e.g., Daneman & Carpenter, 1980)—are important for reading and mathematics achievement (Swanson et al., 2009; Swanson & Sachse-Lee, 2001).
A multicomponent, theoretically organized measure of WM ability that includes tasks tapping all three domains (verbal, static visual-spatial, and dynamic visual-spatial) and demands (STM or storage, WM, and WM with an interference component) and can be efficiently administered and interpreted by school staff would allow more children with WM deficits to be identified for intervention before these deficits negatively affect academic achievement. In addition, such a measure would aid in intervention planning for children with specific WM problems (e.g., verbal WM deficits or static visual-spatial STM/storage deficits) that may differentially affect specific academic achievement areas.
The WOMBAT
The Working Memory Battery (WOMBAT) was developed to address the major limitations of currently available WM tests. The WOMBAT is a multicomponent, online measure of WM designed for use with school-aged children and adolescents, as well as adults. It combines the theoretical foundation of experimental WM measures used in laboratory settings with practical aspects suitable for school-based applications. The ultimate goals in the design of the WOMBAT are to help identify children with WM deficits and to guide intervention for individuals with these deficits, from elementary to adult levels. In addition, researchers can use the WOMBAT with children, adolescents, and adults to obtain a profile of participants’ WM strengths and weaknesses.
The WOMBAT was designed based on a theoretical model that comprehensively covers three WM content domains and three processing demands. In addition, it overcomes practical limitations of requiring intensive time, training, and financial resources for one-on-one administration through online administration and scoring. The WOMBAT (a) includes 180 items in nine subtests organized by a guiding conceptual model (see Figure 1), sampling across three domains and three demands from the WM literature and including tasks suggested by multiple WM theories (Baddeley & Hitch, 1974; Cornoldi & Vecchi, 2000, 2003; Engle, 2002) and (b) is administered completely online, with less reliance on highly trained examiners and accessible anywhere with an Internet connection. The current study focuses on psychometric evaluation of the WOMBAT using confirmatory factor analysis (CFA) and the Rasch model. CFA can help determine the dimensionality or factor structure—and therefore the appropriate level of interpretation—of the WOMBAT, while the Rasch model can help identify misfitting items to target during measure refinement.
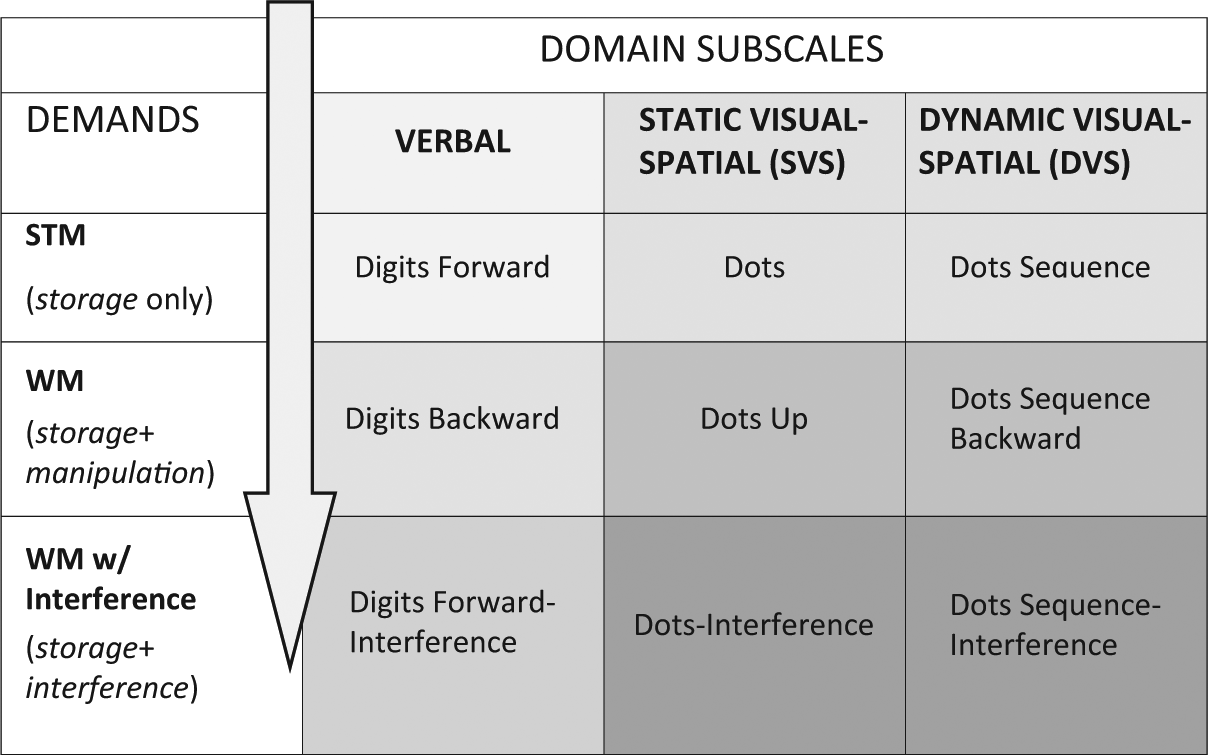
Organization of WOMBAT subtests along domain and demand dimensions. Each domain subscale (Verbal, Static Visual-Spatial, and Dynamic Visual-Spatial) includes three subtests that cover different demands from WM research.
Item Response Theory: The Rasch Model
Item response models are major advances over classical test theory approaches (Embretson & Reise, 2000). Researchers have stressed the need for applying Rasch models to measure development and validation to achieve psychometric support beyond what is available from traditional analyses, such as factor analysis (Smith Conrad, Chang, & Piazza, 2002). Previous studies of computerized and traditional paper-and-pencil WM tasks have examined item difficulty and other measurement characteristics using Rasch modeling (e.g., Ferreira et al., 2011; Pomplun & Custer, 2005). As described by DiStefano and Morgan (2010), Rasch modeling is a one-parameter item response theory model that uses scores obtained on an instrument to calculate the probability that an individual will correctly respond to a particular item, given the person’s ability and the difficulty of the item. The Rasch model is based on the premise that an instrument measures a single underlying dimension, and that items and persons can be arranged in order of difficulty and ability, respectively, along this dimension. The item and person rankings are converted from an ordinal to an interval scale using logarithmic transformation, such that item difficulty values and person ability values can be obtained. This allows for comparisons to be made across individuals (e.g., Person A has twice the ability of Person B on this latent trait), across items (e.g., Item B is twice as hard as Item A), and across time points—which is necessary for calculating meaningful change scores (e.g., Person A did twice as well after 2 weeks of intervention than she did before the intervention). In addition, the Rasch model provides fit indices that aid in identifying items that do not contribute to measurement of the underlying dimension or latent trait measured by the instrument.
The Current Study
The current study focuses on psychometric evaluation of the WOMBAT using CFA and the Rasch model. We address two research questions:
Does the factor structure of the WOMBAT reflect the theoretical organization of WM into three separate domains?
Which items contribute to measurement of the identified WM dimensions, and which items should be flagged for revision due to misfit?
The general dimension or latent trait hypothesized to underlie all items on the WOMBAT is WM; more specifically, however, we hypothesize that the WOMBAT measures three distinct dimensions of WM, as supported by previous literature and theory: verbal, static visual-spatial, and dynamic visual-spatial WM. Alternative models will also be tested to determine the appropriate level of interpretation for the WOMBAT. The best-fitting model will be used to structure Rasch analyses aimed at identifying misfitting items, which can be targeted for refinement to improve reliability and stability of the WOMBAT. This information will guide clinical interpretation of performance on the WOMBAT and inform future test development.
Method
Participants
Because the WOMBAT was designed for clinical, school, and research use with school-aged children and adolescents, as well as for research use with adults, both adolescents and adults were recruited from the University of South Carolina and local public schools. Adults from the University of South Carolina were recruited through the Department of Psychology Participant Pool and received course credit for participation, while participating high schools were recruited by phone and received monetary compensation to be used at the discretion of the principal for anything directly benefitting the school. Adolescents were selected instead of younger children because the WOMBAT is in the early stages of development and the online interface was pilot tested only with adults before the current study. In addition, adolescents and adults are closer to one another in terms of age and cognitive developmental level than are adults and elementary or middle school children. This allows for analysis of adolescents and adults as one sample.
Adults 18 and older gave online consent, and parental consent and online assent were required for minors. Inclusion criteria included the following: normal or corrected-to-normal hearing and vision, fluent English speaker, and not receiving special services for a cognitive disability at the time of test administration.
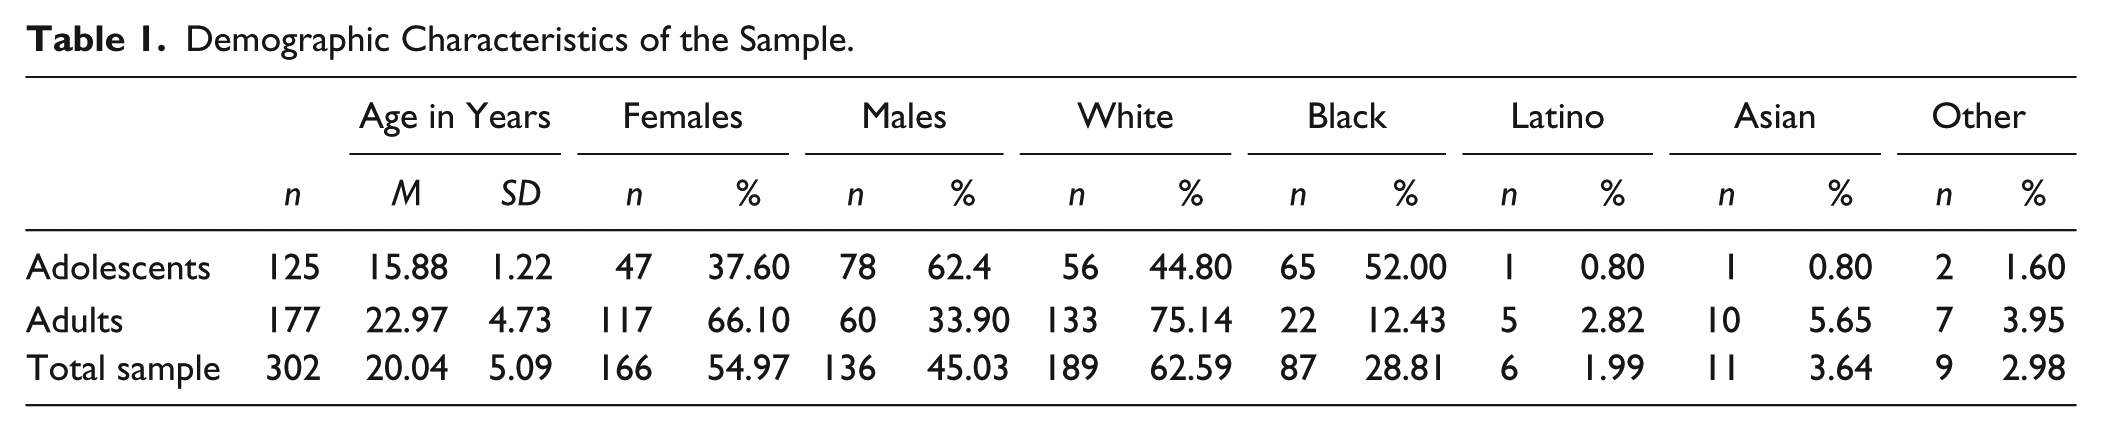
The total sample included 302 total individuals: 177 adults (age M = 22.97, SD = 4.73, Mdn = 21, mode = 21) and 125 adolescents (age M = 15.88, SD = 1.22, Mdn = 16, mode = 15). Adolescent participants all attended a midsize suburban high school in the southeastern United States. Adult participants were undergraduate or graduate students at the University of South Carolina, a large public university in the southeastern United States. Demographic characteristics for adolescents, adults, and the total sample are provided in Table 1. The total sample consisted of 55% (n = 166) women and 45% (n = 136) men and was 63% White, 29% Black, 4% Asian, 3% Other, and 2% Latino. According to 2012 U.S. Census Bureau data, the United States includes 50.8% women, 77.9% White only, 13.1% Black only, 5.1% Asian only, 1.2% American Indian/Alaskan Native only, 0.2% Native Hawaiian/Pacific Islander only, 2.4% two or more races, and 16.9% Hispanic or Latino (U.S. Census Bureau, 2013). Thus, in terms of demographics, women and Black participants were overrepresented, while men and Hispanic or Latino participants were underrepresented.
Demographic Characteristics of the Sample.
Data from adult and adolescent samples were analyzed together because of the proximity in age of adolescent to adult participants and to provide as diverse an ability range as possible to improve estimation capability for item calibrations with the Rasch model. Table 2 shows sample sizes and other descriptive statistics for individual subtests and domains. Depending on the subtest involved, some statistical analyses had sample sizes below the total sample size of 302. The online platform for the WOMBAT does not allow for skipping individual items, but it is possible that attempts to refresh the browser or log out during a subtest (despite instructions warning against this) may cause participants to show missing data for entire subtests. In the adult data, 28 of the total 177 participants had at least one missing subtest (M = 0.68, SD = 1.88, range = 0-8). In the adolescent data, 7 of the total 125 participants had at least one missing subtest (M = 0.22, SD = 0.91, range = 0-6). Thus, complete data for all subtests were available for 267 total participants. Participants’ number of missing subtests was not correlated with their average subtest raw score, r(302) = –.02, p = .0774, suggesting that missing data were unrelated to WM performance. Number of missing subtests was, however, correlated with administration order, r(302) = .99, p < .001. Data were most likely to be missing from the Interference demand subtests, which were administered last (seventh, eighth, and ninth) in the sequence of nine subtests for all participants.
Descriptive Statistics for WOMBAT Domain Subscales and Individual Subtests.
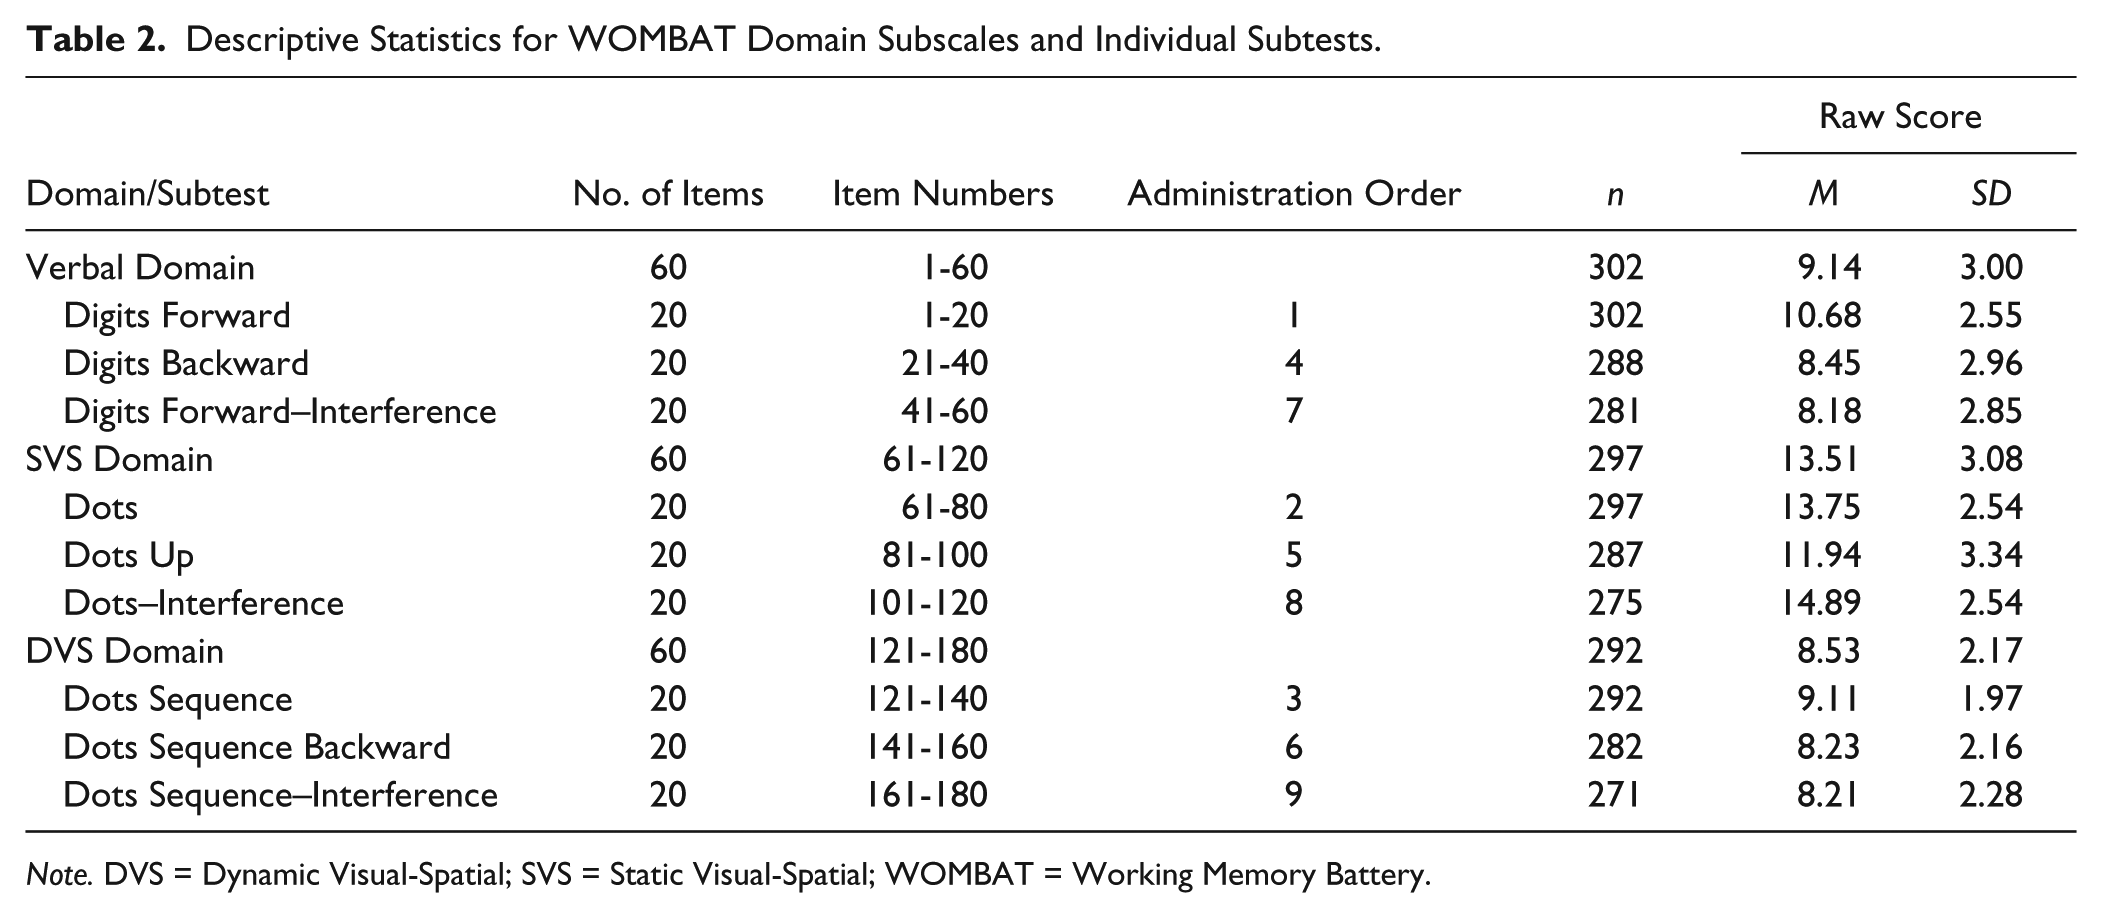
Note. DVS = Dynamic Visual-Spatial; SVS = Static Visual-Spatial; WOMBAT = Working Memory Battery.
The Rasch model (and WINSTEPS software; Linacre, 2005) is capable of estimating item difficulty values for each item with missing data from some persons. Thus, for item difficulty calibration and dimensionality analyses using the Rasch model, only participants with recorded responses for at least one subtest in the particular domain being analyzed were included in calibration for that domain. This resulted in sample sizes of 302 for Verbal, 297 for Visual, and 292 for Spatial domain analyses.
Instrument: The WOMBAT
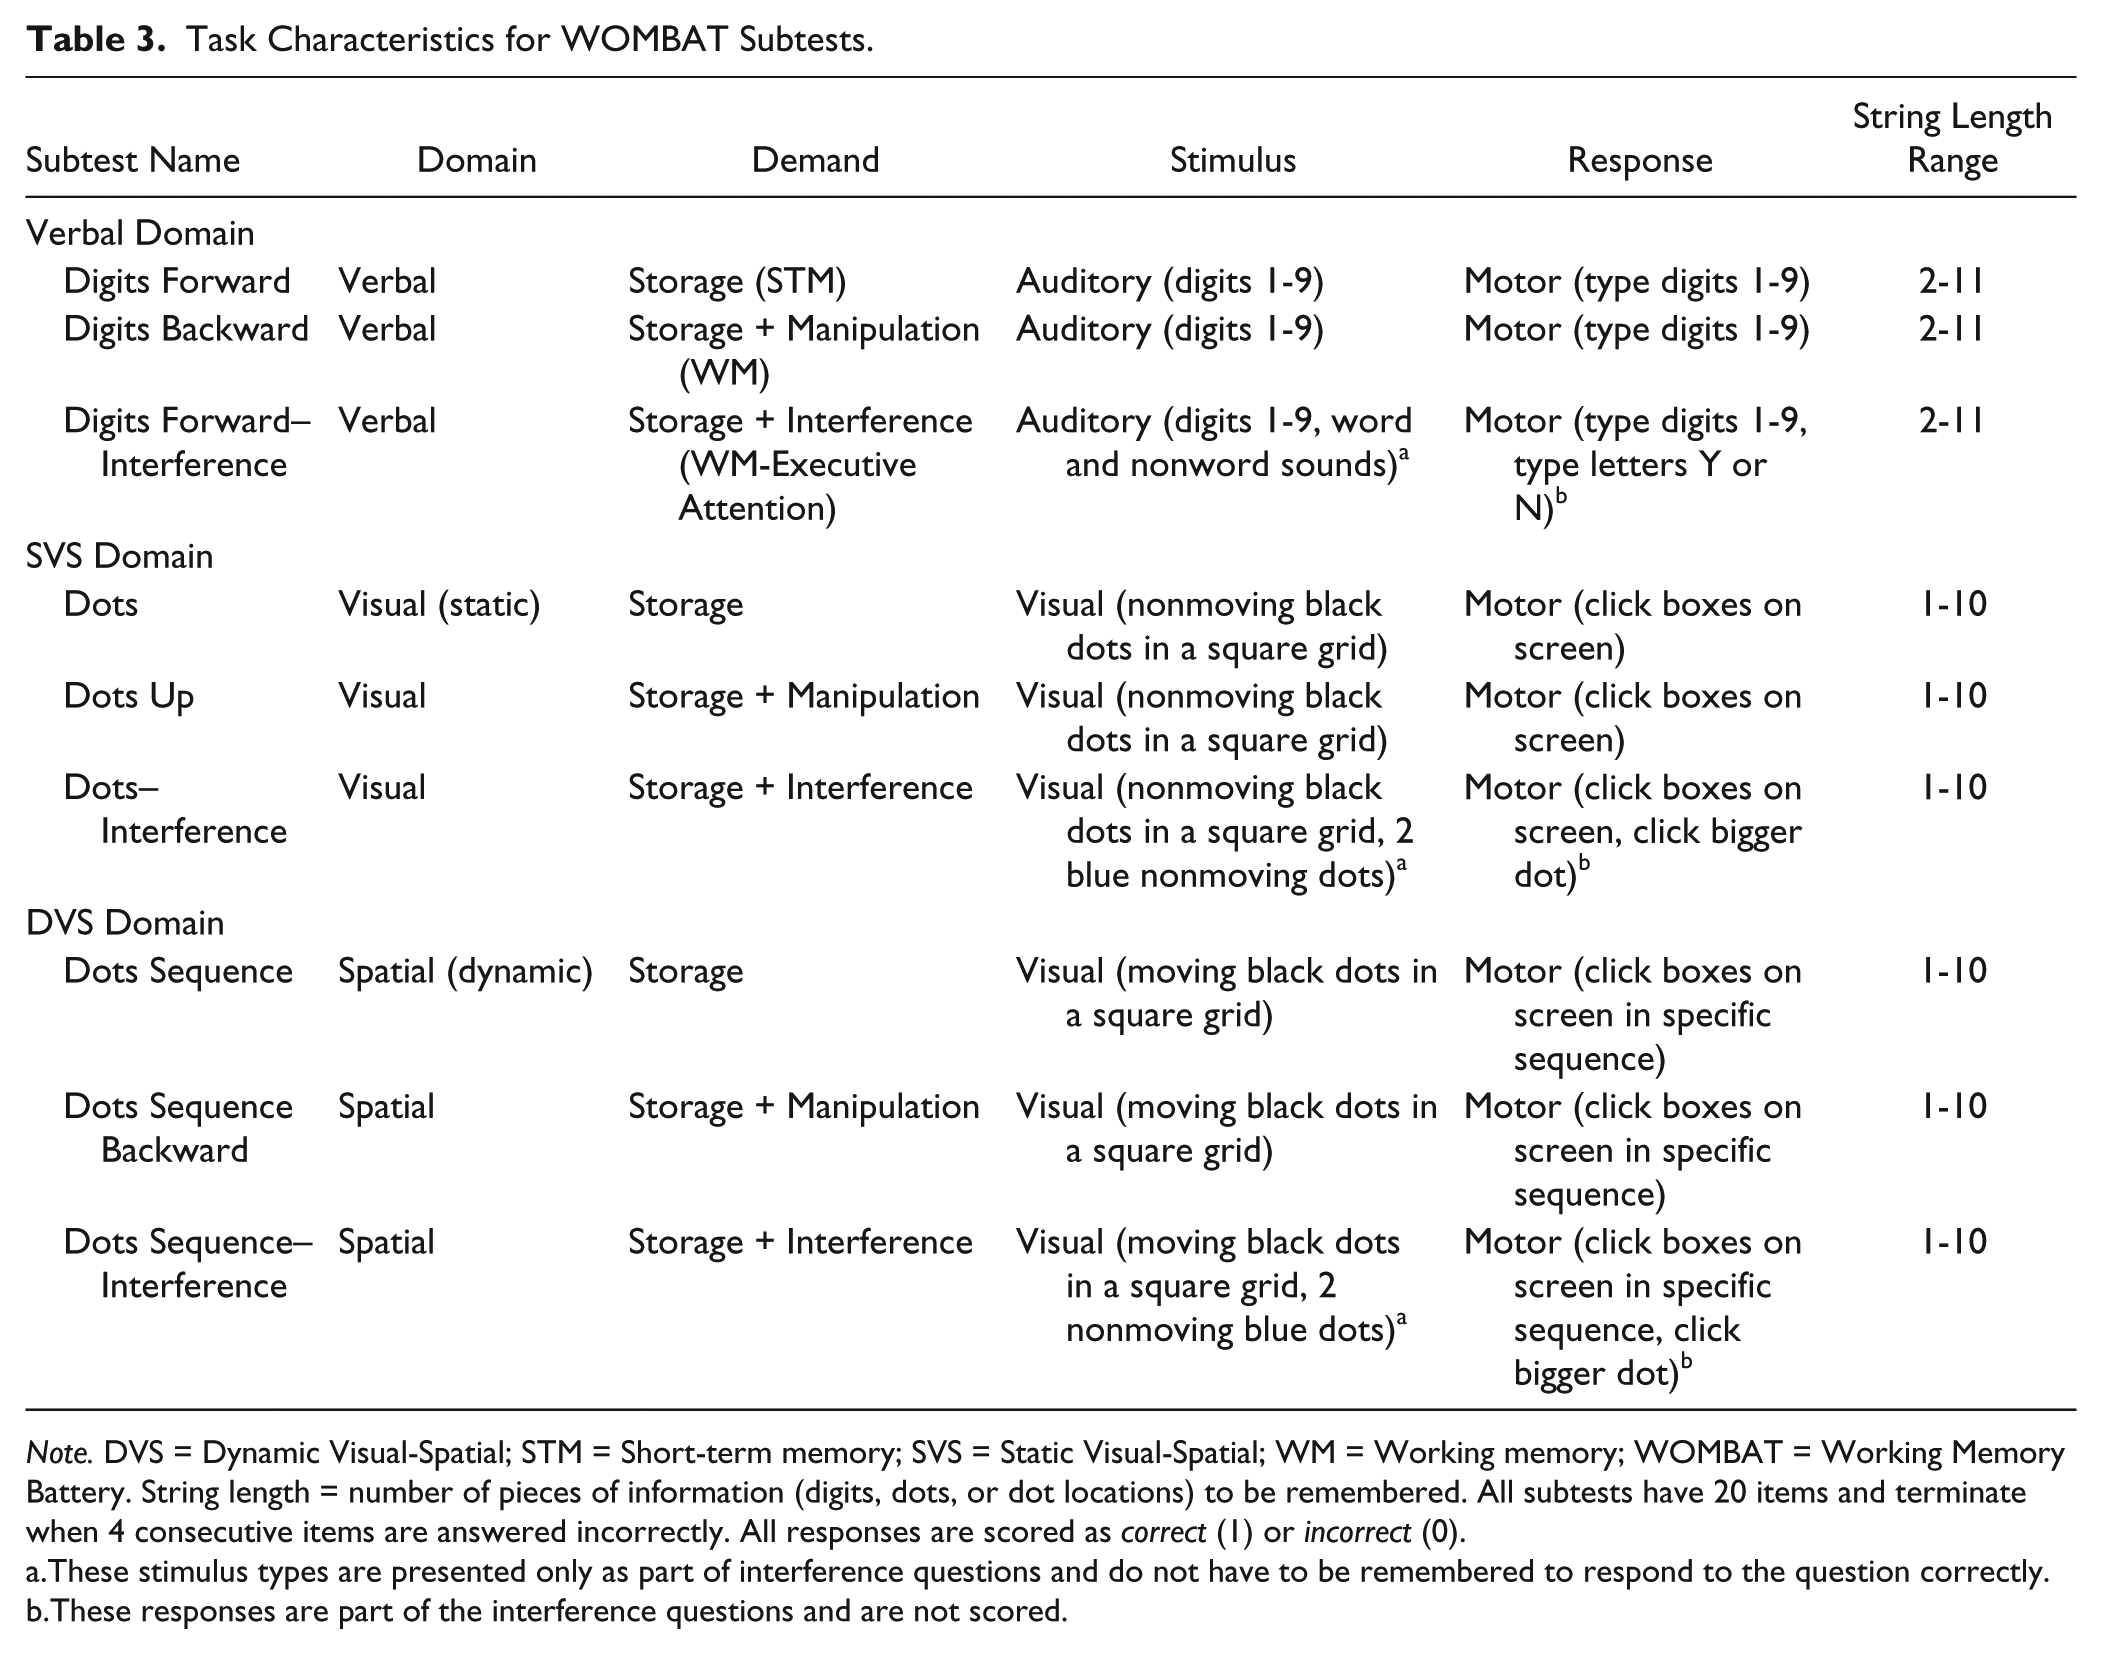
The WOMBAT includes nine separate subtests, each its own WM task, organized by two parameters: WM demand and domain (see Figure 1). The demand parameter includes three types of tasks for different WM functions or processes: storage, storage + manipulation, and storage + interference. The domain parameter includes three types of content to be remembered and manipulated: verbal, static (or simultaneous) visual-spatial (SVS), and dynamic (or sequential) visual-spatial (DVS). There are three subtests for each domain, each a different type of task (a different WM demand). Subtests include the following: Digits Forward (Verbal storage), Digits Backward (Verbal storage + manipulation), Digits Forward–Interference (Verbal storage + interference), Dots (SVS storage), Dots Up (SVS storage + manipulation), Dots–Interference (SVS storage + interference), Dots Sequence (DVS storage), Dots Sequence Backward (DVS storage + manipulation), and Dots Sequence–Interference (DVS storage + interference). Table 3 provides task characteristics for each subtest.
Task Characteristics for WOMBAT Subtests.
Note. DVS = Dynamic Visual-Spatial; STM = Short-term memory; SVS = Static Visual-Spatial; WM = Working memory; WOMBAT = Working Memory Battery. String length = number of pieces of information (digits, dots, or dot locations) to be remembered. All subtests have 20 items and terminate when 4 consecutive items are answered incorrectly. All responses are scored as correct (1) or incorrect (0).
These stimulus types are presented only as part of interference questions and do not have to be remembered to respond to the question correctly.
These responses are part of the interference questions and are not scored.
Storage only tasks, which test STM, require the participant to recall auditorily or visually presented information in the same order as it is given. Storage + manipulation tasks require maintaining and transforming the provided information, such as reordering a digit sequence. Storage + interference tasks require maintenance of target information while processing unrelated distracter information in the same modality (verbal or visual-spatial) as the target information. All Verbal tasks involve information presented in auditory form—either digits or words. SVS tasks involve information presented simultaneously in static visual form, as an array of large black dots in a grid of square boxes. DVS tasks present arrays of dots similar to SVS tasks, but the dots appear and disappear, one by one, in a dynamic sequence rather than being presented as a single static array.
On each subtest, participants begin with items hypothesized to be the easiest (requiring the smallest amount of WM resources) and progress toward (hypothetically) more difficult items. A total of 20 items is included on each subtest; this can be organized as 60 items for each demand and each domain dimension, or 180 items on the entire instrument. Within subtests, item difficulty is operationalized as string length, or the number of pieces of information (digits, dots, or dot locations) that must be remembered. Participants begin with a string length of two digits (Verbal subtests), one dot (SVS subtests), or one dot location (DVS subtests), and the string length systematically increases as the items progress (see Table 3). Items are numbered beginning with number 1 as the first item in the Digits Forward subtest in the Verbal domain, and the numbers continue according to subtest order in the domain, rather than administration order (which can be changed for different studies). Table 3 shows item numbers for each subtest and domain.
Scoring
Responses to each item in all subtests are dichotomously scored. Participants receive an item score of 1 if the response is completely correct. For example, if the correct answer on a Digits Forward item is 3759, and the participant types 3759, the item is scored 1. If there are any errors—commission, omission, or sequencing errors—the item is scored 0. For example, a commission error on a Digits Forward item means the participant has typed an additional number that was not in the presented sequence (e.g., 37592 when the correct answer is 3759). An omission error means the participant has typed too few numbers (e.g., 375 when the answer is 3759). Sequencing errors mean the participant has typed the numbers in the incorrect sequence (e.g., 3579 when the answer is 3759). Any single error or combination of these errors is considered incorrect and scored 0.
On all subtests, administration automatically terminates when a ceiling of four consecutive incorrect responses is recorded. Thus, after four consecutive item scores of 0 on a particular subtest, the remaining item scores for that subtest are recorded as 0. There are also two unscored practice items on each subtest. Responses to interference questions on storage + interference subtests are recorded but not scored. Each subtest includes 20 total items, so the maximum raw score for a single subtest is 20 and the minimum is 0.
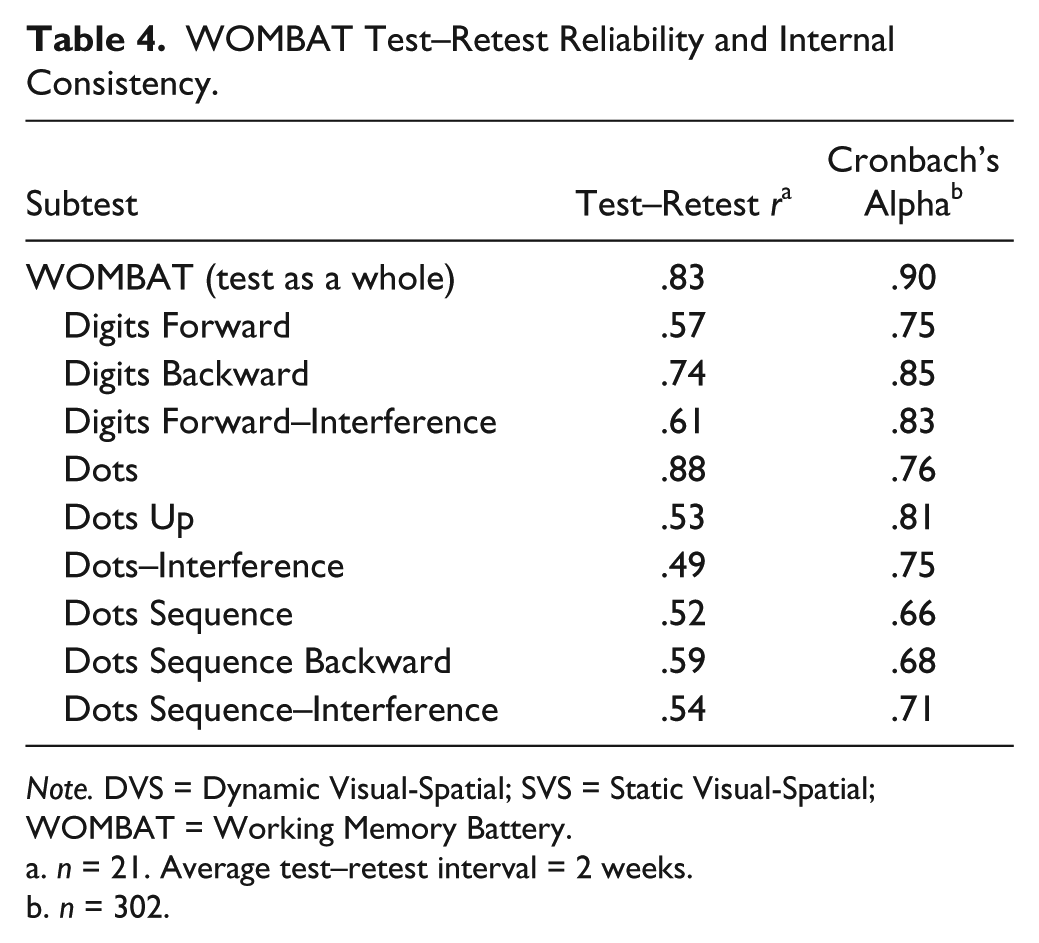
Test–Retest Reliability
A small subset of adults (n = 21, age M = 21.48 years, 8 men) was administered all nine subtests two different times, with an average test–retest interval of 2 weeks. For average WOMBAT subtest scores (mean of each participant’s subtest scores), the test–retest correlation was r = .83. Test–retest correlations for individual subtests ranged from .49 (Dots–Interference) to .88 (Dots) and are shown in Table 4. Nunnally and Bernstein (1994) have recommended reliability coefficients of .70 or higher for instruments in the early stages of research, but levels of .90 or higher as necessary for decision-making and individual assessment. The current results suggest the Digits Backward and Dots subtests (20 items per subtest) and the test as a whole have acceptable levels of test–retest reliability for early-stage instrument development, but that subtest-level test–retest reliability will need to be improved before the WOMBAT can be used for individual decision making. In the current study, misfitting items are identified as targets for revision to improve reliability of the WOMBAT.
WOMBAT Test–Retest Reliability and Internal Consistency.
Note. DVS = Dynamic Visual-Spatial; SVS = Static Visual-Spatial; WOMBAT = Working Memory Battery.
n = 21. Average test–retest interval = 2 weeks.
n = 302.
Internal Consistency
Cronbach’s alpha was calculated for the test as a whole and for the nine subtests using item scores (0 or 1) to evaluate internal consistency (n = 302). The Cronbach’s alpha value for the test as a whole (all nine subtests) was .90. Cronbach’s alpha values for each subtest ranged from .66 (Dots Sequence) to .85 (Digits Backward) and are shown in Table 4. These values suggest acceptable levels of reliability for individual assessment and decision making for the test as a whole; however, more refinement is needed to increase reliability for the WOMBAT subtests for individual assessment (Nunnally & Bernstein, 1994). Again, misfitting items identified in the current study will be targeted for revision to improve internal consistency for the WOMBAT.
Procedure
The WOMBAT is administered and scored completely online without the need for an administrator. It can be administered in a school computer lab, under laboratory conditions with a research assistant supervising the participant, or on adult participants’ personal computers outside the laboratory. The current study included all three types of administrations. Only adults (older than 18) participated in administration outside a supervised school or lab setting. A total of 30 adults participated in supervised lab administration, and 147 adults used personal computers (home administration). Results of a one-way analysis of variance (ANOVA) showed no significant difference in average subtest scores between adults who participated in lab versus those who participated in personal computer administration, F(1, 175) = 0.60, p = .441. All 125 adolescent participants were administered the WOMBAT at their school under supervision by teachers and study staff in classrooms of 10 to 30 students simultaneously.
The WOMBAT includes an automated introduction and tutorial, plus nine separate subtests. The introduction includes general instructions and a brief keyboard practice session requiring participants to press designated letter and number keys, with error feedback. Participants were instructed during the test introduction to ensure access to headphones or speakers, a mouse, and a keyboard. They were also instructed to maximize their browser and adjust volume to a comfortable level. Then, the online system guided them through all nine subtests in the same sequence for every participant: Digits Forward, Dots, Dots Sequence, Digits Backward, Dots Up, Dots Sequence Backward, Digits Forward–Interference, Dots–Interference, and Dots Sequence–Interference. The entire battery of nine subtests takes approximately 30 to 50 minutes to complete.
Data Analyses
Factor Structure
Our first research question aims to determine whether the factor structure of the WOMBAT reflects the theoretical organization of WM into three separate domains. To address the hypothesis that the WOMBAT measures three distinct dimensions, we used CFA. Based on theory, we first tested a three-factor measurement model that included Verbal, SVS, and DVS factors (Model 1). In Model 1, each domain factor was modeled to directly influence three subtests: the Verbal factor influenced Digits Forward, Digits Backward, and Digits Forward–Interference subtests; the SVS factor influenced Dots, Dots Up, and Dots–Interferences subtests; and the DVS factor influenced Dots Sequence, Dots Sequence Backward, and Dots Sequence–Interference subtests. Two- and one-factor models were also tested for comparison: Model 2 included only a Verbal factor and a combined Visual-Spatial factor (SVS and DVS) and Model 3 included only one overall WM factor. Previous studies of the WM construct have also modeled verbal and visual-spatial content domains as latent factors influencing subtest performance (e.g., Buehner et al., 2005; Ferreira et al., 2011; Oberauer et al., 2000; Oberauer et al., 2003).
As previously described, each of the three hypothesized factors was measured by three types of subtests: storage, manipulation, and interference. To account for any variance due to common subtest types, we used a multitrait-multimethod (MTMM) model (Model 1b), as described in Kenny and Kashy (1992). To test the three-factor (Model 1) versus two- (Model 2) and one-factor (Model 3) models, we used correlated uniqueness models, where the subtests with common methods have correlated errors (or uniquenesses). This is a step down from a full MTMM, but is necessary to compare model fit, as the MTMM requires a minimum of three method and three trait factors.
Instead of using the sums of raw subtest scores, as in Oberauer et al. (2000, 2003), in the current investigation Rasch person ability estimates for each subtest were used as measures of performance. Ferreira and colleagues (2011) used person ability estimates to evaluate the structure of the WM construct using CFA. As argued by Ferreira and colleagues, using person ability estimates provides a linear scale for measuring performance (due to Rasch scaling) that is well matched for linear CFA approaches. The person ability estimates used in the current study were calibrated within each subtest for each participant. Each participant, then, had one person ability score for each subtest—a total of nine person ability scores for each participant (unless the participant had missing subtest scores). Missing data handling was needed because some participants had missing data at the subscale (subtest), rather than the item level. Although Rasch person ability scores can be calculated when the sample includes missing data at the item level, in the current study Rasch person ability was calibrated within subtests. This means that participants would have neither a raw score nor a Rasch person ability score for any missing subtest. Thus, each observed variable (subtest) had a different sample size, depending on the number of participants missing data for that subtest (see Table 2 for sample sizes for each subtest).
Linear CFAs were conducted using the maximum likelihood (ML) estimation method in Mplus 7.11 (Muthén & Muthén, 2013). Missing data were handled using the full information maximum likelihood (FIML) method. Parameter estimates obtained using FIML are generally superior to those yielded through listwise deletion or other ad hoc approaches (Schafer & Graham, 2002). To ensure that using Rasch person ability scores did not affect our choice of models, we also compared model fit using the raw data scores. Domain factors were allowed to covary, and one factor-loading for each factor was set to 1. Multiple indicators were examined to assess model fit: chi-square (χ2), Tucker–Lewis index (TLI; also called the nonnormed fit index or NNFI), comparative fit index (CFI), root mean square error of approximation (RMSEA), and standardized root mean square residual (SRMR). The chi-square test assesses the fit between observed and model covariance matrices, with smaller values indicating better fit (Macmann & Barnett, 1994); however, there is no consensus on an accepted standard for an acceptable chi-square value. Thus, chi-square statistics are reported here but not examined as primary indicators of model fit. According to Hu and Bentler (1999), good model fit is better indicated by the following values for continuous data: TLI greater than .95, CFI greater than .95, RMSEA less than .06, and SRMR less than .08. The Akaike information criterion (AIC) index was also examined to compare models, with lower values indicating better fit. The AIC accounts for degrees of freedom in the model, providing some statistical control for the possibility of finding good fit simply because a model is sufficiently complex.
Item Fit
Our second research question requires determining which WOMBAT items contribute to measurement of the WM dimensions identified through CFA, and which items should be flagged for revision due to misfit. To address this, we used the dichotomous Rasch model to calculate item fit. Item fit indices indicate the extent to which the behavior of an individual item fits the prediction of the Rasch model—namely, the expectation that all items will contribute to measurement of a single underlying dimension. Data were analyzed using WINSTEPS software (Linacre, 2005).
Item fit indices are expressed in unstandardized mean squares, which represent the average value of squared residuals for each item, calculated from the difference between Rasch-predicted item performance (i.e., difficulty or placement on the scale) and actual item performance in the observed data (Bond & Fox, 2001). Thus, larger mean square values represent poorer item fit to the Rasch model. Mean square fit values have an expected value of 1. Values less than 1 indicate item redundancy or model overfit, whereas values greater than 1 indicate unpredictability or model underfit. Two item fit indices were examined: outfit and infit. Typically, more attention is paid to infit than to outfit scores because infit is a weighted index while outfit is unweighted. The scores of persons with person ability values closer to the item difficulty value for a particular item are weighted more heavily than the scores of persons far from the item difficulty value when calculating mean squares for the infit index. For the current study, misfitting items were defined as those for which outfit mean squares were greater than 1.4 or for which infit mean squares fell outside the acceptable range of 0.60 to 1.40 (Wuang & Su, 2009).
Person Separation and Item Reliability
As an additional evaluation of WOMBAT consistency, we evaluated person separation and item reliability using the Rasch model. The person separation reliability statistic (PSI) is a Rasch measure of internal consistency similar to Cronbach’s alpha (Andrich, 1982). The PSI value indicates a test’s ability to separate persons into different levels of ability (Duncan, Bode, Min Lai, & Perera, 2003), in this case verbal, SVS, or DVS WM ability. A PSI of at least 2.00 means the test can distinguish three levels of person ability (high, average, and low). The PSI is used to calculate a person reliability index (as a percentage). The person reliability index provides a measure of how replicable the placement of persons along the logit scale would be if the same persons were administered another group of items measuring the same construct (Bond & Fox, 2001). Similarly, the item reliability index provides a measure of how replicable the placements of item difficulty values along the logit scale would be if the same items were administered to another sample with similar levels of person ability (Bond & Fox, 2001). Item and person reliability values range from 0 to 1 and are considered acceptable at values of .80 and greater (Fox & Jones, 1998). These indices provide evidence of how generalizable item parameters calculated from the current data are for similar person and item samples.
Results
Factor Structure
CFA was conducted using Mplus 7.11 to evaluate the factor structure of the WOMBAT. Table 5 provides zero-order correlations among subtests, which ranged from .10 to .58. Regarding independence of observations, it is possible that practice effects and/or strategy use or cheating occurred, but no systematic pattern of dependency was observed. Scatterplots of bivariate relationships among variables indicated the data approached multivariate normality. Regarding a positive definite covariance matrix, all eigenvalues were real, nonzero numbers, and no perfect correlations were observed. Thus, the data supported the assumptions needed for ML estimation in CFA.
WOMBAT Subtest Zero-order Correlations.
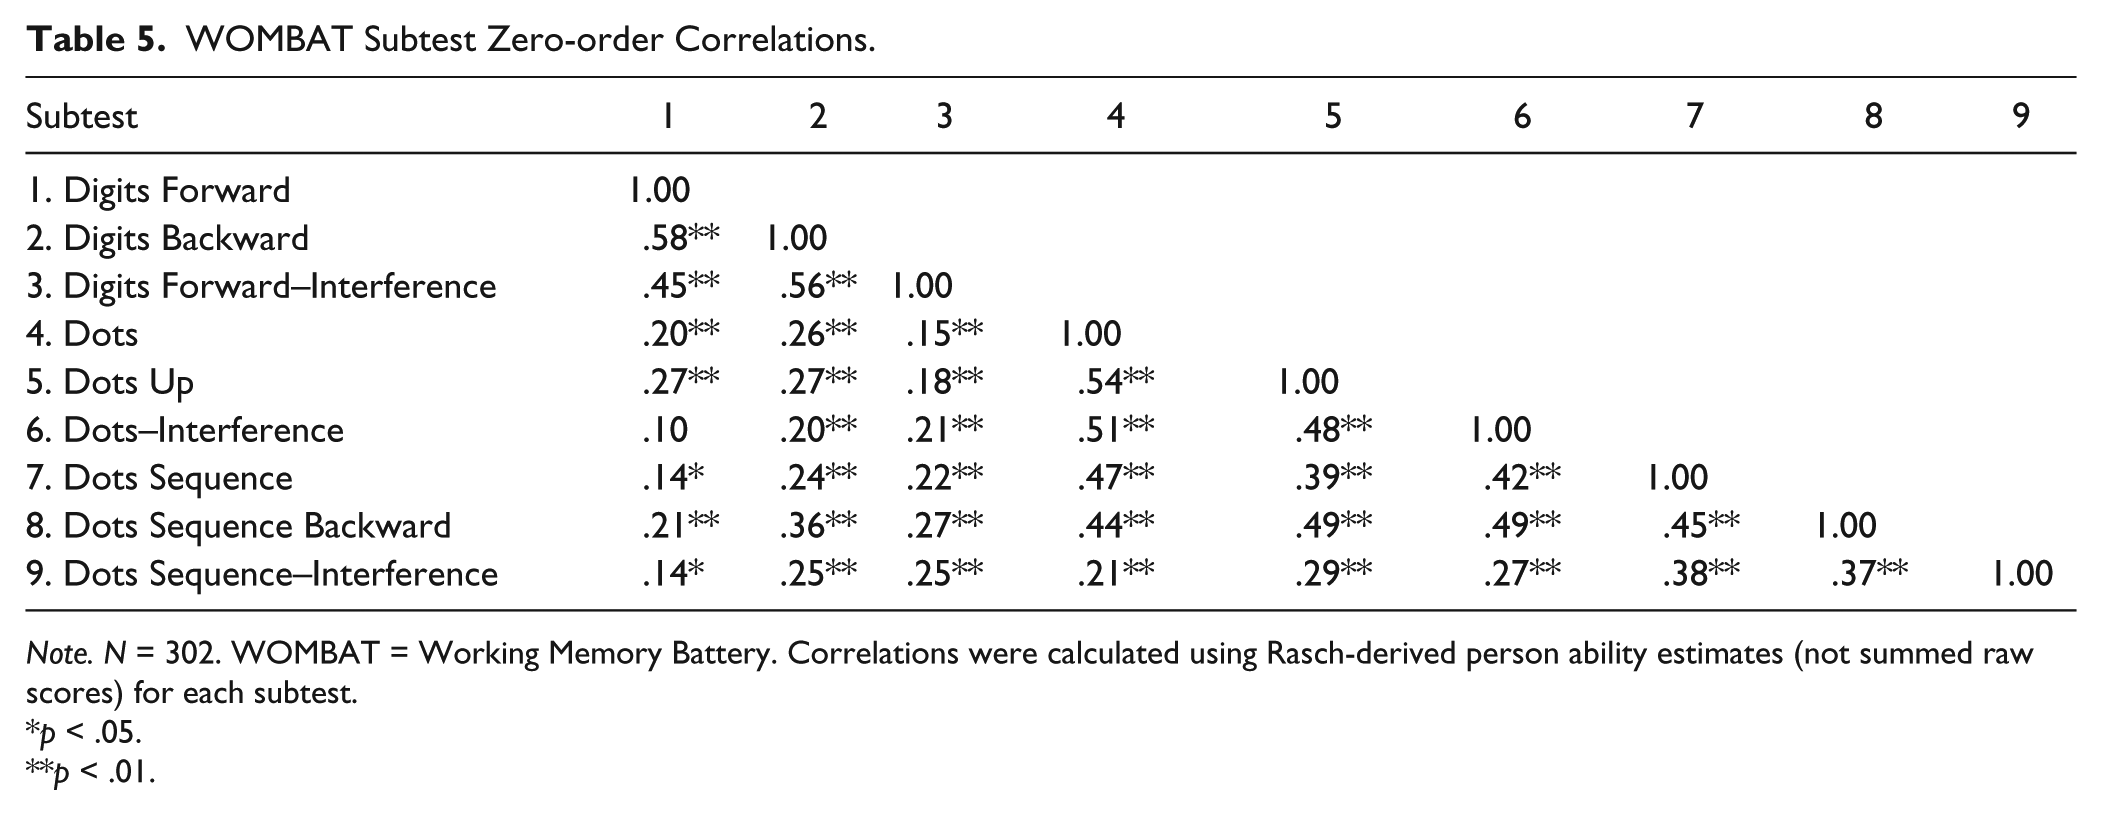
Note. N = 302. WOMBAT = Working Memory Battery. Correlations were calculated using Rasch-derived person ability estimates (not summed raw scores) for each subtest.
p < .05.
p < .01.
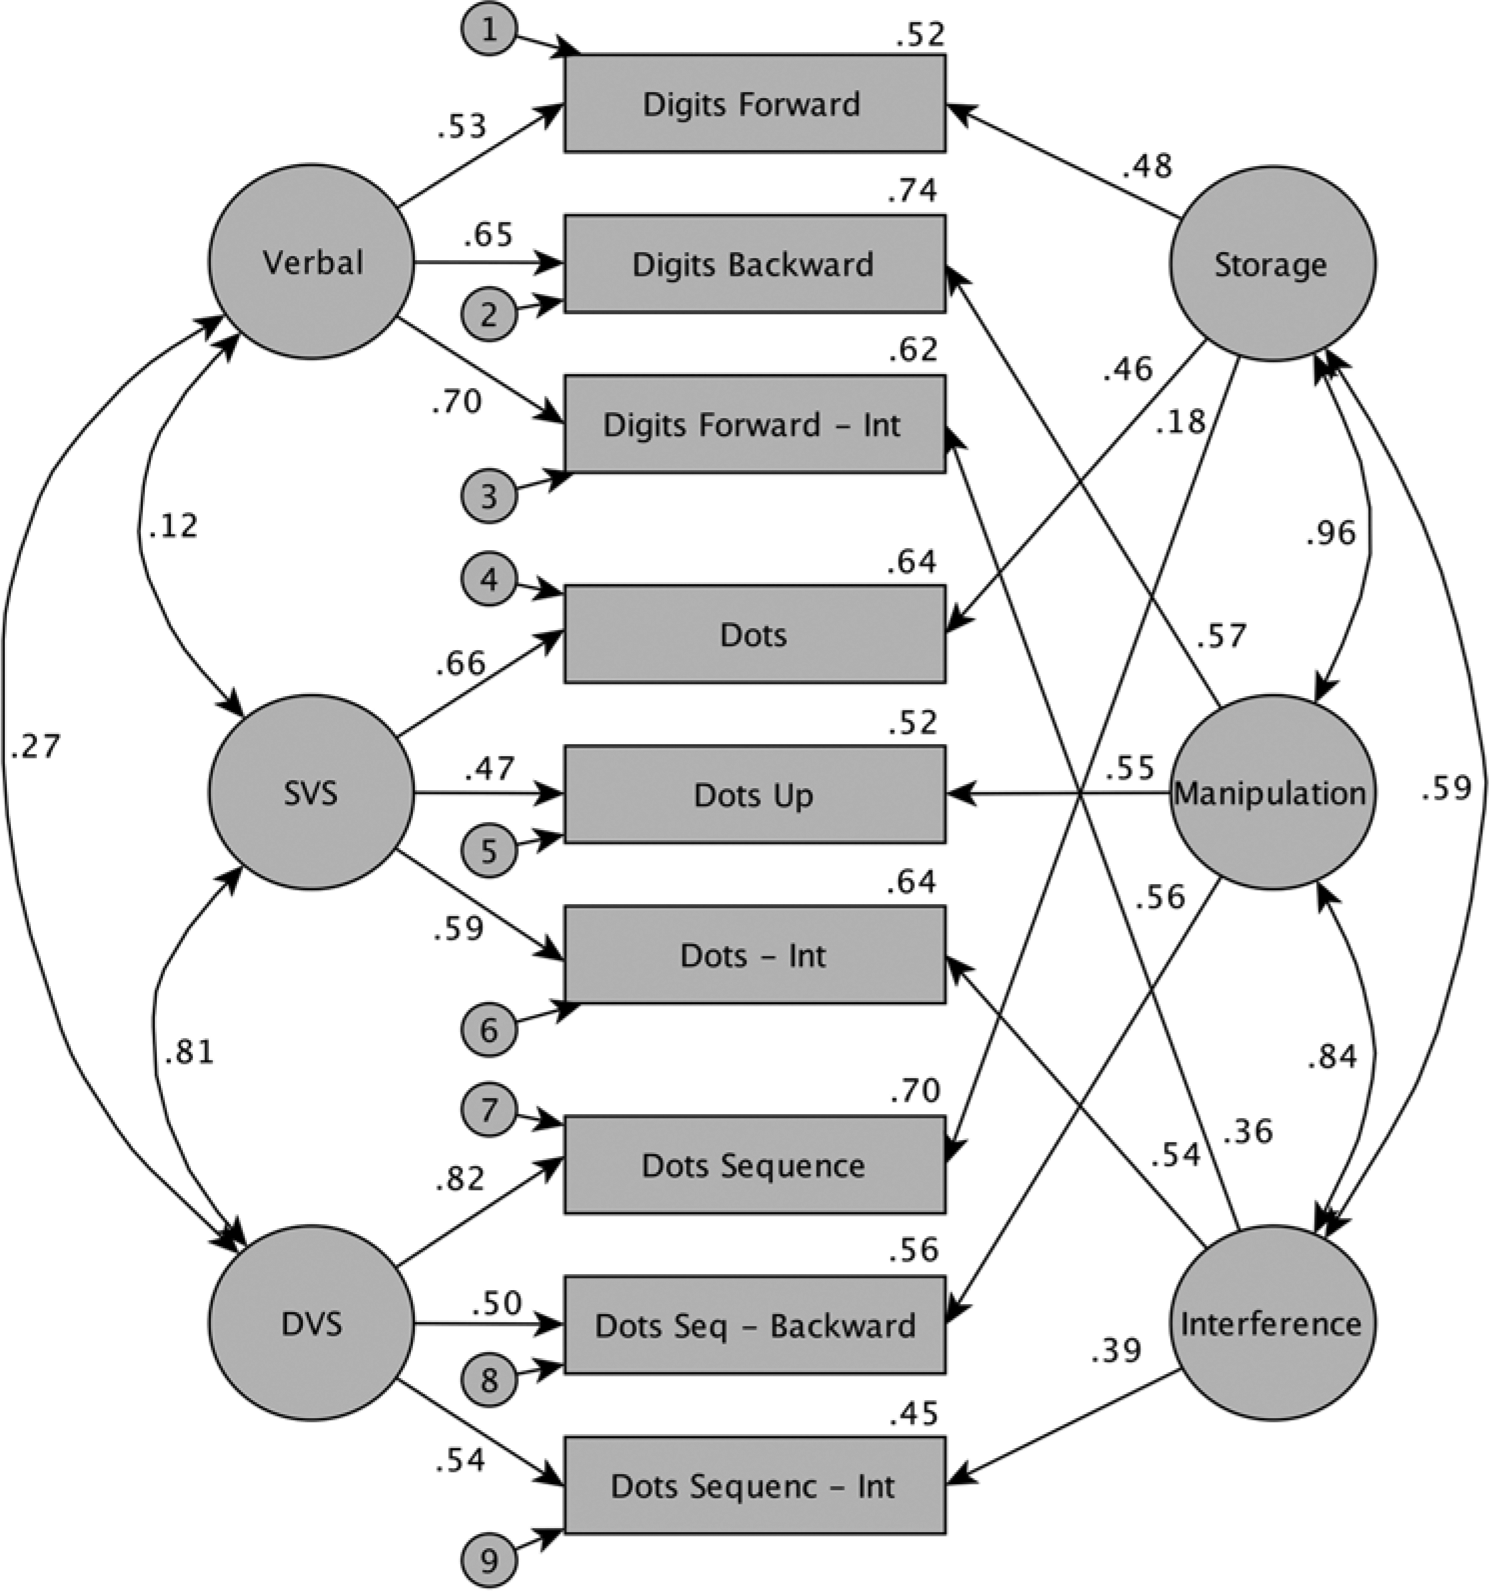
Model 1, the three-factor correlated uniqueness model, showed good fit to the data, χ2(15, n = 302) = 29.80, p = .013, TLI = .959, CFI = .983, RMSEA = .057, SRMR = .031, AIC = 10505.80 (see Figure 2). We also tested a two-factor correlated uniqueness model, Model 2, containing only two domain factors—verbal and a combined Visual-Spatial domain factor. Model 2 was tested using Mplus 7.11 with the same parameters used for Model 2 (domain factors allowed to correlate, one path coefficient for each factor set to 1). Model 2 also showed good fit to the data, χ2(17, n = 302) = 40.58, p = .001, TLI = .942, CFI = .973, RMSEA = .068, SRMR = .034, AIC = 10512.55 (see Figure 3). The AIC for Model 2 (10512.55) was higher than that for Model 1 (AIC = 10505.80), the TLI and CFI were both lower for Model 2 (CFI = .942, TLI = .973) than for Model 1 (CFI = .959, TLI = .983), and the RMSEA and SRMR were both higher for Model 2 (RMSEA = .068, SRMR = .034) than for Model 1 (RMSEA = .057, SRMR = 0.031), suggesting that the three-factor model is the better fitting model of the two. We compared the same models (1, 2, and 3) using the raw data and again found the three-factor model to provide a better fit to the data than the two-factor model.
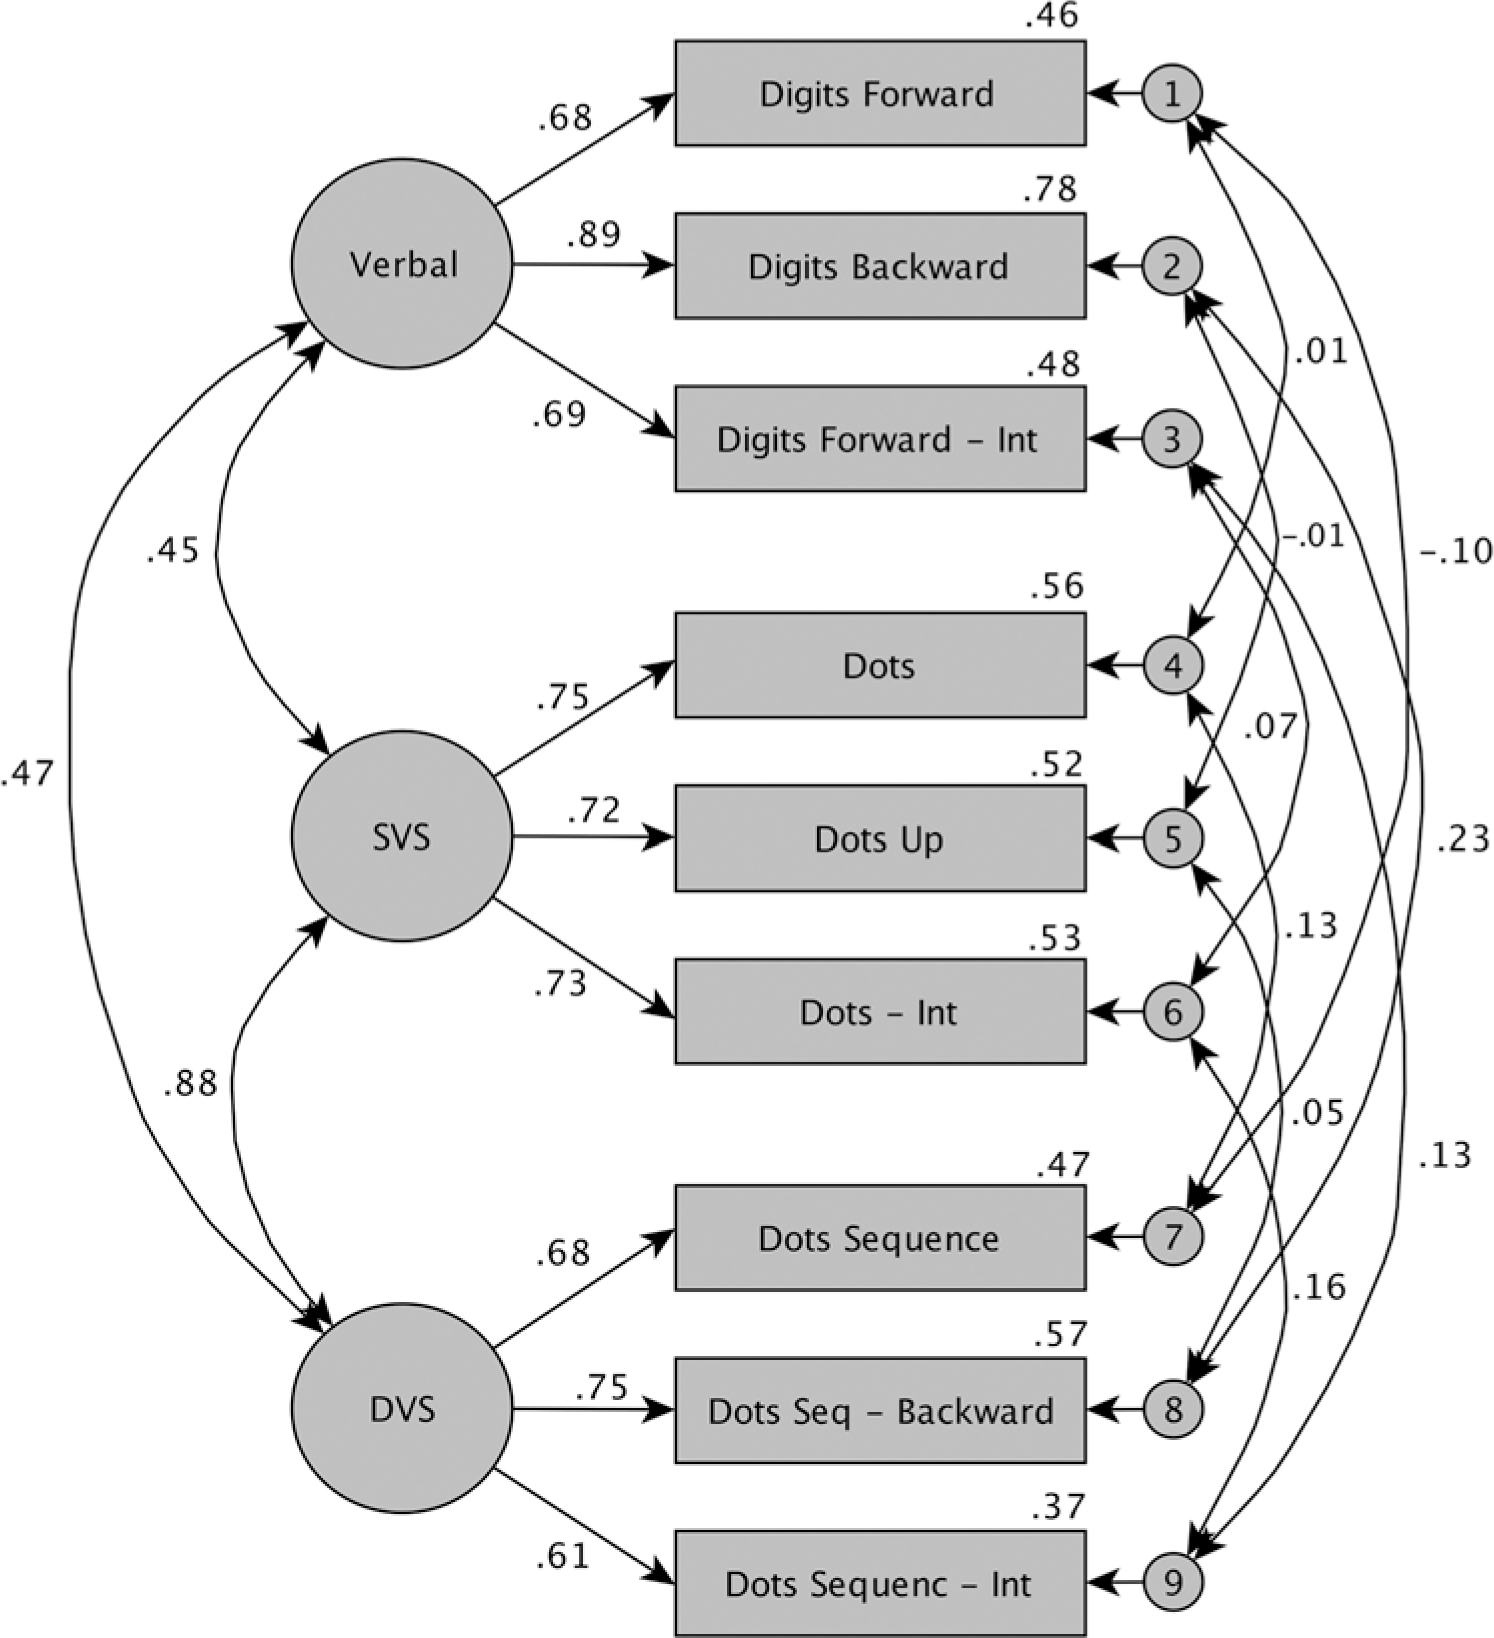
Model 1: Three-factor correlated uniqueness model tested with linear confirmatory factor analysis for Working Memory Battery subtests. This model predicted three domain factors (Verbal, Static Visual-Spatial [SVS], and Dynamic Visual-Spatial [DVS]) directly influence subtest performance. Rasch person ability estimates were used as measures of subtest performance. Model 1 showed good fit to the data, χ2(15, n = 302) = 29.80, p = .013, TLI = .959, CFI = .983, RMSEA = .057, SRMR = .031, AIC = 10505.80.
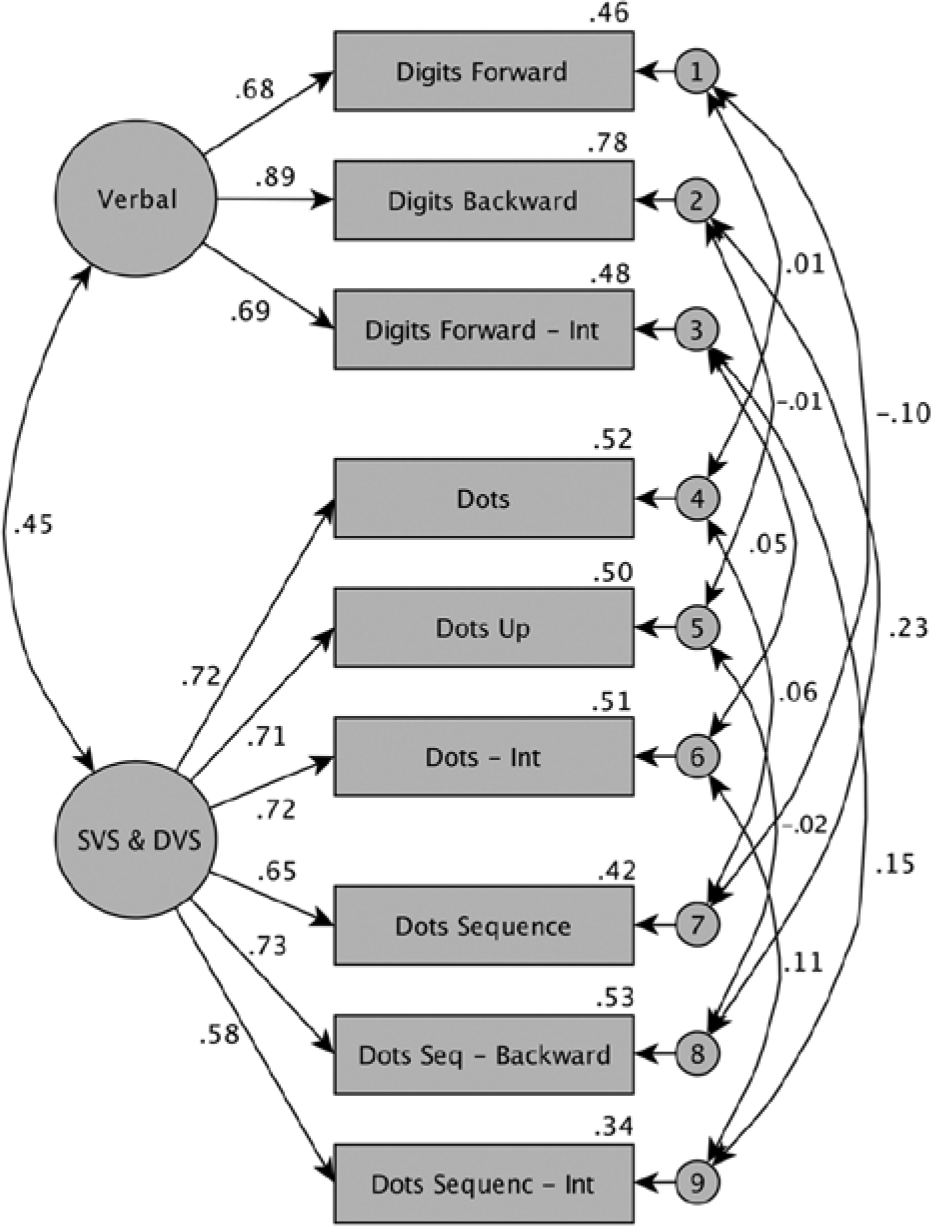
Model 2: Two-factor correlated uniqueness model tested with linear confirmatory factor analysis for Working Memory Battery subtests. This model predicted two domain factors (Verbal and a combined Static Visual-Spatial and Dynamic Visual-Spatial factor [SVS + DVS]) directly influence subtest performance. Rasch person ability estimates were used as measures of subtest performance. Standardized estimates are reported here. Model 2 showed good fit to the data, χ2(17, n = 302) = 40.58, p = .001, TLI = .942, CFI = .973, RMSEA = .068, SRMR = .034, AIC = 10512.55.
Because the three-factor model fit the data better than the two-factor model, we were then able to test a full MTMM model (Model 1b), which also included three method factors, one for each of the three types of subtest: storage, manipulation, and interference. The MTMM model is generally preferred over the correlated uniqueness model (Lance, Noble, & Scullen, 2002). This model showed superior fit to the three-factor correlated uniqueness model on every fit statistic, χ2(13, n = 302) = 22.90, p = .043, TLI = .968, CFI = .989, RMSEA = .050, SRMR = .021, AIC = 10499.362 (see Figure 4).
Model 1b: Full multitrait-multimethod model. This model showed excellent fit, superior to the three-factor correlated uniqueness model on every fit statistic, χ2(13, n = 302) = 22.90, p = .043, TLI = .968, CFI = .989, RMSEA = .050, SRMR = .021, AIC = 10499.362. Rasch person ability estimates were used as measures of subtest performance. Standardized estimates are reported here.
Because all items on the WOMBAT are designed to measure the WM construct, which could represent a single underlying dimension, a one-factor model, also with correlated uniquenesses (one general WM factor modeled to directly influence all nine subtests), was also tested. However, this model demonstrated poor fit to the data, χ2(18, n = 302) = 195.661, p < .001, TLI = .588, CFI = .794, RMSEA = .181, SRMR = .101, AIC = 10665.66. Therefore, results suggest that, as hypothesized, the three-factor model with Verbal, SVS, and DVS factors provides a better fit to the data in comparison to a one- or two-factor model.
Item Fit
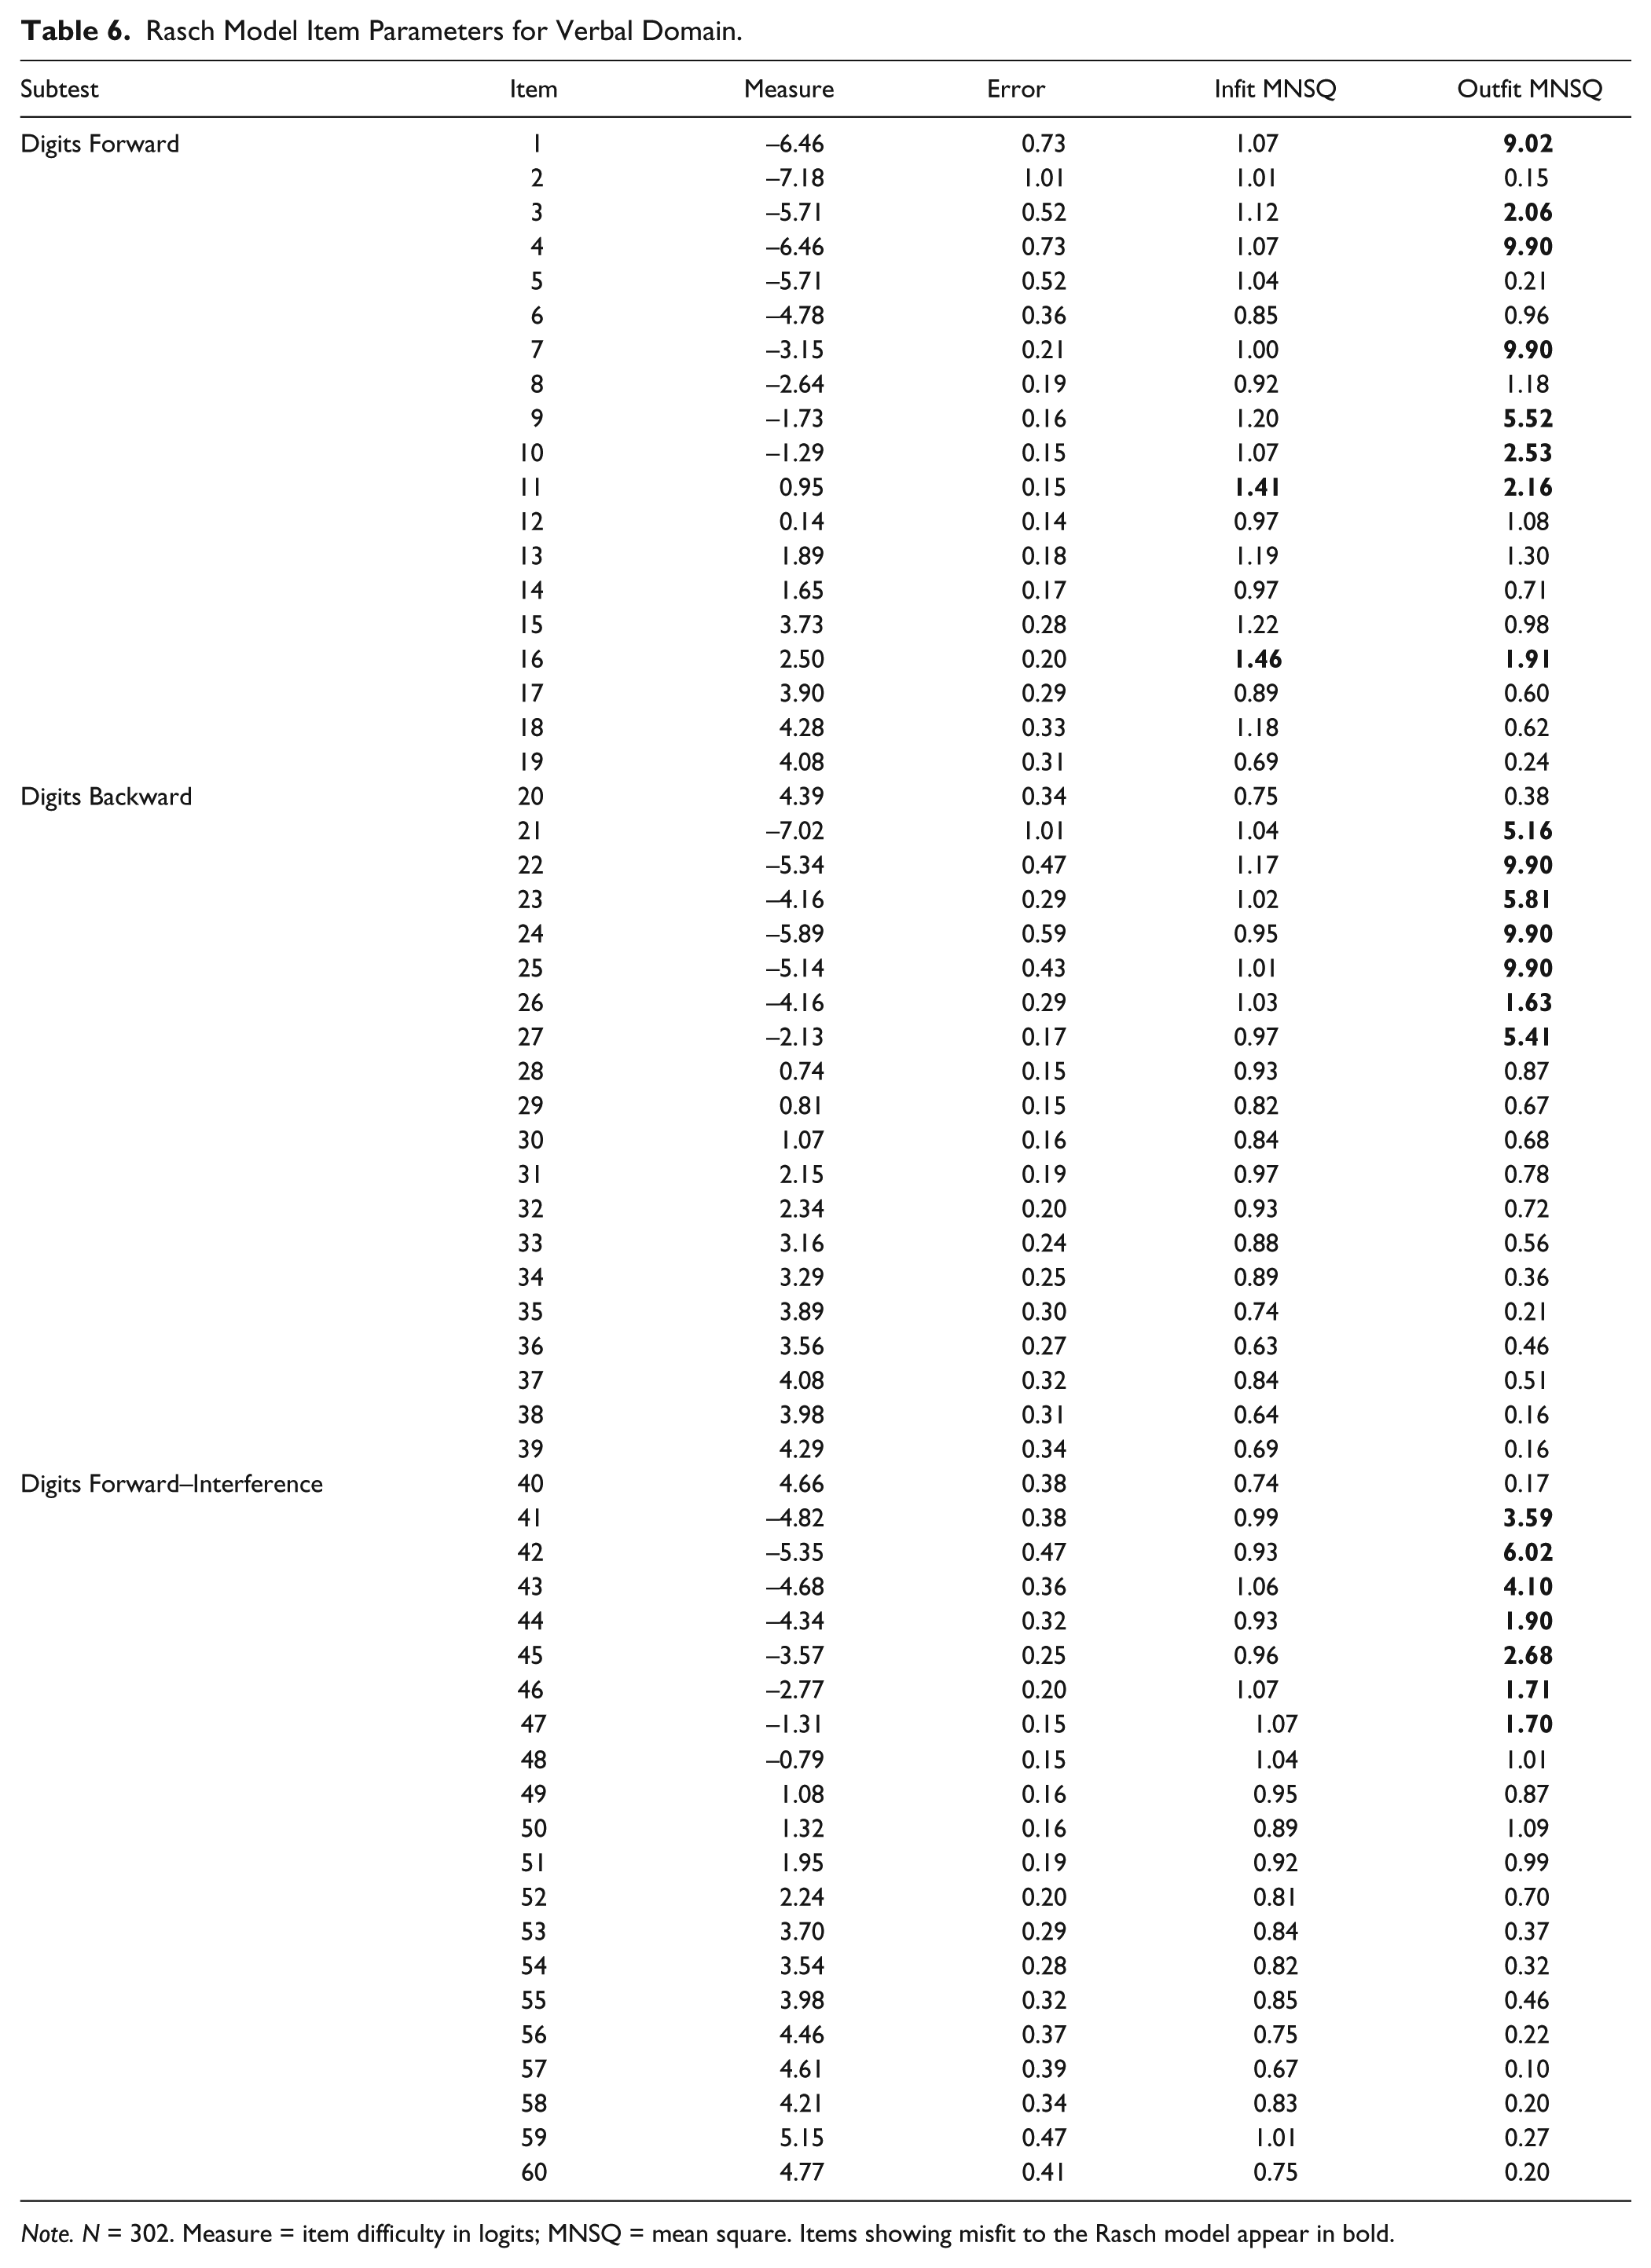
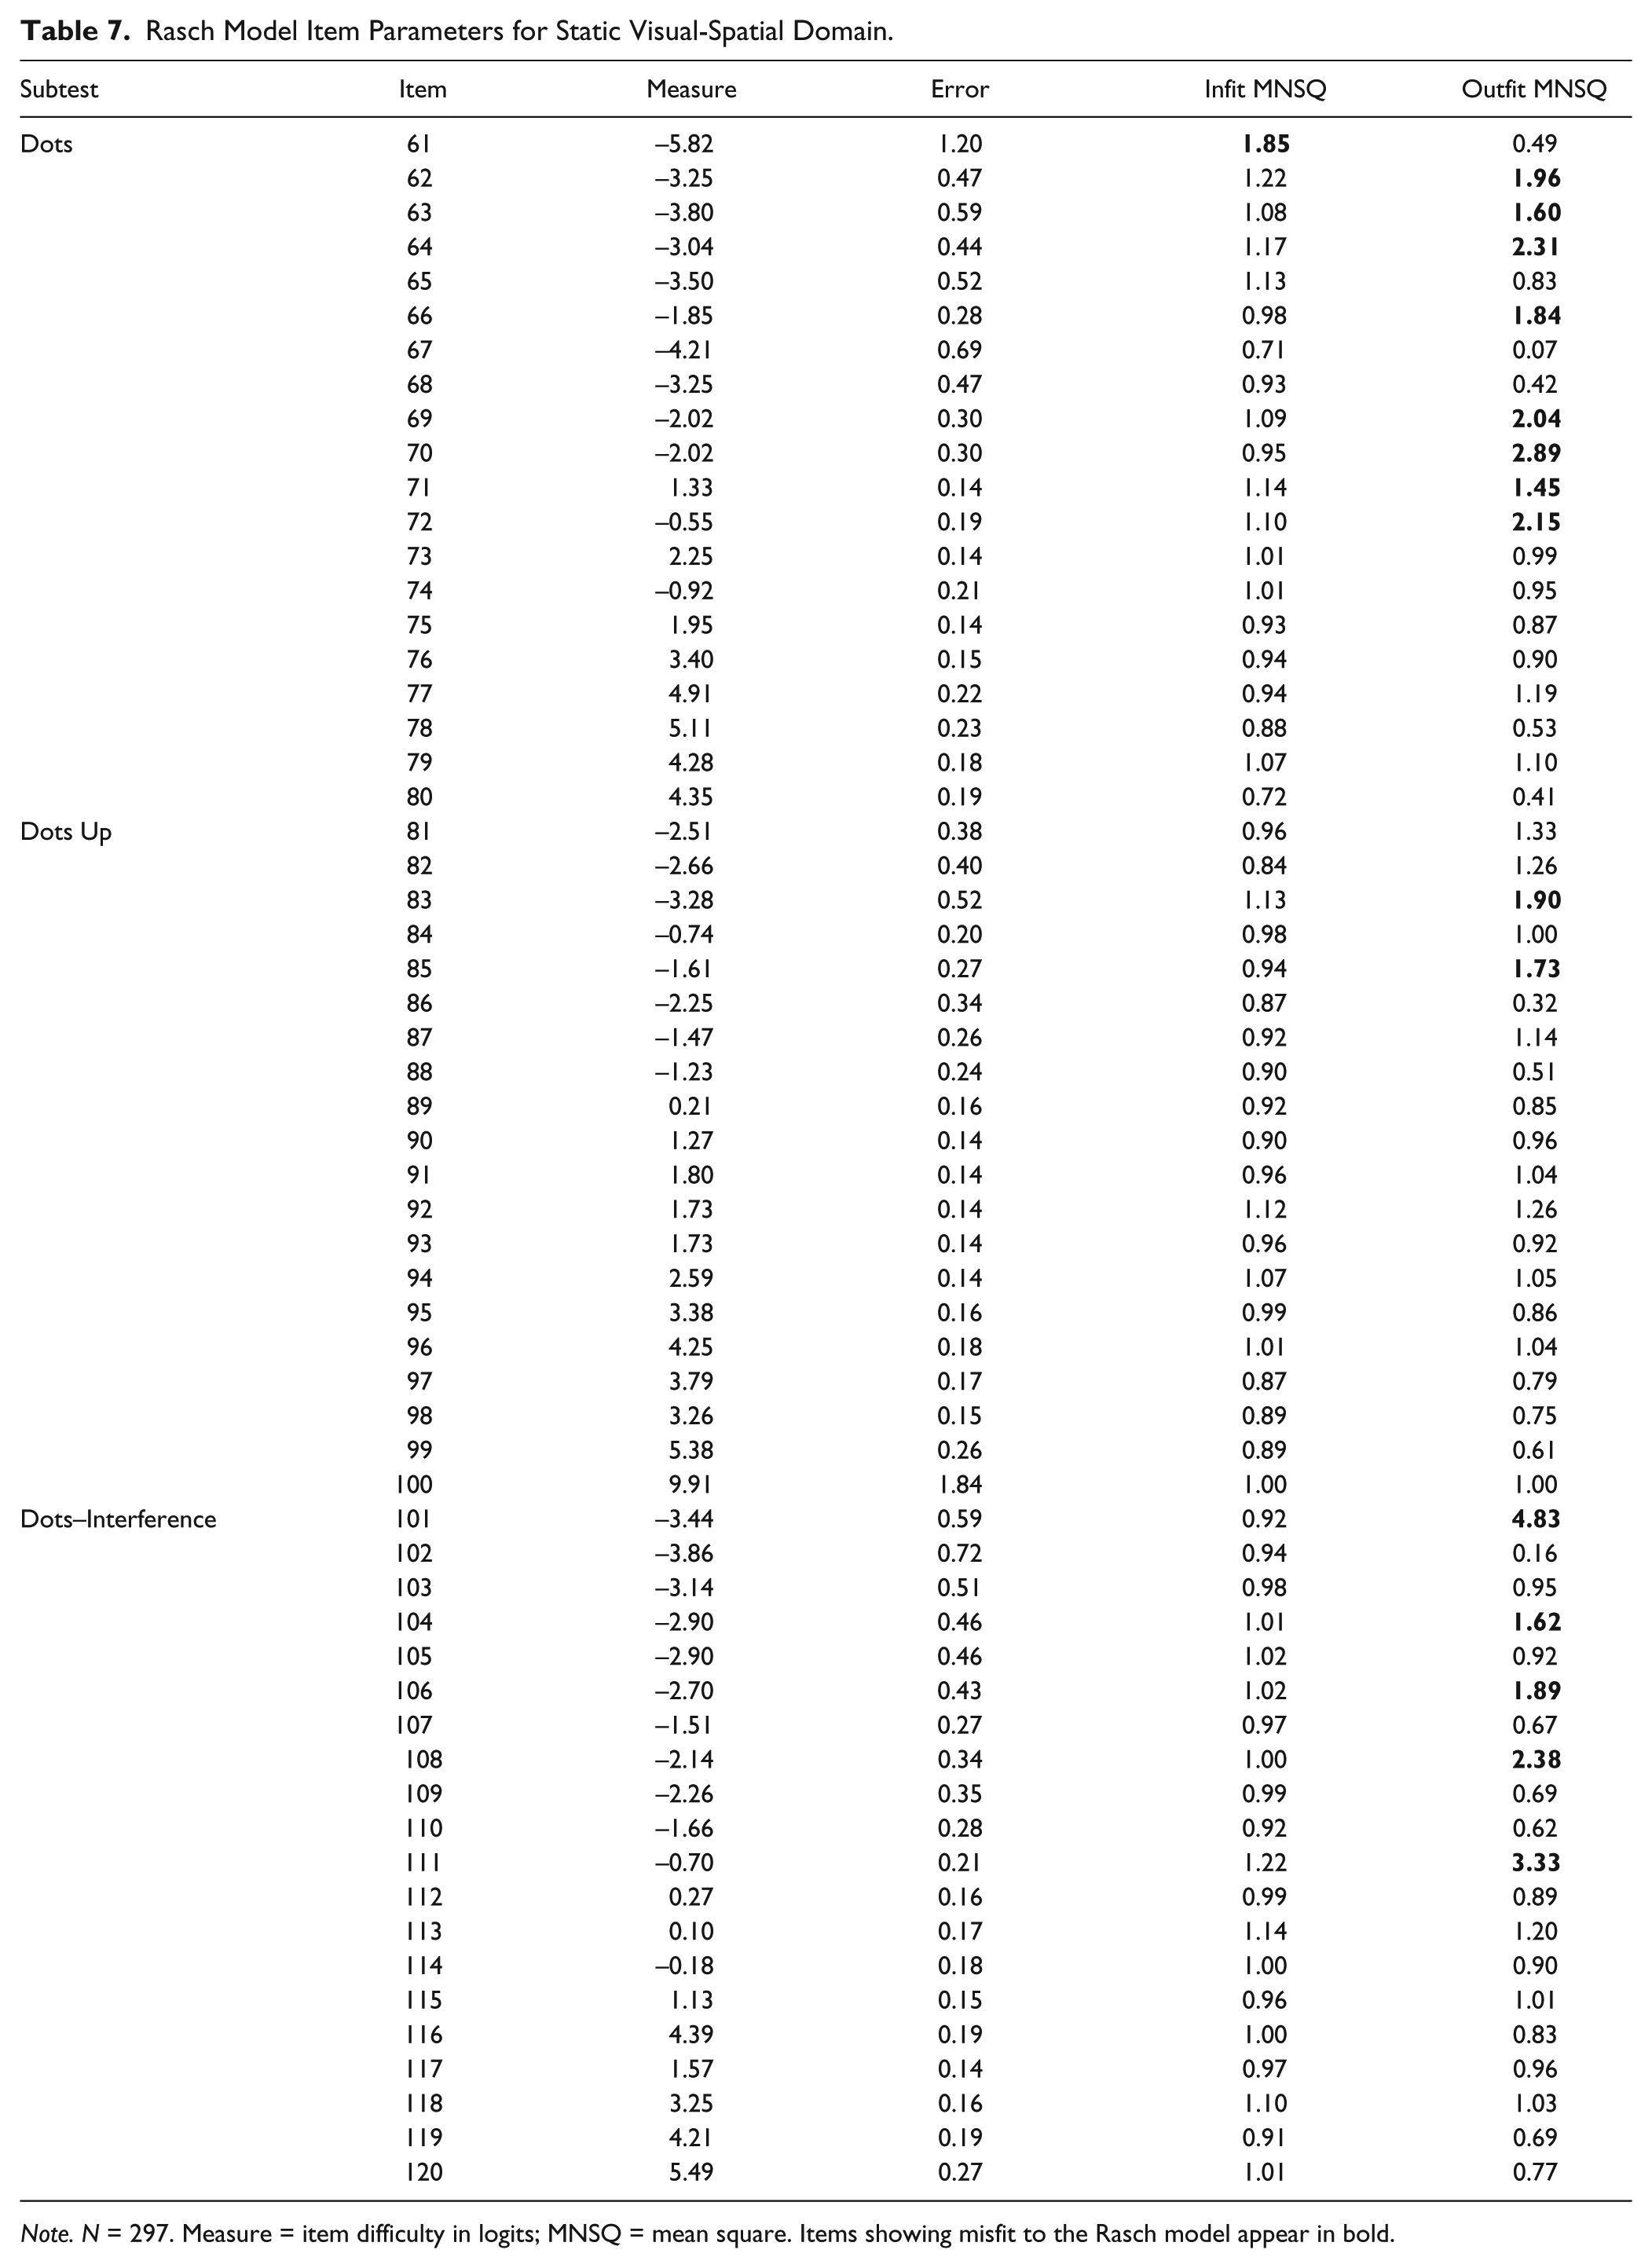
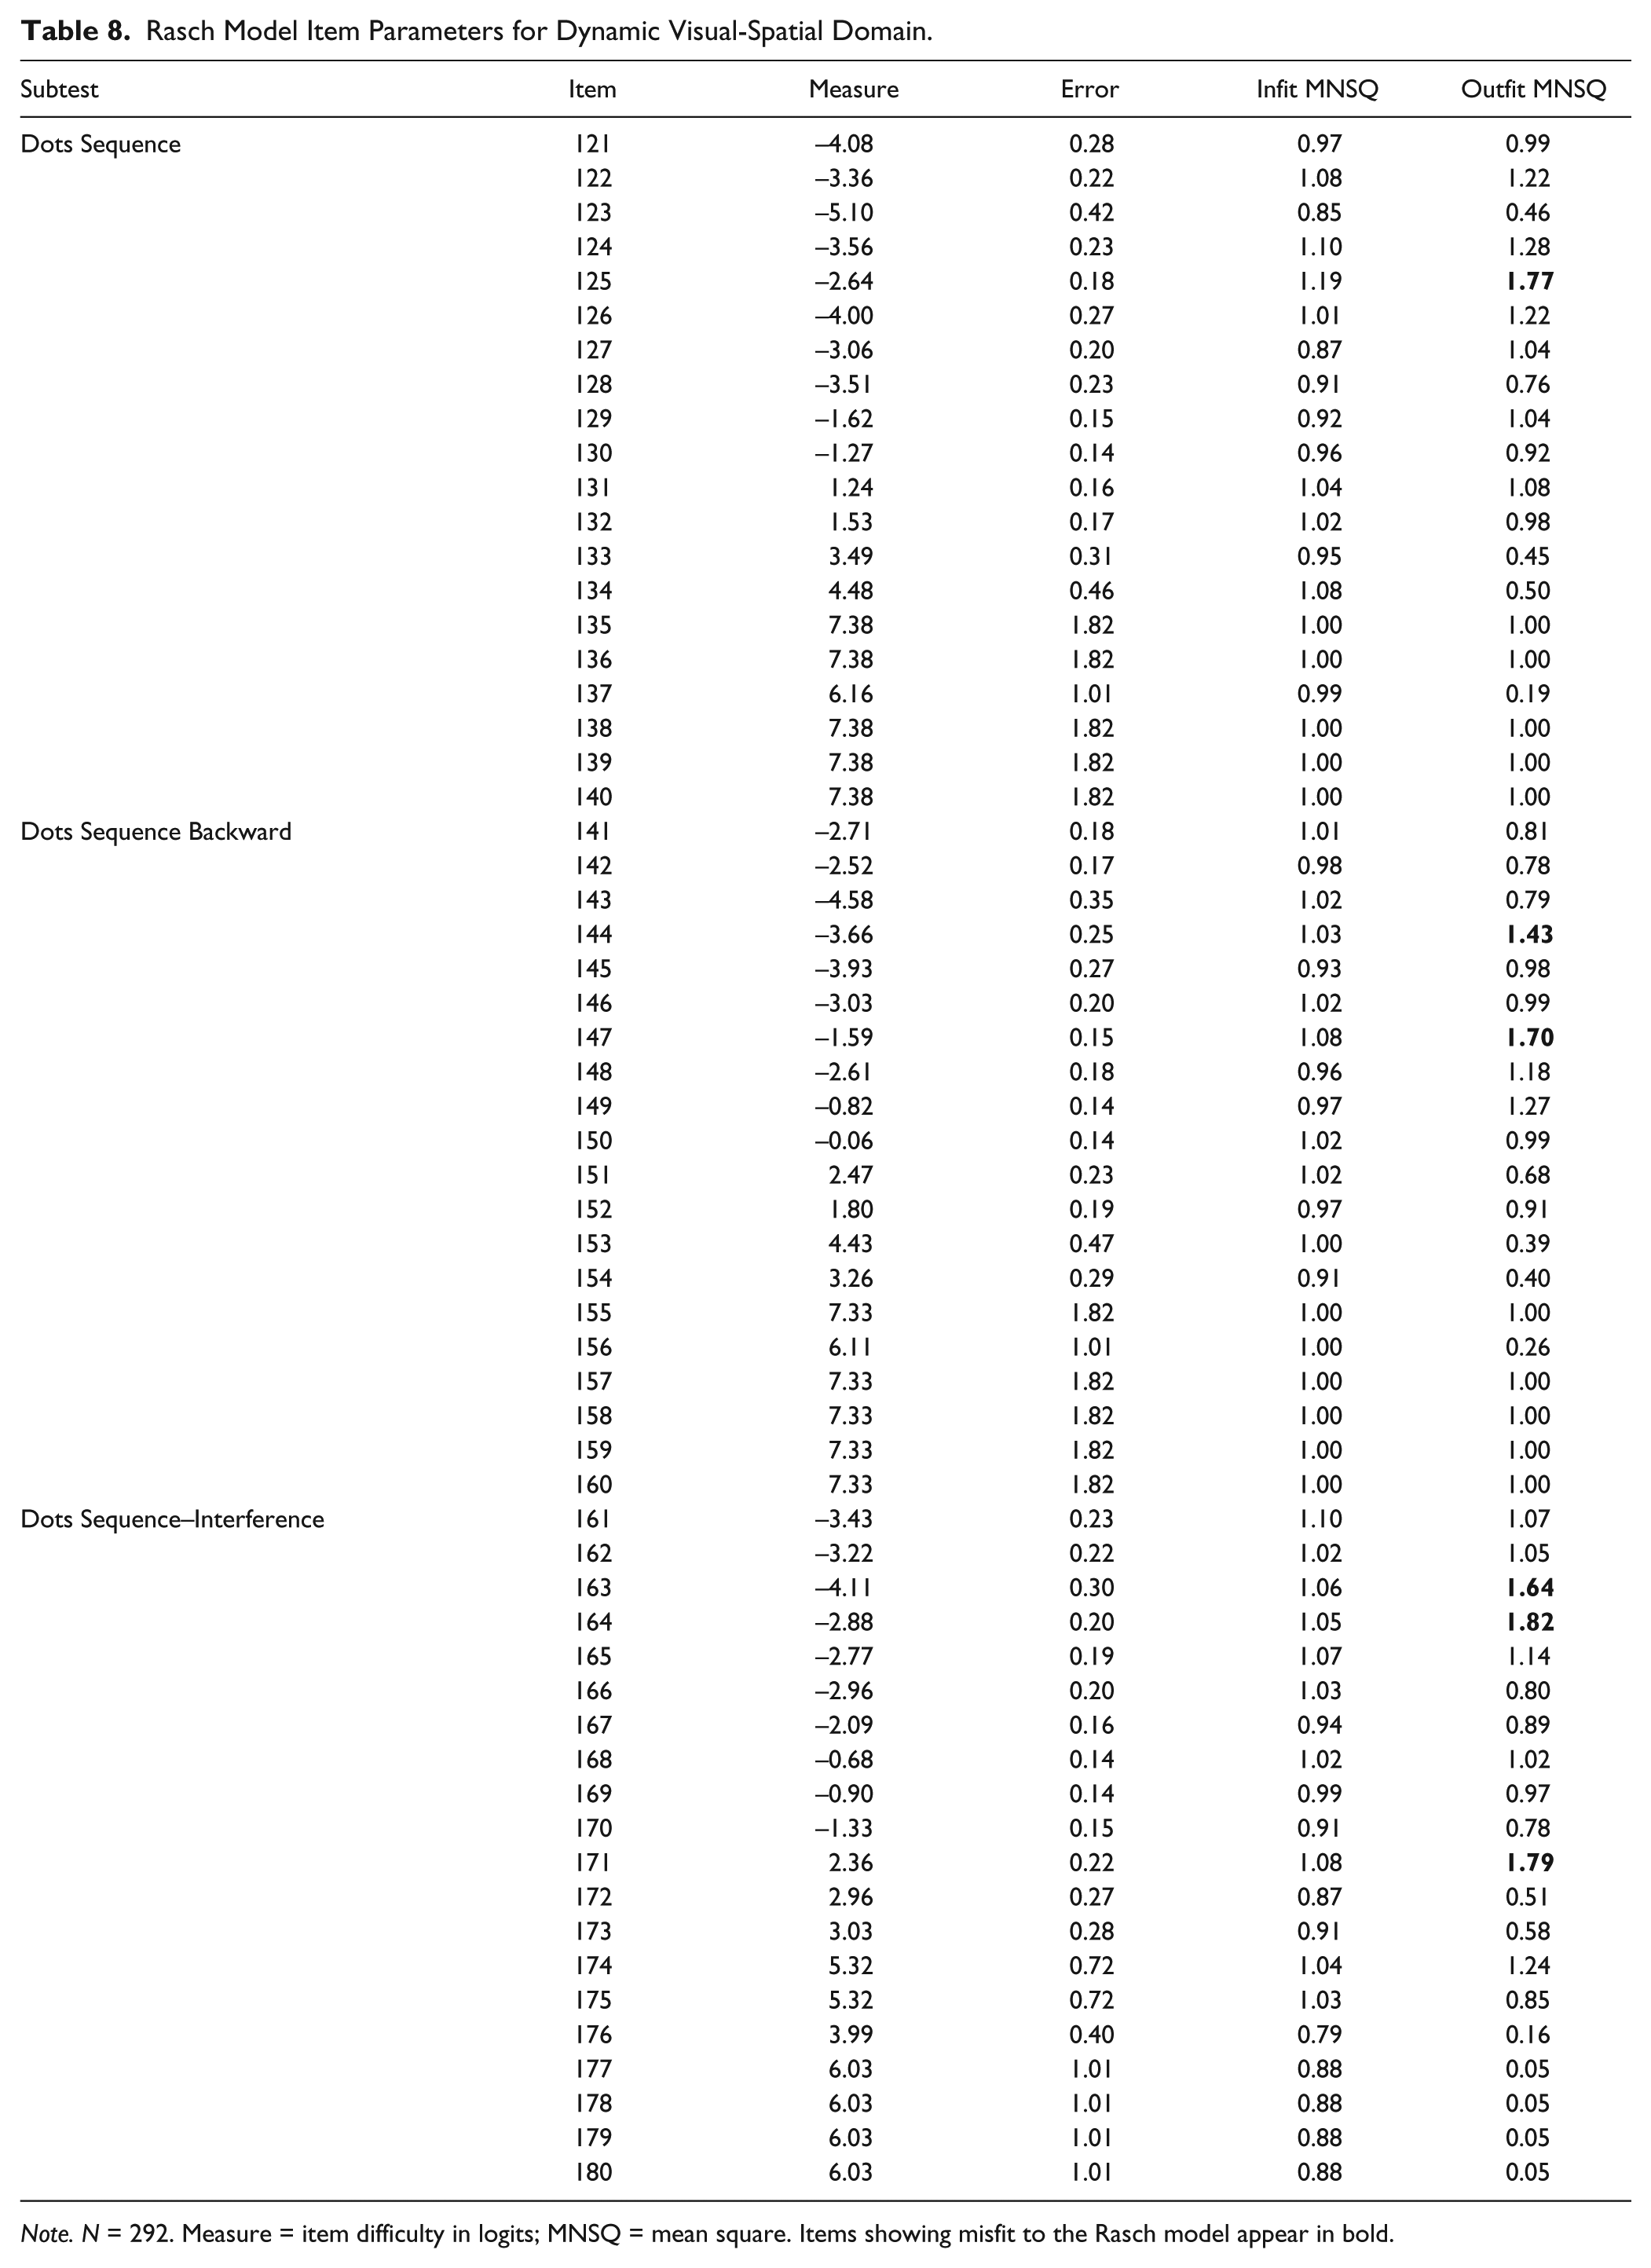
An assumption of the Rasch model is that all items measure a single, underlying dimension or trait. The best-fitting model from the CFA included three factors, Verbal, SVS, and DVS, indicating the WOMBAT measures three distinct dimensions. Data were therefore analyzed for these three domains separately (i.e., treated as three separate instruments, each measuring a single underlying dimension) to calibrate item difficulty and person ability values, fit indices, and person and item reliability. Tables 6, 7, and 8 show item difficulty, error, and fit index parameters for the Verbal, SVS, and DVS domains, respectively. Rasch analysis of the 60 items within each domain revealed three misfitting items, according to the infit index (see Tables 6, 7, and 8). Two items were from the Verbal domain in the Digits Backward subtest (11, 16) and one (61) was from the SVS domain in the Dots subtest. All three items showed model underfit, or unpredictability (values > 1.4). This suggests that two items are not contributing to the measurement of the latent Verbal WM dimension and one item is not contributing to the measurement of the SVS WM dimension.
Rasch Model Item Parameters for Verbal Domain.
Note. N = 302. Measure = item difficulty in logits; MNSQ = mean square. Items showing misfit to the Rasch model appear in bold.
Rasch Model Item Parameters for Static Visual-Spatial Domain.
Note. N = 297. Measure = item difficulty in logits; MNSQ = mean square. Items showing misfit to the Rasch model appear in bold.
Rasch Model Item Parameters for Dynamic Visual-Spatial Domain.
Note. N = 292. Measure = item difficulty in logits; MNSQ = mean square. Items showing misfit to the Rasch model appear in bold.
According to the outfit index, which is influenced by extreme or outlying scores, the following misfitting items were identified: 22 in the Verbal domain, 15 in the SVS domain, and 6 in the DVS domain. All of these items showed model underfit, or unpredictability (values > 1.4). Because two misfitting items from the Verbal domain were problematic in terms of both infit and outfit, this resulted in a total of 44 misfitting items identified, according to either infit or outfit, out of 180 total (24%). For the Verbal domain, infit mean squares ranged from 0.63 to 1.46 (M = 0.95, SD = 0.17) and outfit mean squares ranged from 0.10 to 9.9 (M = 2.23, SD = 2.95; see Table 6). For the SVS domain, infit mean squares ranged from 0.71 to 1.85 (M = 1.00, SD = 0.15) and outfit mean squares ranged from 0.07 to 4.83 (M = 1.19, SD = 0.79; see Table 7). For the DVS domain, infit mean squares ranged from 0.79 to 1.19 (M = 0.99, SD = 0.07) and outfit mean squares ranged from 0.05 to 1.82 (M = 0.90, SD = 0.43; see Table 8). Despite a high number of misfitting items according to outfit, when only items that misfit according to the infit index are considered, only 1.67% of all items showed misfit to the Rasch model (3 out of 180). Therefore, Items 11, 16, and 61 have been flagged for revision. The additional items showing misfit according to the outfit index will also need to be reviewed during further refinement of the WOMBAT.
Person Separation and Item Reliability
Results of Rasch analysis showed PSI values for all three domains exceeded 2.0: Verbal PSI = 2.85, SVS PSI = 2.83, and DVS PSI = 2.08. This means scores can be used to distinguish among three levels of person ability (low, average, and high). In addition, both person and item reliability index values for all three domains were within the acceptable range (>.80; Fox & Jones, 1998): .89 person/.99 item reliability for the Verbal domain, .89/.98 for the SVS domain, and .81/.96 for the DVS domain (see Table 5). This suggests measurement properties and item parameters (item difficulty, person ability, etc.) derived from Rasch analysis of the WOMBAT using the current sample and pool of items can be reasonably generalized to other samples and similar item pools.
Discussion
Because of the importance of different components of WM for learning and achievement, there is a growing need for theoretically defensible measures of WM. The current study used CFA and the Rasch model to evaluate the WOMBAT, a multicomponent, online WM measure. The current study addressed two research questions:
Does the factor structure of the WOMBAT reflect the theoretical organization of WM into three separate domains?
Which items contribute to measurement of the identified WM dimensions, and which items should be flagged for revision due to misfit?
CFA results indicated the best-fitting model to the WOMBAT data is an MTMM model with three domain factors: Verbal, SVS, and DVS . This supported our hypothesis, as well as the organizational structure of WOMBAT tasks, that the WOMBAT measures three distinct WM dimensions corresponding to three content domains. The division of visual-spatial WM into a separate static and dynamic factor is consistent with previous research and theoretical models that suggest visual-spatial WM includes both static and dynamic components (Cornoldi & Vecchi, 2000, 2003; Kesner et al., 1994; Lecerf & de Ribaupierre, 2005; Logie, 1995; Mammarella et al., 2006; Mammarella et al., 2013; Pazzaglia & Cornoldi, 1999; Pickering, 2001; van der Sluis et al., 2005). The broader conclusion that WM can be divided into distinct content domain dimensions is also consistent with previous research demonstrating separate verbal and visual-spatial WM factors (Buehner et al., 2005; Cornoldi & Vecchi, 2000, 2003; Ferreira et al., 2011; Oberauer et al., 2000; Oberauer et al., 2003; Oberauer et al., 2005). Previous studies have approached the task of dividing WM into distinct components differently, using both content domains and processing demands (e.g., STM, WM, and executive processing demands). It is possible that we identified a third domain factor (i.e., two separate factors within visual-spatial WM) because other studies did not include tasks targeted at these separate visual-spatial content domains. Our results suggest future research should include tasks that specifically target static and dynamic visual-spatial WM to extend the psychometric and neuroimaging evidence for multiple visual-spatial WM components.
CFA results suggested that the WOMBAT measures three underlying dimensions. Thus, for the purposes of Rasch modeling, the three Verbal subtests, three SVS subtest, and three DVS subtests should be treated as separate measures. This informs test development in supporting our conceptualization of three distinct domains of WM subtests that each measure different types of information to be remembered. In addition, since a one-factor correlated uniqueness model was not supported, the implication is that interpretation of WOMBAT scores should focus at the factor or domain level (i.e., on separate Verbal, SVS, and DVS scores) rather than at the overall level (i.e., one overall WOMBAT score). These results also contribute to research on the structure of the WM construct by providing additional evidence for multiple WM components.
The CFA results also supported the Rasch assumption of unidimensionality for the Verbal, SVS, and DVS domains. Thus, calibration of item difficulty and person ability values in the Rasch portion of the study within these three domains—as well as interindividual, interitem, and intraindividual comparisons—can be said to be meaningful. The unidimensionality of the three separate WOMBAT domains is further supported by PSI values falling in the acceptable range for Verbal, SVS, and DVS item sets.
Despite overall unidimensionality for the three domains, item fit indices revealed several individual items that fell outside Rasch model expectations and may not contribute to measurement of the Verbal, SVS, or DVS underlying dimensions. These results address the second research question regarding which items do and do not contribute to measurement of the dimensions identified through CFA. According to outfit, about 24% of WOMBAT items (43 out of 180 total) showed misfit. The direction of these statistics indicates considerable model underfit (unpredictability in the model) for these items, suggesting further test development should include careful examination and revision of these items. Three items were also identified as underfitting according to infit indices, and these items will need to be revised or replaced. Replacing misfitting items may improve reliability of the WOMBAT. While the current results demonstrated acceptable levels of test–retest reliability and internal consistency for early-stage instrument research at the level of the whole test, more refinement is needed to improve subtest and overall reliability to the level needed for individual assessment and decision making (Nunnally & Bernstein, 1994).
Although further refinement is needed, when only items that showed misfit according to the infit index are considered, 1.67% of the total 180 WOMBAT items showed misfit to Rasch expectations (3 out of 180 total). This is likely because outfit is an unweighted indicator and was influenced by outlying scores in each subtest, while infit is weighted more heavily for persons whose scores that fall near the item difficulty value for a particular item. As noted by Bond and Fox (2001), because infit is a weighted index, it may provide more insight into the performance of an item than outfit. Thus, when focusing on infit indices, the majority (more than 98%) of WOMBAT items appear to meet Rasch expectations and contribute to the measurement of the respective domain’s single underlying dimension.
High person and item reliability indices for each subscale offer support for the consistency of WOMBAT domains, and suggest these results and measurement properties may be generalized beyond the current samples of persons and items. All person reliability index values exceeded .80 and all item reliability index values exceeded .90, showing the WOMBAT domain measurement properties demonstrated in the current study would be similar with those for another sample of persons with similar abilities or of similar items. This can be tested in future research with different samples of both persons and of new items, for example, those generated to replace problem items identified in the current study. Future studies should also evaluate traditional reliability indices with larger samples. In the current study, only 21 individuals participated in the test–retest reliability study, which may have attenuated test–retest correlations.
Moreover, similar analyses to those conducted in the current study can be conducted with younger school-aged children to improve Rasch estimation stability. Differential item functioning (DIF) analyses should also be conducted to determine whether WOMBAT items function differently (i.e., are more or less difficult for certain age groups, taking person ability into account) for school-aged children, adolescents, and adults. The current sample size limited our ability to conduct such analyses, but they are necessary for further validating the WOMBAT for use with different age groups.
Collecting data from school-aged children will also aid in the generation of norms during future standardization of the test. For increased generalizability, future studies and norming efforts should include participant samples that more broadly represent the demographic composition of the United States. The PSI values for the Verbal, SVS, and DVS domains exceeded 2.0, suggesting these WOMBAT domains are capable of distinguishing among at least three groups of persons—low, average, and high ability. This will aid in determining descriptive ranges for WOMBAT subscale scores once the test has been standardized. Unidimensionality and overall fit to the Rasch model for the three domains also means that scores from the WOMBAT Verbal, SVS, and DVS domains can be calibrated to create meaningful ability and difficulty scores, which will also aid in standardization by providing interval-level scores for comparisons between students, between items, or from pre- to postintervention (like W scores on the Woodcock–Johnson tests; Woodcock et al., 2001).
Overall, the results indicate the WOMBAT is a three-factor measure, with Verbal, SVS, and DVS factors each measuring a single dimension, and that most items contribute to measurement of these respective dimensions. The results of the current study provide preliminary psychometric support for the WOMBAT, as well as empirical support for the theoretical organization of WM into three distinct dimensions. Further research and test refinement are needed. However, indices such as test–retest reliability, subtest internal consistency, and item outfit need improvement before the instrument can be used for individual assessment. The current analysis identified misfitting items that can be targeted for revision to increase reliability. With further refinement, the WOMBAT may help schools and clinicians identify and intervene with children with specific WM deficits before their school achievement is negatively affected.
Footnotes
Declaration of Conflicting Interests
The author(s) declared no potential conflicts of interest with respect to the research, authorship, and/or publication of this article.
Funding
The author(s) disclosed receipt of the following financial support for the research, authorship, and/or publication of this article: This research was supported in part by the American Psychological Foundation’s 2013 Elizabeth Munsterberg Koppitz Scholarship, the South Carolina Association of School Psychologists Ralph Tindall Research Award, the American Academy of School Psychology Hyman and Lambert Memorial Scholarship, and the Society for the Study of School Psychology Dissertation Grant Award, awarded to Julia A. Englund.