
Abstract
The Dissociative Symptoms Scale (DSS) was developed to assess moderately severe levels of depersonalization, derealization, gaps in awareness or memory, and dissociative reexperiencing that would be relevant to a wide range of clinical populations. Structural analyses of data from four clinical and five nonclinical samples (N = 1,600) yielded four factors that reflected the domains of interest and showed good fit with the data. Sample scores were consistent with expectations and showed very good internal consistency and temporal stability. Analyses showed consistent evidence of convergent and divergent validity, and posttrauma elevations in scores and in patients with posttraumatic stress disorder provided additional evidence of construct validity. Item response theory analyses indicated that the items assessed moderately severe dissociative experiences. Overall, the results provide support for the reliability and validity of DSS total and subscale scores in the populations studied. Further work is needed to evaluate the performance of the DSS relative to structured interview measures and in samples of patients with other psychological disorders.
Definitions of dissociation have varied greatly over time, and modern conceptualizations are quite diverse, with some focused on alterations in consciousness (including volitional alterations, e.g., hypnosis), others emphasizing divisions in consciousness, and most including a range of pathological and benign phenomena that can vary in intensity (van der Hart & Dorahy, 2009). By the 1990s, dissociation was defined in the Diagnostic and Statistical Manual of Mental Disorders (DSM) as “the disruption of the usually integrated functions of consciousness, memory, identity, or perception of the environment” (American Psychiatric Association, 1994, p. 477). The most recent edition of the DSM expands this list of potentially disrupted functions to include emotion, body representation, motor control, and behavior (American Psychiatric Association, 2013). A recent, broad definition proposed that dissociation is a heterogeneous assortment of phenomena that have in common “an experienced loss of information or control over mental processes that, under normal circumstances, are available to conscious awareness, self-attribution, or control” (Cardeña & Carlson, 2011, p. 251). Dissociative experiences that fall in the clinical realm because they are severe enough to cause distress or disrupt functioning have been categorized into three domains: (1) experiences of disconnectedness that can include distortions in perceptions of self (depersonalization) and one’s surroundings (derealization); (2) gaps in normally accessible aspects of awareness, memory, or identity; and (3) loss of continuity in subjective experience accompanied by involuntary and unwanted intrusions into awareness and behavior (Cardeña & Carlson, 2011). The symptoms are thought to provide emotional, cognitive, and somatosensory distance from overwhelming affect associated with traumatic stress (Carlson & Dalenberg, 2000; Dalenberg & Carlson, 2012; Herman, 1992; Putnam, 1985; Spiegel & Cardena, 1990; van der Kolk, 1987; van der Kolk, van der Hart, & Marmar, 1996).
Dissociative symptoms are the defining features of dissociative disorders (American Psychiatric Association, 2013; World Health Organization, 1993). They have also been associated with disordered attachment experiences (Dutra, Bureau, Holmes, Lyubchik, & Lyons-Ruth, 2009; Maniglio, 2009; Ogawa, Sroufe, Weinfield, Carlson, & Egeland, 1997), exposure to traumatic stress (Carlson, Dalenberg, & McDade-Montez, 2012), and trauma-related disorders, such as acute stress disorder (Cardeña & Carlson, 2011) and posttraumatic stress disorder (PTSD; Carlson et al., 2012). Recently, a dissociative subtype of PTSD defined by persistent or recurrent depersonalization or derealization was added to the American Psychiatric Association’s diagnostic system (2013). Dissociation symptoms have also been associated with diagnoses of complex PTSD (Cloitre et al., 2011), borderline personality disorder (Zanarini & Jager-Hyman, 2009), eating disorders (La Mela, Maglietta, Castellini, Amoroso, & Lucarelli, 2010), panic disorder (Pfaltz, Michael, Meyer, & Wilhelm, 2013), and substance abuse (Najavits & Walsh, 2012). Given the association of dissociative symptoms with disordered attachment, traumatic stress, and a variety of disorders, and the increasing emphasis on dimensional measurement of phenomena across diagnostic categories (Insel et al., 2010; Narrow et al., 2013), measures of dissociative phenomena are needed to assess these symptoms for research and clinical care.
Existing Self-Report Measures of Dissociation
Measures of dissociation have varied in terms of the time frame assessed. Some focus on experiences during unspecified periods in the past, some on “state” experiences during a specified period of minutes (often during an experimental task), some on recent experiences (e.g., in the week just prior to completion of the measure), and some on “peritraumatic” experiences that occurred at or around the time of a specific traumatic stressor. The measure we developed assesses experiences in the week prior to completion, and we briefly review similar measures here.
Several self-report measures of dissociation are available, but none focus exclusively on the moderately severe dissociative experiences that are most clinically relevant for a wide range of populations. The Dissociative Experiences Scale (DES; Bernstein & Putnam, 1986) includes items ranging from mild to very severe. On the severe end of the spectrum, six DES items (Items 4, 5, 7, 8, 11, and 13) assess experiences of extreme identity dissociation that are symptoms of dissociative identity disorder and other dissociative disorders, but not of any other disorder (American Psychiatric Association, 2013). On the mild end of the spectrum, five DES items assess minor gaps in awareness or memory (Items 1, 2, and 20) or moderately intense absorption or imaginative involvement (Items 17 and 18). Mild or moderate levels of absorption and imaginative involvement and accompanying gaps in awareness have been associated with exposure to trauma in clinical samples (Allen, Fultz, Huntoon, & Brethour, 2002), but these experiences can also reflect intense mental engagement as occurs in the mental state of “flow” (Csikszentmihalyi, 1990). In a study of DES psychometrics, minor gaps in awareness and moderately intense absorption or imaginative involvement were endorsed by 59% to 89% of adults in a nonclinical sample (Carlson & Putnam, 1993), indicating that they are not clear indicators of dissociation that reflect psychopathology.
About one third of Multiscale Dissociation Inventory (Briere, 2002) items assess experiences that are primarily relevant to those with dissociative disorders. The Cambridge Depersonalization Scale (Sierra & Berrios, 2000) provides no information about other types of dissociation that may be associated with traumatic stress, disordered development, or other psychological disorders. The Multidimensional Inventory of Dissociation (MID; Dell, 2006) is a comprehensive measure of dissociation, but it is lengthy, and many of its 218 items focus on extremely severe symptoms of dissociative disorders, making it unsuitable for routine clinical assessment or research that does not focus on dissociative disorders. Selected MID subscales could be used to measure facets of dissociation that occur outside of dissociative disorders, but with 12 items in each subscale, measuring several domains of dissociation would still require a very large number of items.
In summary, prior measures of dissociation have included domains of experience and items that are not clearly clinically relevant or are extremely severe and relevant for very few clinical populations. A measure focused on dissociative symptoms that are moderately severe seems most likely to be relevant to a wide variety of clinical populations. A focus on the midrange of the continuum of dissociative experiences could increase the sensitivity of measurement of dissociation, reduce “false positives” due to endorsement of benign experiences, and provide more information about symptoms that interfere with functioning and may require treatment.
Current Study
The goal of this research was to develop a measure of moderately severe dissociation and study its reliability and validity in several clinical and nonclinical samples. The Dissociative Symptoms Scale (DSS; Carlson & Waelde, 1999) was intended to assess moderately severe symptoms of (1) distortions in perceptions of self (depersonalization) or one’s surroundings (derealization), (2) experiences of gaps in awareness or memory, and (3) trauma-related reexperiencing or intrusions in perceptions, cognitions, or behavior. To examine the psychometric properties of the measure, we studied samples of adults exposed to traumatic stress, clinical samples of patients with trauma-related disorders, and nonclinical samples. Below, we describe the process of initial item development, structural analyses, and analyses to examine whether the DSS items assess dissociation of moderate severity. In light of prior research findings of a low, negative relationship between dissociation and age (Putnam, Carlson, Ross, & Anderson, 1996; van IJzendoorn & Schuengel, 1996) and no relationship to gender (van IJzendoorn & Schuengel, 1996), we hypothesized similar relationships of DSS scores to these variables. In addition, we conducted analyses to examine the internal consistency and test–retest reliability of DSS scores, the possible impact of a change in response options, and the convergent and divergent validity of DSS scores. We also investigated construct validity by examining evidence of elevation in DSS scores in theoretically predicted contexts: in those with prior exposure to potentially traumatic, high-magnitude stressors (HMS; Carlson et al., 2012); in the days immediately following exposure to traumatic stress (Cardeña & Spiegel, 1993; Dancu, Riggs, Hearst-Ikeda, Foa, & Shoyer, 1996); and in those who meet the criteria for PTSD following traumatic stress (Carlson et al., 2012; Halligan, Michael, Clark, & Ehlers, 2003).
Method
Participants and Procedures
Descriptions of the participants and procedures for each sample are provided below. Demographic characteristics for all samples are reported in Table 1. Informed consent for participation in research was obtained from all the participants.
Characteristics of the Samples.
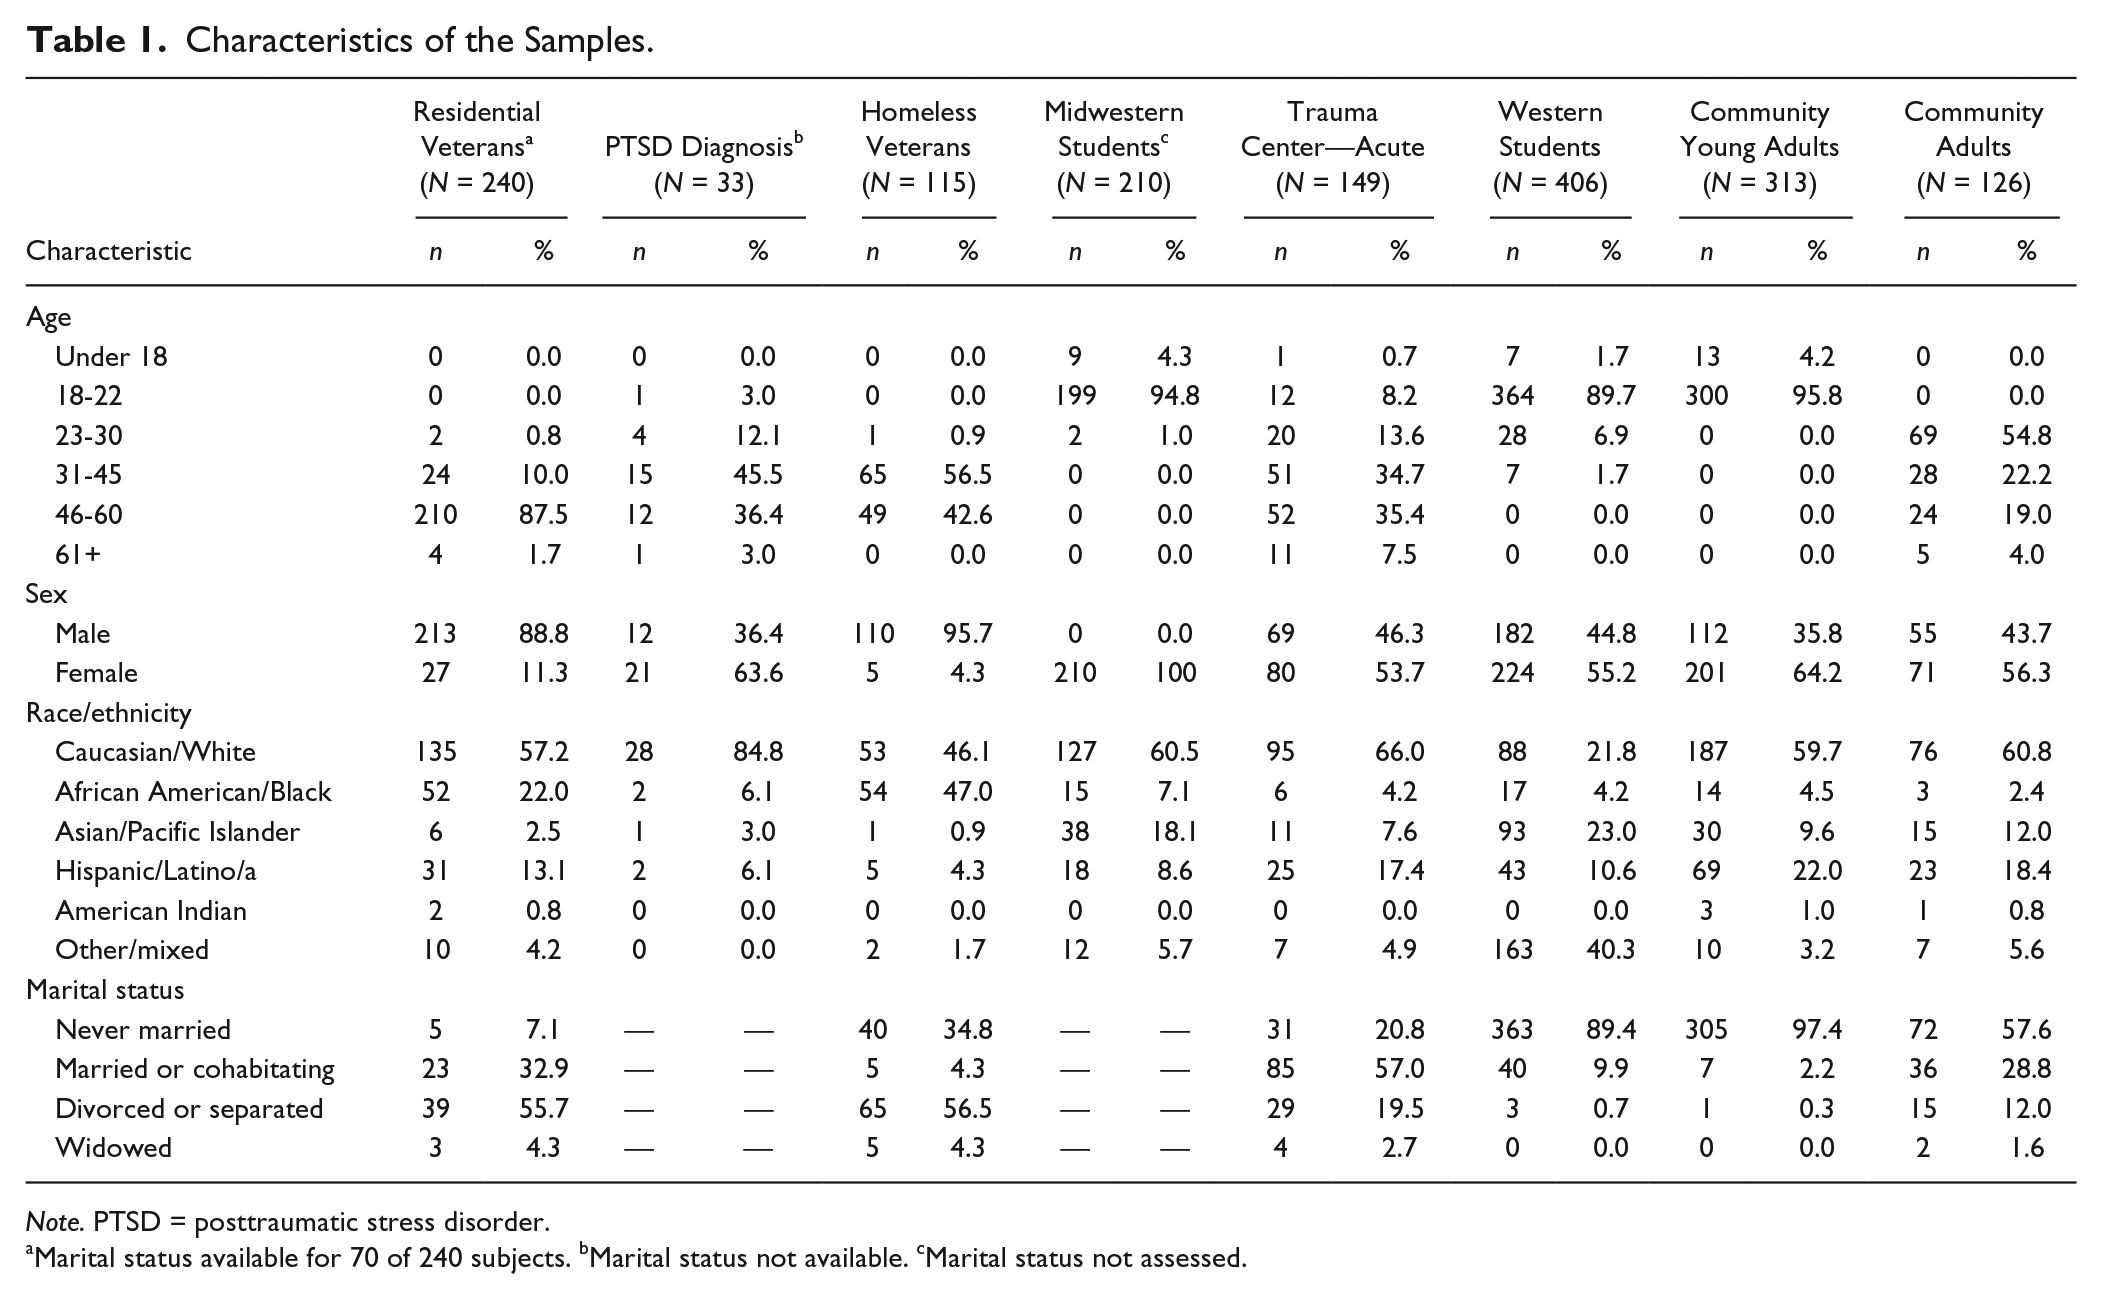
Note. PTSD = posttraumatic stress disorder.
Marital status available for 70 of 240 subjects. bMarital status not available. cMarital status not assessed.
Residential Veterans
Participants were 240 Vietnam War veterans participating in a U.S. Veterans Health Administration residential treatment program for chronic and severe PTSD related to combat or other trauma exposure during military service. Measures of dissociation and PTSD were administered on admission as part of a routine intake assessment program.
PTSD Diagnosis
Participants were 34 adults with PTSD recruited by newspaper and radio ads for a study of antidepressant medication (Marshall, Beebe, Oldham, & Zaninelli, 2001). All the participants met the diagnostic criteria for PTSD using a structured interview and completed the DSS as part of a battery of measures at the outset of the study.
Homeless Veterans
Participants were 115 homeless veterans participating in a residential rehabilitation program focused on finding housing and employment. All were unemployed and homeless on entering the program. Subjects were recruited via announcements during program meetings or through notes left in their mailboxes (Carlson, Garvert, Macia, Ruzek, & Burling, 2013). The veterans were paid $10 for their participation.
Midwest Students
Participants were 210 female students taking an introductory psychology course at a large Midwestern state university who were given course credit to take part in a study of sexual assault experiences and responses. The participants completed the questionnaires in large-group testing sessions. One week following completion of the DSS, 120 participants completed the DSS a second time.
Trauma Center—Acute and Trauma Center—PTSD
Participants in the Trauma Center—Acute sample included adults who experienced traumatic stress following serious injury to themselves or a close family member (Carlson, Palmieri, et al., 2016). DSS data were available at one or more time points for 149 participants, including 82 seriously injured patients who were admitted to the hospital and 67 family members of such patients. All participants experienced pronounced distress following the event, and the symptom levels of patients were not significantly different from those of family members (Carlson, Palmieri, et al., 2016). DSS data were collected 2 months posttrauma for 116 of the 149 participants (78%). The Trauma Center—PTSD group was composed of the 33 participants who reported symptoms consistent with a PTSD diagnosis when assessed 2 months posttrauma. The first 69 participants in an initial study of the impact of trauma on patients and family members were not paid, whereas those enrolling in a later trial were paid $25 for each assessment.
Western Students
Participants in the Western Students sample were 406 undergraduate psychology students from a midsize Western state university who were recruited to take part in a study of race-related stress for course credit (Khaylis, Waelde, & Bruce, 2007). Students were recruited through their enrollment in an introductory psychology course. These participants completed the questionnaires in large group testing sessions.
Community Young Adults and Adults
Participants in the Community samples were recruited in the Western United States from a university (n = 109), a community college (n = 152), and shopping areas in two small cities (n = 186). Those recruited in college settings completed the measures in a large-group testing setting and received course credit. Those recruited in the community were approached in shopping areas and received a $5 gift card. Because many of the participants recruited in the college settings were older than “traditional” college students and many in the shopping areas were students, we examined DSS scores by recruitment setting and age to determine whether Community participants should be grouped by recruitment setting or age. The DSS scores did not differ significantly by recruitment setting, t(442) = 1.6, NS, but were significantly related to age in young adults (age 15-22 years), r = −.29, p < .001. Therefore, for the analyses presented, the Community samples were grouped into Young Adults, 15 to 22 years old (n = 313), and Adults, aged 23 years or older (n = 126).
Measures
DSS Item Development
Drawing on concepts described in previous measures (Bernstein & Putnam, 1986), descriptions in the clinical literature (Waelde, Silvern, Carlson, Fairbank, & Kletter, 2009), and clinical experience, two of the authors (EBC and LCW) developed 24 items that were intended to inquire about dissociative symptoms that are moderately severe and functionally disruptive (Carlson & Waelde, 1999). The domains we intended to assess were (1) distortions in perceptions of self (depersonalization) or one’s surroundings (derealization), (2) gaps in awareness or memory, and (3) trauma-related reexperiencing of sensations, cognitions, or behavior. The items included four depersonalization items (e.g., “I felt like I wasn’t myself”), four derealization items (e.g., “Things around me seemed strange or unreal”), nine reexperiencing (intrusion) items, threeitems assessing gaps in memory (e.g., “I couldn’t remember things that had happened during the day even when I tried to”), and four items assessing gaps in awareness (e.g., “I found myself staring into space and thinking of nothing”). Reexperiencing items included four items that assess cognitive or behavioral reexperiencing (e.g., “I had moments when I lost control and acted like I was back in an upsetting time in my past”) and five items that assess sensory perceptions (e.g., “I smelled something that I know wasn’t really there”). Instructions state the following: “For each statement below, circle one of the choices to show how much each thing has happened to you in the past week.” The first version of the measure that was administered to the samples of Homeless Veterans, Residential Veterans, adults with a PTSD Diagnosis, Midwestern Students, and Western Students used a response scale with the following options: not at all, once or twice, 3 to 6 times, 7 to 10 times, and more than 10 times (coded 0-4). A version of the measure with the response options revised to make them more intuitively clear was administered to the Trauma Center and Community samples. The revised response options were as follows: not at all, once or twice, almost every day, about once a day, and more than once a day (coded 0-4).
The Dissociative Experiences Scale
The DES was used as a second measure of dissociation symptoms in the Residential Veterans and Western Students samples (Bernstein & Putnam, 1986; Carlson & Putnam, 1993). The DES is a 28-item self-report measure that assesses experiences of amnesia, depersonalization, derealization, absorption, and imaginative involvement. Responses indicate the percentage of time the items are experienced (0, 10, 20, 30, . . . , 100). The DES has been well validated in many studies including a wide range of diagnostic groups (Bernstein & Putnam, 1986; Carlson & Putnam, 1993; van IJzendoorn & Schuengel, 1996).
Screen for Posttraumatic Stress Symptoms
The Screen for Posttraumatic Stress Symptoms (SPTSS; Carlson, 2001; Caspi, Carlson, & Klein, 2007) was used to assess PTSD symptoms in the Trauma Center and Community samples. The SPTSS is a 17-item measure that assesses the frequency of PTSD symptoms related to one or more traumatic stressors. SPTSS items are rated in reference to the past week using the following response options: not at all, 1 or 2 times, almost every day, about once every day, and more than once every day (scored 0 to 4). The SPTSS has demonstrated good internal validity and strong concurrent validity to predict diagnosis of PTSD derived from structured interviews (Carlson, 2001; Caspi et al., 2007). In a sample of 40 adult survivors of traumatic injury to self or a loved one, a score of 20 predicted diagnosis on the Clinician-Administered PTSD Scale (CAPS) with a sensitivity of .90 and a specificity of .80 (unpublished data), using the CAPS scoring rule of total severity ≥45 (Weathers, Ruscio, & Keane, 1999).
PTSD Checklist
The PTSD Checklist–Civilian (PCL-C; Weathers, Litz, Herman, Huska, & Keane, 1993) and PCL–Military (PCL-M) were used to measure PTSD symptoms in the Midwest Students, Residential Veterans, and Homeless Veterans samples. The PCL is a 17-item self-report measure that assesses distress related to each of the 17 DSM-IV symptom criteria for PTSD. For each item, participants indicate how much they have been bothered by the symptom in the past month, with the following response options: not at all, a little bit, moderately, quite a bit, and extremely (scored 1 to 5). The PCL-C inquires about PTSD symptoms related to any traumatic stressor, and the PCL-M inquiries about PTSD symptoms related to any traumatic stressors occurring during military service. The PCL has been found to have good internal consistency reliability and adequate convergent validity with other measures of PTSD (Wilkins, Lang, & Norman, 2011).
Clinician Administered PTSD Scale
The CAPS (Weathers, Keane, & Davidson, 2001) was used to assess PTSD symptoms in the PTSD Diagnosis and Residential Veterans samples. The CAPS is a well-validated structured interview that assesses the frequency and intensity of the 17 DSM-IV symptom criteria for PTSD. For the analyses reported here, the severity score (sum of frequency and intensity scores) was used as an index of PTSD symptoms.
Trauma History Screen
The Trauma History Screen (THS) was used to measure trauma exposure in the Homeless Veterans, Community Adults, Community Young Adults, and Midwest Students samples (Carlson et al., 2011). The THS is a brief self-report measure of exposure to HMS events and events associated with significant, persisting posttraumatic distress. Participants circle YES or NO to indicate whether any of 15 HMS events happened to them. For any HMS that is marked, respondents then indicate how many times “something like this” happened to them. Only HMS scores are reported here. THS HMS scores have been shown to have good to excellent temporal stability and strong convergent and content validity in clinical and nonclinical samples (Carlson et al., 2011).
Perceived Stress Scale
The Perceived Stress Scale (PSS) was used to assess subjective perceptions about stress in the past month in the Trauma Center samples. The Perceived Stress Scale has demonstrated reliability and validity in a wide range of populations (Cohen, Kamarck, & Mermelstein, 1983).
Alcohol Use Disorders Identification Test
The Alcohol Use Disorders Identification Test was used to assess disordered alcohol use in the Trauma Center samples. The Alcohol Use Disorders Identification Test correlates highly with other measures of alcohol problems and performed well in predicting alcohol use disorder diagnoses in a nonclinical population (Babor, 2000).
Results
Structural Analyses
We used factor analysis methods to determine whether there is an underlying structure that is relatively simple, easy to interpret, and shows a good fit in a confirmatory factor analysis (CFA) in second set of data. Data for all samples were combined (N = 1,600) and then split into halves (odd/even split by sample). To determine the optimal number of factors, one split half was analyzed using two recommended methods that compare randomly generated eigenvalues with those associated with principal components analysis (PCA; Ruscio & Roche, 2012; Velicer, 1976). The minimum average partial method indicated that a two-factor structure would be optimal, and the parallel analysis method indicated that a three-factor structure would be optimal. Based on the results of the minimum average partial and parallel analyses, PCAs specifying extraction of two and three factors with Promax rotation were conducted. There were cross-loadings on two factors for two items in the two-factor PCA and for four items in the three-factor PCA, and both sets of factor loadings were difficult to interpret because of apparently dissimilar experiences loading onto the same factor. We then conducted a PCA with four factors specified and Promax rotation, and the factors accounted for 60.1% of the variance in item scores and were easily interpreted. Factor loadings for this analysis are shown in Table 2.
Dissociative Symptoms Scale Factor Loadings for Principal Components Factor Extraction Analysis of First Half and Confirmatory Factor Analysis of Second Half of Data From All Samples.
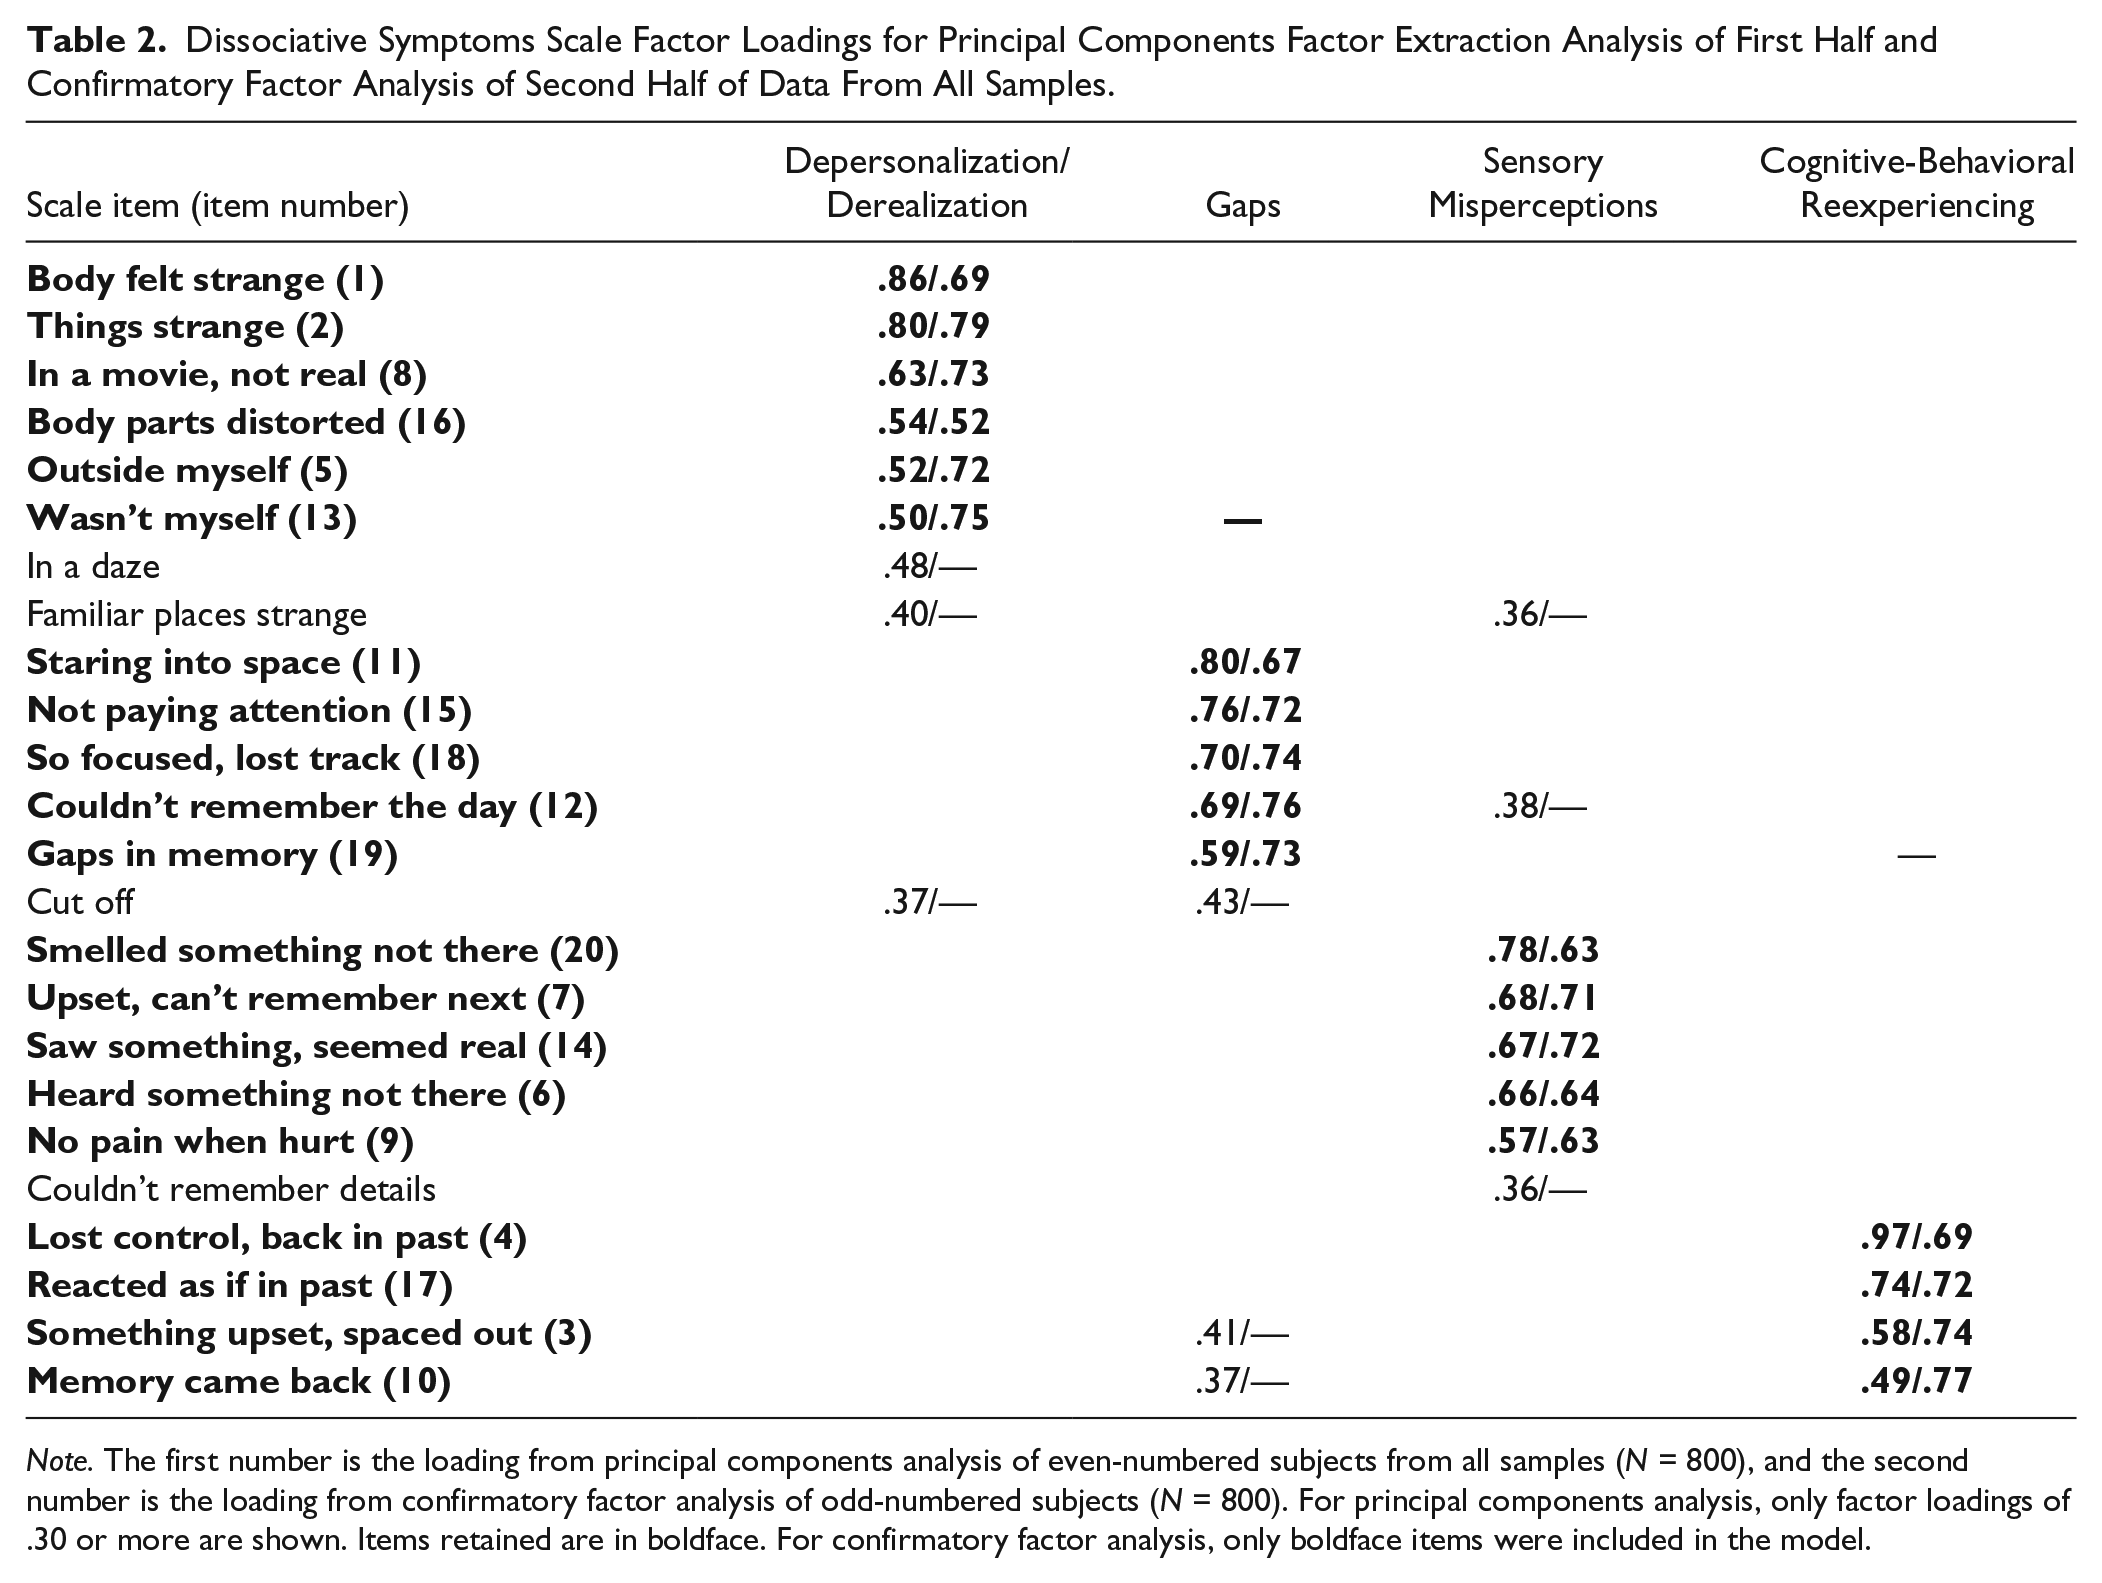
Note. The first number is the loading from principal components analysis of even-numbered subjects from all samples (N = 800), and the second number is the loading from confirmatory factor analysis of odd-numbered subjects (N = 800). For principal components analysis, only factor loadings of .30 or more are shown. Items retained are in boldface. For confirmatory factor analysis, only boldface items were included in the model.
Given these discrepant findings, CFAs were conducted on the second split half of the data to compare fit of two-, three-, and four-factor structures. To increase the homogeneity of the scales, we retained only the highest loading items that loaded primarily on one factor. For all CFAs, items that loaded .49 or higher in the respective two-, three-, and four-factor PCAs were mapped to factors, maximum likelihood estimation was used, and model fit was assessed using root mean square error of approximation (RMSEA), standardized root mean square residual (SRMR), and comparative fit index (CFI; Kline, 2011). Lower RMSEA and SRMR values were interpreted as better fit, with values of less than .06 and .08, respectively, suggesting good fit (Hu & Bentler, 1999). For CFI, higher values were interpreted as better fit, with values greater than .90 indicating adequate fit as difficulty in reaching the more stringent .95 threshold when using CFA to evaluate the dimensionality of a measure has been noted (Marsh, Hau, & Wen, 2004). Bayesian information criterion (BIC) was also used to compare the models because it takes parsimony into account when evaluating model fit (Schwarz, 1978), and lower values were preferred. The four-factor model demonstrated superiority across all fit indices except BIC, which had a slightly lower value for the two-factor solution (two-factor model: Satorra-Bentler [SB] χ2 = 606, degrees of freedom [df] = 169, RMSEA = .057, SRMR = .050, CFI = .89, BIC = 33,835; three-factor model: SB χ2 = 554, df = 186, RMSEA = .050, SRMR = .049, CFI = .91, BIC = 35,549; four-factor model: SB χ2 = 443, df = 164, RMSEA = .046, SRMR = .046, CFI = .92, BIC = 34,025). BIC reflects only one aspect of the model being tested and favors parsimony, which may account for the slightly lower value for the two-factor model. The two-factor model demonstrated the worst fit of the three models on RMSEA, SRMR, and CFI and did not reach the selected threshold for CFI. Modification indices were examined for the four-factor CFA, but all were relatively small, resulting in minimal improvements in fit (decrease in RMSEA and SRMR of .001 and increase in CFI of .004).
Item loadings for the four-factor CFA are shown in Table 2. Given the four-factor model’s interpretability and superiority on most model fit indices, the four-factor model was selected as optimal. The factors were identified as Depersonalization and Derealization (1, 2, 5, 8, 13, 16), Gaps in Awareness and Memory (11, 12, 15, 18, 19), Sensory Misperceptions (6, 7, 9, 14, 20), and Cognitive and Behavioral Reexperiencing (3, 4, 10, 17). All the remaining analyses were conducted using these 20 retained items. Interfactor correlations ranged from .52 to .58 in the four-factor PCA and from .72 to .83 in the four-factor CFA. Correlations between the scores of the 20 items that loaded well in the four-factor PCA and item-corrected total scores were also calculated for the entire data set. The range of correlations was .49 to .69, the mean correlation was .61 (SD = .06), and the median correlation was .63. Given that all 20 items that loaded well onto the four factors showed moderately strong correlations with the item-corrected total scores, all were retained. The 20 retained items (shown in bold in Table 2) were used for all the analyses reported below, and the final version of the measure is included in the online supplementary file (available at http://asm.sagepub.com/supplemental).
Analyses to Examine the Level of Dissociation Assessed by DSS Items
Total scores and scores for the scales formed by the four factors derived from the analyses described above were calculated and are shown in Table 3 for clinical samples (Residential Veterans, PTSD Diagnosis, Trauma Center—PTSD, and Homeless Veterans) and in Table 4 for nonclinical samples (Midwest Students, Trauma Center—Acute, Western Students, Community Young Adults, and Community Adults). Total DSS scores are the sum of the scores for the 20 items retained, and the subscale scores are the mean of the scores for the retained items listed for each factor in Table 2. We report mean scores for scale scores to facilitate interpretation of scores across factors with different numbers of items. Total and subscale scores for all clinical samples were higher than for all nonclinical samples.
Descriptive Statistics of DSS Total and Subscale Scores for Clinical Samples.
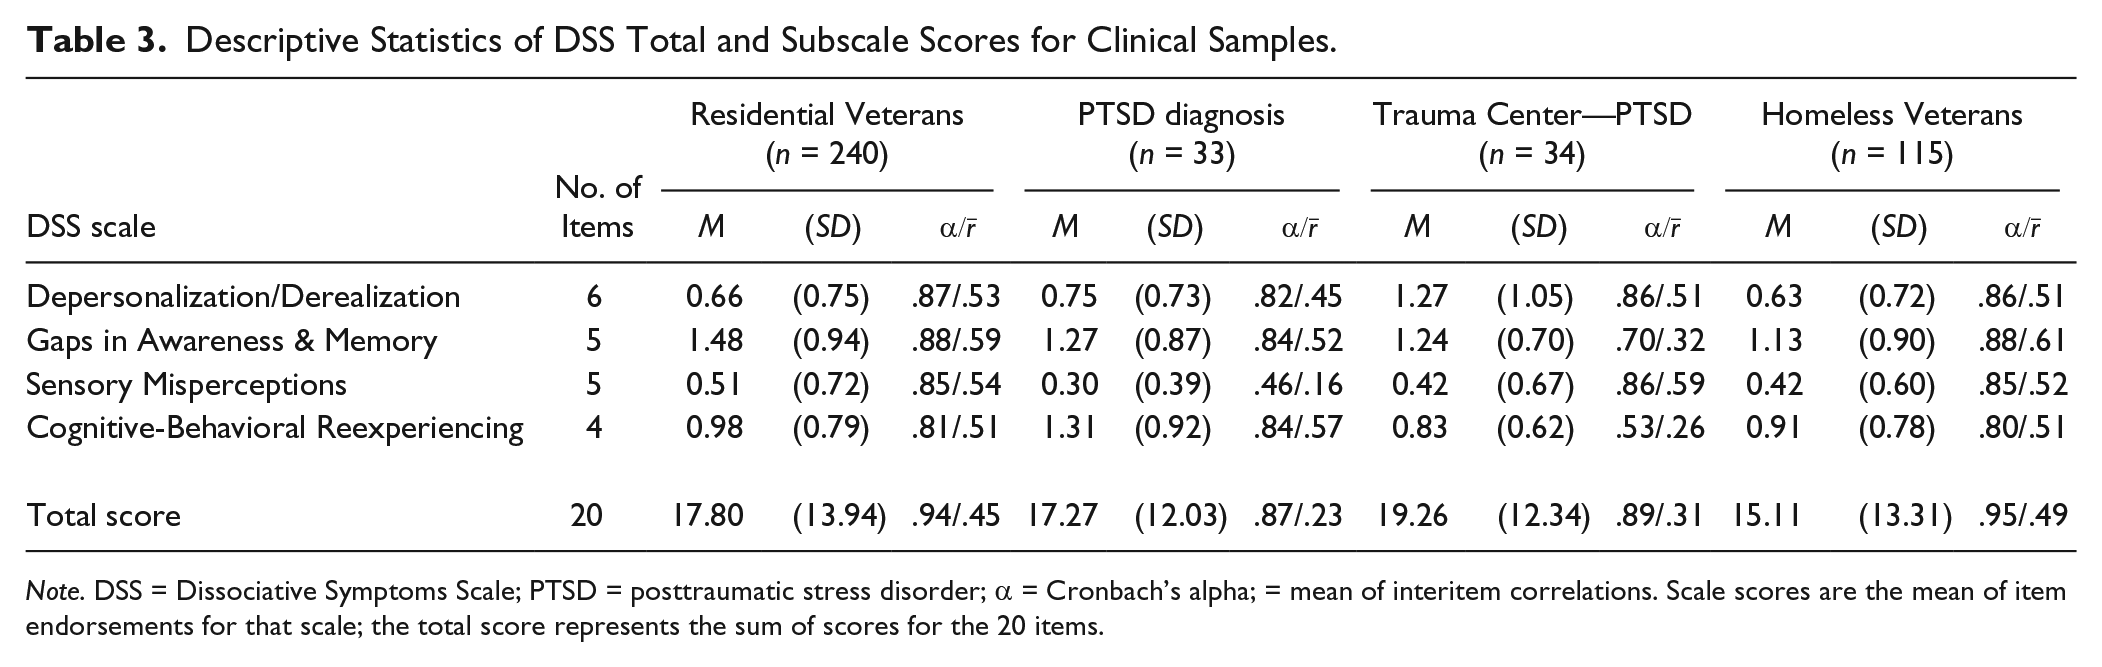
Note. DSS = Dissociative Symptoms Scale; PTSD = posttraumatic stress disorder; α = Cronbach’s alpha; = mean of interitem correlations. Scale scores are the mean of item endorsements for that scale; the total score represents the sum of scores for the 20 items.
Descriptive Statistics of DSS Total and Subscale Scores for Nonclinical Samples.
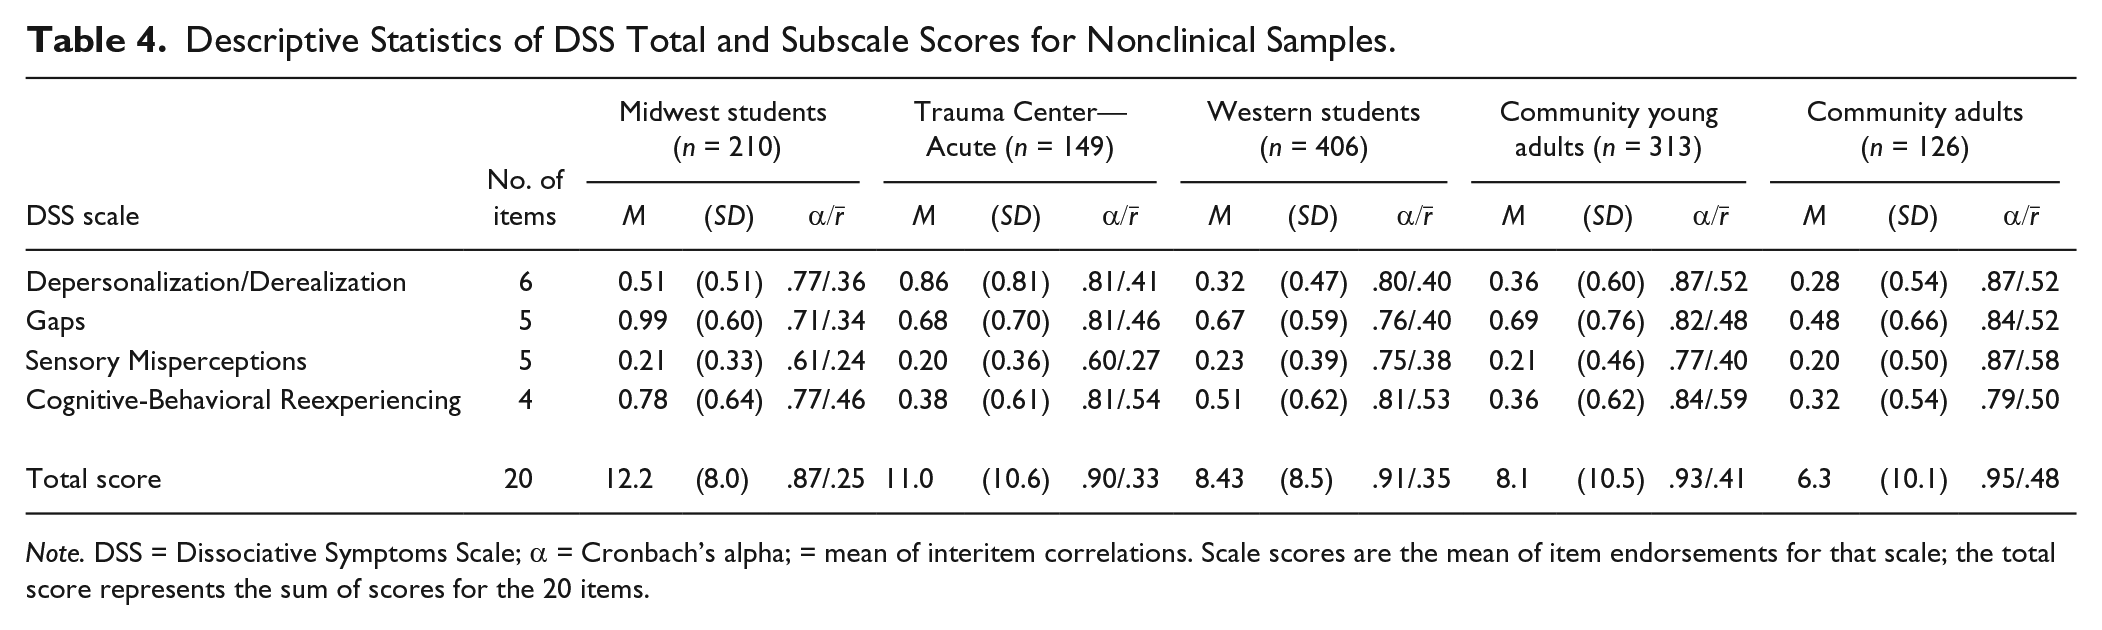
Note. DSS = Dissociative Symptoms Scale; α = Cronbach’s alpha; = mean of interitem correlations. Scale scores are the mean of item endorsements for that scale; the total score represents the sum of scores for the 20 items.
Item response theory (IRT) analyses were conducted on DSS and a subset of DES items in a sample of clinical (Residential Veterans) and nonclinical (Western Students) participants (n = 523) to investigate whether DSS items assess moderately high levels of dissociation that are the most clinically relevant. DES items included five items intended to assess relatively mild dissociative experiences and six items intended to measure severe identity dissociation (Carlson & Putnam, 1993). Analyses were conducted using a bifactor graded response model (Gibbons et al., 2007; Samejima, 1969) with the R package mirt (Chalmers, 2012). All results are reported with respect to a general factor that characterized the underlying latent trait measured by all of the DSS and DES items studied (i.e., dissociation). Details on evaluation of dimensionality, local independence, and model fitting are provided in the online supplementary file (available at http://asm.sagepub.com/supplemental).
Two types of item parameters are obtained in IRT analysis: item location and item discrimination (Baker, 2001). For each item with k response options, k − 1 location parameters (β j ) are estimated that correspond to each threshold between response categories. These item locations identify the severity of the latent trait needed for an individual to have a 50% probability of endorsing the category above the threshold. Latent trait severities (θ) have a mean of 0 and SD of 1, therefore an item location of 1.0 indicates that 50% of individuals with a latent trait severity of 1 SD above the mean would endorse the response category above the threshold. We examined item location estimates for the first threshold to determine whether any endorsement of DSS items requires a moderate latent trait severity relative to the latent trait severity required for any endorsement of mild and severe DES items.
Item discrimination parameters (α) reflect how well items differentiate between individuals with different levels of the latent trait. Table 5 summarizes item discrimination estimates and first-threshold location estimates for mild DES, DSS, and severe DES items. Item location estimates for the first threshold indicated that, on average, a latent trait severity of 0.5 SD above the mean was associated with a 50% probability of DSS item endorsement, which fell between the average first-threshold locations of −2.1 SD for mild DES items and 0.8 SD for severe DES items. DSS items also had higher discrimination estimates than most DES items. All discrimination and location estimates for DSS items are provided in Table 8 in the online supplementary file (available at http://asm.sagepub.com/supplemental).
Summary of Item Response Theory Item and Latent Trait Parameter Estimates for DSS and Mild and Severe DES Items.
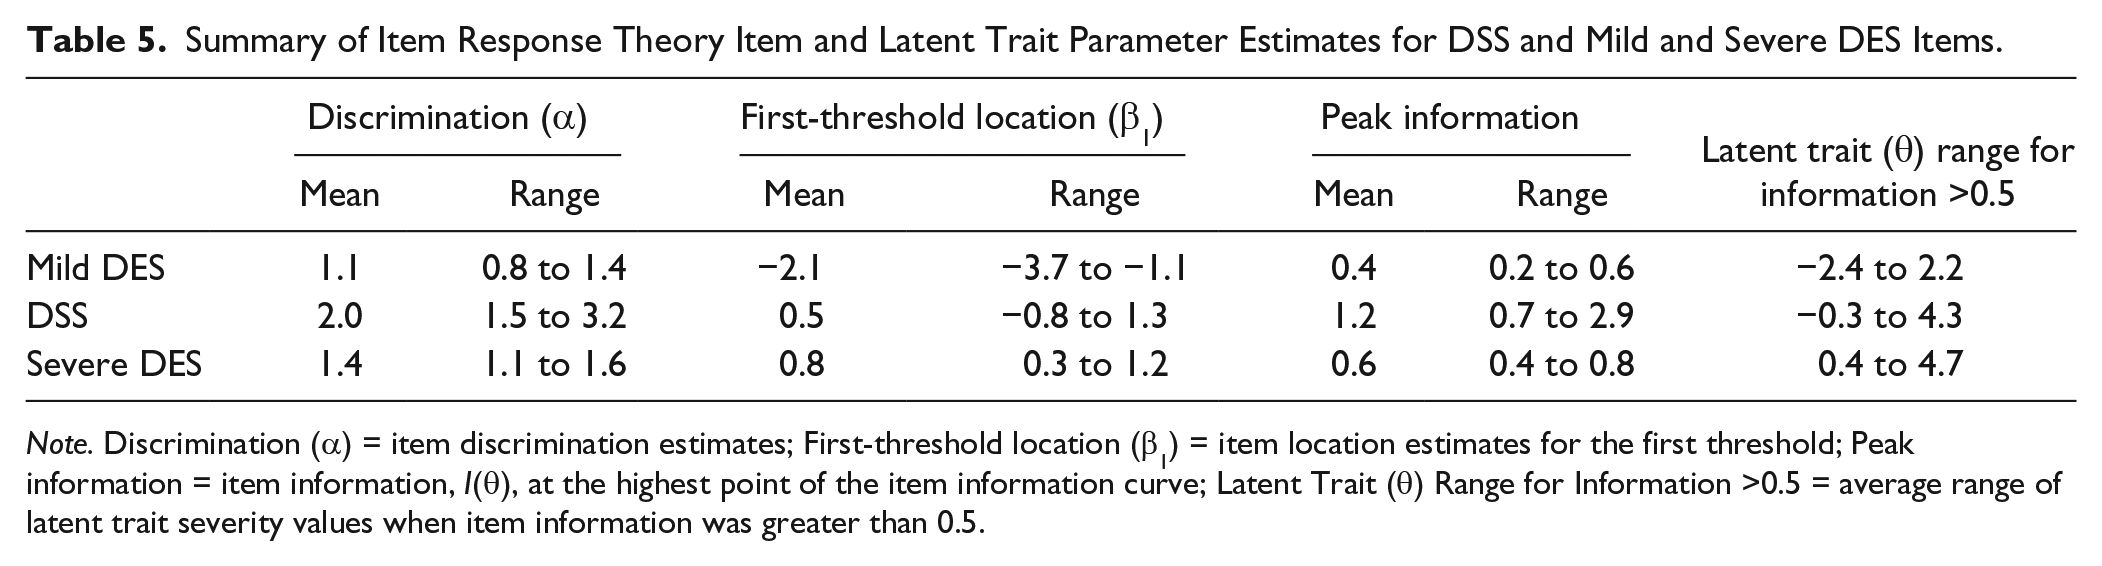
Note. Discrimination (α) = item discrimination estimates; First-threshold location (β1) = item location estimates for the first threshold; Peak information = item information, I(θ), at the highest point of the item information curve; Latent Trait (θ) Range for Information >0.5 = average range of latent trait severity values when item information was greater than 0.5.
IRT results were used to construct item information curves (IICs), which provide a graphic representation of each item’s precision in measuring latent trait severities across the full latent trait continuum (Baker, 2001), where the x-axis corresponds to latent trait severity and the y-axis is the amount of information an item provides in discriminating latent trait severities. Figure 1 shows IICs for two DSS items, one mild DES item, and one severe DES item, and the IICs for all items are shown in Figures 2 and 3 in the online supplementary file (available at http://asm.sagepub.com/supplemental). The IICs in Figure 1 show that DSS items tended to have higher peaks than mild and severe DES items and that DSS items were centered over a latent trait range that is higher in severity than for mild DES items. Average peak information and average latent trait severity range corresponding to item information values >0.5 are shown in Table 5. Peak information indicates an item’s highest information value, and latent trait severity range identifies the range of severity for which an item achieves information values >0.5.
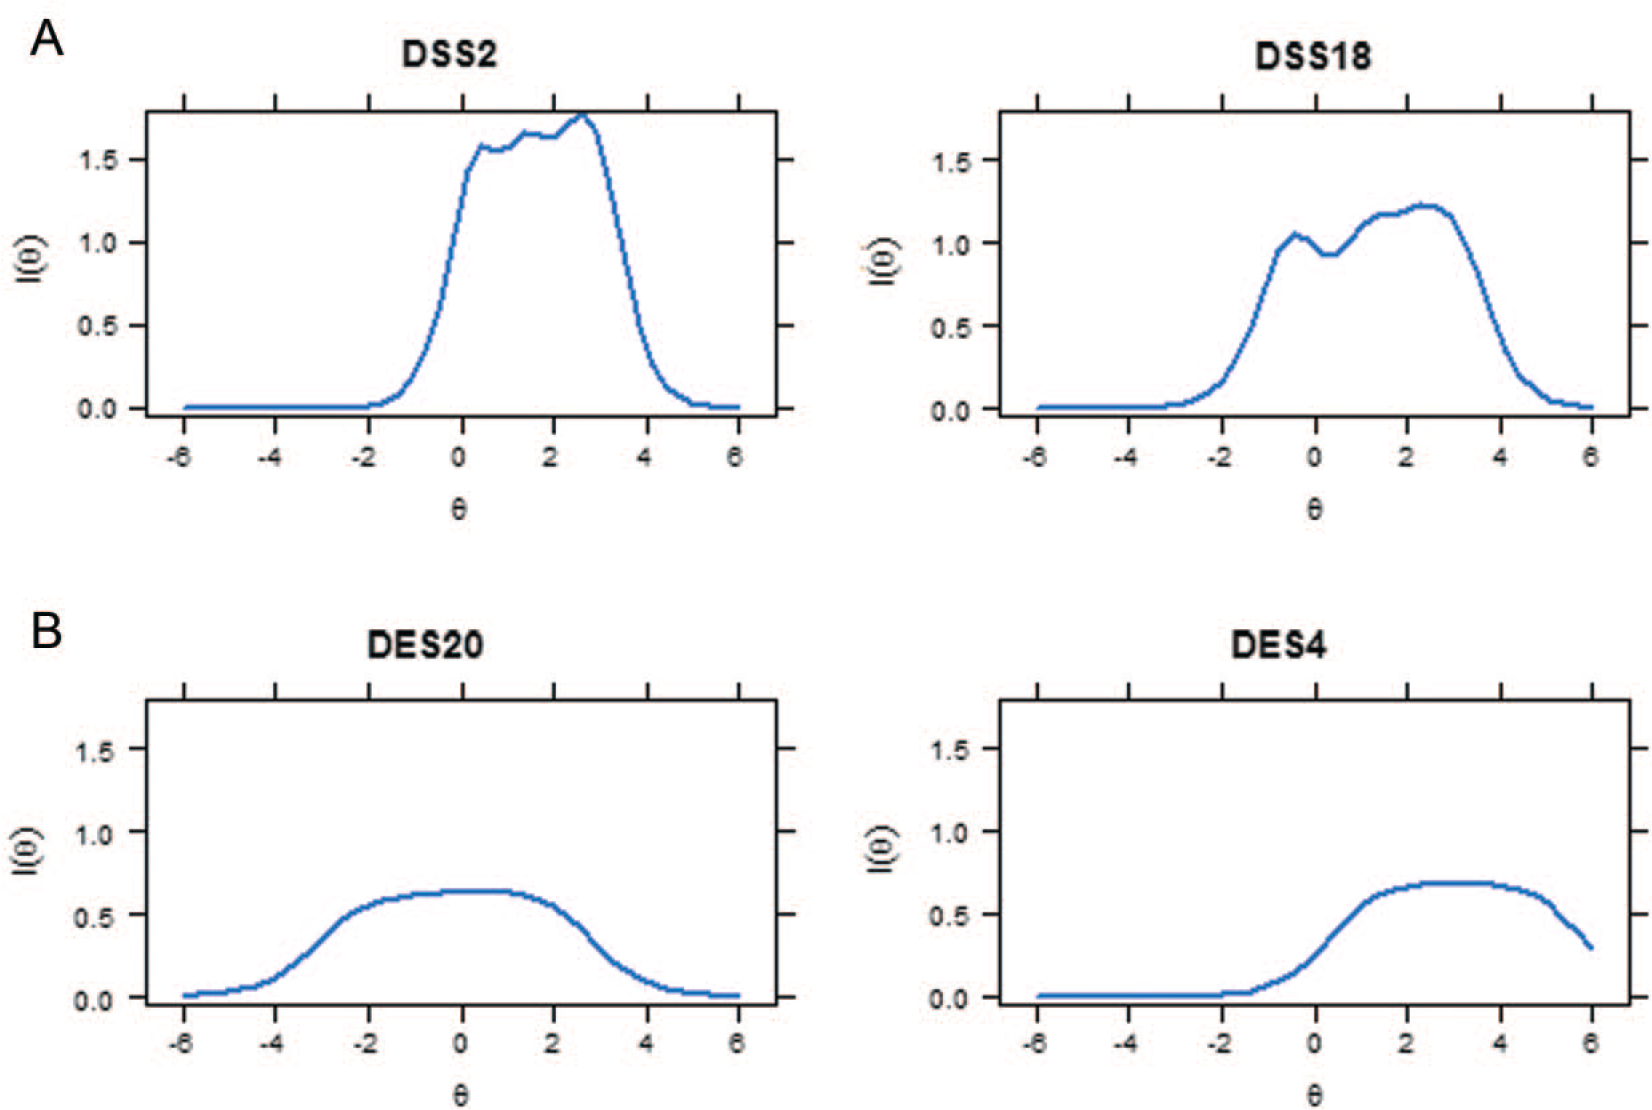
Example item information curves for Dissociative Symptoms Scale (DSS) and Dissociative Experiences Scale (DES) items.
Internal Consistency and Temporal Stability
Internal reliability was examined for total and subscale scores in each sample. Values for Cronbach’s alpha and mean interitem correlations are reported in Tables 3 and 4. Test–retest reliability over 1 week was r = .65 (p < .001, n = 82) in Trauma Center—Acute subjects’ total DSS scores and r = .70 (p < .001, n = 120) for Midwestern Students’ total DSS scores.
Demographic Analyses
We conducted analyses of DSS scores across different ages and genders to examine whether scoring patterns were consistent with those predicted by theory and observed on other dissociation measures. To investigate the relationship of age to DSS scores, we examined the scores of participants from the Western Students, Midwestern Students, and Community nonclinical samples (total n = 1,063). The Trauma Center—Acute sample was excluded because those individuals had been recently exposed to traumatic stress and were therefore expected to have elevated levels of dissociation. For these nonclinical participants, r = −.125, p < .001. Visual inspection of the data revealed a gradual decrease in DSS scores up to the age of 21 years. DSS scores for those 21 years old and under (M = 9.4, SD = 9.2) were significantly greater than the scores for those over 21 years (M = 6.7, SD = 9.8), t(1, 1,053) = 3.88, p < .001, d = .28. Age and DSS scores were significantly related in those 21 and under (r = −.24, p < .001) but not in those over 21 (r = −.05, NS).
DSS scores of men and women were compared in younger and older participants for all nonclinical samples (except the Trauma Center—Acute sample). For those 21 and under, total DSS scores did not significantly differ between men and women, t(1, 819) = 1.25, NS, but women scored significantly higher than men on the Cognitive-Behavioral Reexperiencing subscale, t(1, 819) = 3.51, p < .001, d = 0.26, and men scored significantly higher than women on the Sensory Misperceptions subscale t(1, 819) = 1.93, p < .05, d = 0.15. In the older age group, men also scored significantly higher than women on Sensory Misperceptions, t(1, 232) = 2.00, p < .01, d = 0.29. Only one analysis was conducted with the combined clinical samples, as 99% of subjects were over 21. No difference was found in total DSS scores, but women scored significantly higher than men on the Depersonalization/Derealization subscale, t(1, 420) = 2.18, p < .03, d = 0.27.
Impact of Change in Response Options
Analyses were conducted to investigate the impact of the change in response options from not at all, once or twice, 3 to 6 times, 7 to 10 times, and more than 10 times (coded 0-4) to not at all, once or twice, almost every day, about once a day, and more than once a day (coded 0-4). Those who had an experience six times in a week might have endorsed 3 to 6 times on the old version (score = 2) and about once a day on the new version (score = 3). Similarly, those who had an experience 9 or 10 times in a week might have endorsed 7 to 10 times on the old version (score = 3) and more than once a day on the new version (score = 4). We estimate that one quarter of those choosing 3 to 6 times and half of those choosing 7 to 10 times would be scored 1 point higher if the new response options were used. Data from subjects completing the DSS with the old response format show that 9.1% of the respondents chose the response option 3 to 6 times and 3.2% of the respondents chose the response option 7 to 10 times. Applying our estimates for the proportion of item scores that would change, the effect on scores was likely small, as only 3.9% of item scores would increase by 1 point (one quarter of 9.1% and one half of 3.2%).
We also compared the structures of responses to the old and new response options by conducting PCA analyses (extracting four factors with Promax rotation) of the item scores for subjects completing versions of the DSS with the old and new response options. The analyses yielded the same overall structures, the same factors, and the same items loading on each factor.
Convergent and Divergent Validity
To examine convergent validity, we correlated scores on the DSS with scores on another dissociation measure in 130 Residential Veterans (r = .63, p < .001) and 406 Western Students (r = .57, p < .001). To examine convergence between DSS scores and scores on measures of related constructs, we calculated correlations between DSS scores and scores on measures of trauma exposure and PTSD (see Table 6). Correlations were moderate with trauma exposure in Homeless Veterans and Community subjects and lower, but still significant, in Midwest Student subjects. Correlations were moderate to high (ranging from .44 to .86) with PTSD symptoms. In the Residential Veterans sample, the correlation between the DSS and DES was significantly greater than that between the DSS and PCL-M, t(127) = 2.55, p < .01, d = .45.
Descriptive Statistics and Correlations With DSS Scores for Measures of Dissociation, Trauma Exposure, and PTSD.
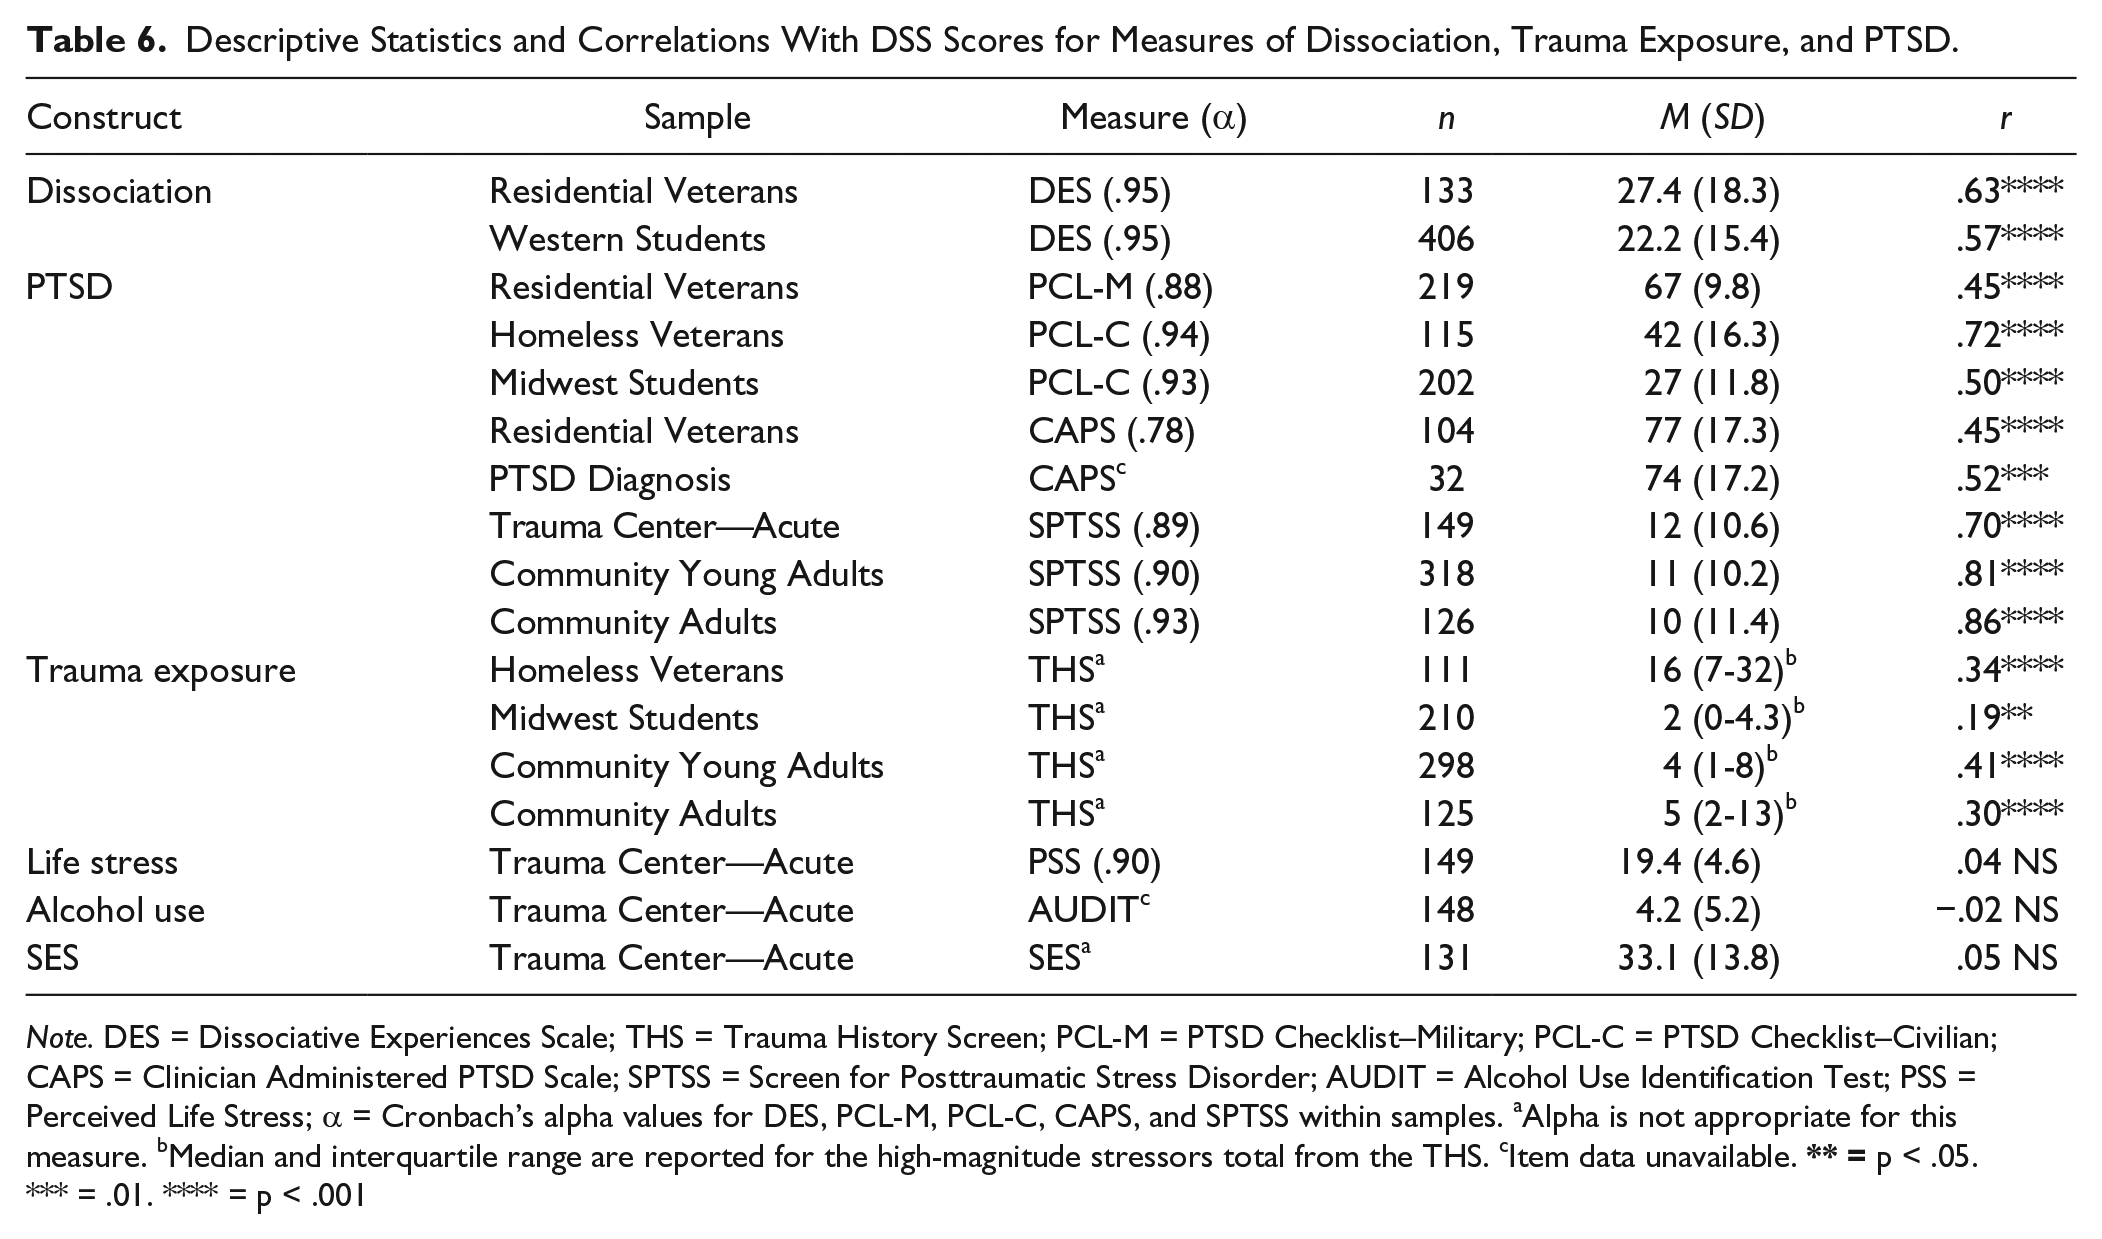
Note. DES = Dissociative Experiences Scale; THS = Trauma History Screen; PCL-M = PTSD Checklist–Military; PCL-C = PTSD Checklist–Civilian; CAPS = Clinician Administered PTSD Scale; SPTSS = Screen for Posttraumatic Stress Disorder; AUDIT = Alcohol Use Identification Test; PSS = Perceived Life Stress; α = Cronbach’s alpha values for DES, PCL-M, PCL-C, CAPS, and SPTSS within samples. aAlpha is not appropriate for this measure. bMedian and interquartile range are reported for the high-magnitude stressors total from the THS. cItem data unavailable.
To examine evidence for divergent validity, we correlated DSS scores with scores on unrelated constructs in participants from the Trauma Center—Acute sample. Table 6 shows very low, nonsignificant correlations between DSS scores for life stress, alcohol use, and socioeconomic status.
Additional Analyses of Construct Validity
We examined evidence of elevation in DSS scores in relation to trauma exposure, time since trauma exposure, and elevated PTSD symptoms. Total DSS scores for the 243 Community Young Adults reporting exposure to one or more HMS events (M = 8.21, SD = 10.45) were significantly higher than for the 55 participants reporting no prior exposure to potentially traumatic HMS events (M = 4.38, SD = 5.42), with F(1, 296) = 6.96, p < .01, ω2 = .012. When age was added as a covariate, differences in DSS scores between exposure groups remained significant and did not appear to be better accounted for by participants’ age, with F(1, 295) = 7.13, p < .01, ω2 = .012. A similar comparison was not possible in the older, Community Adult sample due to low power, as only 19 participants reported no prior exposure. A repeated-measures analysis of variance on DSS scores collected soon after (2-14 days) and 2 months after a traumatic event in 116 Trauma Center—Acute subjects revealed that the scores were significantly higher soon after the event (M = 10.45, SD = 10.27) than 2 months after (M = 7.77, SD = 10.16), with F(1, 115) = 8.11, p < .01, d = 0.26. DSS scores of Trauma Center—Acute participants collected 2 months after trauma exposure were significantly higher in those who had elevated PTSD levels than in those who did not, with t(1, 127) = 7.38, p < .001, d = 1.75. Scores on all DSS subscales were also significantly higher for the PTSD group (data not shown).
Discussion
Analyses of data from four clinical and five nonclinical samples provided considerable evidence for the reliability and validity of DSS scores in the populations studied. Structural analyses yielded factors that are consistent with the intended domains and showed good fit in a CFA on a separate set of data. Moderately high intercorrelations of subscales indicate that the factors measure strongly related but not identical constructs. The means for DSS scores across samples were consistent with expectations, with all clinical samples scoring higher than nonclinical samples and clinical samples with subjects who all met the diagnostic criteria for PTSD (Residential Veterans, PTSD Diagnosis, and Trauma Center—PTSD) scoring higher than the clinical sample that was not assessed for PTSD (Homeless Veterans).
The four factors of (1) Depersonalization and Derealization, (2) Gaps in Awareness and Memory, (3) Sensory Misperceptions, and (4) Cognitive and Behavioral Reexperiencing map well onto the domains of (1) depersonalization and derealization; (2) gaps in awareness, memory, or identity; and (3) intrusions identified by Cardeña and Carlson (2011). It was a novel finding that the sensory misperceptions, which we understand as trauma-related intrusions or reexperiencing, loaded onto a separate factor from cognitive and behavioral reexperiencing items, and further research is needed to replicate this finding and investigate its clinical relevance. A multifactorial structure with correlated factors is consistent with research on the MDI, which assesses domains that overlap with the DSS. In a sample of both clinical and general population subjects, five dimensions of dissociation were found to be moderately related (r– = .39) but phenomenologically distinct (Briere, Weathers, & Runtz, 2005). In domains assessed by both the DSS and the MDI, two factors appear to be extremely similar. MDI structural analyses also produced a Depersonalization/Derealization factor, and a Disengagement factor found in the MDI is similar to the DSS Gaps in Awareness and Memory factor. While the added value of assessing subdomains of dissociation with the DSS is not yet completely clear, past research has shown such subscales to be clinically useful. For example, scores on DES depersonalization items correlated very strongly with scores on the Cambridge Depersonalization Scale in a sample of patients with depersonalization disorder, when other DES subscale scores did not (Sierra & Berrios, 2000).
The IRT analysis of DSS and mild and severe DES items provided support for the hypothesis that DSS items assess moderately severe dissociative experiences. DSS and DES item data from the samples of Western students and veterans in residential treatment for PTSD were analyzed to examine the capacities of items to provide information about the level of the latent dissociation factor underlying all DSS and DES items. Item location estimates, average peak information, and average latent factor severity range values for mild DES, DSS, and severe DES items indicated that DSS items provided high levels of information in the range of the latent factor of dissociation that falls between the levels assessed by mild and severe DES items. Results also showed that DSS items were able to accurately assess both average and higher than average severities of the latent dissociation factor. Overall, these IRT findings suggest that DSS scores may be a valid measure of levels of dissociation severity that are relevant to many clinical populations.
Indices of internal consistency for the total DSS score were quite high in all of the samples studied, and DSS subscale scores generally showed good internal consistency. Internal consistency was somewhat lower for the Sensory Misperceptions subscale scores in one clinical sample and one nonclinical sample that endorsed Sensory Misperception items at a very low rate. Given that assessing sensory misperceptions may be clinically useful to distinguish them from psychotic symptoms (Anketell et al., 2010; Brewin & Patel, 2010; Lindley, Carlson, & Hill, 2014; Pilton, Varese, Berry, & Bucci, 2015), further research is needed to clarify whether internal consistency is sufficient in clinical samples, particularly in those seeking treatment.
Temporal stability for total DSS scores was relatively low in the Trauma Center—Acute and Midwestern Student samples studied compared with the stability levels of other symptom measures. These findings may reflect the instability of dissociation in the particular samples studied. Soon after exposure to traumatic stress (in the Trauma Center—Acute sample), dissociation spiked and seemed to be rapidly declining for most (Carlson, Field, et al., 2016). In young adults (Midwestern Students), fluctuation in dissociation may be the result of struggles with the developmental task of identity formation, which results in higher depersonalization (Simeon & Abugel, 2006) and possibly other types of dissociation. Future studies should examine the stability of DSS scores in samples of clinical subjects with chronic conditions (as opposed to those soon after trauma) and in samples of middle-aged and older adults to determine if they are more stable.
Demographic analyses were generally consistent with expectations. Observed elevations in dissociation in younger subjects were consistent with theory (Putnam, 1997) and with research on other dissociation measures (Armstrong, Putnam, Carlson, Libero, & Smith, 1997; Putnam et al., 1996). These findings should be kept in mind in analyses of samples with a particular disorder when most subjects are young adults. Consistent with prior research on dissociation (van IJzendoorn & Scheungel, 1996), no differences were observed in total DSS scores across gender in clinical or nonclinical subjects. Some small but significant differences were observed for two subscales in nonclinical and one subscale in clinical samples, and further exploration may be worthwhile if the same gender differences are replicated in future studies. While we did not collect sufficient data on race, ethnicity, and English as a second language to conduct detailed analyses of these variables, such studies are needed to ascertain whether the DSS assesses culturally relevant manifestations of dissociation and demonstrates adequate measurement of invariance across ethnoracial groups.
Analyses conducted to investigate the possible impact of changing response options indicated that the changes would have had little impact on overall scores as only a small proportion of item scores seem likely to have been affected by the change. Additional evidence that the change in response formats had little impact on DSS responses was provided by structural analyses of data collected using the two formats, which indicated structural invariance across versions.
Scores on the DSS were strongly related to scores on another dissociation measure in one clinical and one nonclinical sample, indicating good convergent validity. This is consistent with findings from a study of “real-time” experiences in the Trauma Center—Acute sample, in which responses to 10 DSS items administered four times daily over a period of 1 week were strongly and significantly related to scores on the same DSS items given at the end of the week (Carlson, Field, et al., 2016). Future research with other dissociation measures such as the MDI or MID would be valuable to further support the convergent validity of scores on the DSS. Overall, DSS total and scale scores showed low to moderate relationships with trauma exposure and moderately high to strong relationships to scores on measures of PTSD. As would be expected, correlations were lower in samples that included fewer subjects and had greater homogeneity in both variables. These findings are in keeping with the results of other studies of the relationships between dissociation, trauma exposure, and PTSD (Carlson et al., 2012).
Divergent validity was indicated by very low, nonsignificant correlations between DSS and measures of the theoretically unrelated constructs of life stress, alcohol use, and socioeconomic status. In addition, in the Residential Veterans sample, DSS scores correlated more strongly with scores on another measure of dissociation (r = .63) than with scores on a measure of the closely related construct of PTSD (r = .46). In previously reported research on 44 of the Trauma Center—Acute participants, DSS scores were not significantly related to the theoretically unrelated constructs of negative posttraumatic cognitions and emotional approach coping measured in “real time” (Carlson, Field, et al., 2016).
Findings from additional analyses support the construct validity of DSS scores as well. As predicted by theory, DSS scores were significantly higher in adults from a community sample who had prior exposure to potentially traumatic stressors than in those with no such exposure, and scores for trauma-exposed subjects were about twice as high as scores for those not exposed. DSS scores were also found to be elevated in the days immediately following exposure to traumatic stress in a systematically recruited sample of adults. Last, in the same sample, total DSS scores and scores on all four DSS subscales were found to be higher 2 months posttrauma in those who met the criteria for PTSD following traumatic stress than in those who did not. This is consistent with previous findings indicating that dissociation symptoms are typically strongly associated with PTSD symptoms (Carlson et al., 2012).
Strengths and Limitations
The strengths of this research include the large number of samples and subjects studied and the wide variety of analyses conducted to investigate the psychometric properties of DSS scores. One limitation of the research is that the items were based on previous theoretical and empirical work about domains of clinically important dissociation (reviewed above) but not reviewed by outside experts at the outset, which may have resulted in the exclusion of relevant content from the scale. Future research on views of outside experts and on other aspects of content validity would be helpful (Haynes, Richard, & Kubany, 1995). In addition, some samples were convenience samples rather than epidemiological samples or systematic samples from a clinical population. Studies of the psychometrics of DSS scores in treatment-seeking subjects would be valuable. Another limitation is that no data were collected in diagnostic groups other than PTSD. This omission may have affected the findings on the structure of the DSS and the generalizability of the findings. Although the DSS is not designed to assess dissociation in those with dissociative disorders, it would nevertheless be valuable to collect data on DSS scores in samples of patients with dissociative disorders in order to investigate the psychometrics of scale scores in such patients and the possible differences in symptoms between those with dissociative disorders and those with other disorders that involve dissociation, such as complex PTSD (Cloitre et al., 2011) or borderline personality disorder (Zanarini & Jager-Hyman, 2009).
Conclusion
The current study provides considerable support for the construct validity of total DSS scores in the samples studied, based on structural analyses, descriptive statistics in four clinical samples and five nonclinical samples, IRT analyses, analyses showing elevations associated with traumatic stress, and analyses of concurrent, convergent, and divergent validity. Subscale scores of the DSS that reflected gaps in awareness or memory, distortions in perceptions of self and one’s surroundings, sensory misperceptions, and cognitive-behavioral reexperiencing also showed evidence of reliability and validity, including convergent and divergent validity of subscale item scores, in the samples studied. If additional research replicates these findings in other clinical samples, the DSS may contribute to a better understanding of dissociative symptoms in trauma survivors, those with disordered developmental experiences, and those with a variety of diagnostic conditions. In clinical settings, it may be useful to identify those with elevated levels of dissociation and to monitor treatment progress. DSS scores and subscale scores may also be helpful in identifying individuals who fit the dissociative subtype for PTSD. A brief version of the DSS may enable collection of data on dissociation in large clinical and epidemiological studies, which could provide more information about the distribution of these symptoms in clinical and nonclinical populations. Ultimately, a very brief measure of dissociation may be a useful tool in research and clinical work aimed at understanding and treating different types of dissociation in different populations.
Footnotes
Acknowledgements
This article is not subject to US copyright law and is in the public domain.
Declaration of Conflicting Interests
The author(s) declared no potential conflicts of interest with respect to the research, authorship, and/or publication of this article.
Funding
The author(s) disclosed receipt of the following financial support for the research, authorship, and/or publication of this article: This work was supported with resources of the Department of Veterans Affairs’ National Center for Posttraumatic Stress Disorder and the VA Palo Alto Health Care System. The contents do not represent the views of the U.S. Department of Veterans Affairs or the United States Government.