
Abstract
The aim of this study was to assess the extent to which discrepancy between self-reported and clinician-rated severity of depression are due to inconsistent self-reports. Response inconsistency threatens the validity of the test score. We used data from a large sample of outpatients (N = 5,959) who completed the self-report Beck Depression Inventory–II (BDI-II) and the clinician-rated Montgomery–Åsberg Depression Rating Scale (MADRS). We used item response theory based person-fit analysis to quantify the inconsistency of the self-report item scores. Inconsistency was weakly positively related to patient–clinician discrepancy (i.e., higher BDI-II scores relative to MADRS scores). The mediating effect of response inconsistency in the relationship between discrepancy and demographic (e.g., ethnic origin) and clinical variables (e.g., cognitive problems) was negligible. The small direct and mediating effects of response inconsistency suggest that inaccurate patient self-reports are not a major cause of patient–clinician discrepancy in outpatient samples. Future research should investigate the role of clinician biases in explaining clinician–patient discrepancy.
Keywords
Many instruments exist to measure the severity of depressive symptoms. The instruments can be distinguished into self-report and clinician-rated measures. Among the frequently used scales are the self-report Beck Depression Inventory–II (BDI-II; Beck, Steer, Ball, & Ranieri, 1996), the clinician-rated Montgomery–Åsberg Depression Rating Scale (MADRS; Montgomery & Åsberg, 1979), and the clinician-rated Hamilton Depression Rating Scale (Hamilton, 1960). Both types of measures are widely used in clinical practice and in research (e.g., DeFife, Drill, Nakash, & Westen, 2010; Möller, 2000). Arguments in favor of self-report measures include time- and cost-efficiency and direct access to the patient’s inner world and past mental state. A key advantage of clinician ratings is the ability to put symptom severity into context relative to that of other patients. The aim of this study was to assess the extent to which discrepancy between self-report and clinician-rated measures relates to the quality of the self-report assessment.
Agreement between self-report and clinician-rated depression severity has been investigated extensively, and reviews reported Pearson correlation coefficients ranging from .1 to .9 (Dunlop et al., 2010; Möller, 1991). Discrepancy seems to be largest at baseline assessment prior to treatment and decrease over time (e.g., Dunlop et al., 2010, Dunlop et al., 2011; Lin, Lu, Wong, & Cheng, 2014). Part of the discrepancies may be due to differences between the content of the self-report and clinician-rated depression measures (e.g., Tsujii et al., 2014). However, some studies that compared measures with matched content revealed only moderate correlations between self-report and clinician ratings (e.g., Carroll, Feinberg, Smouse, Rawson, & Greden, 1981) and differences between matched measures were meaningful in predicting future events. For example, patients with higher self-report scores than clinician-rated scores had lower remission rates than patients for whom self-report and clinician ratings were comparable (Tada et al., 2014).
Much research has investigated whether demographic, clinical, and personality variables explain discrepancy between self-report and clinician-rated depression severity. Consistent with the majority of this research, we use the term overreporting to denote self-report scores that are higher than corresponding clinician ratings and underreporting when self-report scores are lower. Several studies have suggested that older adults (Dorz, Borgherini, Conforti, Scarso, & Magni, 2004; Enns, Larsen, & Cox, 2000; Lyness et al., 1995; Rush et al., 2006) and males (Carter, Frampton, Mulder, Luty, & Joyce, 2010; Shain, Naylor, & Alessi, 1990) are more likely to underreport symptoms than younger adults and females, respectively. Gender role theory may explain men’s underreporting (Carter et al., 2010; Oliver & Toner, 1990) and cohort or maturation effects may explain age effects (Enns et al., 2000). Despite these plausible explanations, a substantial number of studies found no age or gender effect (e.g., Dorz et al., 2004; Duberstein & Heisel, 2007; Kim et al., 2013; Tsujii et al., 2014). Other studies found that education level did not affect overreporting or underreporting (e.g., Duberstein & Heisel, 2007; Kim et al., 2013; Tsujii et al., 2014), and that White and African Americans were more likely to overreport symptoms than Hispanic patients (Rush et al., 2006).
Previous studies have also found that symptoms of psychopathology and personality traits relate to discrepancy. Patients high on neuroticism and hostility (Duberstein & Heisel, 2007; Enns et al., 2000) and rumination (Carter et al., 2010) tended to overreport and patients low on these traits tended to underreport. Openness (Duberstein & Heisel, 2007) and self-esteem (Domken, Scott, & Kelly, 1994) have been found to have similar linear but negative effects on overreporting. Findings on the effects of melancholic depression (Carter et al., 2000; Enns et al., 2000) and psychoticism (Corruble, Legrand, Zvenigorowski, Duret, & Guelfi, 1999; Rush et al., 2006) are inconsistent. Other studies have tested effects on either overreporting or underreporting of symptoms, not assuming a linear relationship between discrepancy and explanatory variables. These studies have found relative overreporting of symptoms for patients higher on hopelessness and suicide attempts (Tsujii et al., 2014), higher anxiety and phobic anxiety (Corruble et al., 1999; Kim et al., 2013), and higher impulsivity but lower conscientiousness (Kim et al., 2013). None of these variables showed inverse effects on underreporting of symptoms.
Despite the large body of research investigating which demographic, personality, and clinical variables relate to discrepancy, the processes or biases that may underlie discrepancy are still unknown. Various rater biases may compromise the quality of clinician ratings (Hasemann, 1971; Möller, 2000, 2009), such as reliance on a general or initial impression of the patient or preconceptions of symptom combinations. Moreover, the quality of clinician ratings depends on the patients’ motivation and capability to communicate (Meyer et al., 2001) and on the clinician’s experience with the scale (Paykel & Norton, 1986). However, there is also a range of potential problems with self-report measures. The problems are lack of insight into illness (Tada et al., 2014), different types of response bias (e.g., social desirability response bias, extreme response style; Logan, Claar, & Scharff, 2008; Möller, 2009), cognitive bias toward negative ideations (Tada et al., 2014), defensive or self-presentational biases (DeFife et al., 2010), and low cognitive skills or poor concentration (Cuijpers, Li, Hofmann, & Andersson, 2010; Hamilton, 1976).
Some indirect evidence supports the hypothesis that discrepancy, especially overreporting by patients, may be due to patient biases and low cognitive skills. For example, negative relationships were found between overreporting and intelligence (Kim et al., 2013) and between overreporting and verbal fluency task performance (Tsujii et al., 2014). Factor analysis results suggest that variation in self-report depressive scores mainly reflect a global tendency to complain, rather than an accurate representation of specific depressive symptoms (Möller, 2009).
Patients’ careless responding or concentration problems may also explain discrepancy; this is supported by research indicating a positive relationship between impulsivity and overreporting and a negative relationship between conscientiousness and overreporting (Kim et al., 2013). For example, in the self-report BDI-II, symptoms are rated on a 0 to 3 scale and the instructions are that normal variation of a symptom should be scored “0.” A 1-score on the item “sadness” indicates feeling sad most of the time. Respondents who feel sad regularly but not most of the time may be tempted to score higher than 0, particularly if they are impulsive, unconscientious, or lack concentration.
Patients suffering from such unintended psychological or test-taking factors may produce inaccurate item-score patterns that are inconsistent with any estimated depression trait value. For example, an inconsistent pattern may include endorsement of the extreme item “I feel utterly hopeless” but no endorsement of the milder item “I feel down.” The presence of many of such inconsistencies within an item-score pattern suggests misinterpretation of item content, response bias, carelessness, random responding, a different cause, or a combination of causes (e.g., Wardell, Rogers, Simms, Jackson, & Read, 2014). Irrespective of the cause, the total score resulting from inconsistent item scores is not a valid indicator of the measured latent trait (Meijer, Niessen, & Tendeiro, 2016). Response inconsistency as a measure of the quality of the self-report is thus a plausible predictor of discrepancy between self-reports and clinician ratings.
To summarize, previous research indicates that several demographic, clinical, and psychological variables relate to patient–clinician discrepancy but results are inconsistent, particularly with respect to demographic variables. Moreover, the underlying causes of discrepancy are unknown. Various authors (e.g., Cuijpers et al., 2010; Tada et al., 2014) have suggested that poor quality of the patient’s self-report explains discrepancy but the authors did not investigate this suggestion. Also, research into explanatory variables for patient–clinician discrepancy (e.g., Corruble et al., 1999; Dorz et al., 2004; Duberstein & Heisel, 2007; Kim et al., 2013; Tsujii et al., 2014) suffers from limitations. First, previous research used small sample sizes, at most N = 544 (Rush et al., 2006), so that power may have been low. Second, most studies did not control for the self-reported severity of depression, and lack of control may have confounded research results because symptom severity relates to both discrepancy and to demographic, personality, and clinical explanatory variables. Finally, most studies did not use measures with matched item content so that identified explanatory variables may have reflected differences between measured symptom patterns rather than symptom overreporting or underreporting.
Study Aim
Using BDI-II self-reports and MADRS clinician ratings from a large sample of psychiatric outpatients (N = 5,959), we investigated explanations for patient–clinician discrepancy with respect to depression severity. While accounting for several limitations of previous studies, we addressed the following research questions:
Research Question 1 involves a replication of previous research. Based on previous research (e.g., Carter et al., 2010; Corruble et al., 1999; Enns et al., 2000; Kim et al., 2013; Lyness et al., 1995; Rush et al., 2006), the following explanatory variables were considered: age, gender, ethnicity, education level, hostility, anxiety, and phobic fear. Based on theoretical expectations (e.g., Hamilton, 1976), the following explanatory variables were also considered: cognitive problems, because they include concentration difficulties; psychoticism, because it may result in patients’ distrust or difficulty revealing their symptoms; and paranoid ideation, because it may lead to biased awareness of one’s own symptoms.
Research Questions 2 and 3 address the relationship of patient–clinician discrepancy with the quality of self-reports. We expected that discrepancy, which can be either underreporting or overreporting, increases with increasing levels of response inconsistencies. Also, we expected response inconsistency to mediate effects of demographic and clinical variables on underreporting and overreporting. For example, patients with a low education level may be more prone to inaccurate responding (e.g., due to misunderstanding of items/instructions) than other patients, causing increased patient–clinician discrepancy for patients with a lower education.
To quantify response inconsistency, we employed item response theory (IRT) based person-fit analysis (Meijer & Sijtsma, 2001). Person-fit analysis offers a well-established method for assessing the validity of individual test scores in the context of psychopathology measurement (Conijn, Emons, De Jong, & Sijtsma, 2015; Wanders, Wardenaar, Penninx, Meijer, & De Jonge, 2015; Wardenaar, Wanders, Roest, Meijer, & De Jonge, 2015).
Method
Participants
Participants were 6,006 adults (37.5% male; age range 17 to 65 years, M = 38.6, SD = 12.3) referred to treatment of a mood, anxiety, and/or somatoform disorder at either the regional mental health provider Rivierduinen or the psychiatric outpatient department of Leiden University Medical Centre. These facilities have implemented routine outcome monitoring (ROM; Van Noorden et al., 2012). The data were collected at intake between 2004 and 2010. After a regular intake procedure carried out by a clinician, in the baseline ROM assessment, a psychiatric nurse blind to any patient self-ratings and not involved in the treatment, administered a standardized diagnostic interview (Mini-International Neuropsychiatric Interview–Plus; MINI-Plus; Sheehan et al., 1998) and the MADRS. Next, patients completed self-report instruments on touch screen computers. ROM data are (in part) based on ratings by the ROM staff. A specialized staff of 20 trained ROM assistants (psychiatric research nurses and psychologists) participated in the study. These ROM assistants have been extensively trained in the administration of the MINI-Plus interview and the rating scales including the MADRS. During the training, which was provided by ROM assistants with more than 4 years of experience, videotaped interviews with patients were rated, and the ratings were afterward compared and discussed to reach consensus. Reliability of these ratings ranged from .60 to .74 (Cohen’s κ). This denotes moderate to substantial agreement between raters (see De Beurs et al., 2011; McHugh, 2012).
Before 2007, nationality and education level were not recorded, so that nationality was missing for 636 participants (10.7%) and education level was missing for 584 participants (9.8%). For the remaining participants, 28.9% had a non-Dutch ethnic origin, including second- and third-generation immigrants. Education level was 9.3% elementary education or lower, 33.8% low-level high school, 37.3% high-level high school, and 19.6% university or college education. Most prevalent diagnoses (which could be comorbid) included depression (61.7%), anxiety disorders (41.7%), somatoform disorders (13.3%), psychotic disorders (1.8%), eating disorders (1.3%), and substance abuse (0.6%).
Clinical Measures
MADRS
The MADRS (Montgomery & Åsberg, 1979) is a 10-item clinician-rated scale for depressive symptoms. Example items are “apparent sadness” and “inner tension” (Table 1). Clinicians interviewed patients and rated each symptom on a scale from 0 to 6, for example, (0) no sadness to (6) looks miserable all the time. Extremely despondent. Interrater reliability of the MADRS between a general practitioner and a psychiatrist equaled .97 (Montgomery & Åsberg, 1979). In our sample, coefficient alpha equaled .83.
Matched Item Content for MADRS (10 Items) and BDI-II (21 Items) and BDI-II Item Weights.
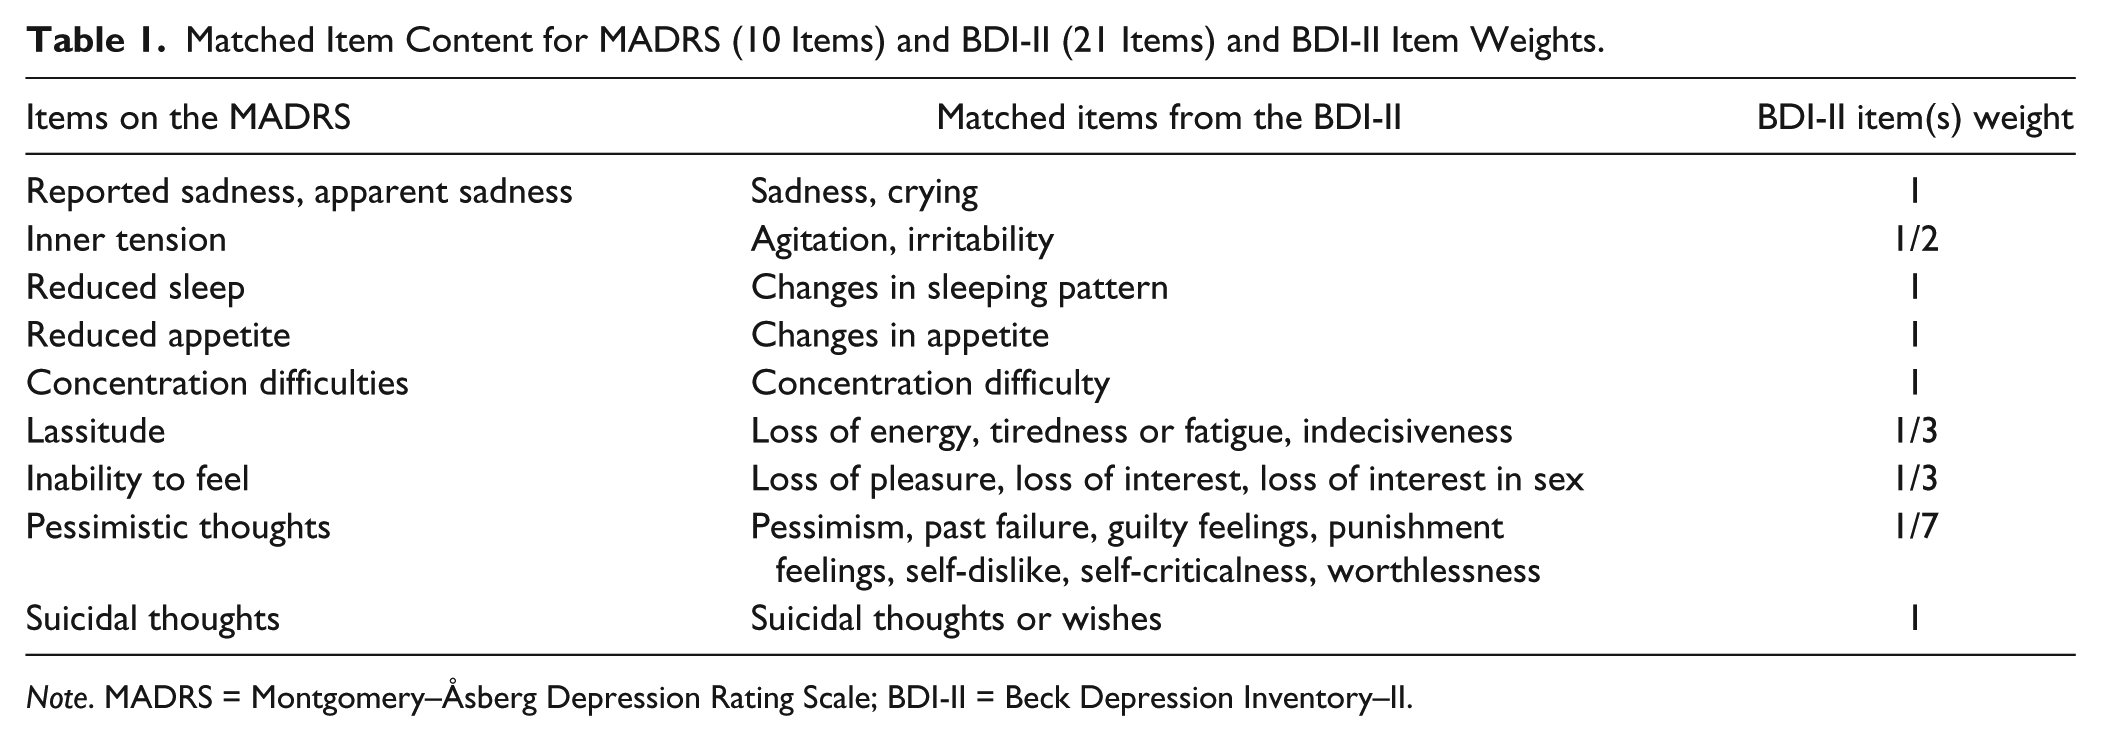
Note. MADRS = Montgomery–Åsberg Depression Rating Scale; BDI-II = Beck Depression Inventory–II.
BDI-II
The BDI-II (Beck et al., 1996) is a 21-item self-rated questionnaire for depression containing two subscales: affective (8 items) and somatic (13 items). Example items are “pessimism” (affective subscale) and “changes in sleep pattern” (somatic subscale; Table 1). Participants rated how they felt during the past 2 weeks on a scale from 0 to 3, for example, (0) I do not feel sad to (3) I am so sad or unhappy that I can’t stand it. For the Dutch BDI-II, the total-score coefficient alpha and test–retest reliability equaled .92 and .82, respectively (Van der Does, 2002). In our sample, coefficient alpha equaled .91.
To increase conceptual comparability between the clinician ratings and self-reports, total scores on the BDI-II were recalculated based on matched item content with the MADRS (see Table 1). Specifically, in computing the BDI-II total score, BDI-II items were reciprocally weighted by the number of BDI-II items that matched a particular MADRS item. For example, one BDI-II item (“suicidal thoughts or wishes”) matched the MADRS item “suicidal thoughts”; hence, this BDI-II item received a weight equal to 1. Three BDI-II items (“loss of pleasure”, “loss of interest”, “loss of interest in sex”) matched the MADRS item “inability to feel”; hence, each of these three BDI-II items received weight 1/3.
Brief Symptom Inventory (BSI)
The BSI (De Beurs, 2004; Derogatis & Melisaratos, 1983) is a 53-item self-rated questionnaire designed to assess general psychological distress. The BSI is a shortened version of the SCL-90-R (Derogatis, 1977) and 49 of the 53 items are divided into nine subscales containing 4 to 7 items: somatization, cognitive problems, interpersonal sensitivity, depression, anxiety, hostility, phobic fear, paranoid ideation, and psychoticism. Patients rated the extent to which each item (e.g., “feeling worthless”) bothered them in the past week on a 5-point Likert-type scale ranging from (0) not at all to (4) extremely. In our sample, coefficient alpha for the psychoticism subscale was .70, and for each of the other eight subscales alpha exceeded .80.
Measure of Response Inconsistency
We used the lz person-fit statistic for polytomous items (Drasgow, Levine, & Williams, 1985) to quantify response inconsistency of the self-report symptom scores with respect to the graded response IRT model (GRM; Samejima, 1997). Statistic lz is a continuous measure of response inconsistency, and may be combined with cutoff values to classify item-score patterns as inconsistent or overly consistent. The GRM is a unidimensional IRT model for ordered categorical data, and assumes unidimensionality of the latent trait, local independence, and increasing logistic item-step response functions. The lz statistic is the standardized likelihood of an item-score pattern given the estimated latent trait level (e.g., depression severity) and GRM item parameters.
The lz statistic quantifies person fit more reliably as more items are used and is unreliable for short scales containing no more than 20 items (Conijn, Emons, & Sijtsma, 2014; Reise & Due, 1991). To obtain reliable measures of response inconsistency, response inconsistency was based on the item scores of both the BDI-II and the BSI (70 items in total). We first computed lz for each of the BDI-II and BSI subscales separately, and then computed the multiscale lzm statistic (Conijn et al., 2014; Drasgow, Levine, & McLaughlin, 1991), which equals the sum of the subscale lz values. Conijn et al. (2014) showed that lzm statistic has high power to detect response inconsistencies when the total number of items is at least 60. Underlying this procedure was the assumption that patients’ response inconsistency is related across the BDI-II and BSI. For example, we assumed that patients lacking concentration on one instrument also lacked concentration on the other instrument. This assumption was supported by positive correlations between the lz statistic based on different subscales (range r = .04 to .26; M = 0.13, SD = 0.5). These correlations may seem trivial, but it should be taken into account that the observed correlations are attenuated by the unreliability of the lz statistic, particularly on the shorter BSI subscales consisting only of four or five items.
Before computing the lzm statistic, we examined whether the subscale data of the BDI-II and the BSI satisfied the GRM model assumptions; see the appendix for results. Consistent with Brouwer, Meijer, and Zevalkink (2013), we found that the BDI-II data were sufficiently unidimensional for IRT analyses. We standardized the lzm statistic using a bootstrap procedure in which we generated a null distribution for each individual respondent (De La Torre & Deng, 2008). The resulting lzm statistic was normally distributed and independent of the latent trait (e.g., depression severity for the BDI-II) under the null model of response consistency to the GRM. For descriptive purposes, we also used the bootstrap procedure to compute the number of patients showing significant response inconsistency based on the lzm statistic, with two-sided α = .05. To facilitate interpretation, we recoded the lzm person-fit statistic such that higher values reflected greater inconsistency.
Statistical Analysis
To address our research questions, we first computed discrepancy scores defined as the standardized weighted BDI-II total score minus the standardized MADRS total score. Positive discrepancy scores indicate overreporting (BDI-II > MADRS) and negative values indicate underreporting (BDI-II < MADRS).
Research Questions 1 and 2
In preliminary analyses, we visually inspected scatterplots and partial scatterplots (controlling for the effects of the remaining explanatory variables) to assess potential nonlinear effects of explanatory variables on the discrepancy scores. Visual inspection of the (partial) scatterplot was considered particularly relevant for assessing potential nonlinear effects of response inconsistency. First, we expected that response inconsistency is positively related to both underreporting and overreporting, because an inaccurate self-report may lead to both positive and negative bias in the test score. Second, several studies showed that in addition to response inconsistency, overconsistency casts doubt on the validity of the test score (Conijn, Sijtsma, & Emons, 2016; Ferrando, 2014; Stukenberg, Brady, & Klinetob, 2000). That is, overconsistent response patterns (i.e., an overly consistent response style) may result from social desirability, malingering or symptom exaggeration, and response inconsistency may therefore have a curvilinear relationship with discrepancy.
In case the graphical analyses showed linear relationships between explanatory variables and discrepancy, a multiple linear regression model was estimated regressing discrepancy on these explanatory variables. A second linear regression model included the BDI-II as a control variable. Using BDI-II as a control variable accounted for confounding effects: Self-reported depression symptom severity may correlate with both discrepancy and the demographic and clinical predictors in the model. The controlled model was used for interpretation, while a comparison between the effects in the controlled and uncontrolled models was used to assess the effect of confounding, as most previous research did not control for self-reported depression severity (e.g., Duberstein & Heisel, 2007; Kim et al., 2013; Tsujii et al., 2014).
SPSS was used for linear regression analyses and continuous explanatory variables were standardized. In regression analyses the variance inflation factor values for the explanatory variables did not exceed 2.7, suggesting absence of multicollinearity problems (Keith, 2006). Considering the large sample size, significance of the regression coefficients was tested at a 1% significance level.
Research Question 3
To test the hypothesis that response inconsistency mediates the effect of the clinical/demographic variables on the discrepancy scores, a mediation analysis was conducted for each clinical and demographic variable that satisfied the following criteria (Kenny, Kashy, & Bolger, 1998): (a) the potential mediator is related to the independent variable and (b) the potential mediator is related to the outcome variable after controlling for the effect of the independent variable. The PROCESS add-on for SPSS (Hayes, 2013) was used for conducting the mediation analysis. This program uses bootstrapped confidence intervals to assess mediation effects. We used α = .01 for testing regression coefficients and mediation was assumed to occur if the 99% confidence intervals for the indirect effect do not contain the value 0.
Results
Descriptive Statistics
Two participants (0.03%) had missing or incomplete MADRS data, and 45 participants (0.75%) had missing or incomplete BSI data, leaving n = 5,959. Data were missing on ethnicity for 636 participants (10.7%) and on education level for 584 participants (9.8%). We kept these cases in the analysis, because they concerned large percentages of the data and the reason for the missing data was known (i.e., ethnicity and education data were not recorded). Hence, we estimated the models without these variables using the full sample, and the models including these variables using the smaller sample of participants.
Spearman’s rho between the BDI-II and MADRS was .72, and it increased to .74 for BDI-II scores weighted to match the MADRS by content. The BDI-II (skewness = 0.06; kurtosis = −0.40) and the MADRS (skewness = 0.03; kurtosis = −0.34) had similar distributions. The similarity implies that standardized scores on these measures reflect comparable levels of depression severity. Discrepancy was normally distributed (skewness = 0.03; kurtosis = 0.19) with a mean of 0.00 and a standard deviation (SD) of 0.71.
Response inconsistency ranged from −1.58 to 3.94 (skewness = 1.13; kurtosis = 2.11), with higher values reflecting higher inconsistency. The number of significantly inconsistent item-score patterns equaled n = 725 (12.1%). The correlation between the MADRS and the weighted BDI-II was lower for patients with inconsistent item-score patterns (rho = .66) than for patients with normal patterns (rho = .75). Response inconsistency was weakly related to the explanatory variables, and correlated highest with the BSI subscale scores: cognitive problems, anxiety, paranoid ideation, and psychoticism (.20 < r < .23).
Research Questions 1 and 2: Explaining Discrepancy
Figure 1 shows the bivariate relationship between response inconsistency and discrepancy. The plot suggests a linear, but weak positive relationship. Controlling for the other explanatory variables revealed a similar relationship. Scatterplots and partial scatterplots between the other explanatory variables and discrepancy also suggest a linear, weak relationship (plots not displayed).
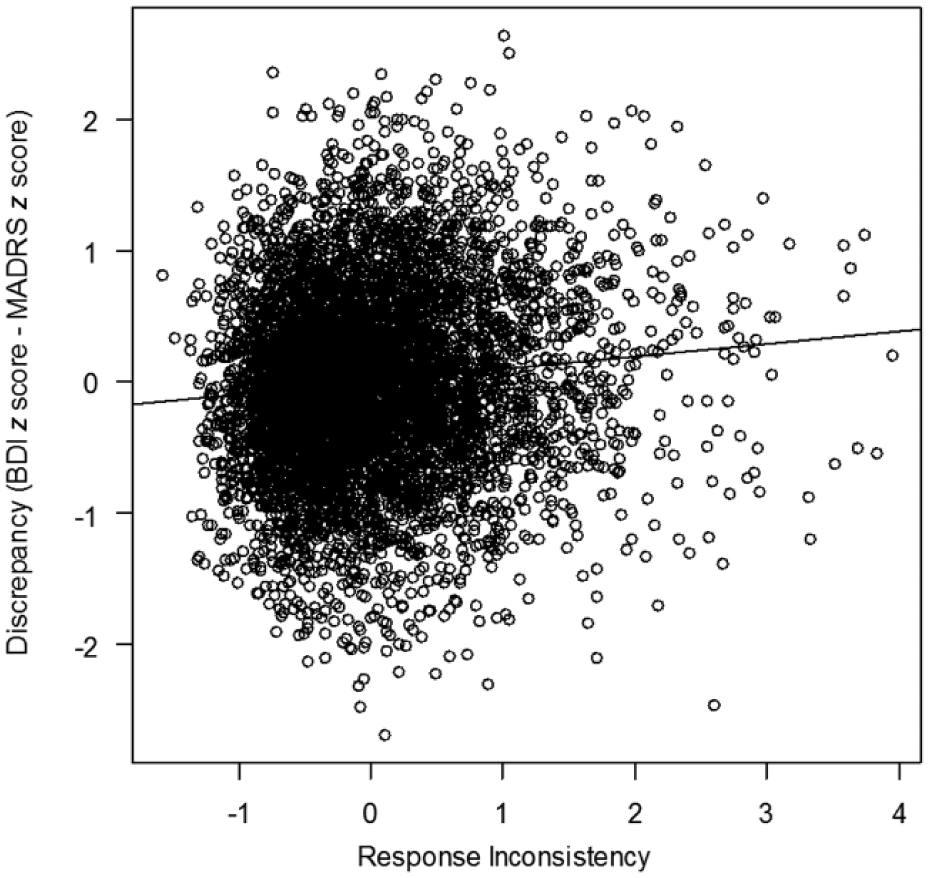
Scatterplot of response inconsistency and discrepancy scores including regression line.
Given linear relationships, we computed Pearson correlations (Table 2). Except for education level, all other correlations were significant (α = .01). Relative to clinicians, males and older adults were less likely to overreport depressive symptoms. Respondents of non-Dutch ethnic origin were more likely to overreport symptoms. Response inconsistency and all clinical variables correlated positively with overreporting of symptoms. Correlations ranged from .10 for response inconsistency to .18 for psychoticism and paranoid ideation.
Results of Linear Regression Model Predicting Discrepancy Scores (BDI-II z-score–MADRS z-score) From Explanatory Variables (EVs).
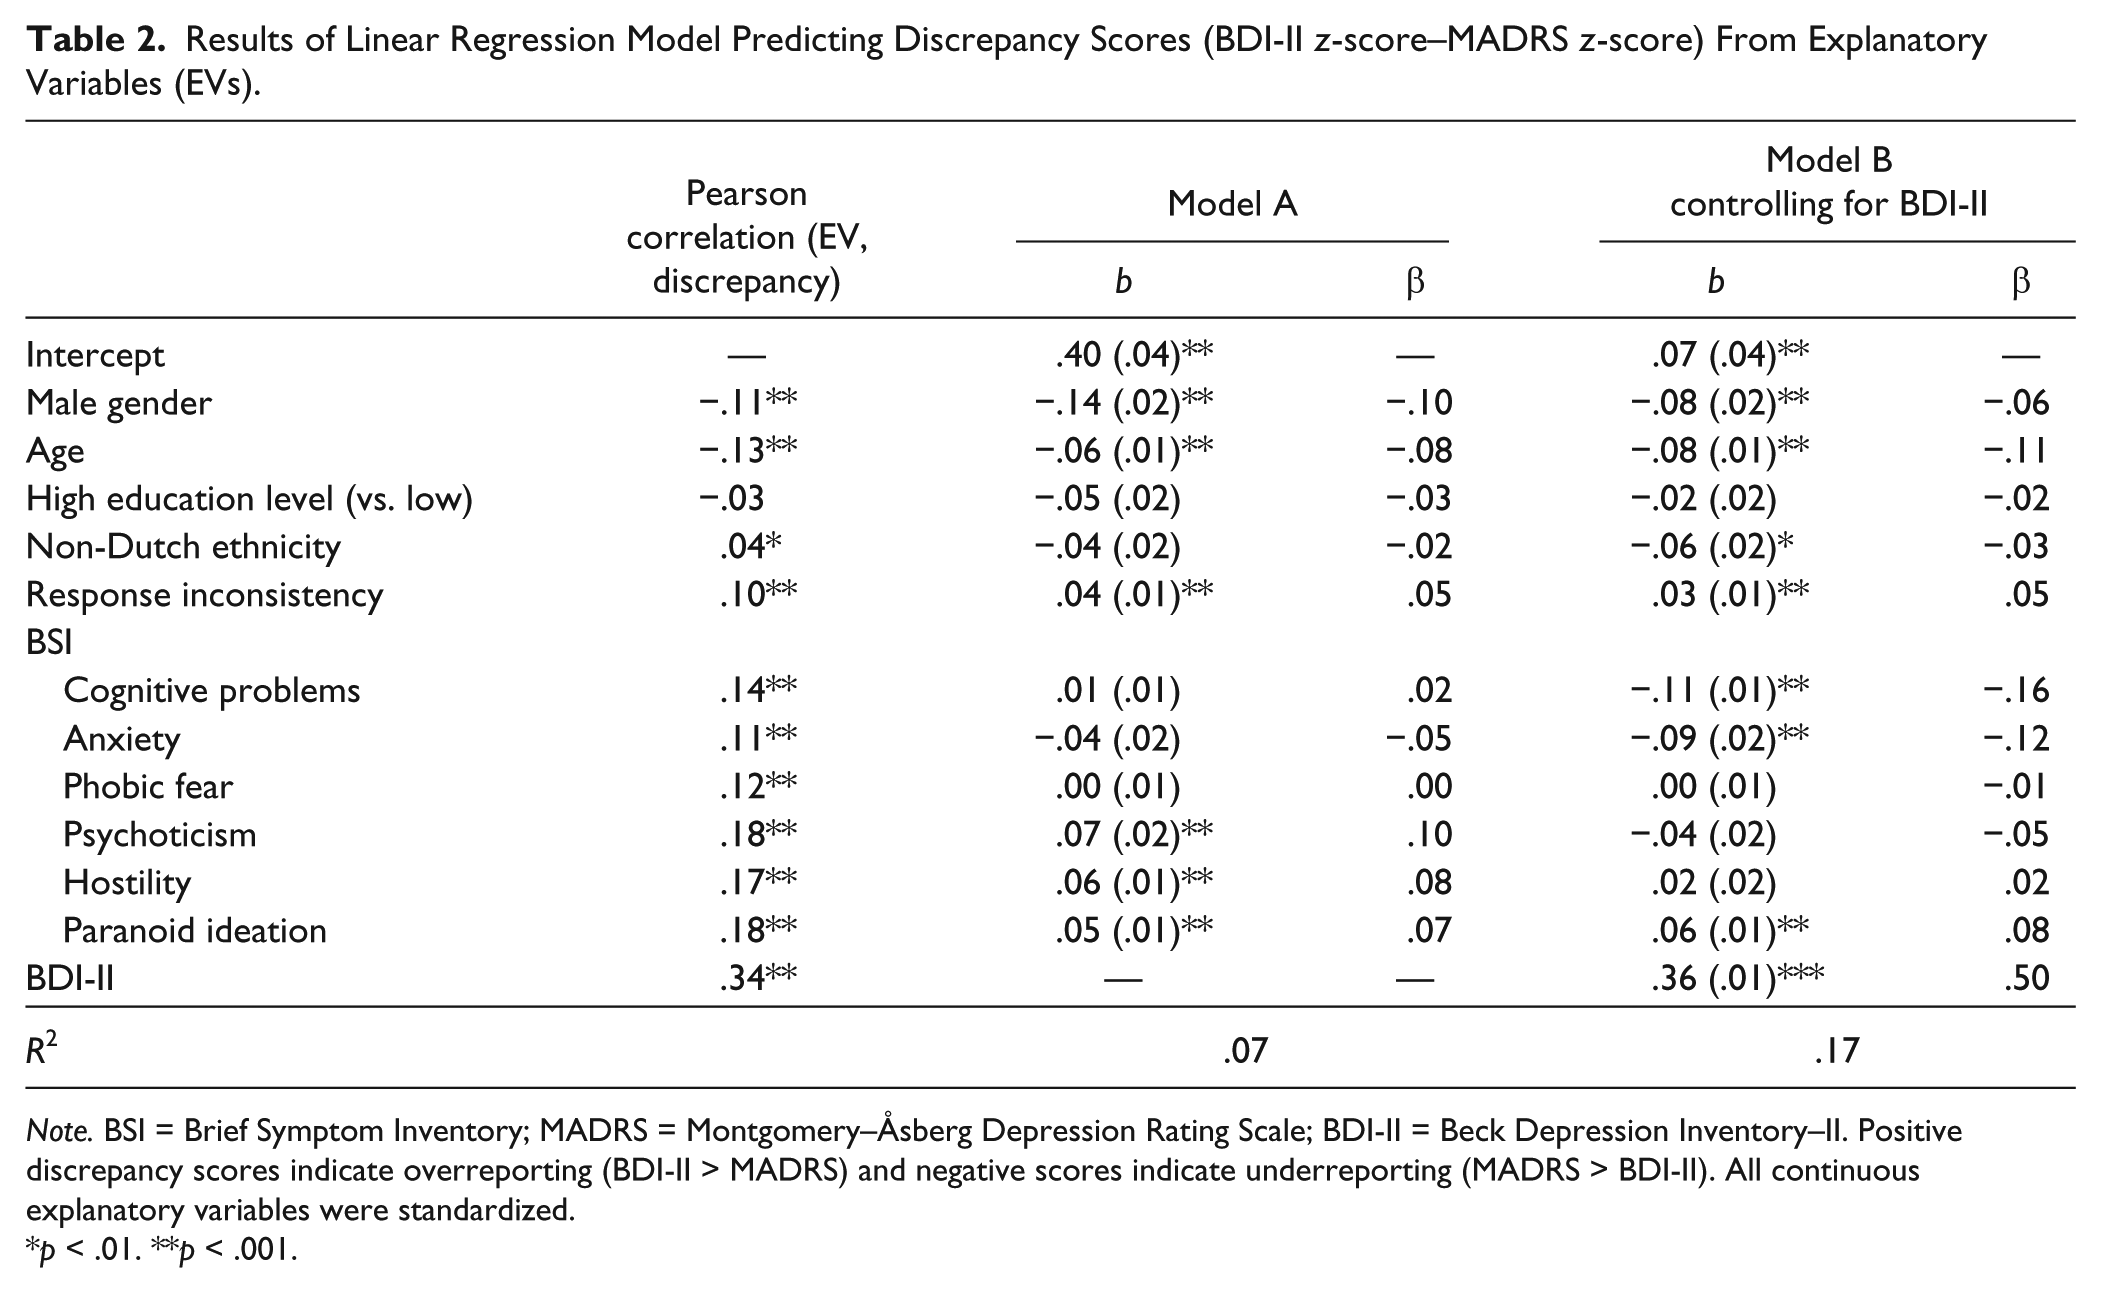
Note. BSI = Brief Symptom Inventory; MADRS = Montgomery–Åsberg Depression Rating Scale; BDI-II = Beck Depression Inventory–II. Positive discrepancy scores indicate overreporting (BDI-II > MADRS) and negative scores indicate underreporting (MADRS > BDI-II). All continuous explanatory variables were standardized.
p < .01. **p < .001.
Next, partial effects of the explanatory variables were estimated using a multiple regression model (Table 2; Model A) including all explanatory variables (R2 = .07). We only discuss effects significant at α = .01. Cognitive problems, anxiety, phobic fear, and ethnicity had no unique effect on overreporting, but all other predictor effects were consistent with the correlations. After controlling for the BDI-II in Model B (R2 = .17), several predictor effects changed. Non-Dutch ethnicity, cognitive problems, and anxiety related negatively to overreporting. Predictor effects were small. For example, for patients with high-response inconsistency (i.e., 2 SDs above the mean inconsistency), the model-predicted discrepancy was .13, but for patients with low-response inconsistency values (i.e., 2 SDs below the mean inconsistency value), the discrepancy was .01. Hostility and psychoticism did not have a significant effect on discrepancy after controlling for the BDI-II.
Research Question 3: Response Inconsistency as a Mediator
In terms of significance (tested at α = .01), response inconsistency met the prerequisites for acting as mediator (Kenny et al., 1998; see Method section) between discrepancy and any of the other explanatory variables: Response inconsistency was related (a) to the independent variable and (b) to discrepancy after controlling for the effect of the independent variable. However, the relationship between response inconsistency and the independent variables gender and age was weak (|r| < .05), and mediation analysis was not considered useful for these independent variables. For the remaining explanatory variables, we estimated a mediation model including the independent variable, response inconsistency as the mediator, and discrepancy as the outcome variable. The BDI-II acted as a control variable in the model. See Figure 2 for an example model. The mediation effect equals the product of regression coefficients a and b.
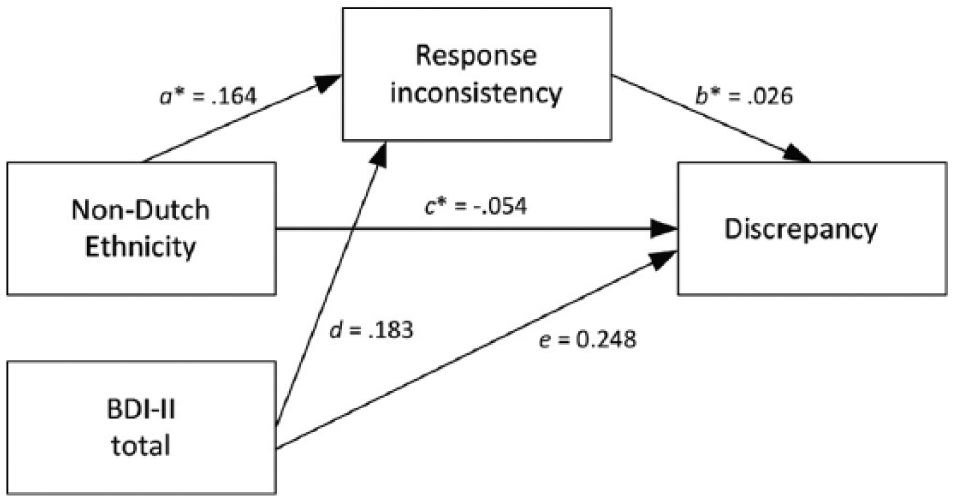
Path diagram displaying the mediation model for the effect of non-Dutch ethnicity on discrepancy (BDI-II z-score –MADRS z-score), including the BDI-II as a control variable.
Table 3 shows the regression coefficients and 99% confidence intervals for the mediating effects (a × b). The mediating effects of response inconsistency were significant for most variables but effect sizes were negligible, ranging −.002 (education level) to .006 (anxiety). Figure 2 shows the estimated model for non-Dutch ethnicity: Non-Dutch patients had higher response inconsistency (a = .164), while higher response inconsistency in turn led to increased discrepancy (b = .026). The estimate of the direct effect of ethnicity on overreporting (c = −.054) was larger than the estimate of the indirect effect of ethnicity (a × b = .004). For several variables, the direct effects (c paths) were nonsignificant but they were stronger than the mediating effects (a × b paths). This inconsistency reflects the relatively high power to detect indirect effects compared with direct effects in mediation models (Kenny & Judd, 2014). Overall, results suggested that the mediating effect of inaccuracy of self-reported item scores on the patient-clinician discrepancy associated with most of the demographic and clinical variables was negligible.
Results of Mediation Analysis Predicting Discrepancy From Independent Variables and Response Inconsistency as a Mediator.
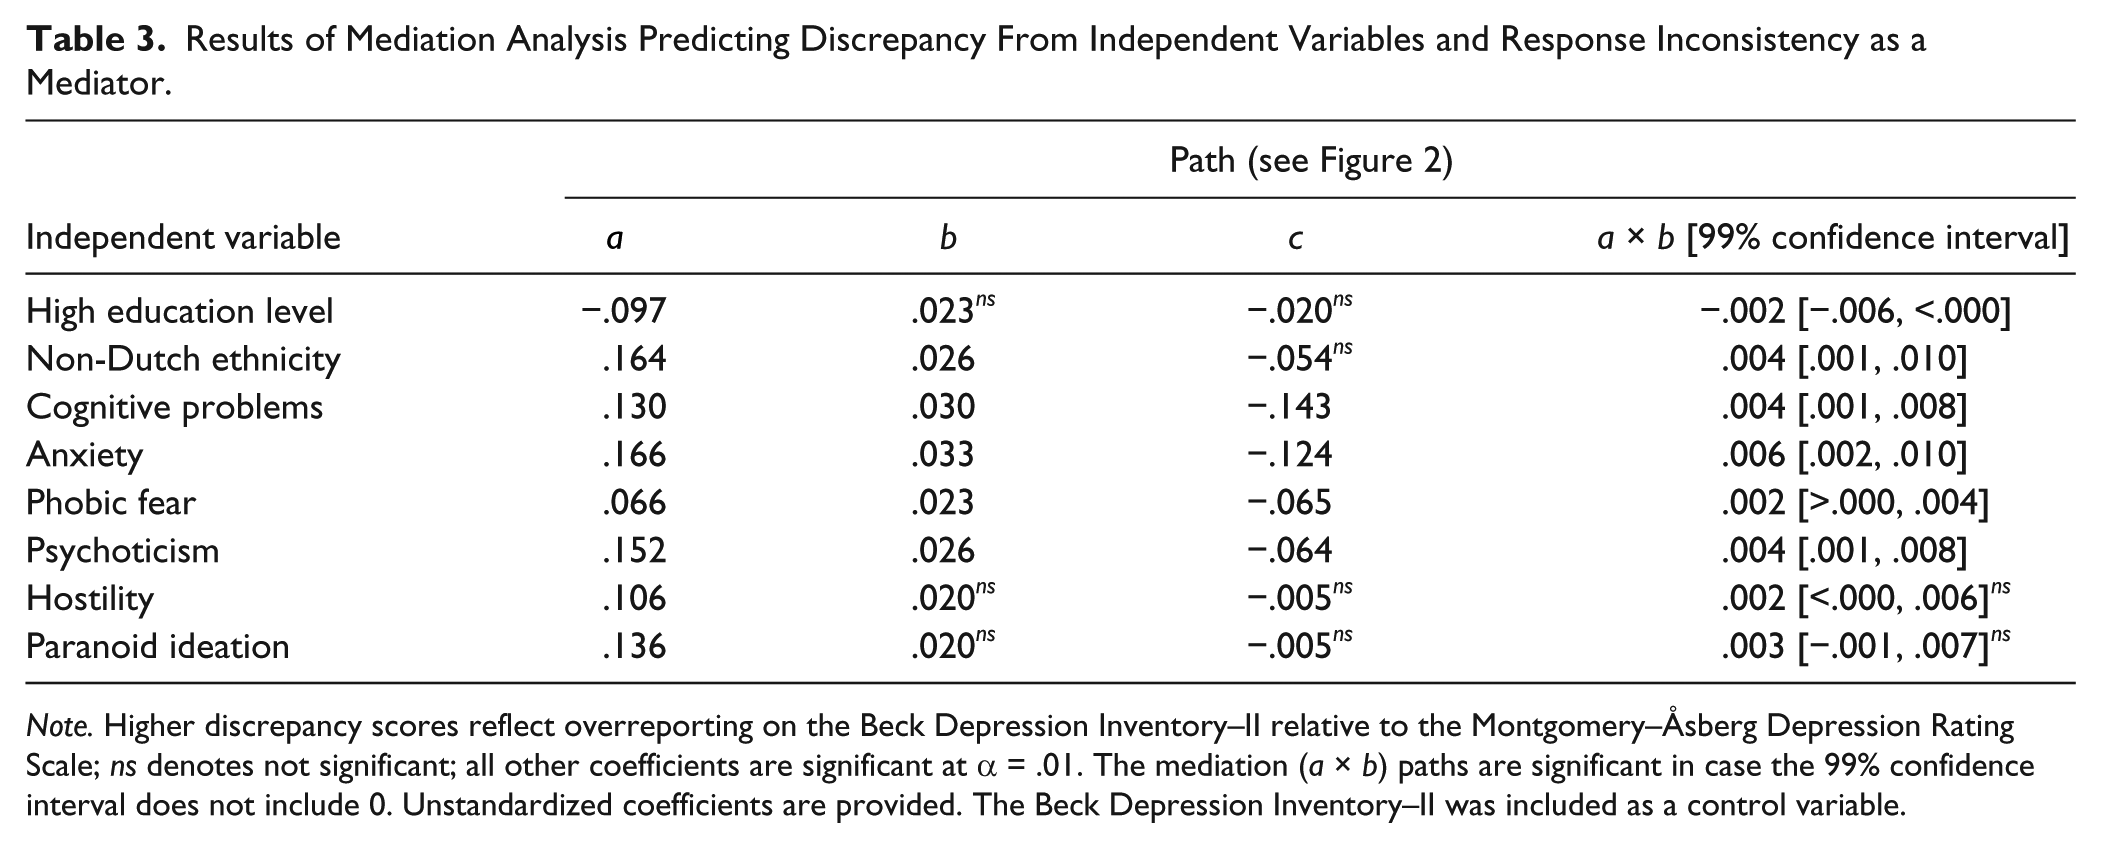
Note. Higher discrepancy scores reflect overreporting on the Beck Depression Inventory–II relative to the Montgomery–Åsberg Depression Rating Scale; ns denotes not significant; all other coefficients are significant at α = .01. The mediation (a × b) paths are significant in case the 99% confidence interval does not include 0. Unstandardized coefficients are provided. The Beck Depression Inventory–II was included as a control variable.
Comparison of Results Based on Matched Versus Unmatched Measures
So far, we used BDI-II scores weighted to match MADRS scores, but a perfect matching was impossible because instruments are different. To assess the sensitivity of the results to the remaining content differences between BDI-II and MADRS, we contrasted the results from analyses using matched BDI-II and MADRS scores versus unmatched scores. Both Model A and Model B (Table 2) were reestimated, using discrepancy scores based on unmatched BDI-II and MADRS scores. Results of the unmatched analyses (not tabulated) and matched analyses showed minor differences. Unmatched Model A explained 2% more variance, suggesting slightly inflated effects due to content differences between the two instruments. Unmatched Model B explained 3% less variance due to a weaker relationship between the instruments. Coefficients were similar for most independent variables, and the only differences with respect to significance at α = .01 were a negative effect of anxiety in Model A (b = −.07), and a positive effect of psychoticism in Model B (b = .07).
Discussion
This study was partly a replication study of demographic and clinical explanatory variables for discrepancy between self-report and clinician-rated depression symptom severity. Findings for age and education were consistent with most previous studies (e.g., Enns et al., 2000; Rush et al., 2006), but our study is one of the few studies demonstrating gender differences consistent with gender role theory (Carter et al., 2010). Cognitive problems, paranoid ideation, and anxiety also related to patient–clinician discrepancy. In contrast to previous research (Corruble et al., 1999; Duberstein & Heisel, 2007; Kim et al., 2013), we did not find a positive effect of hostility or phobic fear on overreporting, and we found a negative effect of anxiety on overreporting instead of the expected positive effect. The anxiety effect is consistent with avoidance-coping mechanisms, common among patients with anxiety problems. Differences between our study and previous studies may be explained by our approach of controlling for self-reported depression symptom severity.
Our main goal was to assess whether patient–clinician discrepancy may be related to inaccurate self-reported symptom severity. The positive linear effect of response inconsistency on discrepancy scores suggests that patients with higher self-reported scores than clinician-rated scores, may show this discrepancy due to a low quality self-report.
This conclusion would be consistent with previous research showing intelligence to be related to overreporting by patients but not underreporting (Kim et al., 2013). A possible explanation for these results is that underreporting of symptoms may proceed consistently across test items, whereas overreporting may proceed in a more impulsive, inconsistent manner producing response inconsistency. In other words, it may be easier to consistently deny symptoms than to consistently “overendorse” symptoms, thereby admitting extreme symptoms of psychopathology.
The small direct and mediating effects of response inconsistency suggest that response behaviors typically producing response inconsistency (e.g., careless responding or misinterpretation of item content) are unlikely to play a large role in patient–clinician discrepancy. This result is reassuring considering that cognitive biases, concentration difficulties and low motivation are common symptoms of depression and known causes of careless and random responding. The modest effect of response inconsistency may also be due to a low prevalence of invalid responding in outpatients, leading to a small effect size in group-level analyses. Possibly, predictive power of response inconsistency is stronger in psychiatric inpatients, because they experience more severe difficulties concentrating and more severe symptomology in general. In any case, an important implication of our results is that patient–clinician discrepancy in outpatients may largely be due to clinician biases, or due to patient biases that cannot be captured with response inconsistency indices (e.g., agreement response bias).
Despite small predictive power of response inconsistency for patient–clinician discrepancies, the group of patients showing the largest discrepancies with inconsistent response patterns ought to be studied in more clinical detail (Meijer et al., 2016). This might help us disentangle the causes underlying the heterogeneous symptomatology observed in patients with major depressive disorder.
Implications for Future Research
This study has several implications for future research into patient–clinician discrepancy. First, controlling for the BDI-II total score in the multiple regression analysis had a large impact on the effects of most of our explanatory variables. This result suggests that explanatory variables (specifically clinical and personality variables) may relate to discrepancy, because they relate to symptom severity as measured by the self-report measure and not to overreporting or underreporting per se. Hence, future research explaining patient–clinician discrepancy should control for self-reported symptom severity. Second, given a large sample resulting in considerable power, the results suggest that differences between outcomes based on matched instrument content and nonmatched instrument content are small. These results suggest that previous results concerning explanatory variables for discrepancy between the MADRS and BDI-II based on smaller sample sizes are generally valid. Third, our results suggest that future research should assess the contribution of clinician biases in discrepancy. For example, explanatory power of clinicians’ response inconsistency and patients’ response inconsistency on patient–clinician discrepancy could be compared. The small number of clinician-rated MADRS items in this study prevented us from reliably assessing the clinician’s response inconsistency (e.g., Emons, 2008; Reise & Due, 1991). Hence, such research requires data of longer rating scales, multiple rating scales, or repeated assessments.
Future research should also overcome the limitations of the current study. In our study, the clinical variables were based on self-reports. The self-report scores were likely also affected by overreporting or underreporting and share method variance with BDI-II and MADRS test scores, thereby inflating their explanatory value (Podsakoff, MacKenzie, Lee, & Podsakoff, 2003). Future research could use objective measures of clinical explanatory variables, such as lab tests of cognitive functioning or the average symptom ratings by multiple informants.
A second limitation is that we cannot completely eliminate differences in item content as a cause of our findings, although we did minimize differences in item content between the BDI-II and MADRS by re-weighting the scores. Future studies that use measures with equal content allow additional analyses to be conducted, for example, to assess the absolute differences between scores, and to assess whether patients’ self-reported item scores are consistent with IRT item parameters estimated in clinician-rated data. These future studies should also assess equality of depression constructs across self-report and clinician ratings (e.g., Bernstein, Rush, Carmody, Woo, & Trivedi, 2007). Inequality suggests that self-report and clinician-rated depression represent different constructs, but inequality does not suggest one is valid and the other is not; both may be valid. This result implies that discrepancy may not primarily be an indicator of data quality but instead the product of different depression constructs.
A third limitation is also related to the meaning of discrepancy. We used the term overreporting to denote self-reported scores higher than clinician ratings and underreporting to denote relatively low self-reported scores. This terminology suggests that clinician ratings are standard but we notice that clinician ratings are not necessarily more accurate than patient self-reports (e.g., De Los Reyes & Kazdin, 2004), and overreporting may thus equally well indicate a clinicians’ underestimation of depression severity. The estimated predictor effects can and should thus be interpreted in various ways.
Conclusion
Using a large outpatient sample, our study provided a replication of previous results on explanatory variables for patient–clinician discrepancy. Besides that, we provided additional results pertaining to the mechanisms underlying discrepancy. Although response inconsistency related to overreporting of symptoms by patients as compared with clinician ratings, our results suggest that inaccurate self-report responding is not a major explanation of patient–clinician discrepancy. Future research into patient–clinician discrepancy should be directed at potential biases in the clinician ratings.
Footnotes
Appendix
To assess the GRM unidimensionality and local independence assumptions for the subscale data of the BDI-II and the BSI, we conducted confirmatory factor analyses in Mplus (Muthén & Muthén, 2007). Since for the BDI-II various factor structures have been identified (e.g., Beck et al., 1996; Buckley, Parker, & Heggie, 2001), we compared model fit of several of the proposed factor structures in our data. To assess model fit, we used cutoff values for the comparative fit index (CFI) and Tucker–Lewis index (TLI) equal to .95 and cutoff values for the root mean square error of approximation (RMSEA) equal to .08. Model-fit comparisons yielded the structure corresponding to a 9-item cognitive subscale and 12-item somatic–affective subscale (Beck et al., 1996) to be most appropriate, although the RMSEA was poor for both subscales. RMSEA model fit improved from mediocre to satisfactory by freeing one residual correlation for each subscale. For the BSI, we used the 9-factor structure which includes 49 of the 53 items (De Beurs, 2004). For most BSI subscales, CFI and TLI suggested acceptable model fit. For the psychoticism and hostility subscales, RMSEA suggested poor model fit, but CFI and TLI suggested acceptable fit. Poor RMSEA may be due to a small number of items (Kenny, Kaniskan, & McCoach, 2015), and statistic lz is robust against mild model misfit (Conijn et al., 2014; Conijn et al., 2015). Hence, we decided to include all BSI subscales for computing the lzm person-fit statistic. The GRM assumption of monotone increasing logistic item step response curves was checked by visual inspection of the item step response functions using the Mokken Package in R (Van der Ark, 2012), and was supported by the data.
Declaration of Conflicting Interests
The author(s) declared no potential conflicts of interest with respect to the research, authorship, and/or publication of this article.
Funding
The author(s) received no financial support for the research, authorship, and/or publication of this article.