
Abstract
This study evaluated the measurement properties of the Satisfaction With Life Scale (SWLS) in a sample of 17,897 people with spinal cord injury (48%, n = 8,566), traumatic brain injury (44%, n = 7,941), and burn injury (8%, n = 1,390), 1 year following injury. We examined measurement invariance across the groups, unidimensionality, local independence, reliability from a classical test and item response theory (IRT) framework, and fit to a unidimensional IRT model. The results support unidimensionality and local independence of the SWLS. Reliability was adequate from a classical test and IRT perspective. IRT analysis found that the SWLS could be improved by using only five response categories rather than seven and by removing the fifth item, “If I could live my life over, I would change almost nothing.” This item functions poorly and reduces instrument reliability. With these revisions, the SWLS is a useful instrument to monitor an important outcome of trauma rehabilitation.
Keywords
Satisfaction with life (SWL) reflects a global evaluation of one’s life and is a component of subjective well-being (Diener, 1984; Lee et al., 2013) and health-related quality of life (HR-QOL; Guyatt, Feeny, & Patrick, 1993; Patrick & Erickson, 1988). SWL is a universal construct that allows us to examine how people’s cognitive judgments of their life vary across populations, studies, treatments, and time. It is widely studied from economics and policy research (Dolan & White, 2007; Ng & Diener, 2014) to studies of health (Lee et al., 2013). For instance, economists have examined the effect of changes in household income on life satisfaction (Stutzer, 2004) and evaluated the causal relationship between social leisure and SWL, making important recommendations related to successful retirement policies (Becchetti, Ricca, & Pelloni, 2012). SWL is also important for international comparisons, and is used to evaluate the effects of health, environmental, and economic factors on individual’s lives (Diener & Tay, 2015). It is especially valuable as a general measure of well-being in people living with chronic illness or disability.
General measures of well-being are an important part of monitoring the impact of traumatic injury on people’s lives. Individuals with traumatic injuries, such as spinal cord injury (SCI), traumatic brain injury (TBI), or burn injury (BI) generally report lower SWL postinjury than the general population or people without injury (Jacobsson & Lexell, 2013; McMahon et al., 2013; Moergeli, Wittmann, & Schnyder, 2012; Post, Van Dijk, Van Asbeck, & Schrijvers, 1998), although one study in TBI suggested that after an adjustment period SWL can increase to or exceed preinjury levels (Schulz-Heik et al., 2016). In all, SWL is a key outcome used to better understand and improve well-being of people, both healthy people and those with chronic conditions and disabilities.
The Satisfaction With Life Scale (SWLS; Diener, Emmons, Larsen, & Griffin, 1985) is one of the most widely used instruments for measuring SWL. The SWLS has been widely translated and used in a number of populations, and is a National Institutes of Health Common Data Element for general life satisfaction for rehabilitation populations with moderate to severe disabilities (Biering-Sorensen et al., 2015; Maas et al., 2010). Longitudinal databases tracking health outcomes of people with traumatic injury, such as the Model Systems funded by the National Institute on Disability, Independent Living, and Rehabilitation Research (NIDILRR), have used the SWLS in large samples of people with SCI, TBI, and BI who are tracked longitudinally (Dijkers, 1999; Goverman et al., 2016; Putzke, Richards, Hicken, & DeVivo, 2002; Williamson et al., 2016). In SCI research, it has been used to evaluate the effect of factors, such as weight or mechanical ventilation use, on overall HR-QOL (Charlifue et al., 2011; Y. Chen, Cao, Allen, & Richards, 2011; Hartoonian et al., 2014; Tate et al., 2015) and is one of the most frequently used patient-reported measures of quality of life (Wilson, Hashimoto, Dettori, & Fehlings, 2011). The SWLS has also been included in a number of studies with people with TBI (Cicerone & Azulay, 2007; Corrigan, Kolakowsky-Hayner, Wright, Bellon, & Carufel, 2013; Davis et al., 2012). A few studies have evaluated the course, correlates, and predictors of SWL in burn survivors (Costa et al., 2003; Gilboa, Bisk, Montag, & Tsur, 1999; Patterson, Ptacek, Cromes, Fauerbach, & Engrav, 2000). The SWLS has become an important part of tracking and evaluating HR-QOL in individuals with traumatic injury.
This study makes an important contribution to the existing literature. First, it examines if SWL functions the same in each of the three injury populations. Without this evidence, comparisons of SWL across populations may not be valid or interpretable. Second, an in-depth evaluation of the functioning of the scale using the tools provided by item response theory (IRT) provides new ways of examining psychometric properties. Third, it offers specific ways in which the psychometric properties of the scale can be improved.
Studies have generally found good psychometric properties when evaluating the SWLS using classical test theory (CTT) methodology or evidence of convergent validity when examining correlations with instruments of related constructs, such as other measures of life satisfaction, morale, psychological well-being, and positive-affect (Pavot, Diener, Colvin, & Sandvik, 1991; Rosengren, Jonasson, Brogårdh, & Lexell, 2015; Urry et al., 2004). Overall, psychometric evaluation of the scale in persons with traumatic injury has been limited. In people with SCI, the SWLS showed good reliability (α = .83), and evaluations of correlations and response patterns supported the validity of SWLS scores (Post, Van Leeuwen, Van Koppenhagen, & De Groot, 2012). However, CTT evaluations are found to be lacking in many cases due to the nature of the theory. All estimates are sample dependent, including difficulty and discrimination. The assessment of response category functioning is left to observing frequencies, and the estimation of reliability, using Cronbach’s alpha, is confined to a point estimate. The reliability estimate is the same for all levels of life satisfaction.
IRT methods allow for more rigorous evaluation of the SWLS by addressing shortcomings of CTT approaches, including sample dependent estimates of item characteristics and a point estimate for the reliability of the entire scale. Cronbach’s alpha systematically underestimates reliability or provides an estimate with unknown biases (Hambleton & Van Der Linden, 1982) making it difficult to use for power analyses. Adequate reliability requires smaller sample sizes and allows for greater confidence that the differences in scores result from real individual differences in the construct, SWL (Raykov, 2004). The ability to differentiate between the SWL of individuals over time or mean levels of SWL within groups is essential in research aimed at improving HR-QOL outcomes. For this, measurement error must be small and items must provide stable scores (Sijtsma, 2015). The IRT framework provides better tools for examining reliability and improving all of the scale’s psychometric properties.
In the IRT framework, information corresponds to reliability in the CTT frame. As the reciprocal of the standard error of the estimate, the amount of information in an item or scale provides a measure of the precision for estimating a person’s level of SWL. Unlike Cronbach’s alpha, information varies across different levels of life satisfaction. By using IRT, the reliability at different levels of SWL is estimated and better recommendations (especially those for sample size required to detect a treatment effect of a certain size) for the use of the SWLS can be made. IRT facilitates more in-depth evaluations of item functioning, including response options and item reliability.
The goal of this study was to use a combination of CTT, IRT, and factor analytic methods to examine the unidimensionality, functioning of the response options, and reliability of the SWLS in people with multiple traumatic injuries. Given the widespread use of the SWLS in evaluating HR-QOL, and in traumatic injury in particular, plus its use in a much wider body of research, an in-depth evaluation of item and scale functioning is warranted. Recommendations for the improvement and appropriate use of the scale can then be made.
Method
Participants
The sample included individuals with SCI, TBI, or BI, participating in the Model Systems. Participating centers follow people with traumatic injury to examine their long-term outcomes at regular intervals. Informed consent was given at time of enrollment in the Model Systems. Data were collected by the individual institutions participating in Model Systems, and subsequently transferred to the respective national database. The data were collected through in-person, phone interview, or mailed questionnaire (Y. Chen, DeVivo, Richards, & SanAgustin, 2016; Dijkers, Harrison-Felix, & Marwitz, 2010; Klein et al., 2007). All data for the current study were collected at 1 year following injury onset.
Participation by individual institutions in each of the Model Systems is based on a competitive grant process and funded by NIDILRR. Institutions are selected for their ability to provide care and conduct research, among other criteria. Descriptions of the individual institutions and the inclusion criteria for each Model System is reported below.
The goal of the SCI Model System (SCIMS) is to study the longitudinal course of traumatic SCI and factors that affect that course, as well as examine trends and rehabilitation treatment outcomes over time. The SCIMS has been enrolling participants since 1973. Current inclusion and exclusion criteria require that participants have recent traumatic SCI, be admitted to acute inpatient rehabilitation at a SCIMS center within 1 year of injury, and have completed inpatient rehabilitation or achieved a neurological status of normal or minimal deficit. Since its inception, a total of 30 rehabilitation hospitals have served as SCIMS centers across the United States, including 14 current sites (Y. Chen et al., 2016).
The TBI Model System (TBIMS) began data collection in 1987. Participants are enrolled if they have moderate to severe TBI and are admitted to inpatient rehabilitation. They must have presented to the designated TBIMS acute care hospital within 72 hours of injury, received both acute medical and acute rehabilitation care within the same system, been 16 years of age or older, provided informed consent, or if unable, family or legal guardian provided informed consent, and sustained a TBI with at least one of the following characteristics: Glasgow Coma Scale score <13 on emergency admission (not due to intubation, sedation, or intoxication), posttraumatic amnesia >24 hours, or trauma-related intracranial abnormality on neuroimaging. A total of 22 sites have participated in the TBIMS at some point, with 16 currently active sites (Dijkers et al., 2010).
The Burn Model System (BMS) centers program began a longitudinal database on outcomes in 1993. Enrolled participants are required to have received surgery for BIs. Database enrollment criteria for adult participants include meeting one of the following criteria: greater than 10% total body surface area (TBSA) burned and ≥65 years of age, greater than 20% TBSA burn and 18 to 64 years of age, electrical high-voltage/lightning injury, or BI to the hand, face, or feet. Database structure, enrollment, follow-up strategies, and data verification processes have been described in detail (Klein et al., 2007). Four institutions currently participate in the BMS program, five have participated since its inception.
Measures
The SWLS was developed to quantify global quality of life and satisfaction (Diener et al., 1985). Initial validity evidence was obtained from samples of undergraduates and older adults and later was expanded to several patient populations, including those with SCI and TBI (Braden et al., 2012; Post et al., 2012). It has been translated into numerous languages and has demonstrated adequate validity and reliability in a variety of populations (Schumaker, Shea, Monfries, & Groth-Marnat, 1993; Simpson, Schumaker, Dorahy, & Shrestha, 1996). The questionnaire consists of five items describing SWL that respondents rate on a 7-category Likert-type scale ranging from strongly disagree (1) to strongly agree (7). SWLS scores are calculated by summing item responses, with total scores ranging from 5 to 35. Higher scores indicate greater life satisfaction. SWLS scores are assigned qualitative grades by increments of 5 points (e.g., 5-9 = extremely dissatisfied; 31-35 = extremely satisfied). Some previous studies have used a 5-point rating scale (Kobau, Sniezek, Zack, Lucas, & Burns, 2010).
Analyses
Multiple psychometric properties of the SWLS were examined, including measurement invariance across the three injury groups, unidimensionality, local independence, reliability from both a CTT, and IRT framework, and fit to a unidimensional IRT model.
Measurement Invariance
Because the sample is composed of people with three types of injury, we completed a series of multigroup confirmatory factor analyses (MG-CFAs) to test for measurement invariance; doing so ensures that the construct of SWL is the same for the SCI, TBI, and BI groups. As an initial step, a single-factor confirmatory factor analysis (CFA) was fit to each group. Next, three levels of invariance, configural, metric, and scalar (Steenkamp & Baumgartner, 1998), each with increasing restrictions placed on the model, were assessed (Millsap, 2011). Configural invariance tests that the three populations have the same pattern on zero and nonzero loadings, while allowing the model parameters to be freely estimated. Metric invariance imposes equality of factor loadings across the populations. Retaining metric invariance does not ensure the same latent mean structure across populations, as the intercepts and residuals are free to vary. To confirm the equivalence of latent means across populations, scalar invariance was tested by restricting the pattern and estimates of loadings, as well as intercepts, to be equal across groups. Evidence of scalar invariance suggests that the SWLS functions the same among the three groups, providing support for combining the data for the IRT analysis.
Using the MG-CFA approach, we evaluated the fit of the baseline configural model using χ2, root mean square error of approximation (RMSEA), comparative fit index (CFI), and Tucker–Lewis index (TLI). The χ2 statistic is a measure of deviation of the fitted model from the unrestricted null model. A nonsignificant χ2 statistic indicates the fit of the restricted model is no worse than the unrestricted model. The χ2 statistic is sensitive to small deviations in model fit with large samples (Hu & Bentler, 1995). With a sample of almost 18,000, we expected this statistic to be significant so other statistics were used to evaluate measurement invariance. The RMSEA is a parsimony corrected, approximate fit index, with smaller values indicating better fit. Values less than 0.05 are considered to indicate a close approximate fit, while values between 0.05 and 0.08 are considered a reasonable fit (Browne & Cudeck, 1993). The 90% confidence intervals for the RMSEA were also created and evaluated. CFI and TLI are incremental fit indices that compare the fitted model with a baseline model. Hu and Bentler (1999) recommended values of 0.95 or higher as indicators of good fit. Additionally, in keeping with recommendations made by R. B. Kline (2010), we examined the full range of model estimates in addition to fit indices to evaluate the appropriateness of the model.
If the fit of the configural model is judged adequate, the fit of the more restrictive model is then compared with the less restrictive model. If the fit is not significantly degraded by the imposition of additional restrictions, then the more restrictive model is retained, accepting the restrictions. The change in the χ2 (Δχ2) statistic is one way to judge differences in model fit. In Mplus, the DIFTEST option is used to evaluate the Δχ2 statistic when the weighted least squares estimation with missing value estimator is used. Because χ2 is sensitive to sample size, we judged change in model fit using the approach recommended by Cheung and Rensvold (2002): change in CFI (ΔCFI). Values less than 0.01 indicate a nonsignificant change between models, allowing the more restrictive model to be retained.
Unidimensionality
Sufficient unidimensionality is an assumption of all scales that provide one summary score, whether developed using a CTT or IRT framework. Sufficient unidimensionality means that the summary score is mainly driven by one primary dimension, in this case, SWL. The unidimensional structure of the scale was evaluated using a one-factor CFA. All CFAs were run in Mplus 7.2 (Muthén & Muthén, 1998-2012), using the weighted least squares estimation with missing value estimator. A CFI of 0.95 or higher was interpreted as support for unidimensionality (Reise, Scheines, Widaman, & Haviland, 2013).
Local Independence
Local independence is a necessary assumption for multi-item scales that provide a summary score. It assumes that once SWL is taken into account, the items should be independent of each other. Items with local dependence indicate redundancy, containing less information than the IRT model would predict and may bias item parameter estimates (W.-H. Chen & Thissen, 1997). Local independence violations can be evaluated using a matrix of residual correlations from the CFA. Residual correlations of less than 0.10 were interpreted as support for the absence of local dependence (Kim, De Ayala, Ferdous, & Nering, 2011).
Reliability Analysis
Classical and IRT methods were used to evaluate the reliability of the SWLS score. CTT reliability was evaluated using Cronbach’s alpha and item-total correlations. Cronbach’s alpha is a measure of internal consistency and shows how closely related the scale items are as a group. Cronbach’s alpha provides a single estimate for reliability that is constant across the measured construct (i.e., SWL). Values ranging from 0.70 to 0.90 indicate good reliability (Dunn, 1989). Values higher than 0.90 can indicate redundancy among the items (Boyle, 1991). The contribution of each item to the overall scale reliability was evaluated by examining Cronbach’s alpha once an item was deleted from the scale. Ideally, alpha should decrease if an item is removed, demonstrating a positive contribution of an item to the reliability of the scale. Item-total correlations were also calculated; values greater than 0.30 provide evidence of scale reliability (P. Kline, 1979).
Reliability from an IRT perspective is conceptualized as the amount of information in a given item or entire scale. When there is more information available, there is less variability. Lower variability increases the accuracy and, in turn, reliability of the entire scale. Reliability in the IRT framework varies along the continuum of SWL. We evaluated reliability from an IRT perspective by examining the test information curve; a value of 5 corresponds to a reliability of 0.80 in CTT, while test information of 10 equals a reliability of 0.90.
IRT Analysis
The data were fit to Samejima’s (1969) graded response (GR) model using IRTPRO 3 after confirming that the IRT assumptions of unidimensionality and local independence were met. A number of approaches were taken to assess the fit and adequacy of the GR model. Overall, model fit was judged by the M2 statistic (Maydeu-Olivares & Joe, 2005) and by its associated RMSEA value (Maydeu-Olivares & Joe, 2014). Item-level fit was evaluated using Orlando and Thissen’s (2003) S − χ2, a review of the estimated item parameters, and an inspection of item trace lines and item information curves. Item parameters of interest include the ability measure (θ) and the slope. θ is located on the continuum of the underlying trait being measured, akin to CTT’s item difficulty. The slope is essentially the discrimination, or how well an item differentiates between individuals on different ability levels. The trace lines are curves that indicate the probability of selecting a particular response option along the trait continuum. Ideally, the curve for each response option should be greatest at some point, not covered by another response curve. The item information curve show how the information changes across different levels of the trait, as measure by the item.
Results
Participants
The demographic characteristics of the three samples are presented in Table 1. The sample included 17,897 individuals with traumatic injury, 48% (n = 8,566) with SCI, 44% (n = 7,941) with TBI, and 8% (n = 1,390) with BI participating in the Model Systems. The mean age for the combined sample was 38.85 years, ranging from 35.10 for individuals with BI to 39.40 for those with TBI. Higher proportions of males than females were observed in all groups, with an average of 75.14% males. The percentage of individuals identifying as White ranged from 59.03% to 71.40%, with an overall proportion of 69.27%. A greater proportion of the TBI sample (38.48%) reported some college education or more than the SCI sample (20.92%). The majority of participants were married at time of injury. Education level and marital status are not available for individuals with BI.
Descriptive Statistics by Condition.
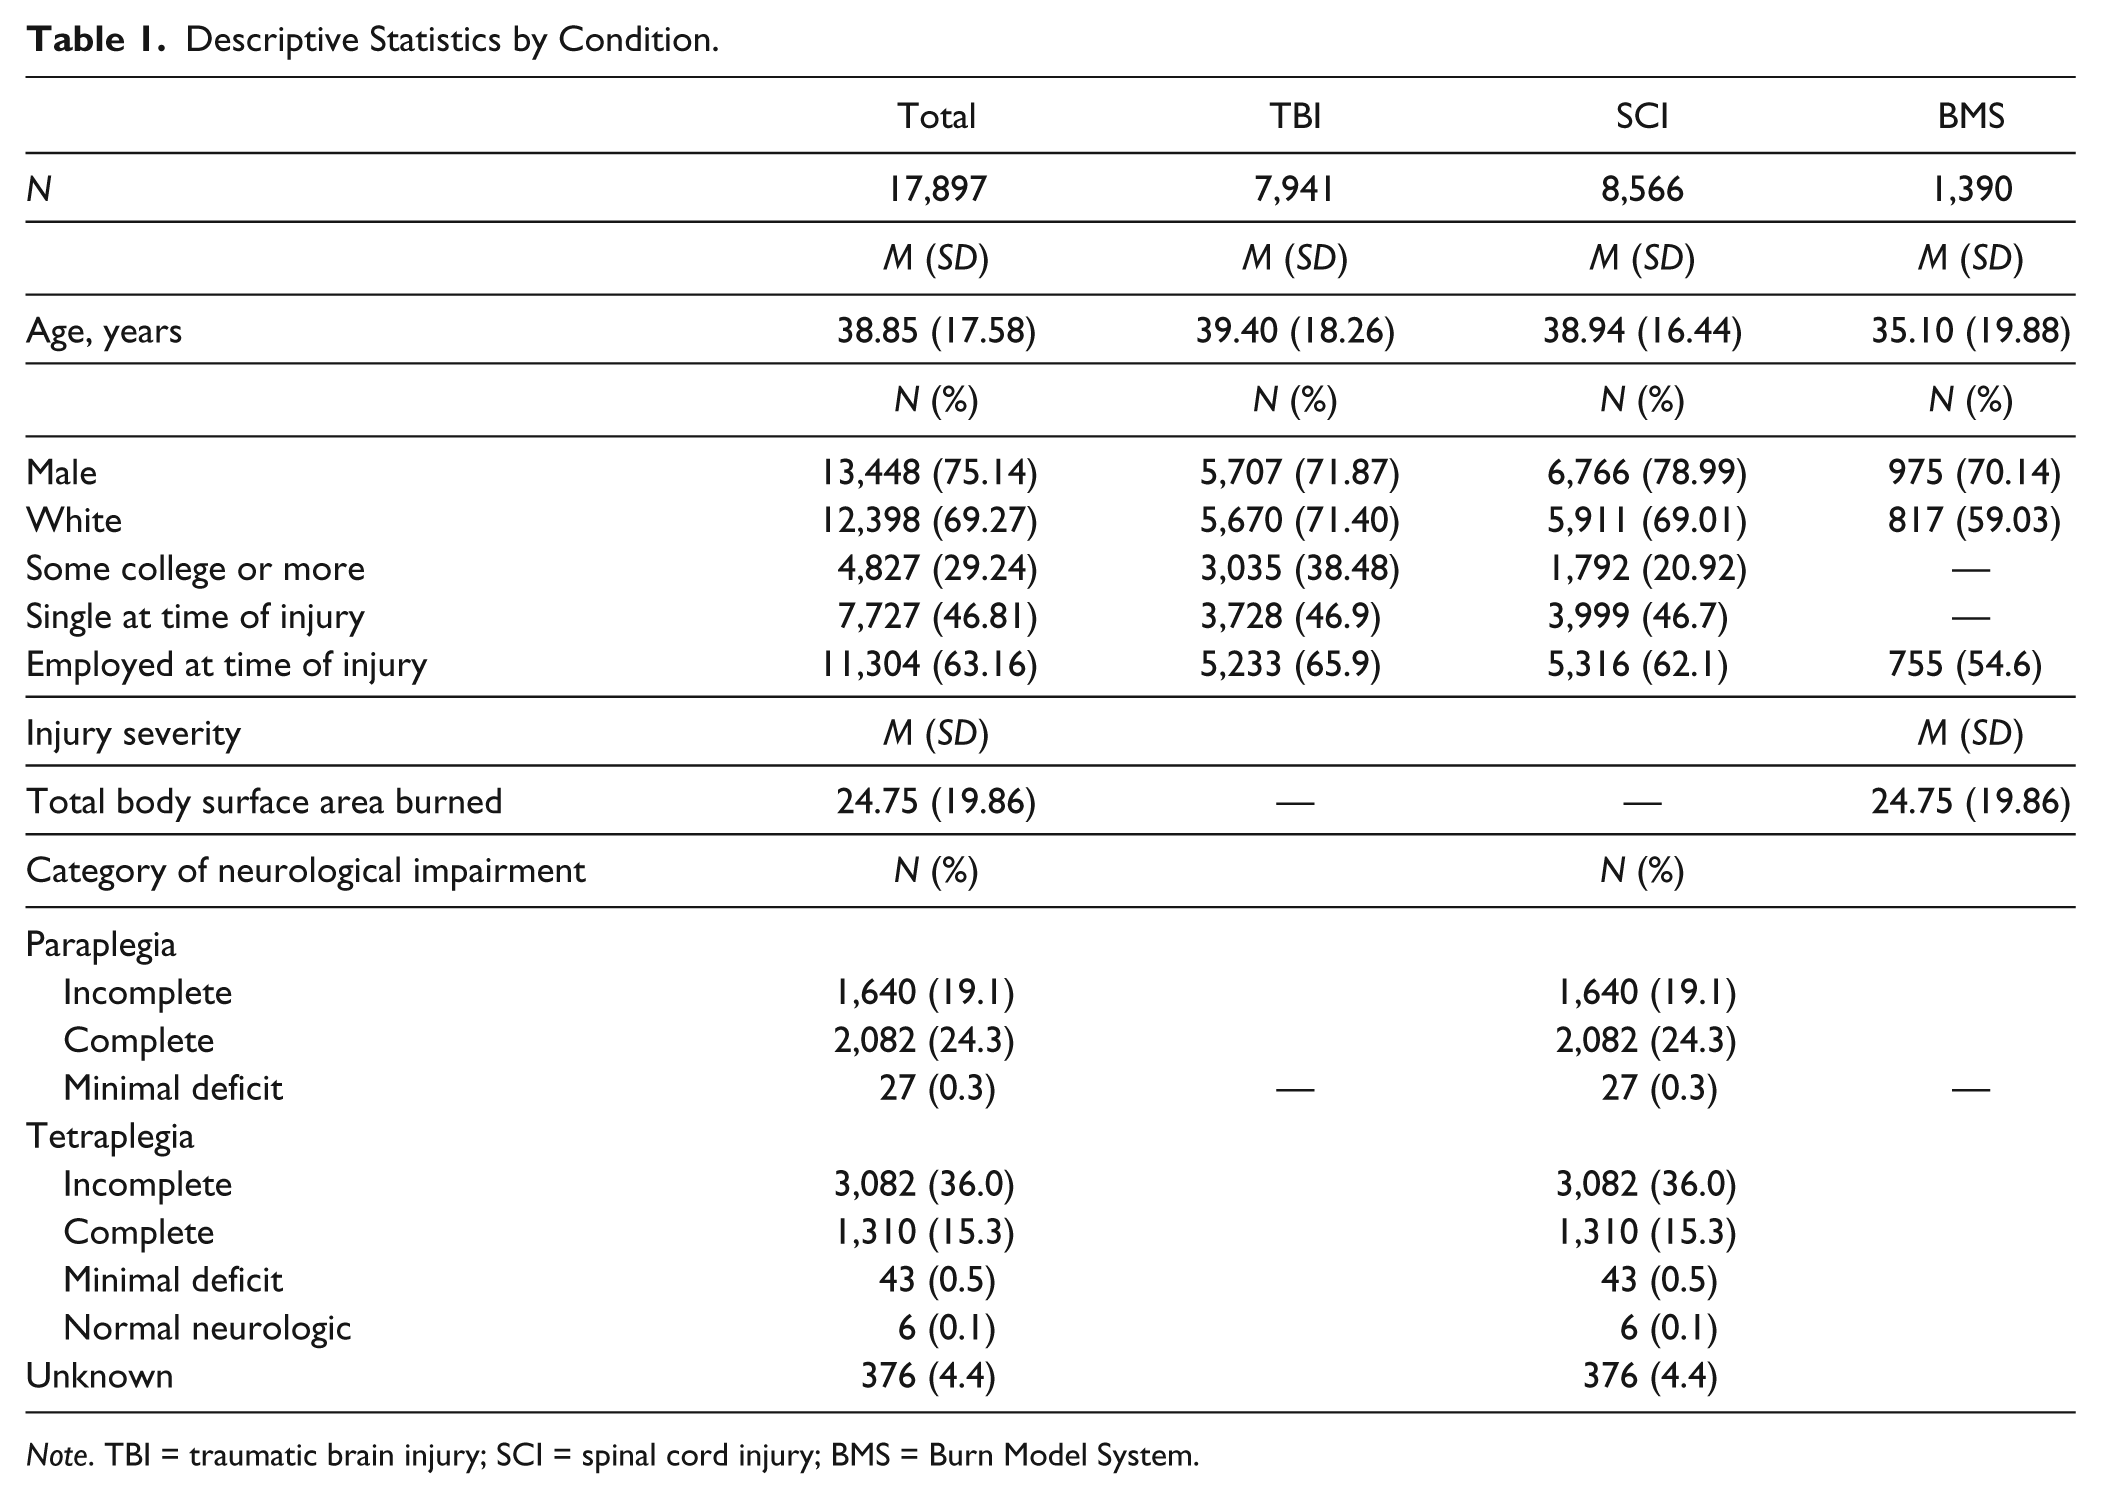
Note. TBI = traumatic brain injury; SCI = spinal cord injury; BMS = Burn Model System.
Measures of injury severity for SCI and BI are included for interested readers, no such measure is available for people with TBI. One measure of burn severity used by the BMS is the TBSA burned. Higher percentages of TBSA burned indicate a greater injury severity. SCIMS includes a measure of the neurologic impairment associated with the injury. Individuals are classified as having paraplegia (paralysis and/or loss of sensory of the legs and lower body), tetraplegia (paralysis and/or loss of sensory of all four limbs and torso), or normal neurologic. Paraplegia and tetraplegia are further subclassified as complete injury, incomplete injury, or minimal deficit. Complete injury refers to an absence of sensory or motor function in the lowest sacral segment. Incomplete injury refers to a partial preservation of sensory and/or motor function below the neurological level and includes the lowest sacral segment. Minimal deficit refers to minimal neurological damage with no significant or incapacitating loss of function. Finally, normal neurologic refers to individuals with no demonstrable muscular weakness or impaired sensation, and is free of other significant neurologic complications.
Measurement Invariance
The results for the one-factor model is presented in Table 2. The χ2 and RMSEA indicated poor model fit; however, the CFI and TLI showed good model fit. The results of the MG-CFAs provided support for configural, metric, and scalar measurement invariance and are presented in Table 3. The fit of the initial configural model was acceptable indicating the same pattern of loadings for each subgroup. The test of metric invariance, with loading constrained equal between subgroups, showed good model fit. The Δχ2 statistic indicated a significant difference in model fit, suggesting the metric model provided a worse fit to the data, Δχ2(10) = 103.48, p < .001. However, the ΔCFI = 0.001 provided evidence that the fit was not significantly worse for the metric model. Thus, the model was retained and metric invariance was supported.
Model Fit Statistics for One-Factor Model for Each Injury Group.
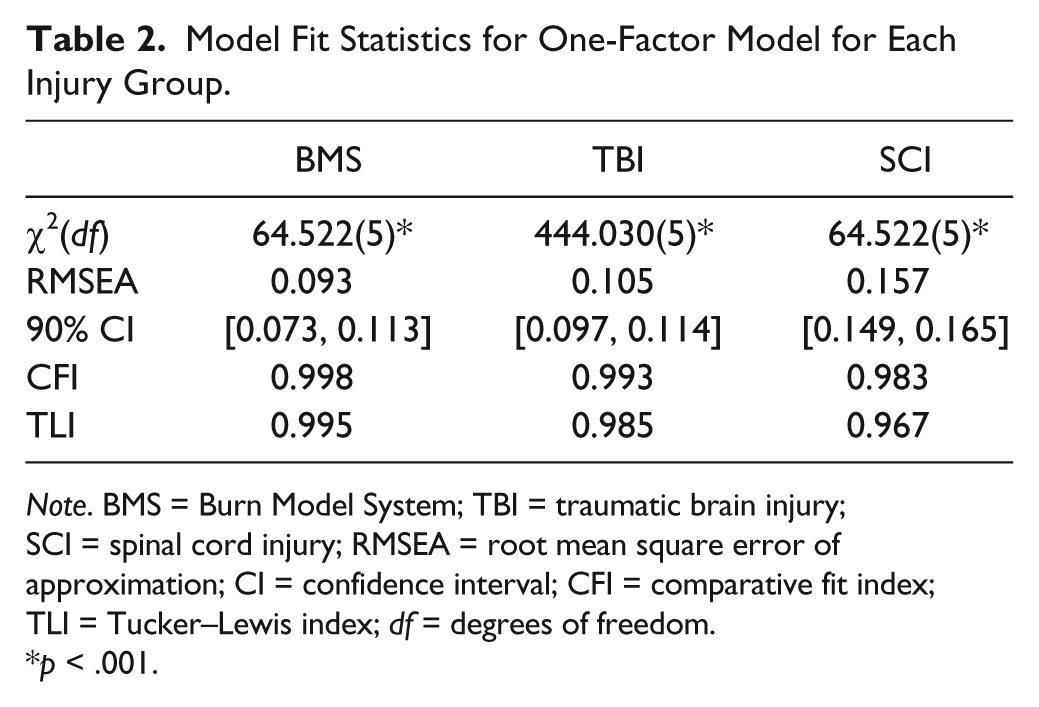
Note. BMS = Burn Model System; TBI = traumatic brain injury; SCI = spinal cord injury; RMSEA = root mean square error of approximation; CI = confidence interval; CFI = comparative fit index; TLI = Tucker–Lewis index; df = degrees of freedom.
p < .001.
Model Fit Statistics for the Multigroup Confirmatory Factor Analysis.
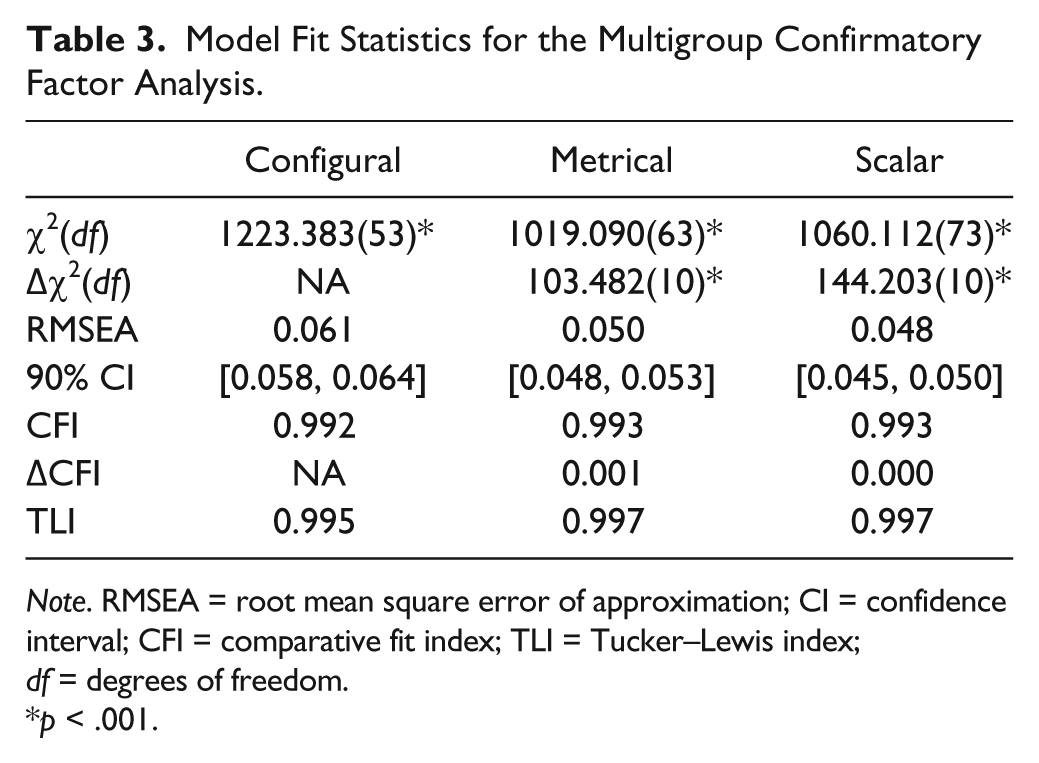
Note. RMSEA = root mean square error of approximation; CI = confidence interval; CFI = comparative fit index; TLI = Tucker–Lewis index; df = degrees of freedom.
p < .001.
The fit statistics indicated a close approximate fit for the scalar model. As with the metric model, the Δχ2 statistic indicated a significant difference in model fit for the scalar model, Δχ2(10) = 144.20, p < .001, but the ΔCFI < 0.001 suggests the scalar model fits equally well and was retained. The results of the tests of measurement invariance suggested the scale functions in the same manner for participants with BI, SCI, or TBI. Individuals with similar levels of SWL tend to respond in similar ways, no matter their condition. This finding lends support to the use of SWLS scores for comparisons between the conditions. Consequently, the groups were combined and analyzed together in the IRT analysis.
Unidimensionality
The results of the initial single-factor model provided evidence for the essentially unidimensional nature of the scale, with a CFI of 0.99. The result suggests the single-factor model provides an adequate representation of the latent structure, and supports the use of the unidimensional IRT model, and provides support for one summary score.
Local Independence
The residual correlations between items ranged from −0.04 to 0.09, indicating low or no local dependence.
Reliability
The CTT analysis supported adequate reliability (α = .85) of the SWL scale. Item 5, “If I could live my life over, I would change almost nothing,” did not contribute positively to the overall reliability, with α increasing to .86 with the item’s removal. Item-total correlations ranged from 0.52 (Item 5) to 0.75 (Item 3).
Evaluation of the total information curve (Figure 1), found strong reliability in the center, near the mean SWLS score. The information function was slightly negatively skewed, providing better reliability a bit above the mean than below. The estimated reliability was greater than 0.80 from approximately 1.8 SDs below mean SWL to 2.0 SD above, that is, approximately between the scores of 6 and 34, encompassing nearly the full range of possible SWLS scores. Of the current sample, 3,544 individuals, or 19.8%, would fall outside of this range.
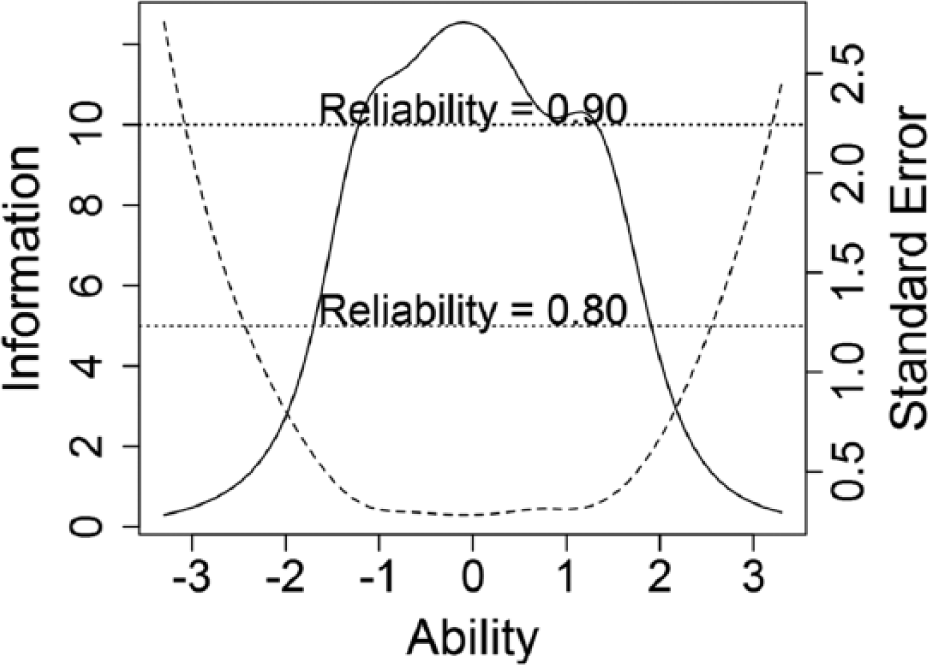
Total information curve and standard error.
IRT Analysis
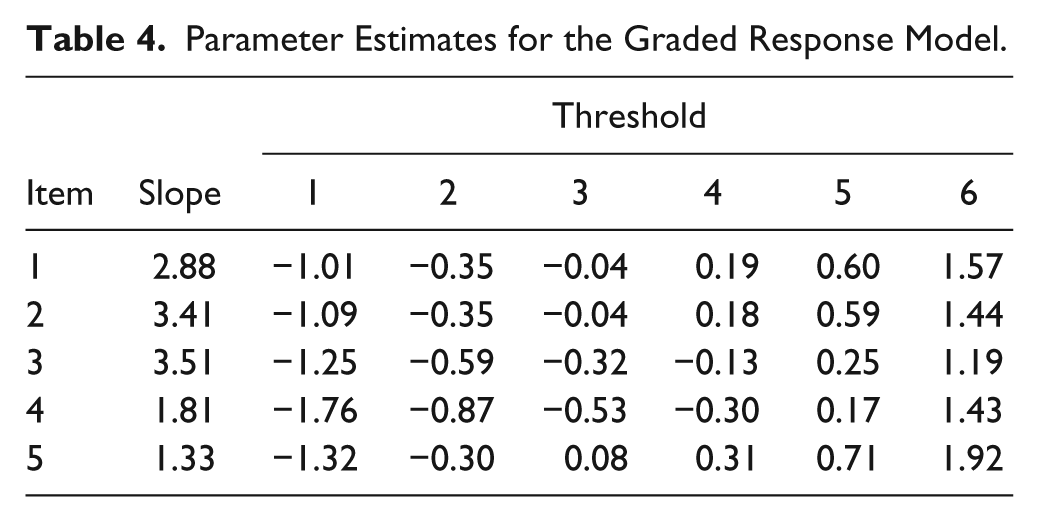
The data for the whole sample were fit to the GR model. We anticipated poor item-level fit due to the sensitivity of the S − χ2 statistic with such a large sample size. As expected, the S − χ2 statistic was significant for each item, ps < .001. The slopes and information for Items 1 to 3 were good, providing evidence of their usefulness in the model and the scale. The slopes (Table 4) for Items 4 and 5 are noticeably smaller, indicating less discrimination and providing less information throughout the item, as seen by the dotted lines in Figures 2 to 6.
Parameter Estimates for the Graded Response Model.

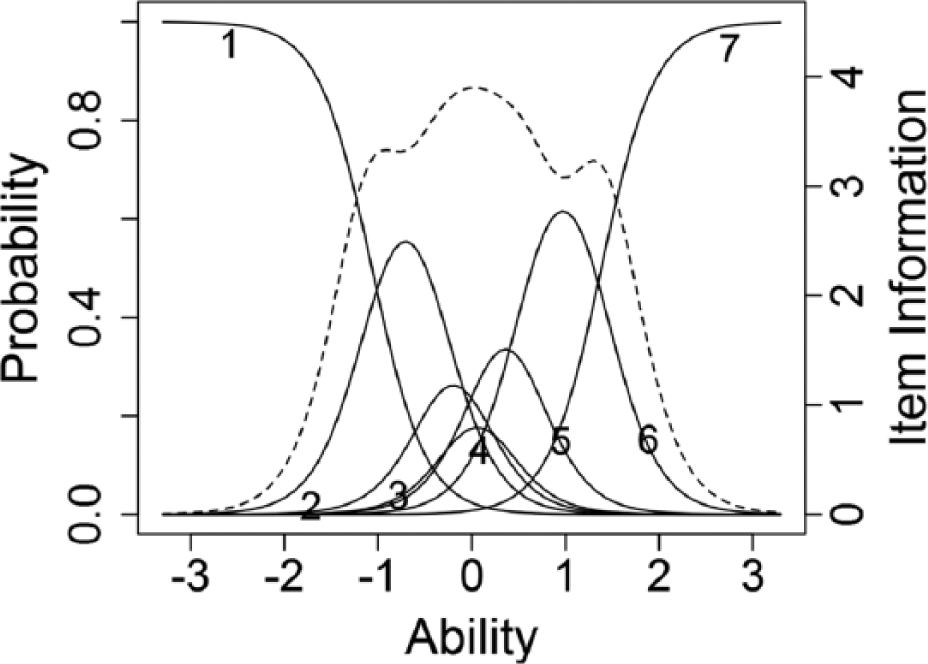
Trace lines and item information function for Item 1.
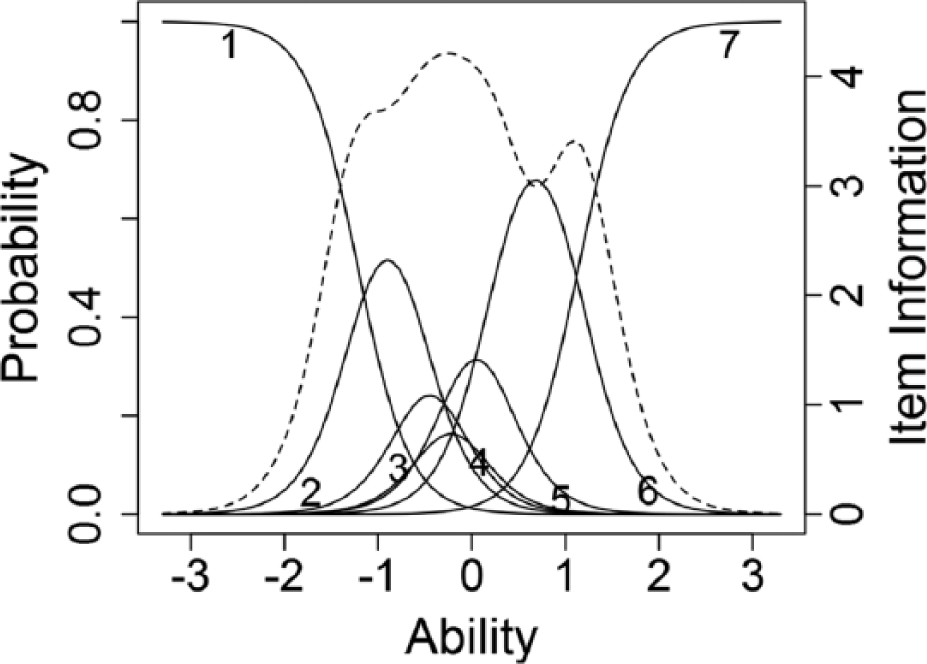
Trace lines and item information function for Item 2.
Trace lines and item information function for Item 3.
Trace lines and item information function for Item 4.
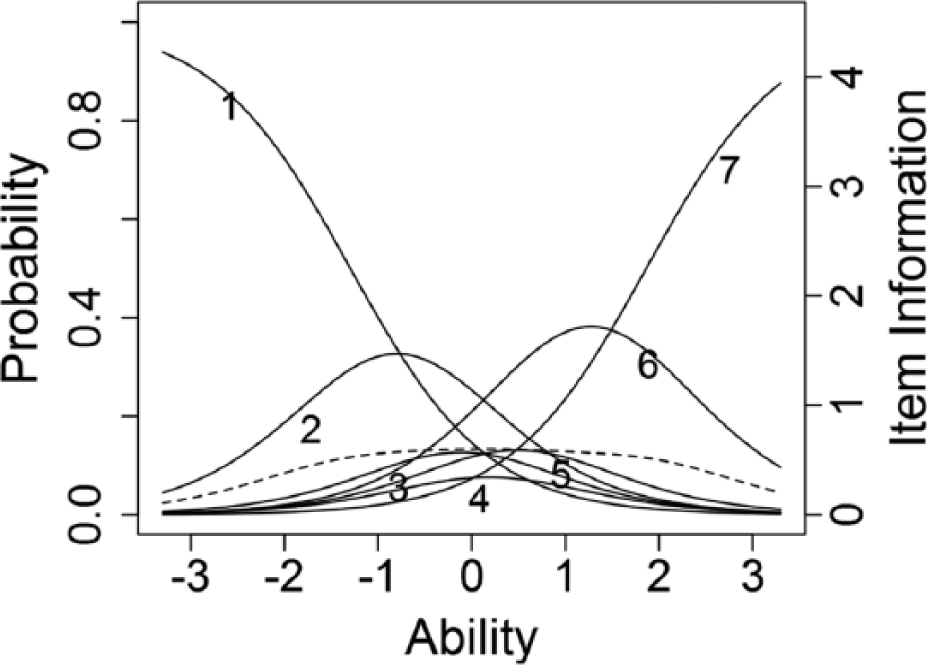
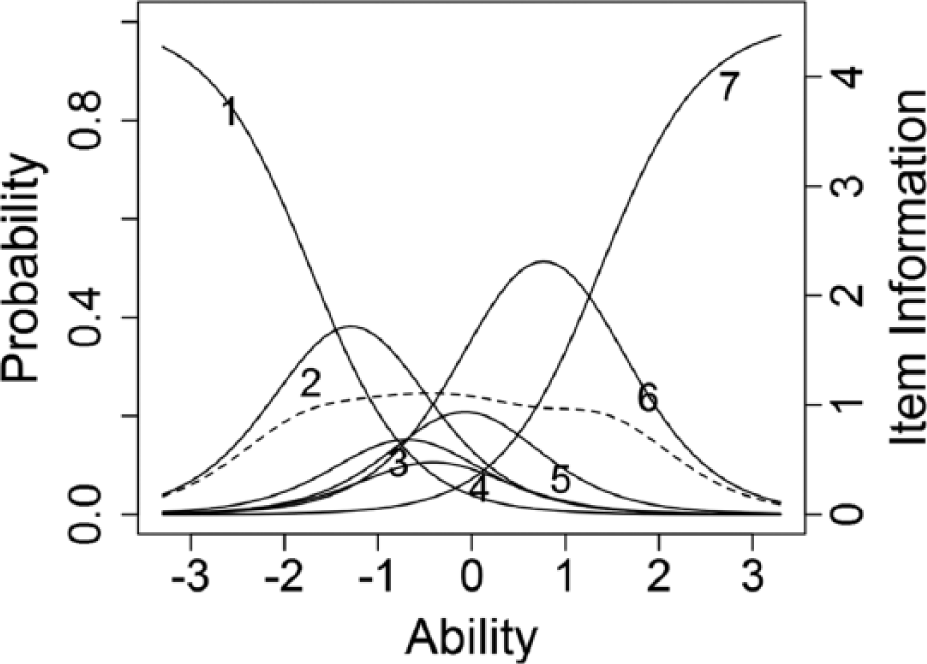
Trace lines and item information function for Item 5.
The trace lines in Figures 2 to 6 indicate that one or more categories in each item was unlikely to be chosen by any participants, regardless of the level of a person’s SWL, indicating that only some response options are useful in differentiating different SWL levels (Adams, Wu, & Wilson, 2012). Seven appears to be too many response options.
Item 5 made little contribution to the reliability of the scale, as indicated by the low item information seen in Figure 6 and an increase of Cronbach’s alpha with the item’s removal. Combined with the failure of some categories to differentiate individuals, this item appears to add little to the overall scale.
Discussion
The results of this study generally support adequate psychometric properties of the SWLS. First, we found support that the construct of SWL functions in a similar way for all the three traumatic injury populations. Thus, scores on the SWLS can be compared between individuals with different traumatic injuries, opening additional avenues of HR-QOL research in individuals with traumatic injuries.
Second, the results supported unidimensionality and local independence of the SWLS items, suggesting that the items all measure a single construct. This finding corroborates the use and interpretation of a single summary score for the SWLS in people with traumatic injuries. These findings also support the use of the IRT model, and interpretation of item scores.
Third, the adequate reliability of the scale was supported by CTT and IRT evidence. The IRT analysis showed adequate reliability within two standard errors of the mean ability score. Of the fifth of the sample whose scores did not reach adequate reliability, the vast majority (about 81%) had scores more two standard errors above the mean, indicating that high levels of SWL were not reliably measured by the SWL. Caution should therefore be exercised when reporting and interpreting scores outside of this range, as increased levels of error would undermine certainty in the results.
The results of the IRT analysis indicate the scale could be improved in two ways. First, seven response options are not supported. For all items, at least two response options have a lower likelihood of ever being endorsed than the other options; the trace lines for these options are covered by the trace lines for other response options. The study results support a maximum of five response categories (strongly disagree, disagree, neither agree nor disagree, agree, strongly agree) rather than the current seven, confirming previous research using the SWLS with a 5-point scale (Kobau et al., 2010) and in keeping with research showing that five response options tend to maximize reliability (Bandalos & Enders, 1996).The use of a 5-point scale would also bring the SWLS in line with other widely used HR-QOL measures, like the Patient-Reported Outcomes Measurement Information System measures (Carle et al., 2011), increasing uniformity of response options across scales, simplifying instructions, and potentially decreasing respondent burden (Bradburn, 1978). The burden placed on respondents by different aspects of surveys has long been a concern (Sharp & Frankel, 1983). As the Model Systems surveys, and those included in other HR-QOL research, include a number of scales in addition to demographic information, the streamlining of responses and lessoning of burden could have a meaningful impact.
Second, the fifth item, “If I could live my life over, I would change almost nothing,” does not function well and reduces the reliability of the scale. Other researchers have also found issues with the item (Heinemann, Sokol, Garvin, & Bode, 2002). Tulsky et al. (2011) noted that some individuals that have suffered a traumatic injury may find item five offensive, as it asks if the person would change nothing about their life if given a choice. Partly because of this concern, the appropriateness of the scale for individuals with traumatic injury has been called into question (Hill, Noonan, Sakakibara, & Miller, 2010). Though previous research has identified this issue, research continues to use the full scale (Goverman et al., 2016; Tate et al., 2015). Removal of Item 5 would improve the psychometric properties of the scale and obviate concerns about the appropriateness of the scale for individuals with traumatic injury. It would remove a potential source of construct irrelevant variance, and make the scale more universally comparable, improving its utility in research.
A consequence of implementing these recommendations is the loss of comparability with previous reports. This limitation could be overcome by developing a cross-walking table to convert the original scores into modified scale scores, or to develop an alternate scoring of the four items. The psychometric properties of the SWLS could be improved while still maintaining continuity with scores obtained in previous studies using the original items and scoring.
Limitations
The results of this study need to be considered within the context of its limitations. No evidence for the validity of the SWLS scores was collected or evaluated during this study. The evaluation of validity evidence for the use the SWLS scores in the three populations was outside the scope of this study. Validity evidence for the use of SWLS scores in individuals with SCI is available. However, there is no evidence in TBI and BI samples. The removal of Item 5 would obviate concern for the applicability of the SWLS to persons with traumatic injury (Hill et al., 2010; Tulsky et al., 2011). More general concerns for the use of the scale in populations with traumatic injury warrant further research into the validity of the SWLS scores.
The samples used in the current study were unbalanced, with fewer cases with BI than either SCI or TBI. In other types of analysis, the results might be unduly influenced by the larger groups. However, the measurement invariance in the SWLS across the three groups indicates that the unbalanced sample did not affect the IRT results.
Finally, the samples for each of the injury types, SCI, TBI, and BI, are not necessarily representative of the larger population of individuals with such injuries, though Corrigan et al. (2012) provides evidence of the TBIMS’ representativeness. The specific recruitment and inclusion conditions for each of the model systems make the samples less general than the whole of individuals with SCI, TBI, or BI.
Conclusion
This study provided support for the comparison of SWLS scores in populations with SCI, TBI, and BI, as well as recommendations for improving the functioning of the scale. The SWLS could be improved by using five rather than seven response options, as well as the removal of Item 5.
Footnotes
Authors’ Note
The contents of this publication do not necessarily represent the policy of National Institute on Disability, Independent Living and Rehabilitation Research, Administration for Community Living, Department of Health and Human Services, and endorsement by the Federal Government should not be assumed.
Declaration of Conflicting Interests
The author(s) declared no potential conflicts of interest with respect to the research, authorship, and/or publication of this article.
Funding
The author(s) disclosed receipt of the following financial support for the research, authorship, and/or publication of this article: The contents of this publication were developed in part under grants from the National Institute on Disability, Independent Living, and Rehabilitation Research (NIDILRR Grant Numbers H133P120002, 90DP0053, 90DP0031, 90SI5006). NIDILRR is a center within the Administration for Community Living and Department of Health and Human Services.