
Abstract
The Washington Assessment of Risks and Needs of Students is a youth self-report screening instrument developed for use by high school and juvenile court personnel faced with the legal and practical challenges of high truancy and dropout rates. It purports to measure six facets of risks and needs of youth relevant to improving school outcomes. In this study, a bifactor model measuring a general factor and six specific factors was examined for fit and invariance across different groups defined by sex and race/ethnicity, with a sample of court-petitioned high school students (N = 937; ages 13-17 years). The results of multigroup confirmatory factor analysis revealed an essentially invariant bifactor structure across the groups. Further analysis of reliability support the use of the general factor to guide decision making for youth at risk for truancy and school failure, and scores deriving from the six specific factors as providing insight on specific areas of risk and need.
Evidence links school dropout with poor social, occupational, and economic outcomes, including incarceration and other types of involvement with the criminal justice system (Belfield & Levin, 2007; Farrington, 2003; Henry & Huizinga, 2007). Over time, these linkages represent a negative cascade sometimes referred to as the “school to prison pipeline” that is predicted by, among other things, prior school truancy, negative attitudes about school, and academic failure (National Juvenile Justice Network, 2011). As a result, efforts to reengage adolescents at risk for criminological involvement often begin with interventions that place a high priority on improving school attendance, engagement, and success (Baker, Sigmon, & Nugent, 2001; Johnson, Wright, & Strand, 2012; Sinclair, Christenson, Evelo, & Hurley, 1998).
Effective intervention on behalf of youth at risk for school failure and court involvement requires information concerning the social, economic, emotional, and behavioral factors that influence school attendance and performance (Baker et al., 2001; Kearney, 2008; Sutphen, Ford, & Flaherty, 2010). This widely held insight has given rise to the development of instruments that seek to quantify these risk factors and to establish administrative structures that are responsive to the information obtained within school and court settings (Dembo & Gulledge, 2009; Johnson et al., 2012). One such instrument, the Washington Assessment of the Risks and Needs of Students (WARNS; George et al., 2015), uses a youth self-report format to assess multiple risks and needs linked to truancy, delinquency, and dropping out of school. Measured factors include aggression-defiance, depression-anxiety, substance abuse, peer deviance, school engagement, and family environment. This set of factors is drawn from life course developmental theories that seek to predict and explain effective and ineffective transitions from adolescence to adulthood (Cullen, 1994; Farrington, 2003; Laub & Sampson, 2003). For instance, Laub and Sampson (2003) describe family and peer networks as sources of social capital or social risk with respect to delinquency. These social factors affect delinquency and criminal behavior through their interactions with person-level variables that include internalizing symptoms, externalizing behavior disorders, and substance-abuse tendencies. In addition to this interconnected web of social and personal attributes, school engagement—defined by one’s behavior and attitude toward school and academic ambition—is identified as an additional factor influencing the tendency toward delinquency and criminal behavior, and appears to be a more significant predictor of those outcomes than is school achievement (Henry & Huizinga, 2007; Sampson & Laub, 1993). Indeed, school engagement is seen as a particularly powerful counterforce against social capital deficits and individual-level dispositions that align with delinquency (Archambault, Janosz, Fallu, & Pagani, 2009; Farrington, 2003; Laub & Sampson, 2003).
Although these social, school, and personal factors are identified as discrete entities, there is a clear sense that they are also highly interdependent. Evidence of this comes from studies illustrating moderate to strong cross-sectional and longitudinal associations between these factors, and related speculation that underlying them all is shared risk arising from a general factor. Farrington (2003) labeled that general factor antisocial potential, and argues that it contributes to and accounts for variance across more specific, nongeneral factors. It is important with respect to instruments like the WARNS, therefore, to evaluate factor structure models that account for a general factor and specific factors in different arrangements in order to inform score use decisions (e.g., Reise, 2012).
The WARNS was originally developed at the behest of juvenile court administrators in Washington state who needed a tool for guiding decision making regarding referrals and the provision of intervention services to youth who had been served with a court petition (George et al., 2015). The majority of such individuals meeting these criteria had been court-petitioned for statutory offenses such as accruing too many unexcused school absences, while others were petitioned for higher level offenses. Therefore, it was the aim of the developers of the tool to assess domains that would be useful for facilitating referrals and making treatment decisions, and to form a communicative bridge between juvenile courts and schools for multisystem involved youth. The WARNS seeks to provide a method to quickly gather and synthesize information relevant to the initial stages of engagement with at-risk youth. Its purpose is to allow counselors, case managers, and school personnel to better understand specific risks and needs of the youth with whom they work, to guide conversations, and to develop successful intervention plans (Iverson, French, Strand, Gotch, & McCurley, 2016; Strand & Lovrich, 2014). Additionally, given that the WARNS was conceived of as a screening instrument, a premium was placed on ease of administration, scoring, and interpretation.
The WARNS is not the only at-risk screener available, but it differs from other instruments in important ways. For example, the Problem Oriented Screening Instrument for Teenagers (Danseco, & Marques, 2002; National Institute on Drug Abuse, 2009)—an instrument used to demonstrate concurrent validity evidence with the WARNS (George et al., 2015)—and the Communities that Care® Youth Survey (Glaser, Van Horn, Arthur, Hawkins, & Catalano, 2005) measure similar domains using more items. Numerous other instruments that measure mental health domains similar to those assessed by the WARNS have been used to inform community, school, or court reengagement efforts, but they do not classify family, peer, or school functioning separately from mental health–related domains (e.g., Behavioral and Emotional Rating Scales-2: Buckley & Epstein, 2004; Global Appraisal of Individual Needs–Short Screener: Dennis, Chan, & Funk, 2006; Massachusetts Youth Screening Instrument-2: Grisso, Barnum, Fletcher, Cauffman, & Peuschold, 2001; Behavior Assessment System for Children-2: Reynolds & Kamphaus, 2004; Social Skills Improvement System Rating Scales: Crosby, 2011). In addition, to our knowledge none of these instruments has been conceptualized as having a bifactor structure, which has important implications for application. Therefore, while alternatives to the WARNS exist, none overlap it with regard to item content, factor structure considerations, purpose, and placing theory into practice.
To summarize, the WARNS is brief and assesses domains that both theory and research have identified as influencing school truancy, juvenile justice system involvement, and concurrent and future crime. Given the appeal of these design features and the fact that the scale is used in practice, there is a need for further evidence concerning the psychometric properties and usefulness of the WARNS as a sound screening tool. One form of evidence includes how the scale functions across male and female students and race and ethnicity groups. That is because level of risk for adverse school outcomes differs across these groups such that school dropout and justice system involvement are higher for males and Hispanic/Latino and African American youth (Barrett, Ju, Katsiyannis, & Zhang, 2015; Barrett & Katsiyannis, 2016). It is therefore desirable that the WARNS and instruments like it demonstrate invariance with respect to measurement properties across those groups. Such invariance contributes to an overall argument for score interpretation and use within and across the groups (Kane, 2013). Thus, it is the purpose of the present study to evaluate the WARNS with respect to its factor structure, internal consistency of scores, and the extent to which factor models are invariant across individuals from these different groups (e.g., Brown, 2015; Chen, Sousa, & West, 2005). In line with this purpose, we evaluate evidence to support two claims. First, we hypothesize that the WARNS items fit a bifactor model (Reise, 2012). This proposed model reflects the manner in which the scale was designed and how it is used in practice. It is important to test this hypothesis to see if produced scores reflect a shared variance on the general factor and unique variance on the specific factors. Second, we hypothesize that the internal structure of the WARNS in the form of the bifactor model will be invariant across boys and girls and two major race/ethnicity categories (White/Caucasian vs. Hispanic/Latino). Such invariance is essential to support inferences drawn from any differences observed between groups. These types of hypotheses and validity claims are in accord with recommendations by the Standards for Educational and Psychological Testing (American Educational Research Association, American Psychological Association, & National Council on Measurement in Education, 2014).
Method
Participants
The participants were adolescents (N = 937, 53% male) between 13 and 17 years of age and attending public school in Washington state. This sample includes only youth for whom a court petition was filed with the state, with the majority filed due to excessive unexcused absenteeism, in accordance with Washington state statutory law (BECCA Bill, 1995, E2SSB 5439). The racial-ethnic background of the sample was predominately Hispanic/Latino (45%) and White/Caucasian (39%), and included individuals who identified as African American (6%), Native American/Alaskan (7%), and Asian/Pacific Islander (3%). School and social adjustment of the participants varied greatly as revealed by indicators of school disengagement and juvenile court involvement (e.g., 26% never suspended, 12% with 11 or more suspensions; 58% never arrested, 12% with 3 or more arrests). These data reveal portions of the sample to be at high risk for both school failure and possible future justice system involvement.
Procedure
Archival data were used for the present study, obtained from the Washington State Center for Court Research (George et al., 2015). It was collected in six counties in Washington state between November 2009 and May 2012 by juvenile court staff who administered the WARNS during the court or intervention process. Parent and student consent were obtained within the context of the intervention process and students voluntarily completed the WARNS at the time they appeared in court for a truancy workshop, while attending a community truancy board meeting, during case management activities within 1 month of initial meeting or a court hearing, or while attending a day detention school for youth with a history of status offenses and/or criminal offenses. Students completed the WARNS in the presence of juvenile court staff, requiring little assistance and taking, on average, approximately 15 minutes.
Instrument
The WARNS is a brief self-report measure designed to allow schools, courts, and youth service providers to assess risks and needs that may lead to truancy and/or school failure, and to target interventions accordingly (George et al., 2015). It takes 10 to 30 minutes to complete and measures experiences related to healthy social, emotional, and educational development. It contains 40 items that form the basis for six subscales that assess the following domains: Aggression-Defiance, Depression-Anxiety, Substance Abuse, Peer Deviance, Family Environment, and School Engagement. Previous research links all six areas to truancy, delinquency, and/or dropping out of school (Hammond, Linton, Smink, & Drew, 2007; Howell, 2003; Loeber & Farrington, 1998). When completing the assessment, youth also respond to a set of demographic questions and questions about prior arrests and suspensions from school, which do not factor into the scoring of the instrument’s subscales.
The Aggression-Defiance (8 items) subscale assesses frequency of aggressive (“I got into physical fights”) and defiant (“I lied, disobeyed, or talked back to adults”) behaviors. The Depression-Anxiety (8 items) subscale assesses the symptoms of depression (“I felt like nothing could cheer me up”) and anxiety (“I was so worried or bothered by things it was hard to concentrate”). The Substance Abuse subscale (items) measures usage and effects of drugs and alcohol (“I missed or skipped school to use or recover from drugs or alcohol”). Peer Deviance (5 items) queries participants’ perception of deviance of their peers with respect to multiple areas of risk such as defiance, aggression, and substance abuse (“My friends got drunk or high from alcohol, marijuana (pot, weed), or other drugs”). The Family Environment (5 items) subscale measures the quality of the parent–child relationship as well as the home environment (“If I wanted to do homework, my parents’ home was a good place to be”). Finally, the School Engagement (9 items) subscale measures the participant’s attachment to school and learning (“I liked going to school”), efforts to succeed (“I studied for my quizzes and tests”), and connectedness to school and school personnel (“I could talk to an adult at school if I had a problem”). Items are measured on a rating scale (1 = never or hardly ever, 2 = sometimes, 3 = often, and 4 = always or almost always) indicating the frequency of the thought, behavior, or emotion during the past 2 months.
Analyses
Confirmatory Factor Analysis
The present study evaluated the factor structure and factorial invariance of WARNS responses with the population for which it was developed. Given strong theoretical evidence for the proposed factor structure of the instrument, confirmatory factor analytic procedures were used. Four models were tested to confirm the best fitting model. We present the multiple-factor models in Figure 1. These models included a bifactor model (i.e., six first-order uncorrelated factors and a separate general factor; Panel A), a higher order model (i.e., the six first-order factors and one second-order factor; Panel B), a model with six correlated first-order factors (i.e., the six Needs Scales; Panel C), and a one-factor model with all items related to a single factor (i.e., general need/risk factor; not shown). Each of these factor models can be consistent with the theorizing and aims of the WARNS, although interpretation of scores would differ depending on which model demonstrated the best fit. The current use of the WARNS is in accord with the bifactor model where scores on the general factor are used for decisions regarding overall risk and subscores are used for understanding specific areas of risk and need. Parameter estimation in Mplus 7.1.1 (Muthén & Muthén, 1998-2012) employed weighted least squares means and variance adjustment (WLSMV) with the theta parametrization to account for ordinal data.
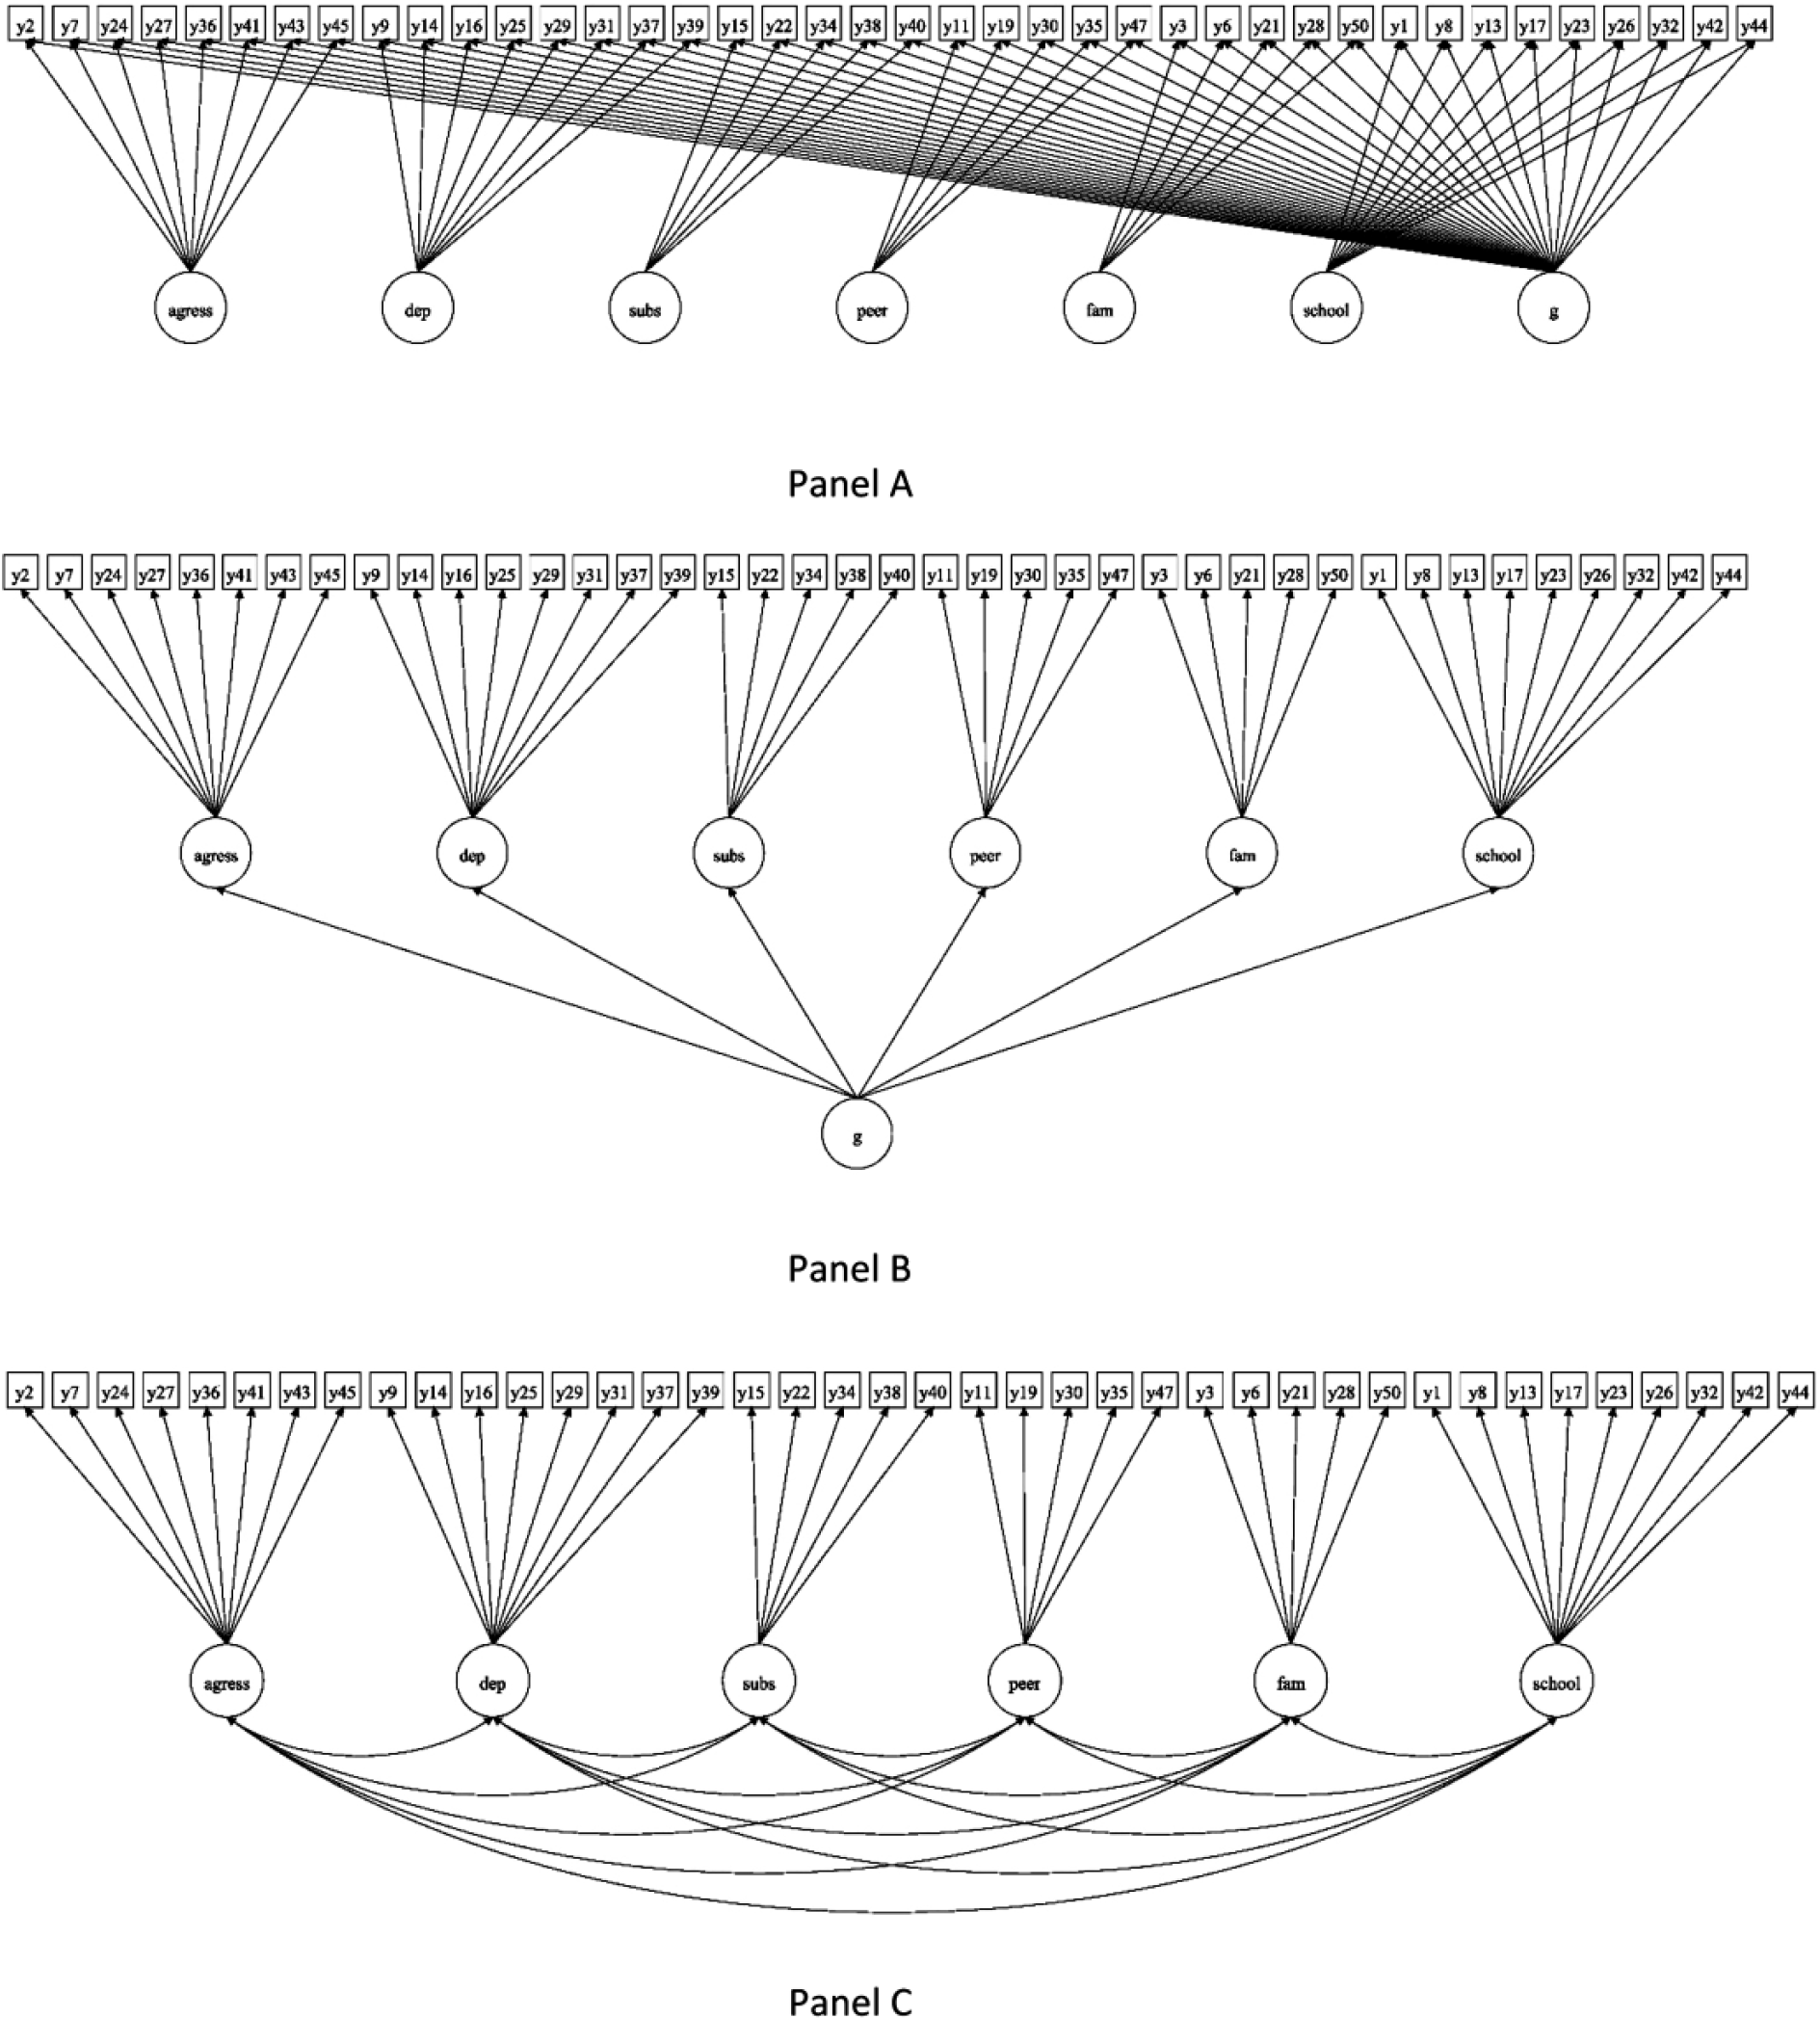
Panels representing three models tested for the WARNS with the following six subtests: Aggression-Defiance (agress), Depression-Anxiety(dep), Substance Abuse(subs), Peer Deviance(peer), Family Environment(fam), and School Engagement(school).
Model fit was evaluated via a χ2 significance test, the root mean square error of approximation (RMSEA), comparative fit index (CFI), and weighted root mean square residual (WRMR). The χ2 significance test is oftentimes not used to rule out adequate model fit, owing to its sensitivity to sample size (Chen et al., 2005). Applying adequate fit guidelines with robust estimators is difficult. Considering that the indices are based on maximum likelihood estimation, their applicability to robust estimation lacks empirical justification (e.g., Finney & DiStefano, 2013; Nye & Drasgow, 2011). Thus, criteria typically used (e.g., CFI > .95, Hu & Bentler, 1999) were relaxed. Fit criteria were stated as CFI > .90 and RMSEA < .08. There are no set criteria for the WRMR at this time so a criterion of WRMR near 1.0 was employed. In addition to fit indices, model parameters were inspected for out-of-range values as were residuals for localized strain (Brown, 2015). Pattern coefficients were evaluated against a threshold of .30 (e.g., Comrey & Lee, 1992; Pett, Lackey, & Sullivan, 2003). See Comrey and Lee (1992) for definitions of fair to excellent loading criteria. The value of .30 has been suggested as a lower bound due to representing only 9% of shared variance with the factor. Finally, interpretation and use of the model were considered in light of current use and theory.
Score Reliability
Internal consistency reliability estimates were calculated for the scores on the factors for the best fitting model across the full sample, in order to inform recommendations for score use. Given the analytical context of latent variables measured on an ordinal scale and the presence of a bifactor structure, score reliability was estimated through four indices—omega (ω), omega hierarchical (ωH), omega subscale (ωS), and omega hierarchical subscale (ωHS). As discussed by Reise (2012) and Rodriguez, Reise, and Haviland (2016), the ω coefficient is a latent-variable analogue to Cronbach’s alpha coefficient, capturing all sources of common variance. Calculation of this coefficient was applied to scores derived from the general factor (i.e., all items). The ωS coefficient reflects the proportion of combined common variance between the general and specific factor. Calculation of this coefficient was applied to one specific factor at a time. The hierarchical coefficients reflected systematic score variance only in either the general factor (ωH) or specific factor (ωHS). Coefficient values of at least .80 were considered sufficient for use of the instrument in research settings, while a criterion of .95 was set for high-stakes decisions about an individual (Nunnally & Bernstein, 1994).
Factorial Invariance
On identification of the best fitting factor model, factorial invariance was examined across sex (female vs. male) and ethnic groups (White/Caucasian vs. Hispanic/Latino) using multigroup confirmatory factor analysis (MCFA). MCFA involves examination of equivalence models by imposing model equality constraints (Brown, 2015) and assessing a decline in fit where a substantial decline signals a possible lack of invariance. Two sets of MCFA were conducted in which the model was fit across two groups at a time—across sex and across ethnicity. The strategy for invariance testing was to first examine fit of the proposed model in each group with no constraints. Next, the model was fit to both groups simultaneously to obtain the baseline model. Finally, a model with all parameters set equal across the groups (i.e., a fully constrained model) was evaluated. A significant degradation of fit at this stage (i.e., decrease in CFI of more than .01; Cheung & Rensvold, 2002) would have signaled a lack of invariance. We conducted the baseline-to-fully-constrained model approach because when WLSMV is employed with ordinal variables and theta parametrization, where indicators load on more than one factor, as is the case with a bifactor model, the metric model cannot be estimated. Accordingly, the automated routine in Mplus moves directly from the baseline to the fully constrained model. See Mplus Version 7.1 Language Addendum (Muthén & Muthén, 1998-2012) for additional specifications. This procedure follows specification issues that Millsap (2011) discusses as well.
Missing Data
An inspection of missing data was performed, guided by Widaman (2006). Initial analyses of the nature and extent of missing data found the overall level of missing responses was .3%. At least one response to a WARNS subscale item was missing for 7.5% of respondents (n = 70). Only four individuals were missing responses for four or more items, and never were responses missing for an individual for an entire subscale. Item nonresponse ranged from .0% to 1.0%. These conditions supported using single imputation in SAS 9.4 (SAS Institute, 2014) to produce a complete data set. This approach preserved in the data set every individual who had provided responses to the WARNS, thus maximizing statistical power. Furthermore, Widaman (2006) recommends single imputation when missing data are at a low level (i.e., 1% to 2%) because the imputed data set will retain reasonable levels of lack of model–data fit that were present among the nonmissing values (p. 52) and the simplicity of performing, interpreting, and describing analyses on a single dataset outweigh the potential benefits of resolving missing data through multiple imputation (p. 61).
Results
Measurement Model
Model fit statistics for each model appear in Table 1. The bifactor model, which is congruent with how the instrument is used in practice currently, was deemed best fitting. This outcome provides validation evidence for the theoretical structure of the WARNS. This evidence, however, is modest, as the CFI and RMSEA were two of three indices to reach the respective threshold for indication of a well-fitting model. The WRMR may suggest a lack of fit, but as stated there is no empirically established criterion for this index. No modifications to the model based on theory or empirical information could be identified.
Confirmatory Factor Analysis Fit Indices by Model.
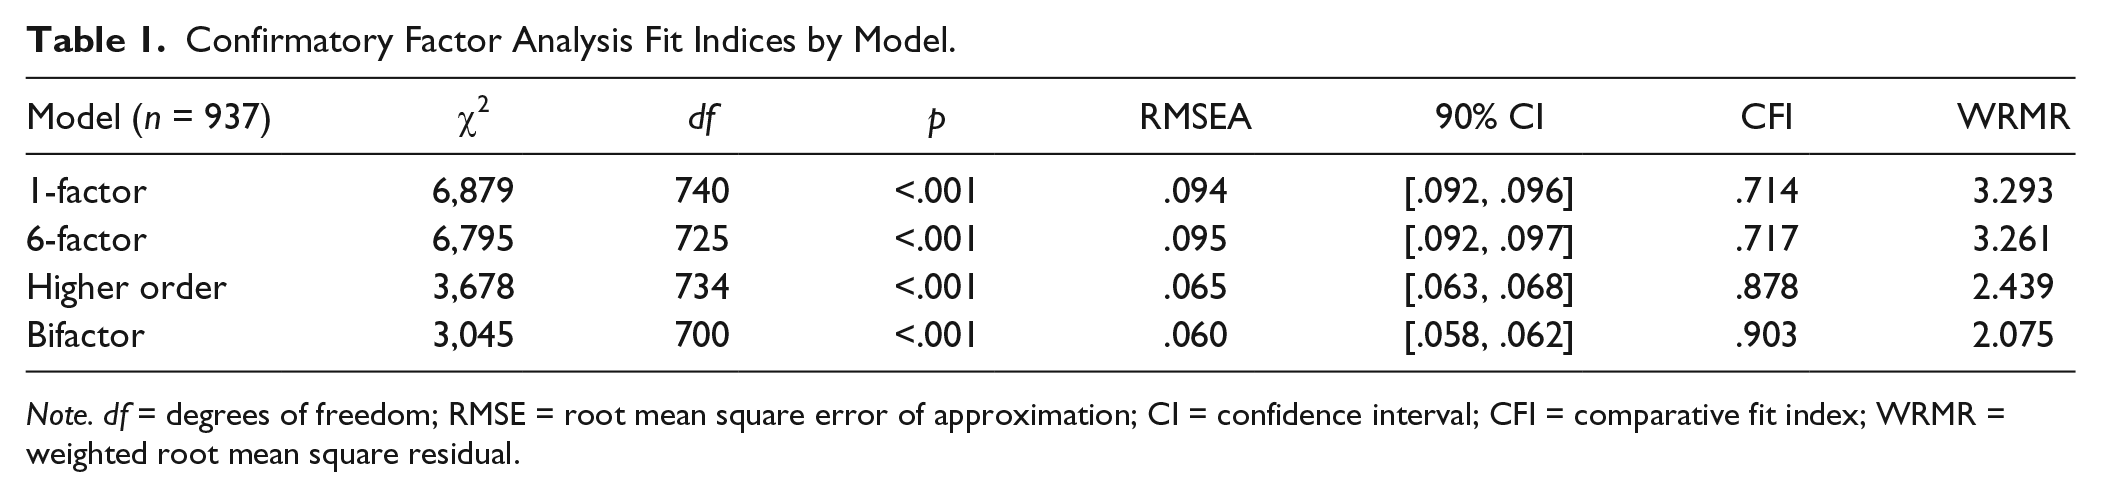
Note. df = degrees of freedom; RMSE = root mean square error of approximation; CI = confidence interval; CFI = comparative fit index; WRMR = weighted root mean square residual.
The factor pattern coefficients based on the bifactor model appear in Table 2. Items demonstrated moderately high loadings on both the general factor and the specific factors in nearly all cases. All items had statistical significant loadings on at least the general factor or the target specific factor. Some specific factors had low loadings (e.g., .22). However, in these cases, the general factor accounted for a much larger proportion of item variance. The opposite was in effect for items associated with the School Engagement domain. The loadings with the specific factor for several items exceeded .50, while loadings on the general factor were the lowest ranging from .30 to .38.
Factor Pattern Coefficients for the Bifactor Structure of the WARNS.
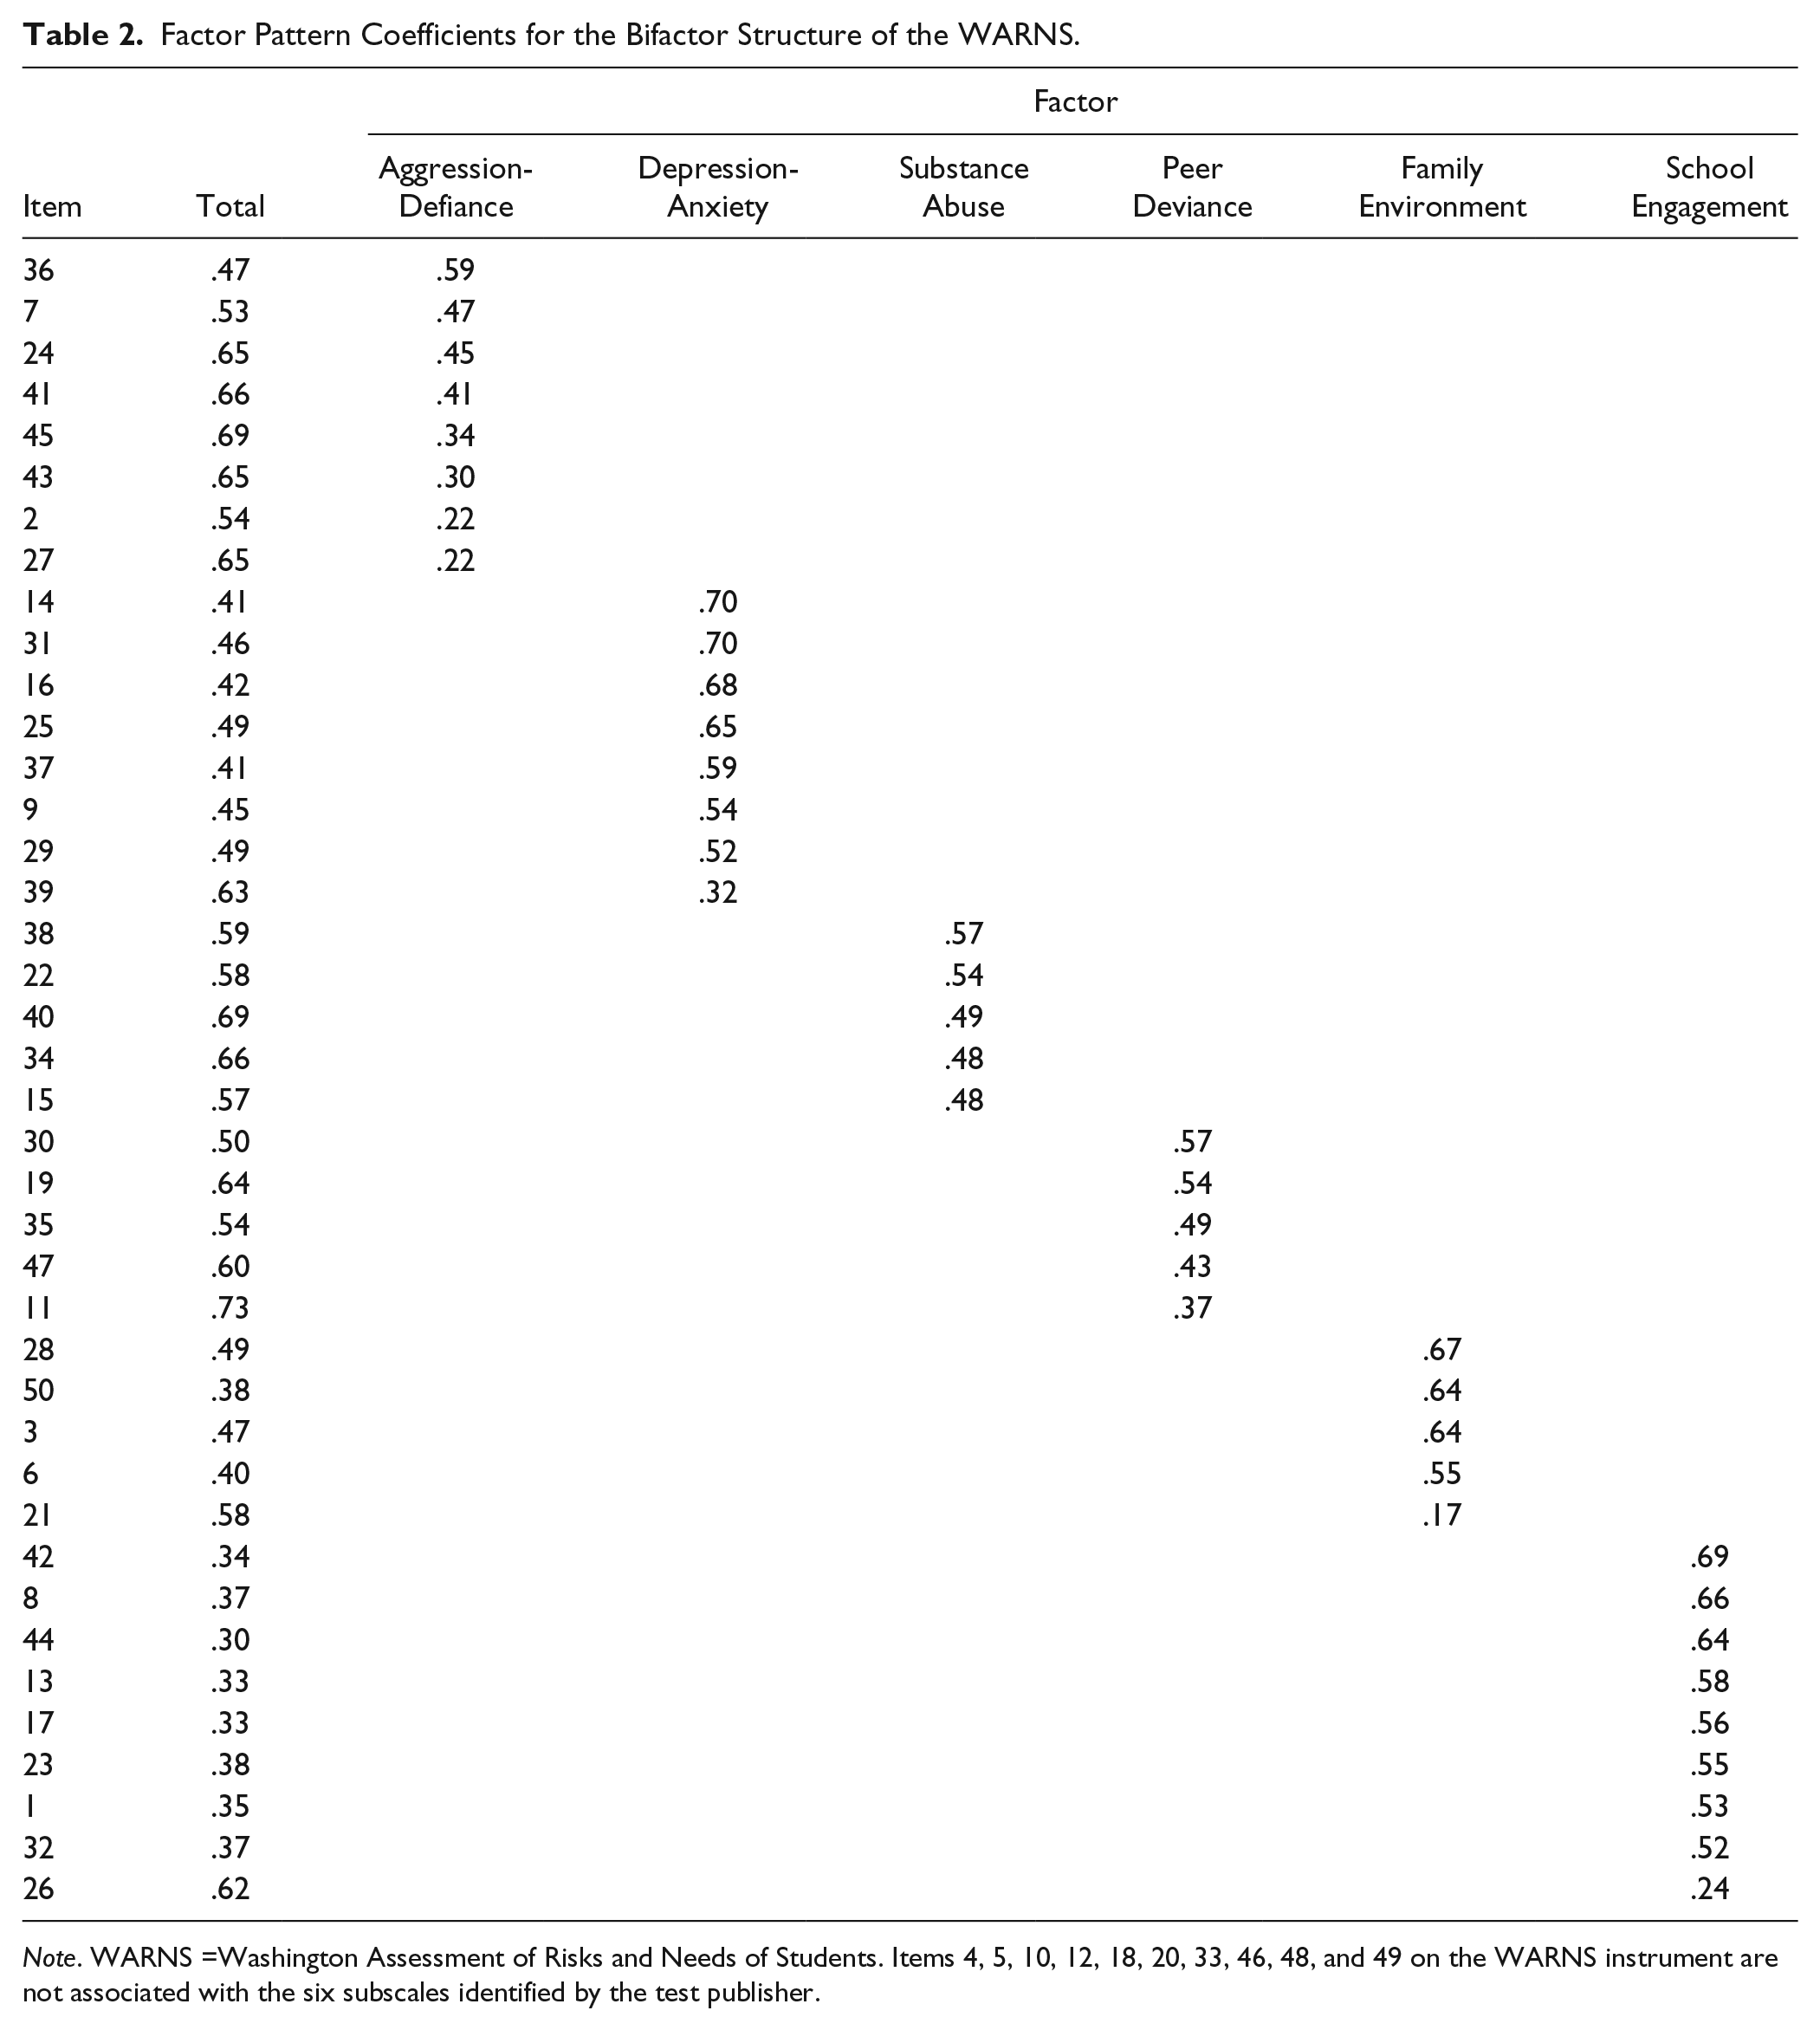
Note. WARNS =Washington Assessment of Risks and Needs of Students. Items 4, 5, 10, 12, 18, 20, 33, 46, 48, and 49 on the WARNS instrument are not associated with the six subscales identified by the test publisher.
Reliability
Nearly all ω and ωS coefficients met the criterion of .95 for high-stakes decisions about an individual in the total sample and each of the four subsamples (Table 3). (All coefficients were at or above .90). A different story emerged, however, on inspection of the hierarchical coefficients. There, reliability estimates related to the general factor (ωH), exceeded .80, suggesting total scores, derived from the 40 WARNS items, demonstrate enough consistency to support use in a research setting. Reliability estimates at the subscale level (ωHS), however, ranged from .21 to .66. Therefore, it appears that responses to WARNS items reflect a multidimensional, bifactor structure, but users should focus on the total score and use the subscale scores for providing information on areas of risk and need that may require further assessment.
Internal Consistency Reliability Estimates for Washington Assessment of Risks and Needs of Students Scores by Demographic Groups.
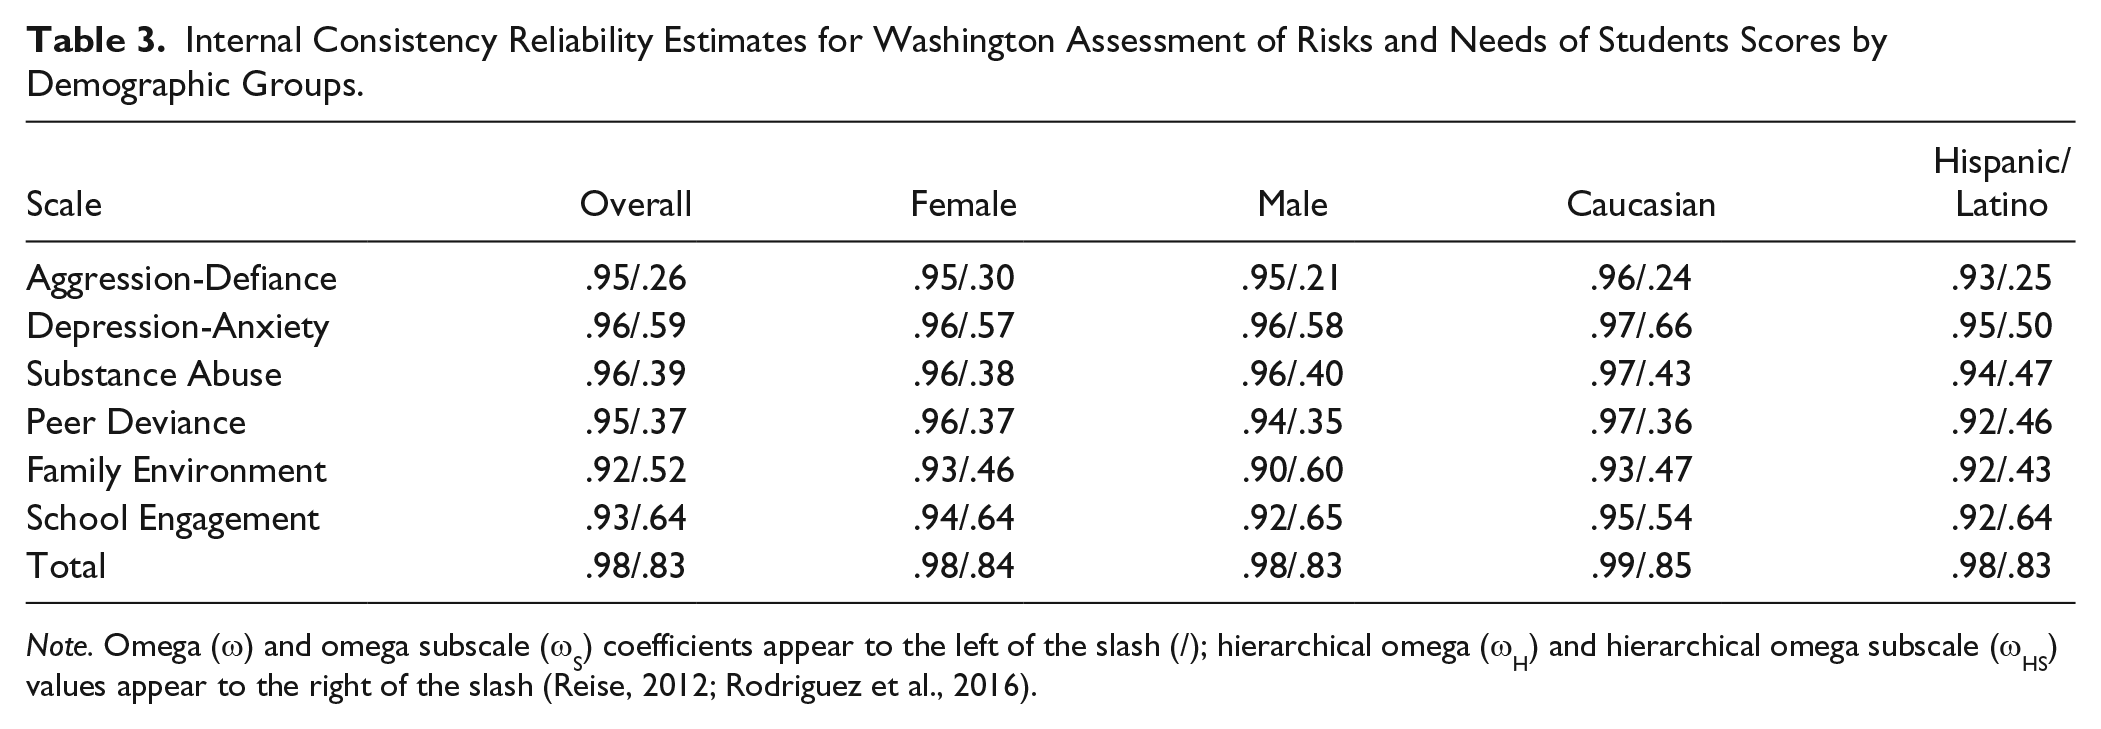
Note. Omega (ω) and omega subscale (ωS) coefficients appear to the left of the slash (/); hierarchical omega (ωH) and hierarchical omega subscale (ωHS) values appear to the right of the slash (Reise, 2012; Rodriguez et al., 2016).
Factorial Invariance
Sex
When fit to data provided by female-only and male-only samples, the bifactor model met the criterion for RMSEA in both samples and the CFI in the sample of female respondents (Table 4). The CFI in the male sample fell just short of the stated criterion. Invariance testing continued as this was the best fitting model from the general sample and used in practice currently. The combined baseline model was acceptable. The fully constrained model indicated factorial invariance as criteria were satisfied. CFI values showed little to no change between the baseline model and fully constrained model. Therefore, results suggest the bifactor model is invariant across sex. Reliability estimates for domain scores by sex (Table 3) closely matched the pattern observed across the full sample. Factor pattern coefficients for female-only and male-only samples were largely of the same magnitude and same relative order as in the full sample and similar to each other, with a few exceptions (Table 5). For male adolescents, Item 43 (“I lied, hustled, or conned someone to get what I wanted”) demonstrated far less association with the specific factor of Aggression-Defiance than for female respondents.
Multigroup Confirmatory Factor Analysis Bifactor Model Fit Indices.
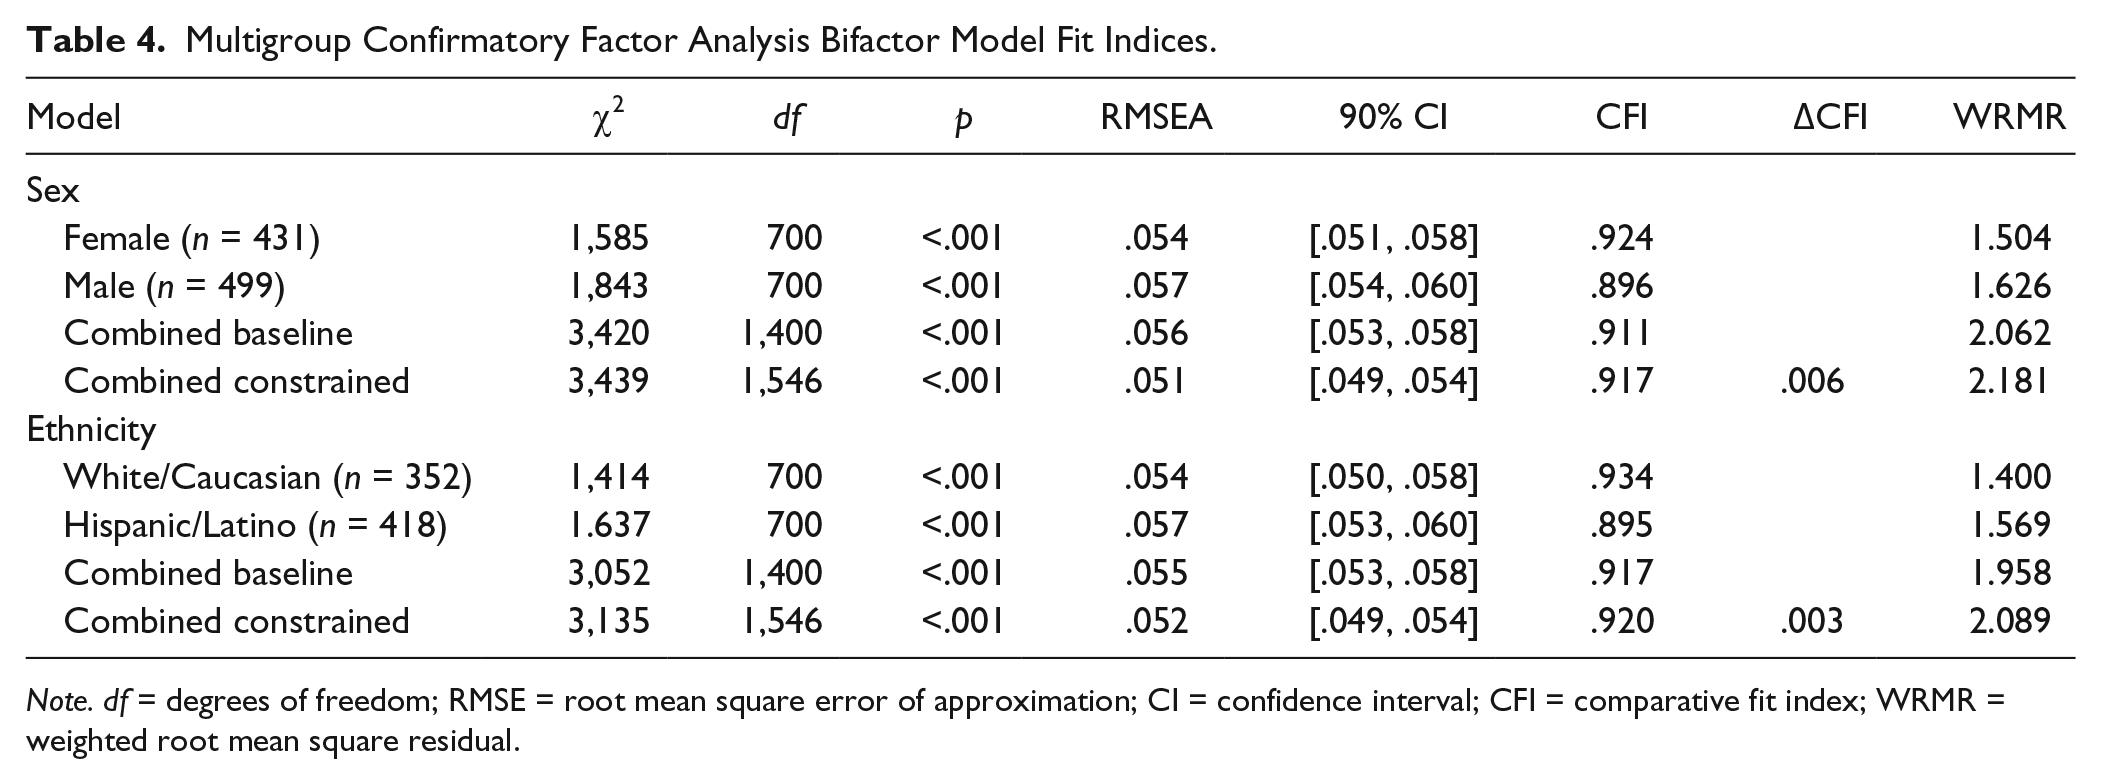
Note. df = degrees of freedom; RMSE = root mean square error of approximation; CI = confidence interval; CFI = comparative fit index; WRMR = weighted root mean square residual.
Factor Pattern Coefficients for the Bifactor Structure of the Washington Assessment of Risks and Needs of Students by Sex.
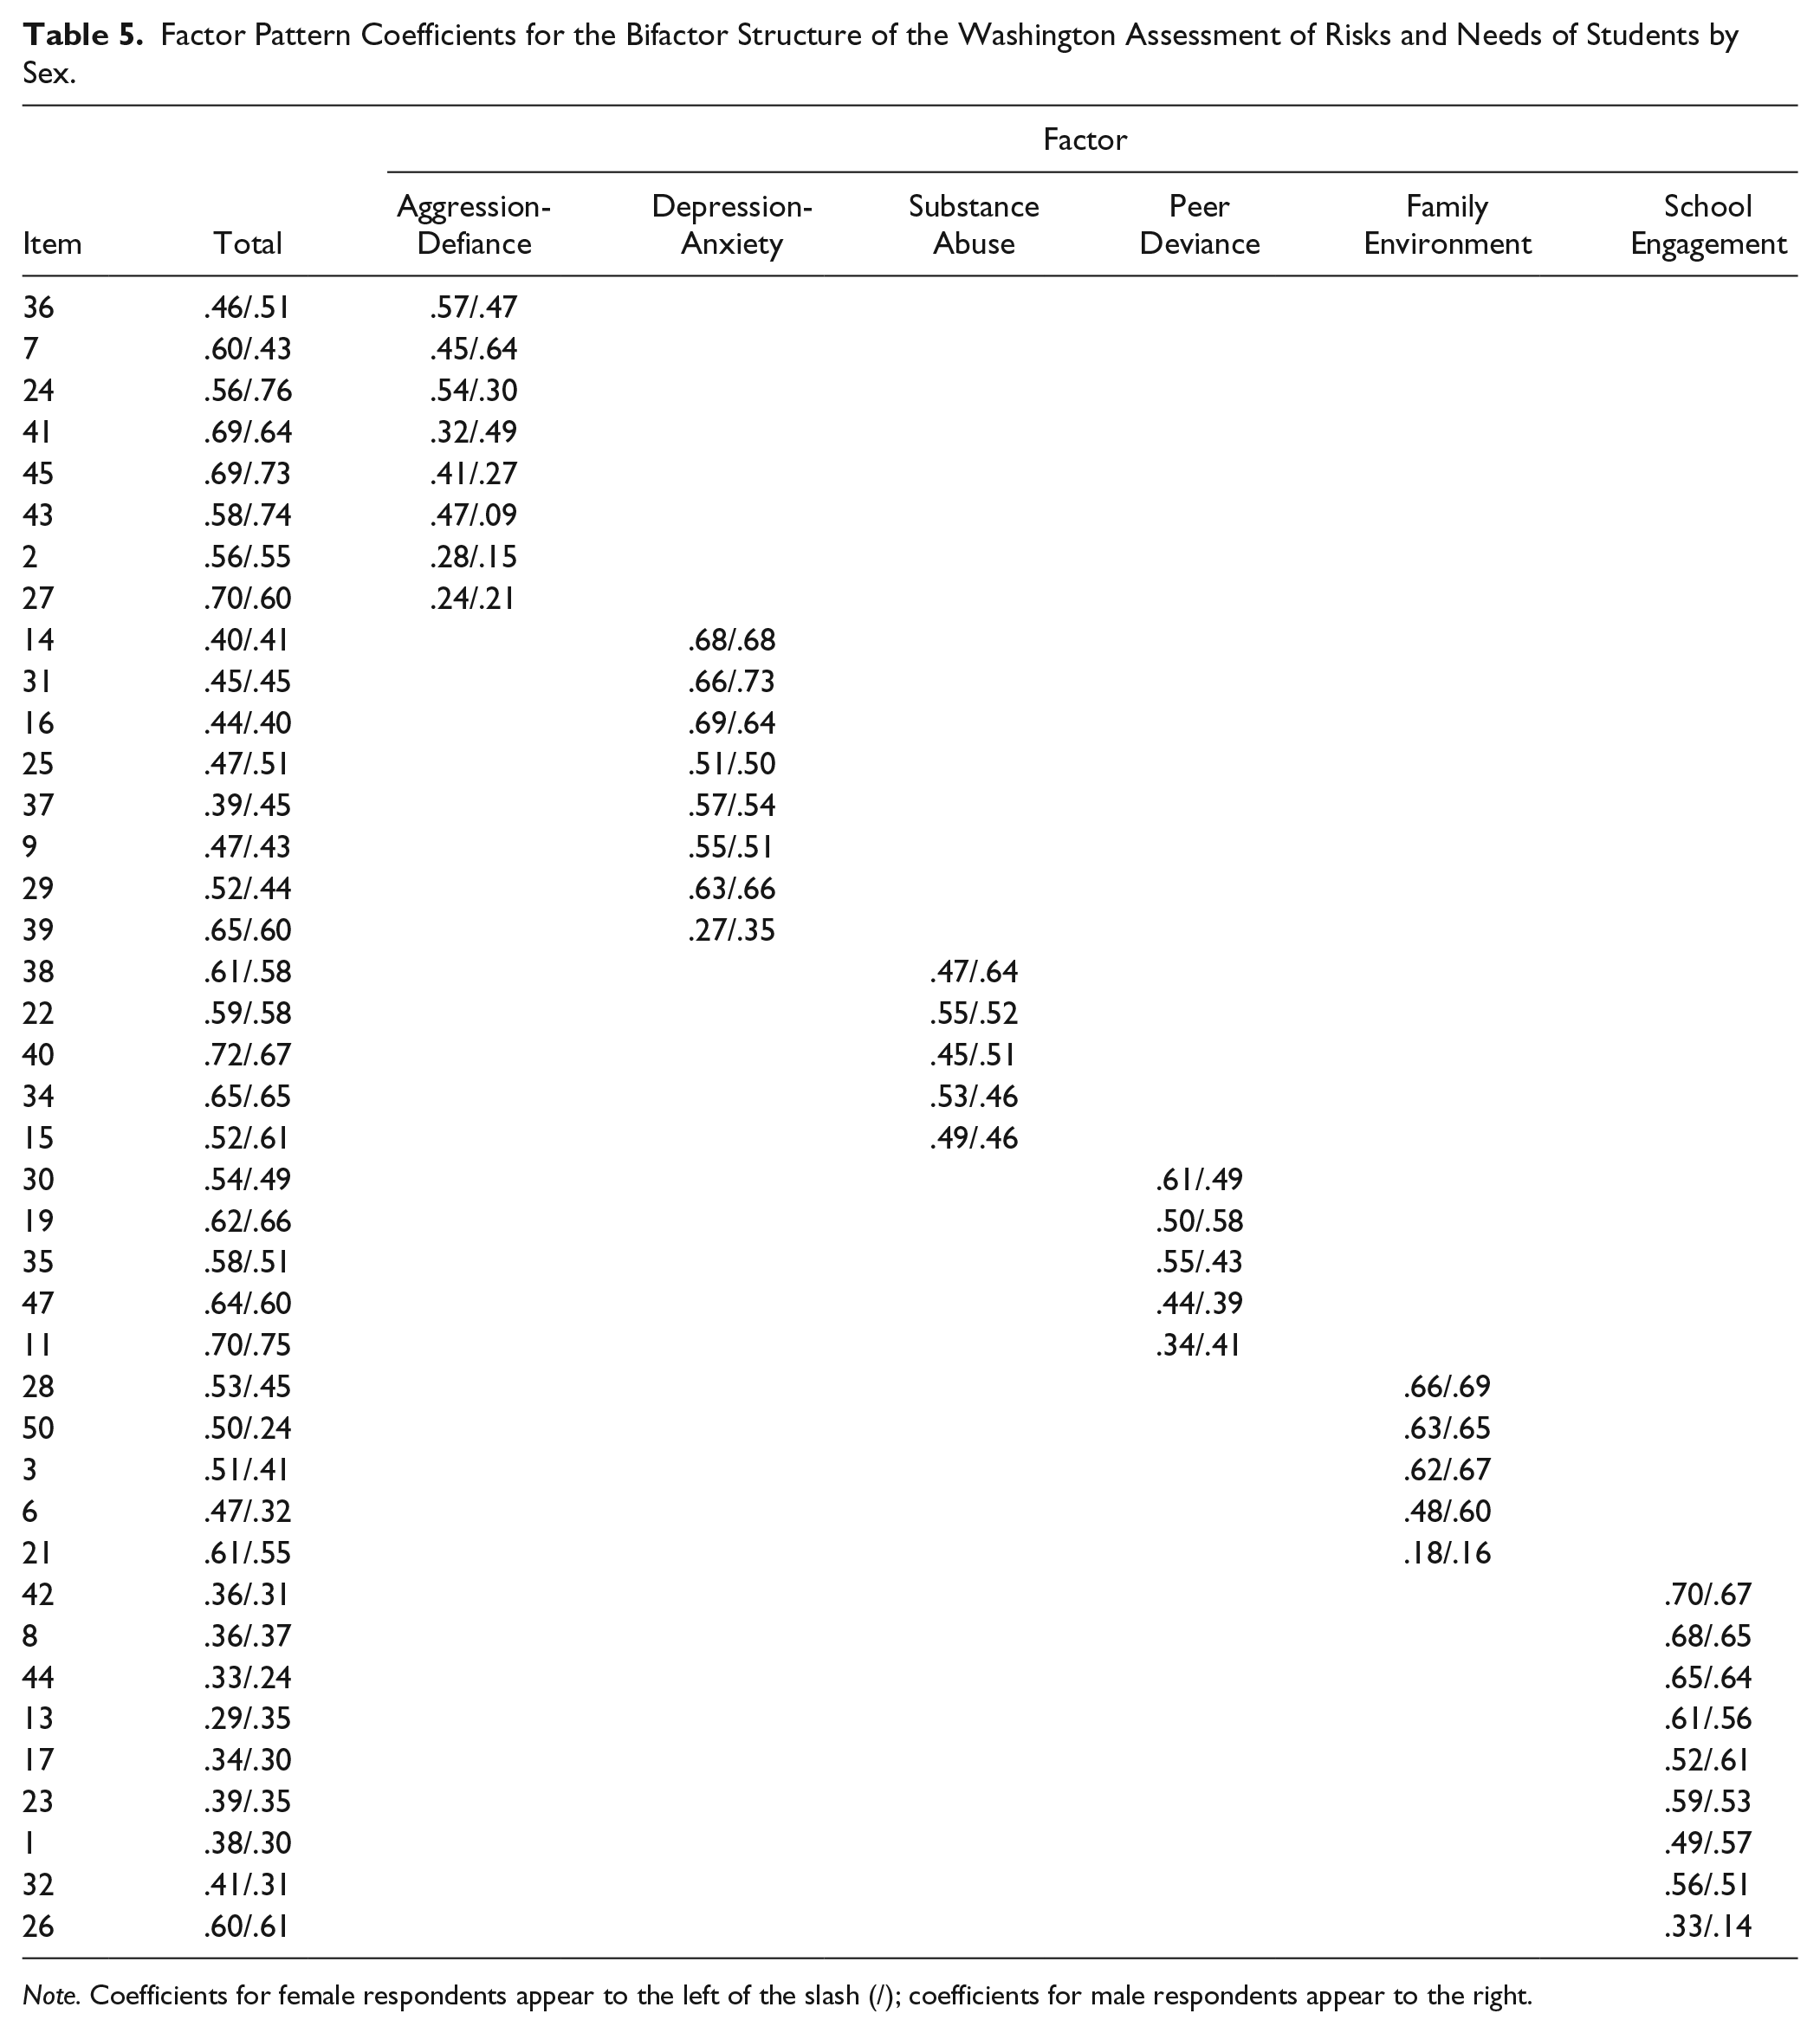
Note. Coefficients for female respondents appear to the left of the slash (/); coefficients for male respondents appear to the right.
Race/Ethnicity
Examination of model fit across race/ethnic groups revealed similar results as the examination of sex differences. In White/Caucasian–only and Hispanic/Latino–only samples, fit of the bifactor model met the stated criterion for CFI (Table 4). As before, testing was continued given that no model improvements were justified. The fully constrained model indicated factorial invariance as the criteria were satisfied. As with sex differences, the results provide evidence of invariance for the bifactor model. Reliability estimates across race/ethnicity were comparable for all six domains (Table 3). Ethnicity-specific factor pattern coefficients were mostly consistent with the results observed in the full sample (Table 6). Items 37 (“I got so nervous I felt sick, had trouble breathing, or felt shaky”) and 15 (“I got sick, passed out, or couldn’t remember what happened because of alcohol or drugs”) demonstrated stronger association with the specific factors, Depression-Anxiety and Substance Abuse, respectively, among White/Caucasian respondents compared to Hispanic/Latino respondents.
Factor Pattern Coefficients for the Bifactor Structure of the Washington Assessment of Risks and Needs of Students by Ethnicity.
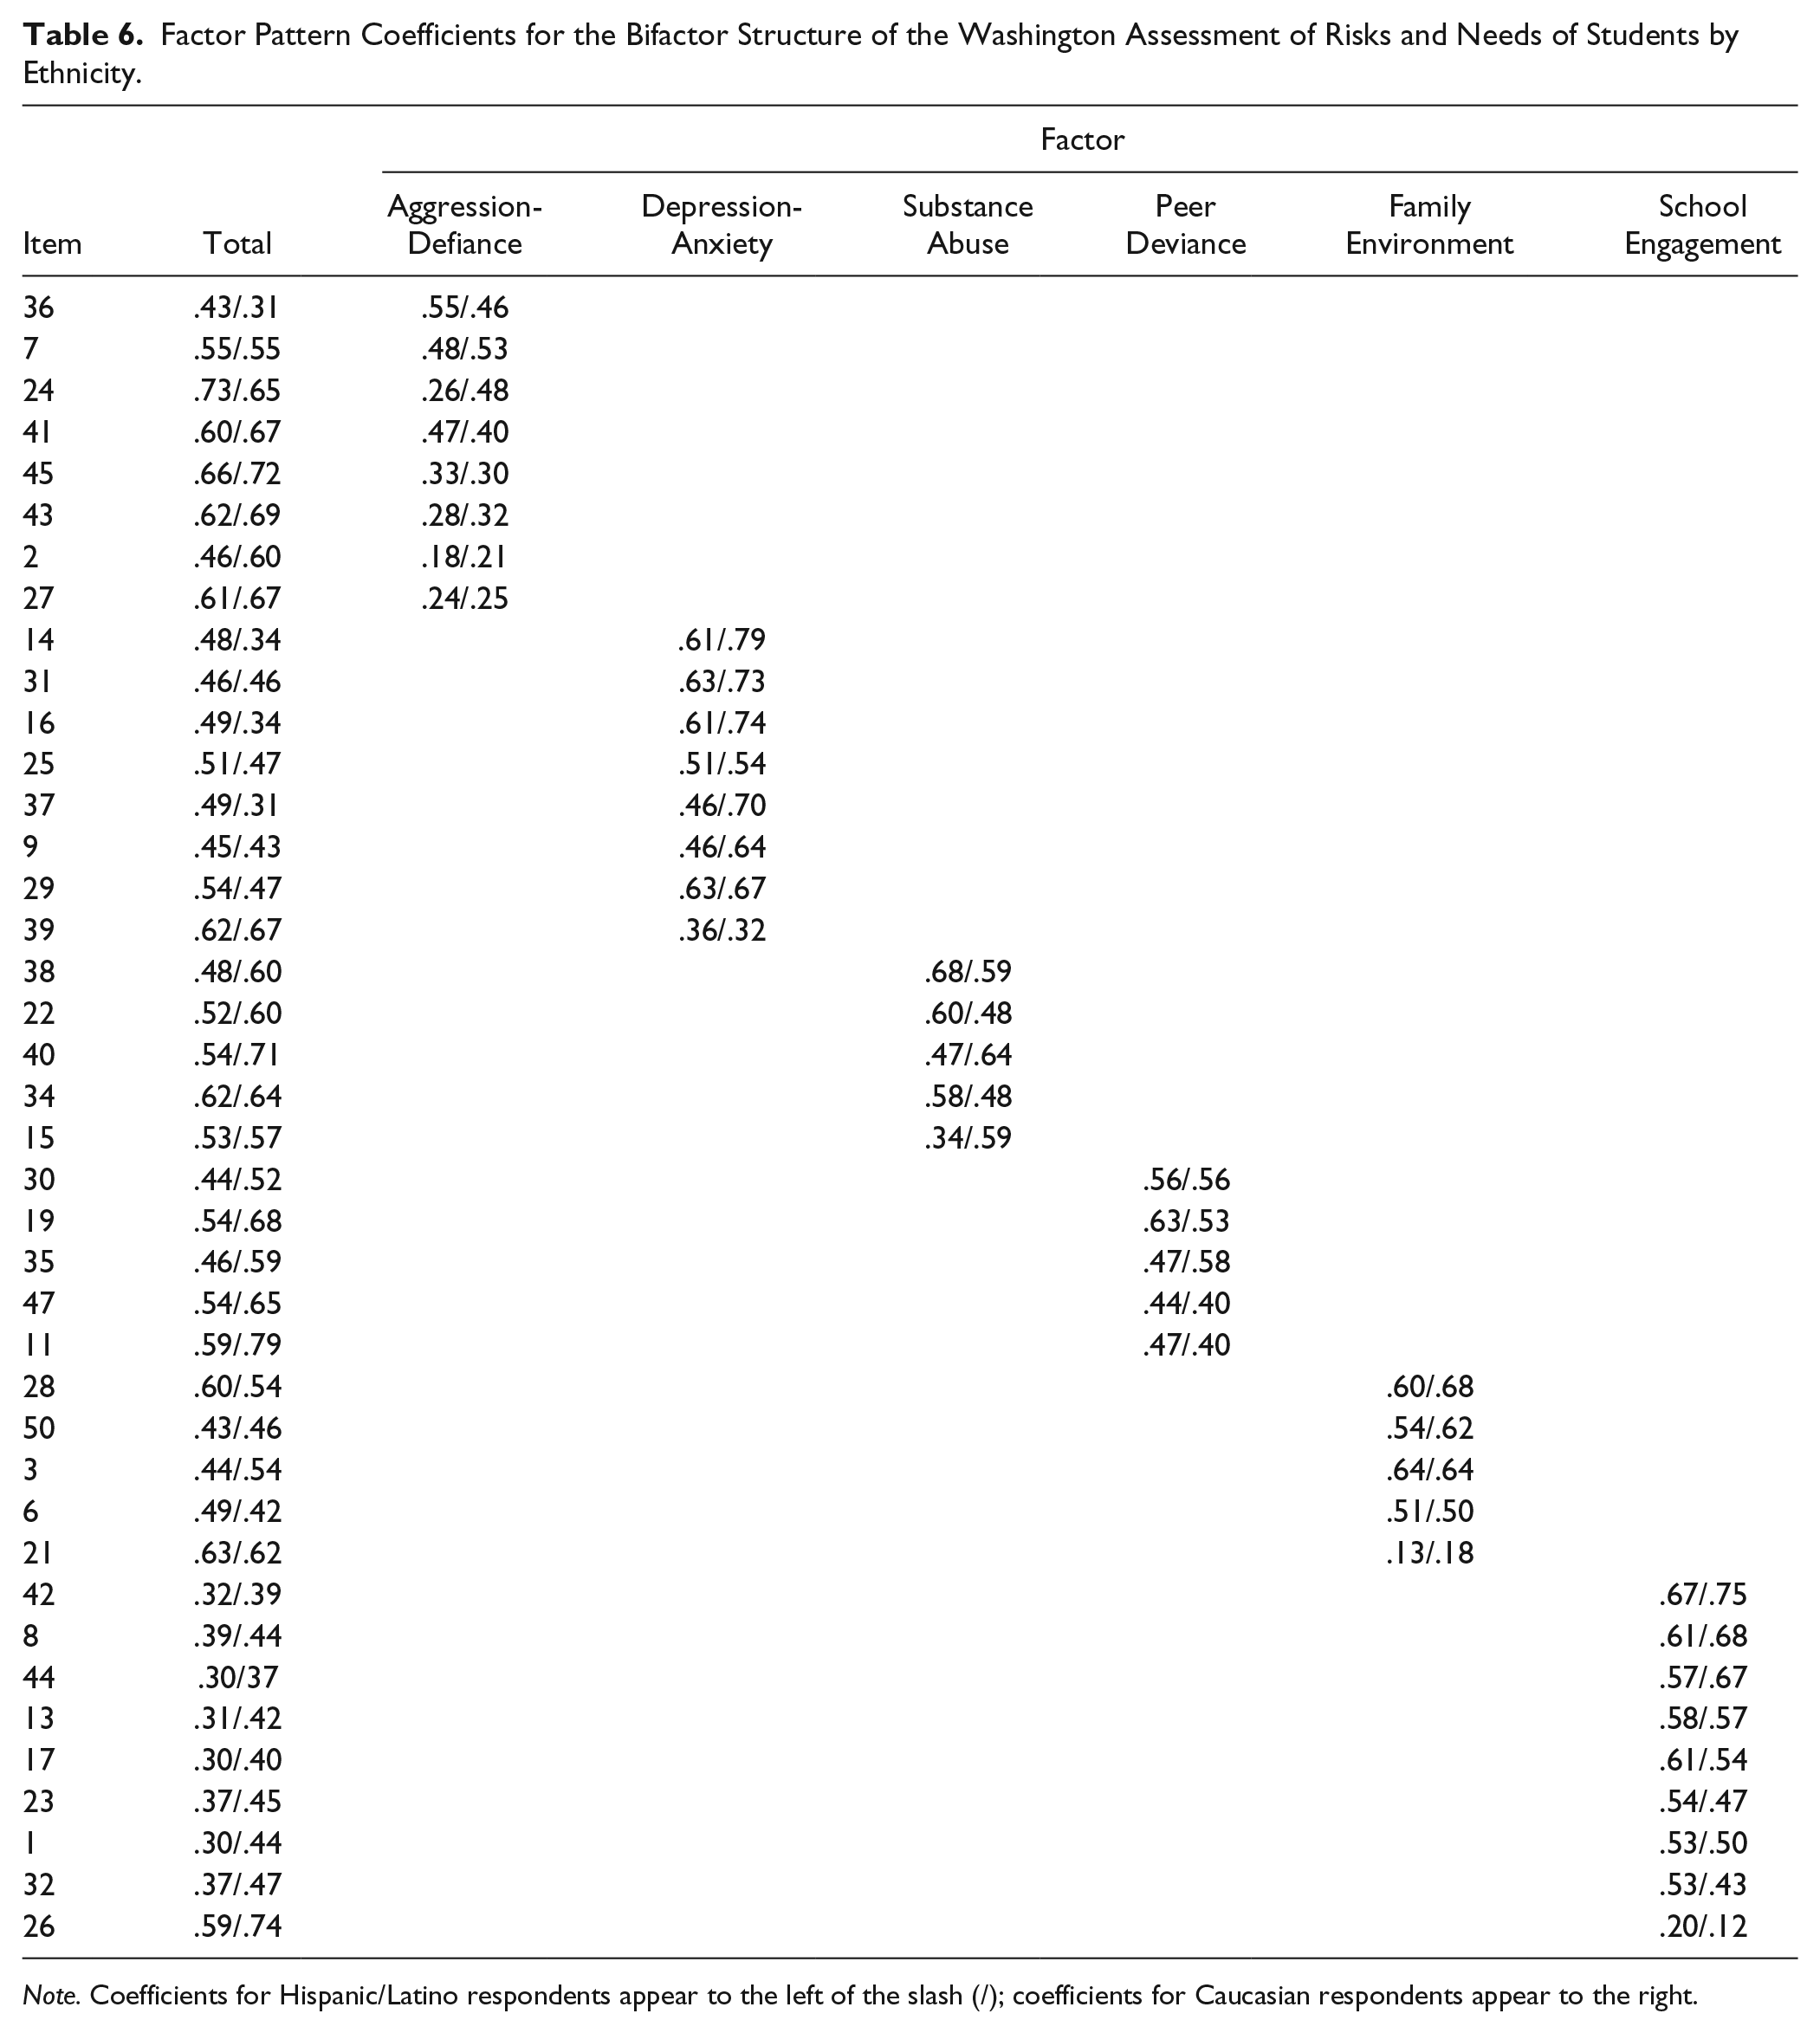
Note. Coefficients for Hispanic/Latino respondents appear to the left of the slash (/); coefficients for Caucasian respondents appear to the right.
Discussion
This study investigated the factor structure and the extent of factor–structure invariance in responses to the WARNS from a sample of target population youth. While the bifactor model advocated in the test manual (George et al., 2015) demonstrates potential slight degrees of misfit, multiple-group confirmatory factor analyses presented here suggest that no meaningful loss of fit occurs as a result of constraining parameters across respondent categories of sex (i.e., female and male) or race/ethnicity (i.e., White/Caucasian and Hispanic/Latino). Thus, this study provides support for claims of factorial invariance in the WARNS across these groups with some hints at items that could use revision or at least content review.
The results of the CFA support a bifactor model. Consistent with Farrington (2003), these results suggest the existence of a general risk and needs factor that accounts for much of the covariance among variables. After controlling for the general factor, there remains variance to be explained by the domain-specific factors. This situation is evident in the parameter estimates where there are high loadings on the general factor while each domain-specific factor largely has acceptable loadings. This model allows for the examination of how the domain-specific factors relate to external variables while holding the general factor constant. That is, a person’s response to a given item on the scale depends on his or her ability on the single risk and needs factor as well as the domain-specific factors. This situation allows for exploration of how these domain factors differ among groups or offer predictive value while accounting for general risk and needs. Such advantages of the bifactor model over other models (e.g., second-order) have been documented (e.g., Chen et al., 2005).
Therefore, for empirical, theoretical, and practical use reasons, the bifactor model appears most appropriate at this time for the WARNS. Relatedly, in our review of the literature we found no studies that explored bifactor model fit for instruments similar to the WARNS (e.g., the Problem Oriented Screening Instrument for Teenagers; Danseco, & Marques, 2002; National Institute on Drug Abuse, 2009). Therefore, the present study is perhaps the first to suggest the superiority of a bifactor model for the measurement of the array of risks and needs faced by adolescents at risk for school failure and related outcomes. As such, future studies should be conducted that similarly explore the fit of bifactor models with this and other instruments, extending that work to examination of fit across different populations.
The findings of the present study have important implications for the use of the WARNS. Specifically, outcomes support the use of the instrument by school and court administrators to make decisions concerning educational planning and placement of students who have been court-petitioned. Support for the six specific factors is in accord with current use of the domain scores to target major (e.g., substance abuse) issues with youth via focused interventions (Strand & Lovrich, 2014). Further evidence that scores function similarly across the studied groups can support comparison of youth across these groups with respect to their total and domain-level scores. However, we recommend multiple sources of information about a youth’s situation to support any decision that would carry high stakes for him or her.
As noted previously, none of the subscale items contain enough true score variance to be viewed as stable measures of these specific domains, independent of the general factor. However, per recommendations (Reise, Bonifay, & Haviland, 2013), a minimum ωHS of .50 for specific factors in a bifactor model may support the usefulness of those scores, independent of the general factor. Two subscales (i.e., Depression-Anxiety and School Engagement) met this criterion for the full sample and all four subsamples, and a third subscale (Family Functioning) met the criterion for the full sample and males. These three subscales are not primary components of externalizing psychopathology, in contrast to the other three subscales (Aggression-Defiance, Substance Use, and Peer Deviance; Forbes, Tackett, Markon, & Krueger, 2016). Therefore, our results suggest that more of the common variance for indicators of externalizing pathology is accounted for by the general factor compared to nonexternalizing indicators.
Future work would need to gather additional evidence to support this claim, including examining the generalizability of results across new samples. Indeed, a limitation of the present study is that the sample includes only court-referred youth, leaving unanswered questions about the factor structure of the instrument with a typical sample. However, this finding is in accord with other domains and populations where a bifactor model is appropriate (e.g., disruptive behavior; Burns, de Moura, Beauchaine, & McBurnett, 2014) and is consistent with an emerging conceptual model of psychopathology that reveals interrelated constructs of internalizing and externalizing pathology wherein aggression, substance use, and peer deviance are the strongest contributors to school problems and court involvement (Forbes et al., 2016).
Conclusion
Overall, results support using the WARNS as a global screening assessment of risk and needs. Subscales on the WARNS may be used for identification of specific areas of risk and need, but users should focus their decisions on the total score derived from the instrument. The factor analyses, reliability estimates, and factorial invariance provide pieces of evidence supporting inferences to be drawn from the use of the WARNS to assist youth to remain on a path of positive outcomes. Despite the need for additional evidence to support score use, the measurement of the constructs relating to risks and needs is promising for targeting and tracking factors important to the short- and long-term success of youth.
Footnotes
Declaration of Conflicting Interests
The author(s) declared no potential conflicts of interest with respect to the research, authorship, and/or publication of this article.
Funding
The author(s) received no financial support for the research, authorship, and/or publication of this article.