
Abstract
To assess the psychometric properties of the Italian translation of the 100-item short form of the Personality Inventory for DSM-5 (PID-5-SF), 2,143 community-dwelling adults (59.6% female), and 706 adult clinical participants (52.4% female) were administered the Italian translation of the PID-5. Clinical participants were also administered the Structured Clinical Interview for DSM-IV (SCID-II), and the Personality Diagnostic Questionnaire-4+ (PDQ-4+). Item response theory analysis showed that all proposed PID-5-SF items showed adequate item discrimination parameters in both community-dwelling adults and clinical adults. All PID-5-SF trait scales showed satisfactory internal consistency estimates. PID-5-SF five-factor structure closely matched the factor structure of the PID-5 in both community-dwelling participants and clinical participants and was invariant across the two samples that participated in this study. Moreover, the factor structure of the PID-5-SF closely replicated the factor of the PID-5-SF that was originally reported in Maples et al.’s study. In our clinical sample, dominance analysis results showed that PID-5-SF scales explained a nonnegligible and significant amount of variance in both SCID-II and PDQ-4+ ratings of selected DSM-5 Section II personality disorder, and the use of the PID-5-SF did not result in a substantial loss of information as compared with the original PID-5.
Evidence indicates that personality disorder (PD) categories in use since the third edition of Diagnostic and Statistical Manual of Mental Disorders (DSM-III; American Psychiatric Association [APA], 1980) are plagued by a number of problems, such as lack of empirically validated cutoffs, extensive comorbidity, and temporal instability (Widiger & Trull, 2007). To overcome these difficulties, DSM-5 (APA, 2013a) provided in Section III an alternative model of personality disorder (AMPD), along with traditional PD diagnoses listed in DSM-5 Section II (which reprints DSM-IV [APA, 1994] axis II PD symptom criteria). A key aspect of the DSM-5 AMPD is an empirically based model of maladaptive personality domain and traits (Krueger & Markon, 2014), which synthesizes existing dimensional models of personality dysfunctions, focused on maladaptive variants (e.g., Clark, 2007). The AMPD comprises five major domains of maladaptive personality—namely, Negative Affectivity (frequent and intense experiences of high levels of a wide range of negative emotions), Detachment (avoidance of socioemotional experience), Antagonism (behaviors that put the individual at odds with other people), Disinhibition (orientation toward immediate gratification and impulsive behavior), and Psychoticism (a wide range of culturally incongruent odd, eccentric, or unusual behaviors and cognition). These domains may be articulated into 25 specific maladaptive personality traits (e.g., Anxiousness, Depressivity, Attention Seeking, Risk Taking, Eccentricity, etc.), which represent specific aspects of each general maladaptive domain (APA, 2013a; Krueger & Markon, 2014).
Based on DSM-5 AMPD, Krueger, Derringer, Markon, Watson, and Skodol (2012) developed the Personality Inventory for DSM-5 (PID-5); the PID-5 is a 220-item self-report questionnaire with a 4-point response scale; it yields 25 trait scales that can be combined to also delineate 5 domain scales (Negative Affectivity, Detachment, Antagonism, Disinhibition, and Psychoticism). The PID-5 has been translated and validated in a number of languages, including Italian (Fossati, Krueger, Markon, Borroni, & Maffei, 2013). Moreover, PID-5 domains are said (APA, 2013a) to be aligned with the five-factor model of personality, and PID-5 traits can be well understood as a maladaptive extension of the five-factor model of personality (e.g., Suzuki, Samuel, Pahlen, & Krueger, 2015).
The PID-5 has been well researched, and an increasing amount of studies showed the adequacy of its psychometric properties (e.g., Bach, Sellbom, & Simonsen, 2017), including the convergence with existing personality instruments (e.g., Anderson et al., 2013; Gore & Widiger, 2013; Griffin & Samuel, 2014; Thomas et al., 2013; A. G. C. Wright & Simms, 2014), and expected associations with broadly conceptualized clinical constructs (e.g., Dunne, Gilbert, & Daffern, 2017). However, it is also worth noting that some studies have shown possible issues with discriminant validity (e.g., Gore & Widiger, 2013). In their seminal study, Crego, Gore, Rojas, and Widiger (2015) focused specifically on the discriminant validity of the PID-5 in three independent samples. Crego et al.’s (2015) findings showed that cross-domain correlation was consistently highest for Psychoticism, albeit Negative Affectivity correlated substantially with Detachment. Moreover, in line with previous findings (Quilty, Ayearst, Chmielewski, Pollock, & Bagby, 2013; Watson, Stasik, Ro, & Clark, 2013), problematic discriminant validity was evident for some PID-5 scales (e.g., Anxiousness, Manipulativeness, Withdrawal, Impulsivity), whereas it was generally good for some of the PID-5 scales (e.g., Restricted Affectivity, Hostility) with respect to their relationship with the five measures of general personality structure (Crego et al., 2015).
Thus, while the PID-5 showed a number of advantages in both research (e.g., Z. E. Wright, Pahlen, & Krueger, 2017) and clinical context (e.g., Bach, Markon, Simonsen, & Krueger, 2015), further studies on its psychometric properties are needed (Al-Dajani, Gralnick, & Bagby, 2016). From this perspective, its length may represent a source of concern in some circumstances (Maples et al., 2015)—for instance, when the PID-5 is used in a much larger assessment protocol or when only the five major domains are of interest, as may be the case in screening for general personality dysfunction. Interestingly, a brief form of the PID-5 (PID-5-BF), has been made available to researchers and clinicians (APA, 2013b). As a screening measure for personality pathology, the PID-5-BF has several potentially attractive features. The PID-5-BF assesses the five AMPD domains including Negative Affectivity (NA), Detachment (De), Antagonism (A), Disinhibition (Di), and Psychoticism (Ps), with each domain scale consisting of five items. Different from other versions of the PID-5, the PID-5-BF yields a score for the overall measure that indexes the subject’s overall level of personality dysfunction; the higher the PID-5-BF total score, the higher the overall level of personality dysfunction (APA, 2013b). Several studies documented the psychometric properties of the PID-5-BF in different cultural contexts and age ranges (e.g., Anderson, Sellbom, & Salekin, 2016; Bach, Maples-Keller, Bo, & Simonsen, 2016; Debast, Rossi, & van Alphen, 2017; Fossati, Somma, Borroni, Markon, & Krueger, 2015).
Notwithstanding these attractive features, the PID-5-BF does not allow for facet-level assessment. This consideration prompted the development of forms of the PID-5 that are markedly shorter than the 220-item version of the scale, while allowing at the same time for maladaptive trait assessment. Recently, Maples et al. (2015), through the use of item response theory (IRT) methods proposed a 100-item version of the PID-5 (PID-5-SF) to score the DSM-5 domains and facets. The PID-5-SF resulted in nearly identical reliability and validity and similar nomological networks with the PID-5. Maples et al. (2015) estimated IRT parameters assuming Samejima’s (1997) graded response model and selected the four PID-5 items that had the highest discrimination parameters while also closely monitoring the test information function (TIF). The resulting four-item trait scales showed good internal consistency, as demonstrated by both coefficient alphas and mean interitem correlations (MICs); moreover, a five-factor structure proved to be adequate both for the original and reduced PID-5 scales. In terms of external correlates, the PID-5-SF demonstrated a nearly identical correlational profile with the original PID-5 across a wide range of external criteria, including FFM domains and facets, DSM-5 Section II PD scores, and internalizing and externalizing outcomes (Maples et al., 2015).
We are aware of three studies (Bach et al., 2016; Díaz-Batanero, Ramírez-López, Domínguez-Salas, Fernández-Calderón, & Lozano, 2017; Thimm, Jordan, & Bach, 2017) that evaluated the psychometric properties of the PID-5-SF outside the United States. As a part of a larger study, Bach et al. (2016) examined and compared features of the PID-5 and Short PID-5-SF in a large Danish mixed sample to investigate whether the reliability and validity of the 100-item short version of the PID-5 replicates cross-culturally. Bach et al. (2016) found that PID-5-SF reliability and factorial validity were satisfactory; moreover, the correlational profiles of the PID-5-SF with clinician-rated PD dimensions were nearly identical with that of the original PID-5. Extending previous research on the PID-5-SF in Norway, Thimm et al. (2017) investigated the psychometric properties of the Norwegian PID-5-SF by showing adequate reliability, factor structure, as well as expected and meaningful associations with normal FFM traits and personality beliefs associated with the DSM-IV/DSM-5 Section II PD categories. Finally, Díaz-Batanero et al. (2017) showed that the psychometric properties (e.g., internal consistency, test–retest reliability) of the Spanish PID-5-SF were adequate in a sample of 282 dual diagnosis patients.
Notwithstanding these encouraging findings, to our knowledge the IRT analyses of the PID-5 items that lead to the development of the PID-5-SF have not been replicated yet in non-U.S. samples. The actual cross-cultural invariance of the item selection process seems to represent a crucial issue in showing the cross-cultural stability of the PID-5-SF. Similarly, no replication of PID-5-SF IRT analyses have been carried out in clinical participants; of course, evidence of invariance of IRT findings (as well as of the other psychometric properties) concerning the PID-5-SF across clinical samples and nonclinical samples would be highly desirable since the PID-5/-SF has been designed to assess maladaptive personality traits and domains in clinical participants for clinical decision making.
Starting from these considerations, we designed the present study to evaluate the cross-cultural stability of the basic psychometric properties of the Italian translation of the PID-5-SF in a large sample of community-dwelling adult participants and in a large sample of clinical adult participants, who were administered the Italian translation of the PID-5. In particular, we aimed at (a) Evaluating the invariance of IRT findings in terms of identifying the four best discriminating items in each PID-5 scale, while closely monitoring the TIF (Maples et al., 2015); (b) testing the internal consistency reliability of the PID-5-SF scales, while formally comparing the Cronbach’s alpha coefficient values for the PID-5-SF trait scales with the alpha coefficient values for the corresponding PID-5 trait scales; (c) assessing the replicability of the factor structure of the PID-5-SF trait scales, as well as its convergence with the factor structure of the PID-5 trait scales in our samples and with the PID-5-SF factor structure that was reported in Maples et al.’s (2015) study, as well as in Bach et al.’s (2016) study and in Thimm et al.’s (2017) study 1 ; (d) comparing the efficiency of the PID-5-SF trait scale scores with PID-5 trait scale scores among clinical adult participants in predicting both self-reports and interview-based scores for dimensionally assessed personality disorder (PD) diagnoses. We considered only the six PD diagnoses presented in DSM-5 Section III because we were interested in specific maladaptive trait profiles listed in DSM-5 AMPD. For each PD, we entered as predictors in the regression models only the PID-5-SF and PID-5 trait scales that were designed to measure the corresponding traits that were included in the specific DSM-5 AMPD trait profile. In the present study, we relied on DSM-IV/DSM-5 Section II PD diagnostic criteria to assess Antisocial PD, Avoidant PD, Borderline PD, Narcissistic PD, Obsessive–Compulsive PD, and Schizotypal PD.
Method
Participants
Sample 1
Participants were 2,191 Italian community-dwelling adult participants (59.6% female; 40.4% male, mean age = 37.01 years, standard deviation [SD] = 14.30 years) recruited in train station waiting rooms, public libraries, San Raffaele Hospital outpatient waiting rooms (excluding neurology and psychiatry waiting rooms), and general practitioner’s outpatient waiting rooms in Milan during several occasions from winter 2011 to winter 2014. These sampling facilities were chosen because they were thought (a) to be attended by largely unselected community-dwelling adults and (b) people had time enough to fill a battery of personality measures. Forty-eight participants (2.2%) did not yield complete questionnaires. Questionnaires were considered incomplete if more than 10% of the items in any given scale were not answered. Participants with incomplete questionnaires were excluded from the final sample. According to Little MCAR (missing completely at random) test results, missing values were completely at random, χ2(722) = 671.74, p > .90. Participants who did not yield a complete questionnaire did not significantly differ from participants who yielded complete questionnaires on mean age, t(2189) = 0.50, p > .60, d = 0.07, gender, χ2(1) = 0.00, p > .90, ϕ = .00, civil status, χ2(3) = 0.29, p > .90, Cramér’s V = .01, and education level, χ2(2) = 0.80, p > .60, Cramér’s V = .02.
The final sample was composed of 2,143 nonclinical adult volunteers; 1,277 participants (59.6%) were female and 866 participants (40.4%) were male; participants’ mean age was 36.75 years, SD = 14.12. Nine hundred fifty-two (44.4%) participants were unmarried, 1,087 (50.7%) were married, 89 (4.2%) were divorced, and 8 (0.4%) were widowed; seven participants (0.3%) refused to disclose their civil status. Three hundred three (14.1%) participants had junior high school degree, 1,116 (52.1%) had high school degree, 718 (33.5%) had a university degree; six (0.3%) participants did not report his or her school degree.
Official Italian census data from the National Institute of Statistics of Italy (ISTAT; retrieved from http://dati.istat.it/#) showed that in 2016, 51.4% of the Italian population were female and 48.6% were male; Italian population subjects’ mean age was 44.7 years; 18.5% of the subjects had a primary school degree, 32.4% participants had junior high school degree, 35.8% had high school degree, and 13.3% had a university degree. Thus, our Sample 1 was composed of a slightly higher percentage of female, χ2(1) = 57.19, p > .001, ϕ = .01, and a higher percentage of participants who obtained a university degree in association with a lower percentage of participants who had a primary school degree or a junior high school degree, χ2(3) = 11969.00, p < .001, Cramér’s V = .02. However, it is noteworthy that our Sample 1 was composed by nonclinical adult volunteers who received no incentive for participating in the present study. Bearing in mind these considerations and data, Sample 1 was large, demographically heterogeneous, and it may be considered as fairly representative of the Italian population.
Four existing data sets were used in this study (Fossati, Borroni, Somma, Markon, & Krueger, 2016; Fossati et al., 2013; Fossati, Krueger, et al., 2015; Fossati, Somma, Borroni, Maffei, et al., 2015). However, those previous reports did not include IRT analyses of PID-5/-SF items and the current results represent a novel use of the data.
Sample 2
The sample was composed of 706 participants who were consecutively admitted to the Clinical Psychology and Psychotherapy Unit of the San Raffaele Hospital of Milan, Italy, from winter 2011 to winter 2016. Although these participants were part of a larger sample whose data were previously published (Fossati, Somma, Borroni, Maffei, et al., 2015; Fossati, Somma, Borroni, Markon, & Kruger, 2015), the current results represent a completely novel use of the data.
A total of 370 (52.4%) participants were female and 336 (47.6%) were male; participants’ mean age was 40.33 years, SD = 13.14 years. Two hundred and thirty (32.6%) participants were inpatients, and 476 (67.4%) were outpatients. Three hundred and ninety (55.2%) participants received at least one DSM-IV Axis I diagnosis; in this sample, mood disorders (n = 154, 21.9%) were the most frequently diagnosed DSM-IV Axis I diagnosis. Psychiatric disorder diagnoses were assessed by the clinicians who were following the participants in treatment or by trained clinical psychologists during their initial assessment interviews; since psychiatric disorder diagnoses were not assessed using standardized interviews and were not the focus of this research, they were used only for descriptive purposes in the current study.
All participants were admitted to the Clinical Psychology and Psychotherapy Unit in order to receive psychotherapy treatment for interpersonal difficulties and/or problems with behavior and emotional regulation on a strictly voluntary basis; inpatient participants were referred to the Unit by the clinicians who were following them in treatment. 2 Potential participants were screened for the following exclusion criteria: (a) not being an Italian native speaker; (b) age less than 18 years; (c) education level lower than elementary school; (d) IQ less than 80; (e) diagnosis of schizophrenia, schizoaffective disorder, schizophreniform disorder, or delusional disorder according to DSM-IV diagnostic criteria; (f) diagnosis of dementia or organic mental disorder according to DSM-IV diagnostic criteria; and (g) absence of acute symptom remission from other psychiatric disorders. All participants in the current research passed this screening procedure.
Procedures
In the present study, all measures were administered to participants in their Italian translations (Fossati et al., 1998; Fossati et al., 2013; Maffei et al., 1997). All participants volunteered to take part in the study after being presented with a detailed description and all were treated in accordance with the Ethical Principles of Psychologists and Code of Conduct. Both Sample 1 and Sample 2 participants were asked to sign a written informed consent form to take part in the study. None of the participants received an incentive, either directly or indirectly for participating, and Sample 2 participants were administered all measures as part of their routine clinical assessment. All participants were at least 18 years old at the time the study was carried out.
In Sample 2, SCID-II interviews were carried out blind to PID-5, PID-5-SF, and Personality Diagnostic Questionnaire-4+ (PDQ-4+) scores, and all self-report questionnaires were administered and scored blind to SCID-II interview scores. The order of measure administration was randomized.
Measures
Sample 1 and Sample 2 Measures
Personality Inventory for DSM-5
The PID-5 (Krueger et al., 2012) is a 220-item questionnaire with a 4-point response scale (0 = very false or often false to 3 = very true or often true), which was explicitly designed to measure the proposed DSM-5 traits. Seventeen (approximately 8%) of 220 items are reverse coded; the majority of the items reflect greater levels of personality pathology. PID-5 items are summed to compose PID-5 trait scale scores; then, PID-5 trait scales are summed to generate PID-5 domain scale scores. Each PID-5 item is scored on only one PID-5 trait scale. The PID-5 has 25 primary scales that load onto five higher order dimensions (Krueger et al., 2012), and this structure is replicable (Krueger & Markon, 2014). The reliability and construct validity of the Italian translation of the PID-5 in nonclinical adult participants have been recently published (Fossati et al., 2013).
Sample 2 Measures
Structured Clinical Interview for DSM-IV Axis II Personality Disorders (SCID-II), Version 2.0
The SCID-II (First, Spitzer, Gibbon, Williams, & Benjamin, 1994) is a 140-item semistructured interview designed to provide both a categorical and dimensional (i.e., number of symptoms) assessment of DSM-IV personality disorders (PDs). The SCID-II was preceded by administration of its self-report screening questionnaire (PQ). The validity of the PQ as a measure for screening PD psychopathology has been previously reported (Richman & Nelson-Gray, 1994), and SCID-II enables direct probing of negative PQ answers when this is considered clinically relevant (First et al., 1994). Although the SCID II was developed to asses DSM-IV axis II PDs, we considered it as a measure of DSM-5 Section II PDs because the PD diagnostic criteria which are listed in the DSM-5 Section II were retained with no changes from the DSM-IV axis II (APA, 2013a). Moreover, only the SCID-II scores for the six PDs that were retained also in the DSM-5 AMPD (i.e., Antisocial PD, Avoidant PD, Borderline PD, Narcissistic PD, Obsessive–Compulsive PD, and Schizotypal PD) were considered in the present study. The interrater reliability and internal consistency of the Italian translation of the SCID-II in clinical participants were assessed in a previous study (Maffei et al., 1997).
Since 10 expert clinical psychologists trained in administering the SCID-II participated in the present study, we used a pairwise interview design to assess the interrater reliability of the SCID-II diagnoses. In the present study, the interrater reliability of SCID-II diagnoses was assessed on the first 150 (21.2%) consecutively admitted participants. For each of the first 150 participants, two interviewers were randomly extracted and assigned the role of interviewer and independent rater, respectively; each clinical psychologist acted the same number of times as interviewer or independent rater. In the present study, the intraclass correlation coefficient (ICC) value for the overall number of SCID-II criteria was .91, p < .001. The ICC values for the individual SCID-II PD dimensional counts ranged from .70 (Schizotypal PD) to .98 (Borderline PD), median ICC = .92, SD = .08, all ps < .001. The chance-corrected agreement (i.e., Cohen’s κ coefficient value) on any PD diagnosis was .91, p < .001, whereas a Cohen’s κ value of .85, p < .001 was observed for SCID-II Mixed PD diagnosis.
Personality Diagnostic Questionnaire-4+
The PDQ-4+ (Hyler, 1994) is a self-report questionnaire with 99 true/false items, which represents a completely revised version of PDQ and PDQ-R self-report questionnaires and is designed to measure the 10 PDs included in DSM-IV Axis II and the two PDs (passive–aggressive and depressive) proposed for further research. The translation procedure, internal consistency reliability estimates, and construct validity of the PDQ-4+ scales in Italian adult clinical participants were previously published (Fossati et al., 1998). In the present study, we considered only the PDQ-4+ scale scores of the six PDs that were retained also in the DSM-5 AMPD; moreover, we computed PDQ-4+ total score summing only the 79 items that are included in the PDQ-4+ scales that measure the 10 DSM-5 Section II PDs.
In the present study, the Cronbach α values of the PDQ-4+ PD scales ranged from .61 (obsessive–compulsive PD; average interitem polychoric r [MIC] = .17) to .87 (avoidant PD; MIC = .48), median α = .80 (median MIC = 0.31), SD = .10 (.12). The Cronbach α value for the PDQ-4+ total score was .95 (MIC = .21).
Data Analyses
The Cronbach α coefficient was used to evaluate PID-5/PID-5-SF trait and scales internal consistency reliability. Since the Cronbach α coefficient reflects both scale length and item intercorrelation, for PID-5/PID-5-SF trait and domain scales average interitem r (
Following Maples et al. (2015), in the present study the graded response model (Samejima, 1969, 1997) was used as the item response model in both community-dwelling adults and clinical adults; indeed, it has often been found useful for questionnaire data collected using Likert-type scales (e.g., Samuel, Simms, Clark, Livesley, & Widiger, 2010). To enable comparison with PID-5-SF validation study (Maples et al., 2015), goodness-of-fit of unidimensional IRT models was evaluated using root mean square error of approximation (RMSEA). Although the generalizability of structural equation modeling fit benchmarks to an IRT context may be questionable (e.g., Reise & Rodriguez, 2016), limited Monte Carlo data are available for RMSEA in IRT models (Cai & Hansen, 2013), and Maydeu-Olivares (2015) recently proposed RMSEA ⩽ 0.089 for adequate model fit, RMSEA2 ⩽ 0.050 for close fit, and RMSEA ⩽ 0.050/(k − 1), where k is the number of response alternatives, for excellent fit in polytomous item IRT factor analyses.
In the present study, to evaluate the factor structure of PID-5-SF and PID-5 trait scales we performed exploratory structural equation modeling (ESEM) analyses. ESEM combines exploratory factor analysis with structural equation modeling (Asparouhov & Muthén, 2009). ESEM requires the number of factors to be included in the model and allows free estimates of the cross-loadings for personality indicators in the context of the general structural equation modeling framework and to use targeted matrices for their specification (Marsh, Morin, Parker, & Kaur, 2014). Following current recommendations (Hopwood & Donnellan, 2010; McCrae, Zonderman, Costa, Bond, & Paunonen, 1996), target rotations at the original five-factor structure (Krueger et al., 2012; Maples et al., 2015) were used. In line with previous studies of the PID-5/-SF structure (e.g., Krueger et al., 2012; Maples et al., 2015), we used an oblique rotation allowing the factors to be correlated.
Based on these considerations and on Marsh et al.’s (2014) suggestions, ESEM analyses used the MLR estimator (Satorra & Bentler, 1988, 1994). Considering the multidimensional nature of fit assessment in structural equation models and the need for multiple fit indices (Tanaka, 1993), we used several measures to identify model fit, including the Satorra–Bentler scaled χ2 goodness-of-fit statistic (Satorra & Bentler, 2001), as well as Browne and Cudeck’s (1993) RMSEA, the Tucker–Lewis index (TLI), Bentler’s (1990) comparative fit index (CFI), and standardized root mean square residual (SRMSR). Following Hu and Bentler’s (1999) suggestions, TLI and CFI values ⩾.95 and RMSEA values close to .06 were considered as indicating good model fit, whereas TLI and CFI values of .90 and higher, and an RMSEA of .08 and lower are indications of an adequate fit. SRMSR values close to .08 were considered as indicating good model fit (Hu & Bentler, 1999).
ESEM analyses were carried out separately in Sample 1 and in Sample 2. The invariance of the ESEM model of PID-5-SF scales across Sample 1 and Sample 2 was formally assessed using multigroup MLR ESEM analyses; in particular, we tested the following invariance models: (a) a configural invariance model with an invariant factor loading pattern, (b) a metric invariance model in which factor loadings are invariant, and (c) a scalar invariance model with invariant factor loadings and intercepts (Muthén & Muthén, 1998-2012). In addition to the fit indices that were described above, we used also Schwartz Bayesian information criterion (BIC) as further index of model fit in invariance analyses.
Consistent with previous studies (e.g., Maples et al., 2015), in the present study we relied on Tucker’s congruence coefficient (CC; Lorenzo-Seva & ten Berge, 2006) to compare the ESEM structure of PID-5-SF trait scales with the ESEM structure of the PID-5 trait scales in Sample 1 participants and in Sample 2 participants, respectively. Next, we computed CCs to compare our PID-5-SF factor loading matrices with the factor loading matrix reported in Maples et al.’s (2015) study. After target rotation to the Maples et al. (2015) empirical loading matrix, Tucker’s CCs were calculated between our factor loadings matrices and the targeted structures reported in Bach et al.’s (2016) study, and in Thimm et al.’s (2017) study, respectively. Finally, we performed CC analysis to evaluate the replicability of PID-5-SF trait scale factor structure across Samples 1 and 2. A CC value of .90 is usually considered suggestive of matching factors (McCrae, Zonderman, Costa, Bond, & Paunonen, 1996); however, based on a Monte Carlo study result Lorenzo-Seva and ten Berge (2006) suggested that CC values in the range .85 to .94 correspond to a fair similarity, with values higher than .95 implying that the two factors compared can be considered equal.
In Sample 2, we performed dominance analyses to evaluate if PID-5-SF trait scales indexing the expected maladaptive trait profile–based DSM-5 AMPD Criterion B indicators for a given PD were significantly associated with the corresponding SCID-II and PDQ-4+ PD scales, respectively. Dominance analysis is a method for determining relative predictor importance when there is multicollinearity among a set of predictors (Azen & Budescu, 2003; Budescu, 1993); it is based on an examination of the R2 values for all possible subset models. In the present study, we relied on general dominance measures (e.g., Miller et al., 2017), that can be interpreted as the average difference in fit between all subset models (of equal size) that include each predictor and those that do not include it (Azen & Budescu, 2003).
Finally, for each multiple regression model, we formally compared the amount of information (i.e., proportion of variance explained) provided by the PID-5-SF trait scales with the amount of information provided by the corresponding PID-5 trait scales. Since dependent R2 values cannot be directly compared, for each multiple regression model multiple-R values were computed; then, multiple-R values based on PID-5-SF trait scales and PID-5 trait scales were compared using the multivariate extension of Steiger z for overlapping dependent correlations (Howell, 2013; Steiger, 1980).
IRT analysis were performed using “ltm” (Rizopoulos, 2006), and “mirt” (Chalmers, 2012) packages in R; ESEM models were estimated using Mplus 7.4 (Muthén & Muthén, 2012-2015). Dominance analyses were conducted using the “yhat” (Nimon & Oswald, 2015) R package. All other statistical analyses were performed in SPSS 22.
Results
Item Response Theory Analysis Results
To conserve space, IRT parameters (i.e., slopes and thresholds) estimates for PID-5 and PID-5-SF Short Form Traits Scales in Samples 1 and 2 are listed in Supplemental Tables S1 sand S2 (available with the article online), respectively. According to discrimination parameters and TIF (see the Supplemental Figures S1 and S2; available with the article online), as well as to enable comparison with prior studies (e.g., Thimm, Jordan, & Bach, 2016) we retained the final sets of the four PID-5 items that were selected in the original PID-5-SF study (Maples et al., 2015). The four selected PID-5 items selected for each facet were used to evaluate the goodness-of-fit of PID-5-SF model as compared with the 220-item version of the PID-5. RMSEA values for the PID-5 scales and PID-5-SF scales in Samples 1 and 2 are listed in Supplemental Table S3 (available with the article online).
Descriptive Statistics and Internal Consistency
Descriptive statistics and internal consistency indices for PID-5-SF and PID-5 scales in Sample 1 and in Sample 2 are summarized in Supplemental Table S4 (available with the article online). In Sample 1, Cronbach’s α coefficient values for PID-5-SF ranged from .73 (MIC = .40; Suspiciousness) to .90 (MIC = .70; Depressivity and Eccentricity); similar results were observed in Sample 2 (minimum α = .70 [MIC = .37; Restricted Affectivity], maximum α = .91 [MIC = 73; Depressivity and Anhedonia]). Thus, Cronbach’s α coefficient values and average interitem correlation showed that PID-5-SF trait and domain scales were provided with adequate internal consistency.
Factor Analysis Results
In community-dwelling adult participants, a five-factor ESEM model of the 25 trait scales showed adequate fit indices for the original 220-item version of the PID-5, χ2(185) = 1805.10, p < .001, RMSEA = .068, 90% confidence interval (CI) = [.065, .071], TLI = .90, CFI = .93, SRMSR = .03. Interestingly, when we considered the 25 trait scales of the PID-5-SF, a five-factor ESEM model showed adequate fit indices, χ2(185) = 2047.01, p < .001, RMSEA = .073, 90% CI = [.070, .076], TLI = .90, CFI = .94, SRMSR = .02. In Sample 1, Tucker’s CC values for the original and reduced scales were .99, .98, 99, .99, and .99 for NA, Det, Ant, Dis, and Psy factor loadings, respectively. Similar findings were observed in Sample 2. Indeed, goodness-of-fit indices showed adequate fit for a five-factor ESEM model of the PID-5 trait scales, χ2(185) = 1000.32, p < .001, RMSEA = .079, 90% CI = [.074, .085], TLI = .90, CFI = .93, SRMSR = .03. Similarly, a five-factor ESEM model of the PID-5-SF 25 trait scales was provided with adequate fit indices values, χ2(185) = 702.29, p < .001, RMSEA = .063, 90% CI = [.058, .068], TLI = .91, CFI = .94, SRMSR = .03 trait scales, respectively. In Sample 2, CC values for the PID-5 and PID-5-SF trait scales factor loadings pattern comparison were .99, .99, 99, .97, and .99 for NA, Det, Ant, Dis, and Psy factor loadings, respectively.
ESEM standardized factor loadings in Sample 1 and in Sample 2 are listed in Table 1 and in Table 2, respectively. CC values for comparing PID-5-SF factor loadings in Sample 1 and in Sample 2 yielded values of .95, .97, .96, .97, and .92 for NA, Det, Ant, Dis, and Psy factor loadings, respectively. The scalar invariance model for testing the invariance of the five-factor model of the 25 PID-5-SF trait scales across Samples 1 and 2 showed adequate fit indices, χ2(490) = 2520.48, p < .001, RMSEA = .057, 90% CI = [.055, .059], TLI = .91, CFI = .92, SRMSR = .03, BIC = 92057.98. When we relaxed the assumption of the equality of intercepts, model fit did not improve significantly, χ2(470) = 2533.75, p < .001, Δχ2(20) = 13.26, p > .50, RMSEA = .059, 90% CI = [.057, .061], TLI = .90, CFI = .92, SRMSR = .03, BIC = 92142.67. Configural invariance model showed the worst goodness-of-fit indices, χ2(370) = 2322.04, p < .001, RMSEA = .065, 90% CI = [.062, .067], TLI = .88, CFI = .93, SRMSR = .03, BIC = 92626.50, suggesting that no improvement of the fit function could be achieved by freeing factor loadings. The CC values for the comparisons of PID-5-SF five-factor structure in Samples 1 and 2, respectively, with U.S. (Maples et al., 2015), Danish (Bach et al., 2016), and Norwegian (Thimm et al., 2017) PID-5-SF factor structures are reported in Table 1 (Sample 1) and in Table 2 (Sample 2), respectively.
PID-5 and PID-5-SF: Exploratory Structural Equation Model Standardized Factor Loadings in Sample 1 (N = 2,143).
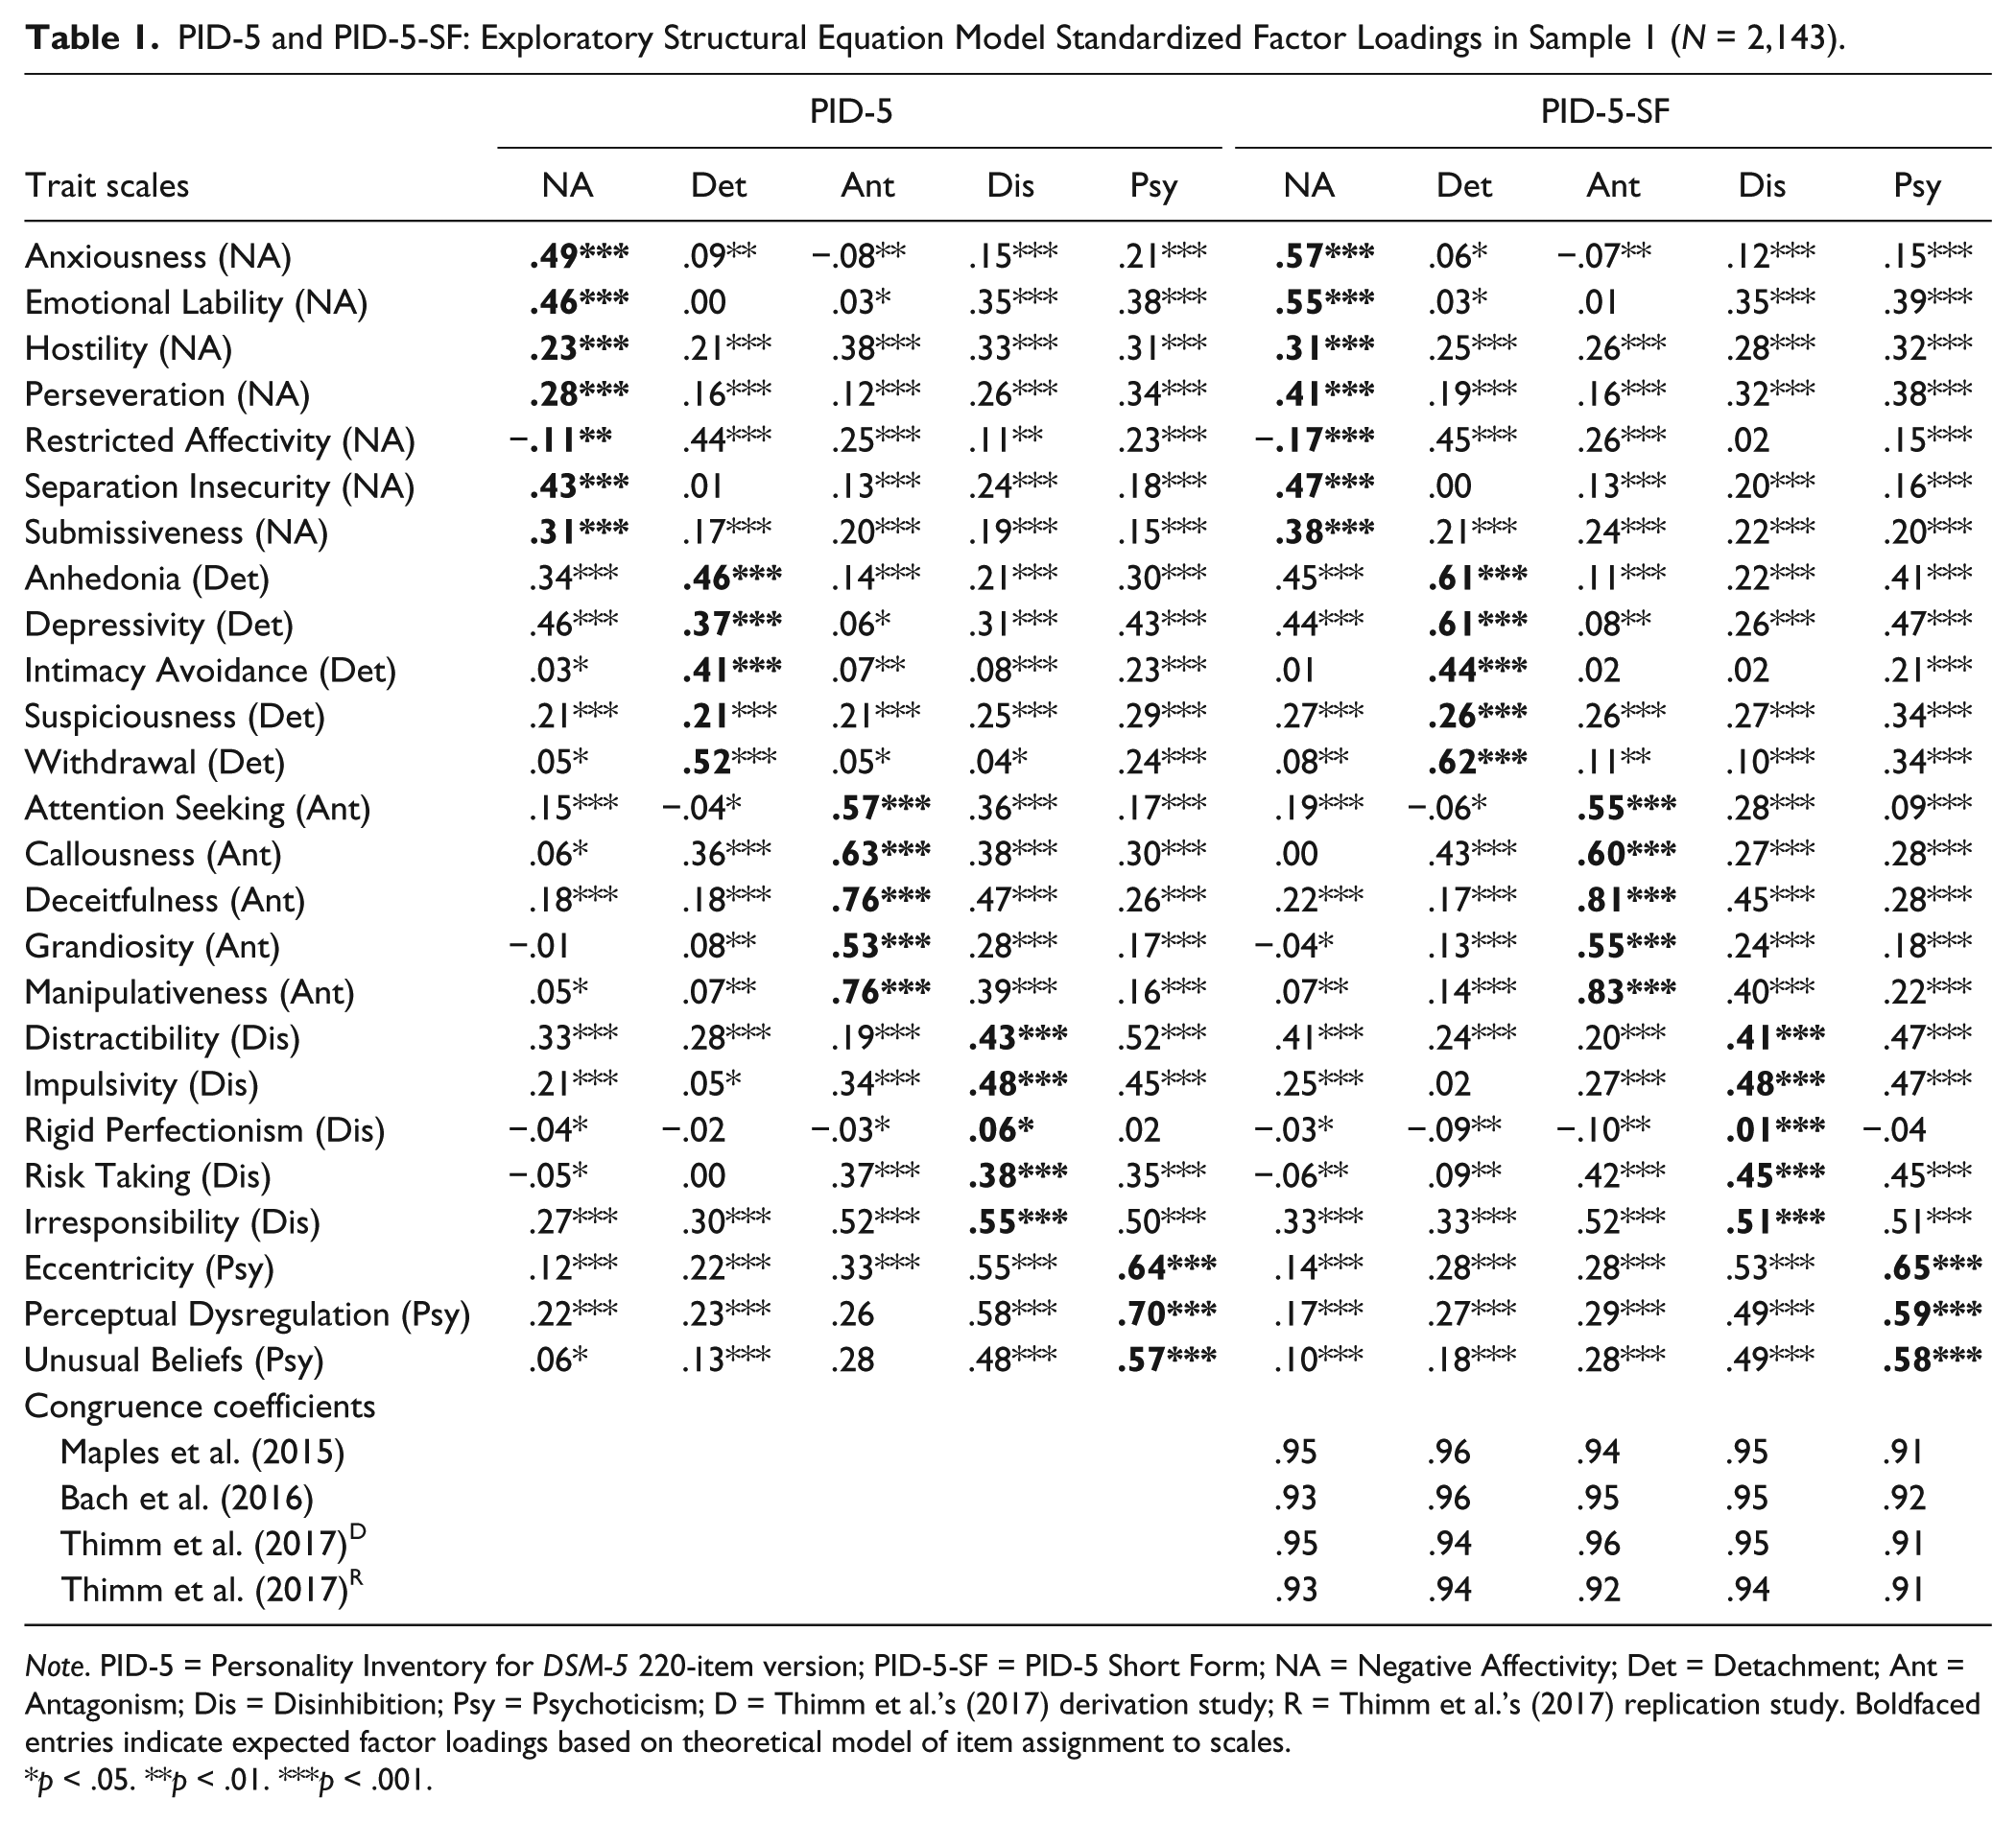
Note. PID-5 = Personality Inventory for DSM-5 220-item version; PID-5-SF = PID-5 Short Form; NA = Negative Affectivity; Det = Detachment; Ant = Antagonism; Dis = Disinhibition; Psy = Psychoticism; D = Thimm et al.’s (2017) derivation study; R = Thimm et al.’s (2017) replication study. Boldfaced entries indicate expected factor loadings based on theoretical model of item assignment to scales.
p < .05. **p < .01. ***p < .001.
PID-5 and PID-5-SF: Exploratory Structural Equation Model Standardized Factor Loadings in Sample 2 (N = 706).
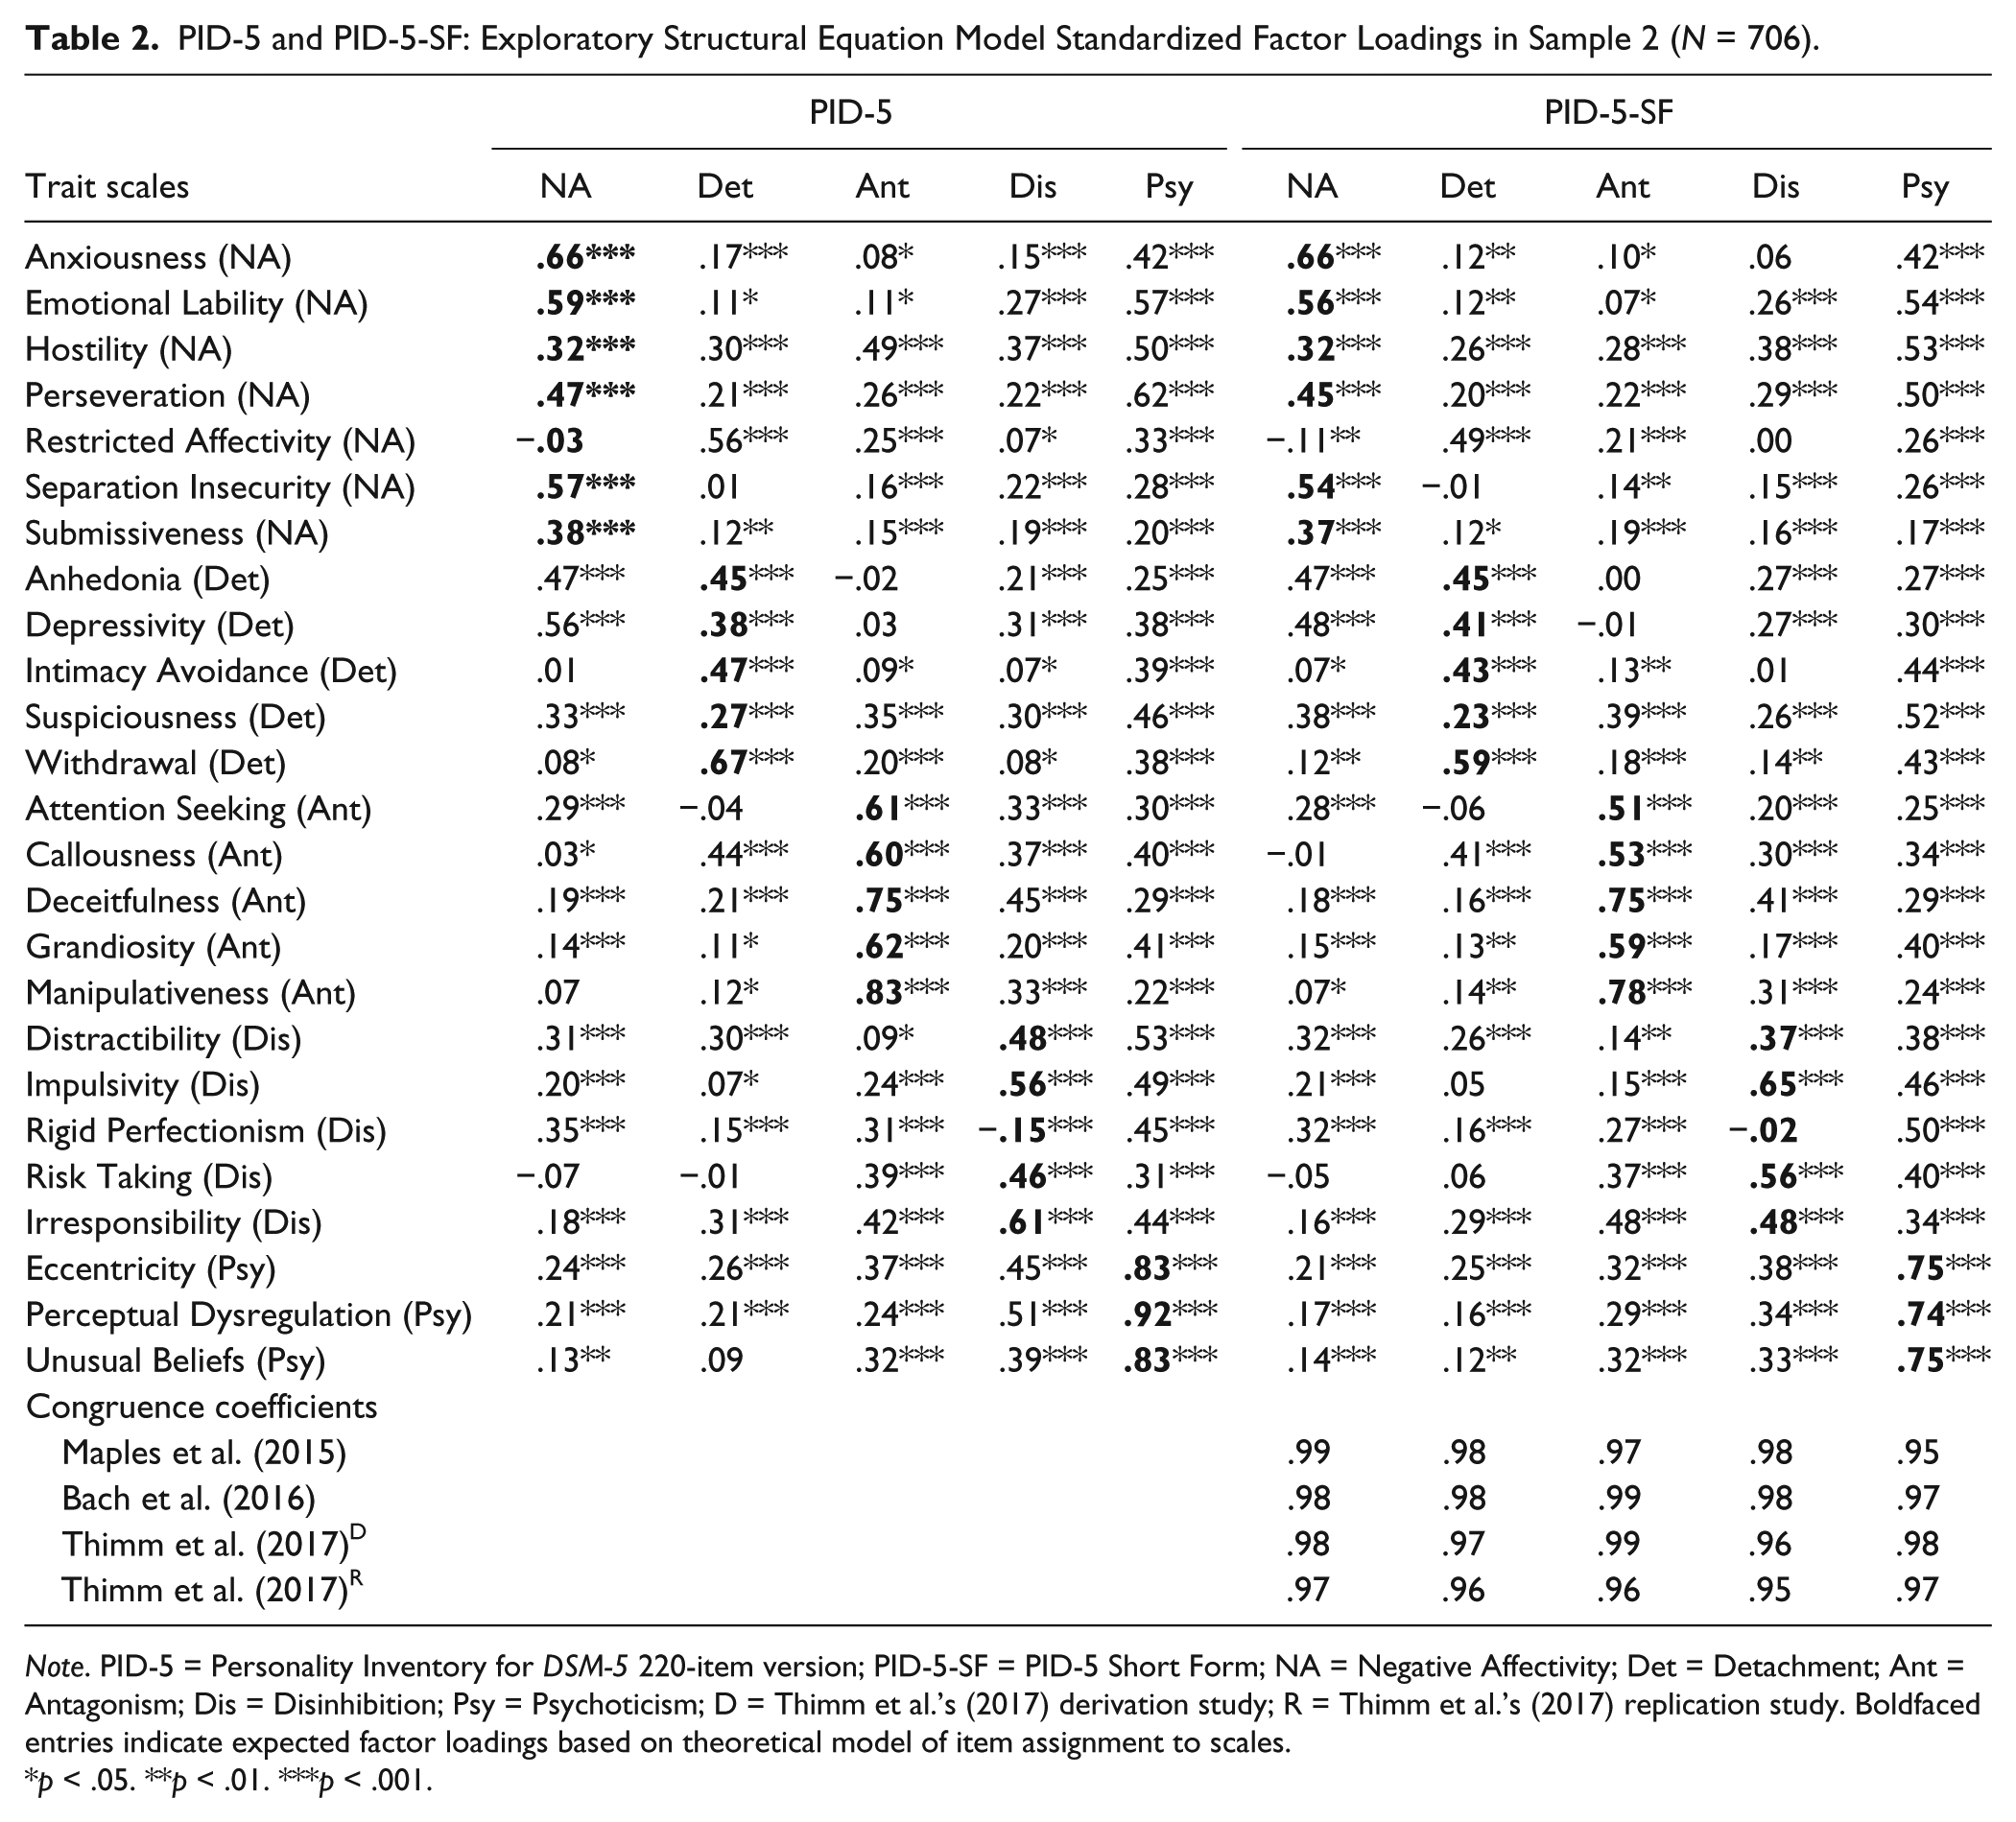
Note. PID-5 = Personality Inventory for DSM-5 220-item version; PID-5-SF = PID-5 Short Form; NA = Negative Affectivity; Det = Detachment; Ant = Antagonism; Dis = Disinhibition; Psy = Psychoticism; D = Thimm et al.’s (2017) derivation study; R = Thimm et al.’s (2017) replication study. Boldfaced entries indicate expected factor loadings based on theoretical model of item assignment to scales.
p < .05. **p < .01. ***p < .001.
PID-5-SF: Differentiating Clinical Participants From Nonclinical Participants
Sample 2 participants were significantly, albeit slightly older than Sample 1 participants, t(2847) = 5.94, p < .001, d = 0.26; rather, a significantly, albeit trivially lower rate of female participants were included in Sample 2 (52.4%) than in Sample 1 (59.6%), χ2(1) = 11.23, p < .001, ϕ = .06. However, multivariate analysis of covariance results in Sample 2 showed that neither participant’s gender, Pillai’s V = .03, p > .50, nor participant’s age, Pillai’s V = .05, p > .20, had a significant effect on PID-5-SF trait scale scores. As it was expected, one-way multivariate analysis of variance results showed that as a whole PID-5-SF trait scales significantly—and substantially—discriminated clinical adult participants from community-dwelling adults, Pillai’s V = .27, p < .001; univariate F(1,2847) with Bonferroni-corrected nominal significance level (i.e., p < .002) showed that all PID-5-SF trait scale significantly discriminated the two samples, with the exception of Manipulativeness, Risk Taking, Cognitive and Perceptual Dysregulation, and Unusual Beliefs (median η2 = .04, SD = .05, minimum η2 = .01 [Restricted Affectivity]; maximum η2 = .20 [Anhedonia]). Supplemental Table S5 (available with the article online) presents mean comparisons (t tests) for PID-5-SF trait scales between Sample 1 and Sample 2 participants, as well as mean comparisons for PID-5-SF trait scales for the Italian samples and Spanish and U.S. samples (Díaz-Batanero et al., 2017; Maples et al., 2015), respectively. Supplemental Table S6 (available with the article online) presents mean comparisons (t tests) for PID-5-SF trait scales for the Italian samples and Danish nonclinical and clinical samples, respectively (Bach et al., 2016).
Relationships Among PID-5 Trait Scales and Self-Reported and Interviewer-Rated DSM-5 Section II PDs
The results of the general dominance analyses in which PID-5 and PID-5-SF trait scales were entered as predictors of dimensionally assessed DSM-5 Section II PDs are displayed in Table 3. In general, dominance analysis showed that the PID-5-SF trait scale scores were able to explain a nearly identical (o even more) amount of variance in both self-reports and interview-based scores for dimensionally assessed PD diagnoses than PID-5 trait scale scores among clinical adult participants.
PID-5-SF and PID-5 Trait Scales as Predictors of Dimensionally Assessed DSM-5 Section II Personality Disorders: GD Weights (N = 706).
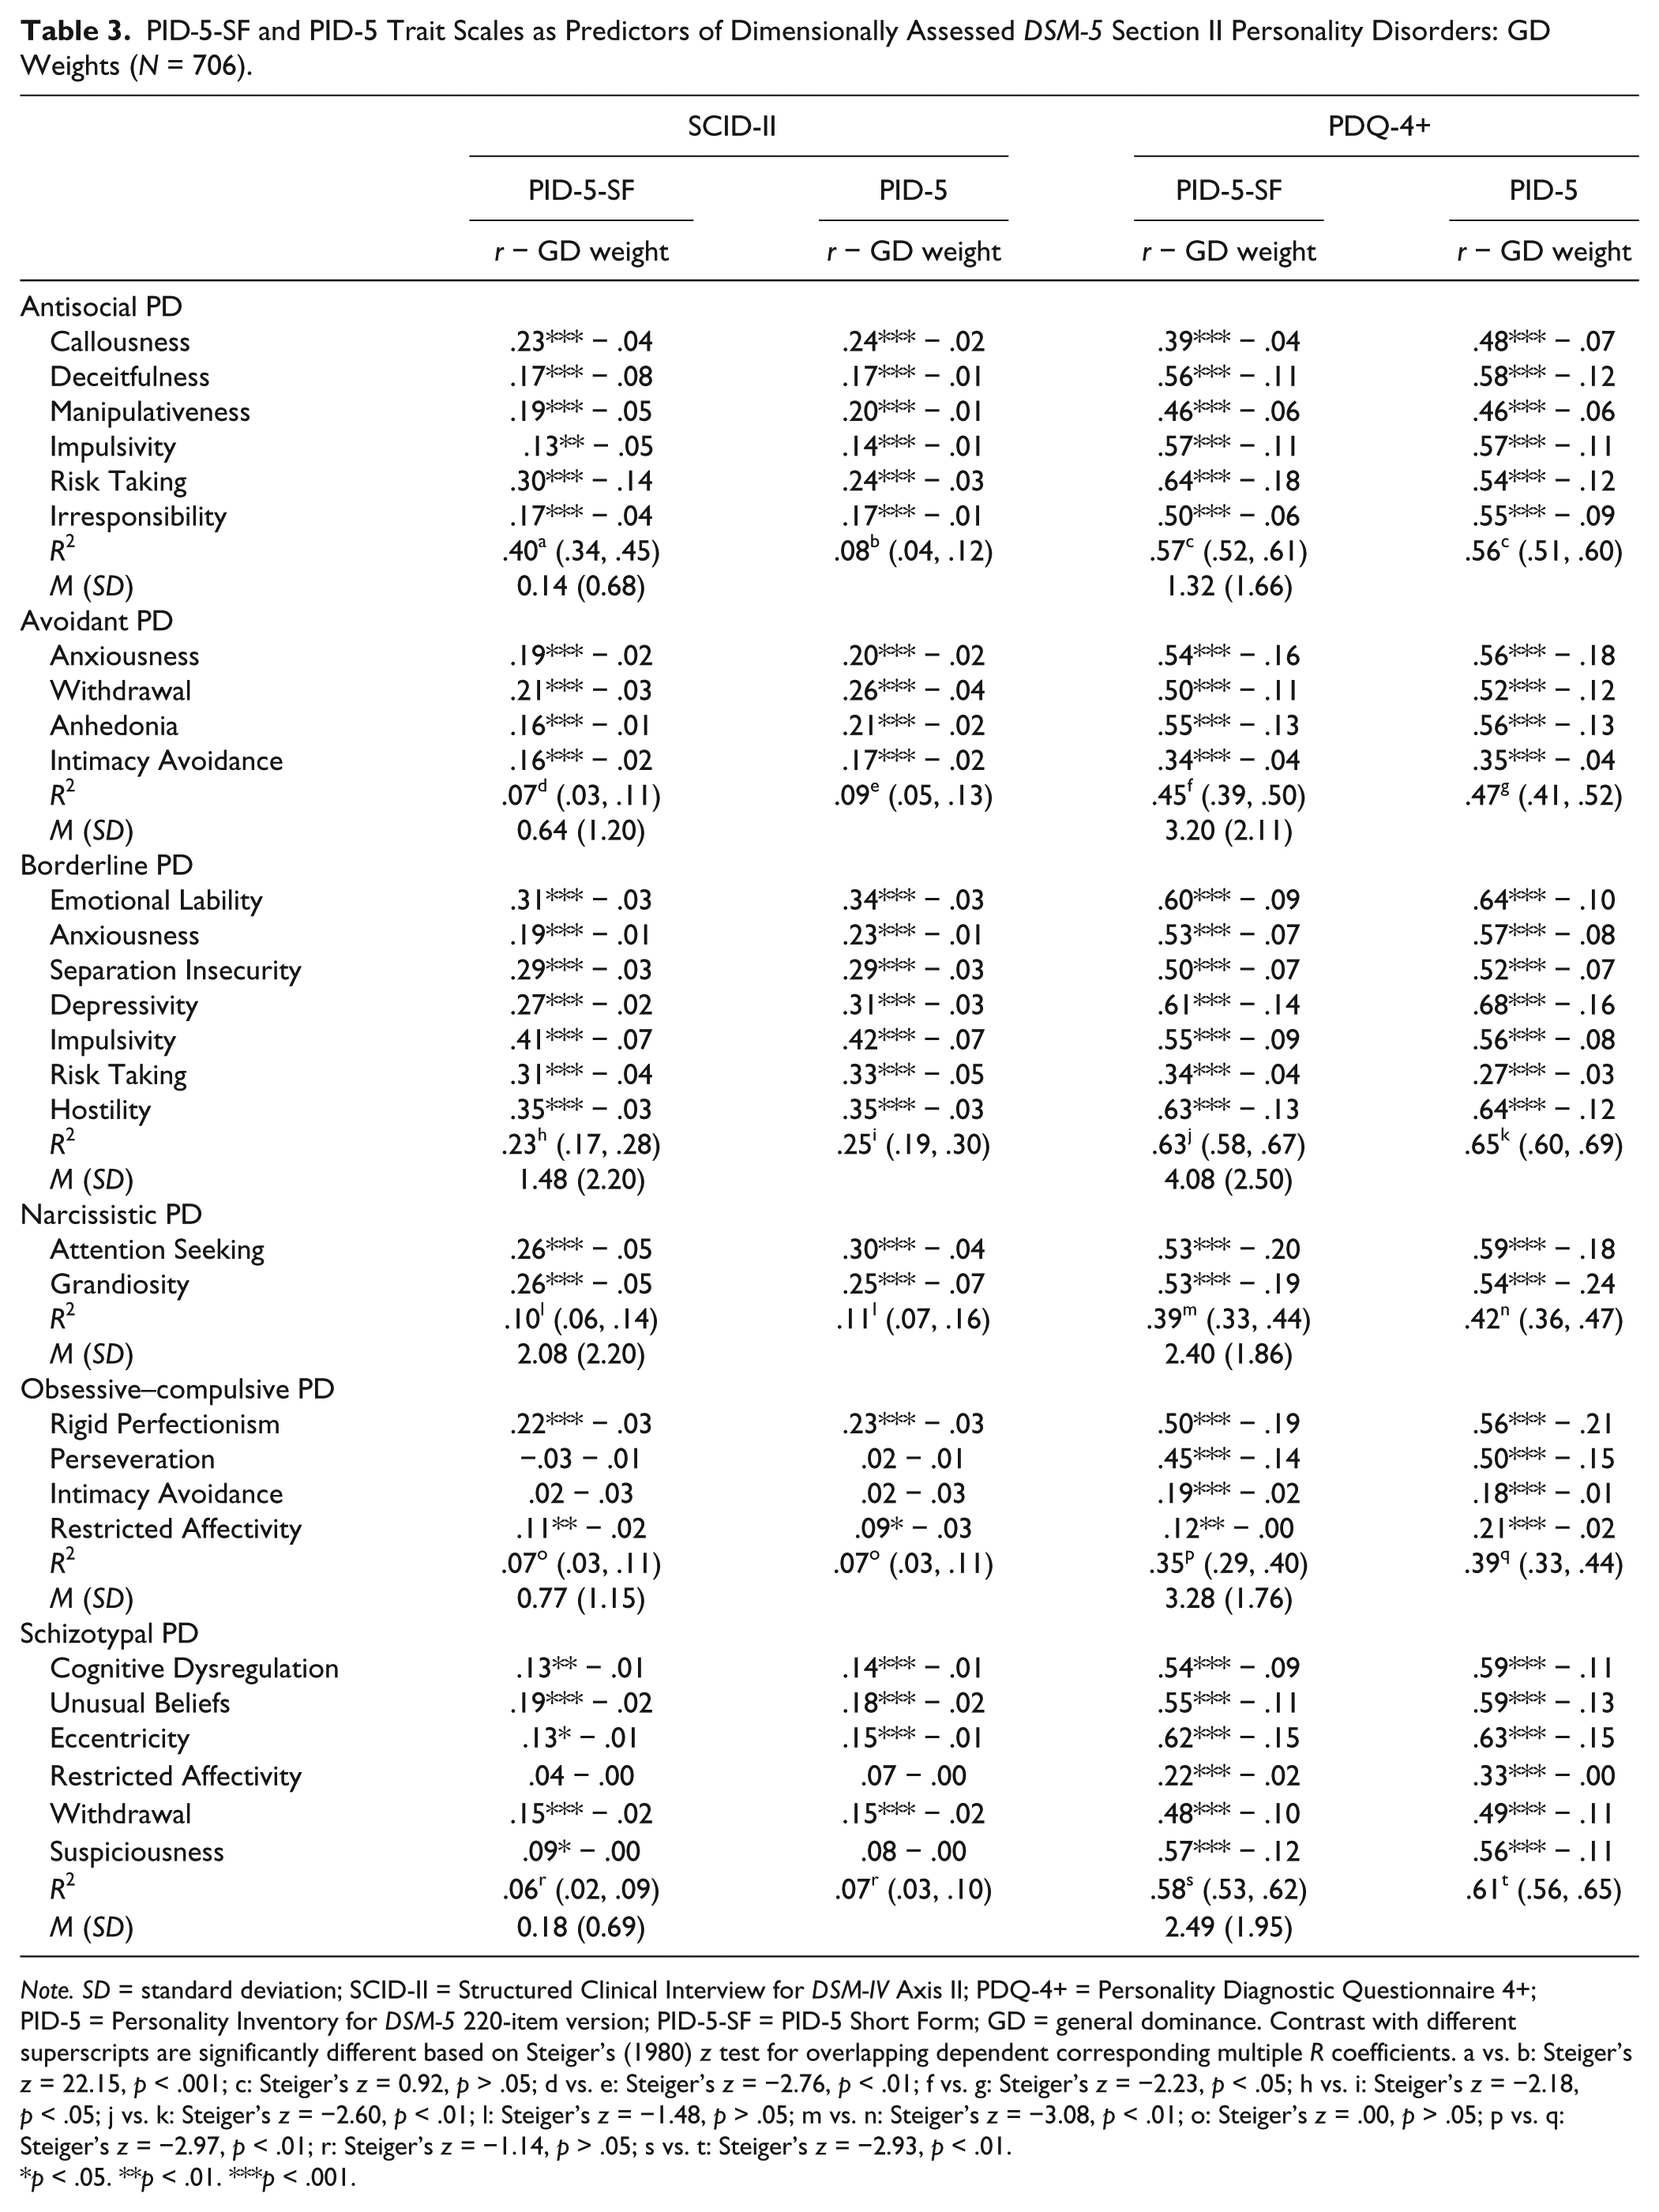
Note. SD = standard deviation; SCID-II = Structured Clinical Interview for DSM-IV Axis II; PDQ-4+ = Personality Diagnostic Questionnaire 4+; PID-5 = Personality Inventory for DSM-5 220-item version; PID-5-SF = PID-5 Short Form; GD = general dominance. Contrast with different superscripts are significantly different based on Steiger’s (1980) z test for overlapping dependent corresponding multiple R coefficients. a vs. b: Steiger’s z = 22.15, p < .001; c: Steiger’s z = 0.92, p > .05; d vs. e: Steiger’s z = −2.76, p < .01; f vs. g: Steiger’s z = −2.23, p < .05; h vs. i: Steiger’s z = −2.18,p < .05; j vs. k: Steiger’s z = −2.60, p < .01; l: Steiger’s z = −1.48, p > .05; m vs. n: Steiger’s z = −3.08, p < .01; o: Steiger’s z = .00, p > .05; p vs. q: Steiger’s z = −2.97, p < .01; r: Steiger’s z = −1.14, p > .05; s vs. t: Steiger’s z = −2.93, p < .01.
p < .05. **p < .01. ***p < .001.
Discussion
Confirming and extending previous findings on community-dwelling participants (Maples et al., 2015), the results of the present study suggest that PID-5-SF may represent a reliable measure of DSM-5 Section III maladaptive personality traits. Although previous studies documented the reliability and factor structure of the PID-5-SF in clinical samples (Bach et al., 2016; Díaz-Batanero et al., 2017), to our knowledge our study represents the first attempt at replicating Maples et al.’s (2015) original IRT analysis findings. In our study, IRT analyses showed that all PID-5-SF items had item discriminations (i.e., slope) that could be considered large (i.e., greater than 0.90) by conventional standards (e.g., Sharp, Steinberg, Temple, & Newlin, 2014), with the partial exception of Suspiciousness Item 117 (“I’m always on my guard for someone trying to trick or harm me.”) in community-dwelling adults. Moreover, 81.0% (n = 81) of the items that were included by Maples et al. (2015) in the PID-5-SF were among the best performing items in terms of item discrimination parameters in our IRT analyses of the PID-5 items in community-dwelling adults; interestingly, 78.0% (n = 78) of Maples et al.’s (2015) PID-5 best performing items emerged as most discriminating items in our PID-5 IRT analyses in clinical adult participants. In both samples, RMSEA indices supported the item unidimensionality hypothesis for all PID-5-SF scales, with values that were of comparable size to those that were observed for the corresponding PID-5 scales. Thus, for the Italian version of the PID-5-SF we maintained the same pool of 100 items that was originally selected by Maples et al. (2015) for the U.S. version.
Consistent with previous studies (Bach et al., 2016; Díaz-Batanero et al., 2017; Maples et al., 2015; Thimm et al., 2017), internal consistency indices for the Italian translation of the PID-5-SF were adequate in both community-dwelling adult participants and in clinical adult participants. In our study, ESEM analyses showed that a five-factor model of the correlation matrix of the 25 PID-5-SF scales was provided with adequate fit indices in both Samples 1 and 2; moreover, the PID-5-SF five-factor model showed fit indices that were of comparable size to those that were observed for the exploratory factor analyses of the 25 trait scales of the 220-item version of the PID-5 in both community-dwelling adults and clinical adults (e.g., Bastiaens et al., 2016; Gutiérrez et al., 2017; Thimm et al., 2016).
In line with previous findings on the PID-5 (e.g., Bach et al., 2015; De Fruyt et al., 2013), and on the PID-5-SF (e.g., Bach et al., 2015; Maples et al., 2015; Thimm et al., 2017), some trait scales of the PID-5-SF showed significant factor loadings on multiple factors. For instance, in both samples, PID-5-SF Restricted Affectivity showed its largest loading on Detachment (instead of Negative Affectivity). Moreover, PID-5-SF Rigid Perfectionism showed trivial factor loading in Sample 1, whereas it loaded on NA (instead of Dis), in Sample 2. Consistent with previous reports (Maples et al., 2015; Thimm et al., 2017), PID-5-SF Suspiciousness cross-loads on several domains; Perseveration loads on both Negative Affectivity and Psychoticism; similarly, Distractibility loads on both Disinhibition and Psychoticism. However, it should be observed that these deviations have previously been observed in studies on the PID-5-SF in U.S. (Maples et al., 2015), Norwegian (Thimm et al., 2016) and Danish samples (Bach et al., 2015). Moreover, in a sense, these results are also consistent with previous reports suggesting problematic discriminant validity for selected PID-5 scales (Crego et al., 2015; Quilty et al., 2013; Watson et al., 2013), such as Restricted Affectivity, Hostility, Perseveration, Intimacy Avoidance, and Rigid Perfectionism.
Consistent with available evidence (Bach et al., 2017; Maples et al., 2015), our data showed that PID-5-SF trait scale factor structure matched the factor structure of the 25 trait scales of the 220-item PID-5; moreover, in CC analyses the factor structures that were observed for the PID-5-SF trait scales in community-dwelling adults and clinical adults, respectively, closely replicated the factor loading matrix that was originally reported by Maples et al. (2015). Moreover, the five-factor loadings of the Italian PID-5-SF were overall congruent with the factor loadings found in the Danish mixed sample (Bach et al., 2015), in the Norwegian student sample (Thimm et al., 2016), and in the Spanish dual diagnosis patient sample. This finding is consistent with previous reports on the cross-cultural replicability of the 220-item version of the PID-5 (Thimm et al., 2017).
Interestingly, in our study the PID-5-SF yielded factor structure parameters (i.e., factor loadings and intercepts) that were invariant across community-dwelling adults and clinical adult participants; this finding is important since it seems to suggest that the PID-5-SF seemed to be provided with measurement invariance in clinical and community-dwelling adult participants, thus, allowing for comparisons based on test observed scores between clinical participants and community participants, at least in its Italian translation. In this respect, our findings seemed to be consistent with Bach et al.’s (2017) recent results. Indeed, Bach et al. (2017) investigated the measurement invariance, five-factor structure, and factor correlations across clinical and nonclinical samples providing evidence for strong measurement invariance across the two samples at the domain level (Bach et al., 2017).
Consistent with our expectations, the PID-5-SF trait scales showed a large and significant multivariate effect in discriminating clinical participants from community-dwelling adults. Dominance analysis results showed that PID-5-SF scales explained a nonnegligible and significant amount of variance in both self-reports and interview ratings of selected DSM-5 Section II PD. When compared with the corresponding trait scales of the 220-item version of the PID-5, as a whole relying on PID-5-SF trait scale scores did not seem to end in a substantial loss of information, at least in predicting SCID-II and PDQ-4+ scores of DSM-5- Section II Antisocial, Avoidant, Narcissistic, Borderline, Schizotypal, and Obsessive–Compulsive PDs. Indeed, the amount of variance that was explained by PID-5-SF trait scales in SCID-II and PDQ-4+ PD ratings was approximately equal to, or slightly, albeit significantly lower than the amount of variance that was explained by the corresponding PID-5 trait scales. The only exception were SCID-II Antisocial PD ratings (i.e., number of criteria met by each participant), which showed a substantially (and significantly) stronger association with PID-5-SF Callousness, Deceitfulness, Manipulativeness, Impulsivity, Risk Taking, and Irresponsibility scales than with the corresponding 220-item version PID-5 scales.
In the present study, we observed only a partial overlap between the expected set of DSM-5 trait predictors for Schizotypal PD and Obsessive–Compulsive PD, and the PID-5-SF (as well as PID-5) scales that resulted to be significantly associated with SCID-II ratings of Schizotypal PD and Obsessive–Compulsive PD, respectively. It should also be observed that for these dimensionally assessed (i.e., number of criteria met by each participant) SCID-II PD, the amount of variance that was explained by trait scale scores was lower than 10.0% (i.e., R2 < .10) for both PID-5-SF and PID-5 in our dominance analyses. Based on our data, it is difficult to say if these findings that were only partially consistent with the DSM-5 AMPD model of Schizotypal PD and Obsessive–Compulsive PD represent an artifact due to method effect (the problem relationship emerged only for SCID-II ratings), to the restricted mean and variance estimates that were observed in our Sample 2 for SCID-II ratings of these PDs, or more generally to reduced representativeness of clinical samples when studying pathological populations (i.e., the so-called Berkson bias; Berkson, 1946). In any case, we feel that these findings strongly stress the need for further studies on this topic.
Of course, our findings should be considered in light of several limitations. For instance, Sample 1 was composed by adults who volunteered to participate in the study; thus, it represents a sample of convenience rather than a randomized sample representative of the Italian adult population. Our Sample 2 was composed only of participants voluntarily asking for psychotherapy treatment; this inherently limits the generalizability of our findings to other clinical samples. Moreover, our clinical sample was representative at best of a psychotherapy outpatient population, and it was more akin to a sample of convenience than to a sample of randomly selected subjects, although the use of consecutive admissions may have increased its representativeness.
Even keeping these limitations in mind, we think that the present study suggests that the reduced set of PID-5 items identified by Maples et al. (2015) may be safely used to score the DSM-5 domains and facets, at least in Italy. The possibility to obtain a reliable and valid assessment of the DSM-5 AMPD traits and domains using only 100 items suggests that DSM-5 Section III traits could still be measured in settings in which assessment-related resources (e.g., time, compensation) are limited (Maples et al., 2015).
Supplemental Material
Supplementary_Material_PID-5-SF_TIFs_R2 – Supplemental material for Item Response Theory Analyses, Factor Structure, and External Correlates of the Italian Translation of the Personality Inventory for DSM-5 Short Form in Community-Dwelling Adults and Clinical Adults
Supplemental material, Supplementary_Material_PID-5-SF_TIFs_R2 for Item Response Theory Analyses, Factor Structure, and External Correlates of the Italian Translation of the Personality Inventory for DSM-5 Short Form in Community-Dwelling Adults and Clinical Adults by Antonella Somma, Robert F. Krueger, Kristian E. Markon, Serena Borroni and Andrea Fossati in Assessment
Footnotes
Declaration of Conflicting Interests
The authors declared no potential conflicts of interest with respect to the research, authorship, and/or publication of this article.
Funding
The authors received no financial support for the research, authorship, and/or publication of this article.
Notes
Supplemental Material
References
Supplementary Material
Please find the following supplemental material available below.
For Open Access articles published under a Creative Commons License, all supplemental material carries the same license as the article it is associated with.
For non-Open Access articles published, all supplemental material carries a non-exclusive license, and permission requests for re-use of supplemental material or any part of supplemental material shall be sent directly to the copyright owner as specified in the copyright notice associated with the article.