
Abstract
Depressive and anxiety disorders are severe and disabling conditions that result in substantial cost and global societal burden. Accurate and efficient identification is thus vital to proper diagnosis and treatment of these disorders. The Inventory of Depression and Anxiety Symptoms (IDAS) is a reliable and well-validated measure that provides dimensional assessment of both mood and anxiety disorder symptoms. The current study examined the clinical utility of the IDAS by establishing diagnostic cutoff scores and severity ranges using a large mixed sample (N = 5,750). Results indicated that the IDAS scales are good to excellent predictors of their associated Structured Clinical Interview for DSM-IV diagnoses. These findings were replicated using Diagnostic and Statistical Manual of Mental Disorders–Fifth edition (DSM-5) criteria assessed via the Mini-International Neuropsychiatric Interview. We provide three cutoff scores for each scale that can be used differentially depending on the goal of their use: screening, efficiency, or diagnosis confirmation. The identified severity ranges allow users to characterize individuals as mild, moderate, or severe, providing clinical information beyond diagnostic status. Finally, the 10-item IDAS Dysphoria scale and 20-item General Depression scale demonstrate strong ability to predict internalizing diagnoses and may represent an efficient way to screen for the presence of internalizing psychopathology.
Keywords
Depressive and anxiety disorders are highly prevalent and significantly impairing, resulting in substantial cost and societal burden (Baxter, Vos, Scott, Ferrari, & Whiteford, 2014; Donohue & Pincus, 2007; Kessler, Petukhova, Sampson, Zaslavsky, & Wittchen, 2012). Accurate assessment of the symptoms of these syndromes is thus vital for frontline identification, prevention, and treatment. Although there is a long history of development of assessment instruments designed to measure mood and anxiety symptoms, they are limited in several significant ways. The Inventory of Depression and Anxiety Symptoms (IDAS; Watson et al., 2007; Watson, O’Hara, Chmielewski, et al., 2008) was developed to address these limitations. The IDAS has been found to be a psychometrically sound measure, providing comprehensive dimensional symptom assessment, but its use in more applied settings has not been established. The goal of the present analysis was to examine the clinical utility of the IDAS scales and develop diagnostic cutoff scores in a large sample using gold standard clinical interviews and other self-report symptom measures as reference points.
Assessment of Depressive and Anxiety Disorder Symptoms
There is a clear need for psychometrically sound, clinically useful instruments for the efficient assessment of depression and anxiety symptoms. Several measures are in existence; for instance, the Beck Depression Inventory–II (BDI-II; Beck, Steer, & Brown, 1996), Center for Epidemiological Studies–Depression Scale (CES-D; Radloff, 1977), and the Beck Anxiety Inventory (BAI; Beck & Steer, 1990) are widely used in both research and clinical contexts. The IDAS was developed to complement these existing depression symptom inventories and to address limitations of these measures (see Watson et al., 2007). Specifically, the initial IDAS item pool was designed to (a) model both depression and anxiety content to improve discriminant validity and (b) provide comprehensive dimensional assessment of each of the nine diagnostic symptom criteria for major depression (Watson et al., 2007).
The 64-item IDAS is composed of two broad scales. The 10-item Dysphoria scale provides nonspecific assessment of core emotional and cognitive symptoms of depression and anxiety, essentially representing the general distress dimension identified in structural models of psychopathology (e.g., Clark & Watson, 1991; Mineka, Watson, & Clark, 1998; Zinbarg & Barlow, 1996). The 20-item General Depression scale provides an overall depression symptom score, encompassing the 10 Dysphoria items as well as several specific symptoms from other scales. In addition, the IDAS includes 10 specific symptom scales, which were derived via factor analysis: Well-Being (eight items), Suicidality (six items), Lassitude (six items), Insomnia (six items), Appetite Loss (three items), Appetite Gain (three items), Ill Temper (five items), Panic (eight items), Social Anxiety (five items), and Traumatic Intrusions (four items). These scales are internally consistent and demonstrate good convergent and discriminant validity. The IDAS scales show strong stability over a 1-week retest interval, effectively differentiate psychiatric patients from nonclinical participants, and provide incremental predictive power above and beyond the BAI and BDI-II in identifying clinical diagnoses (Watson et al., 2007; Watson, O’Hara, Chmielewski, et al., 2008).
The IDAS possesses several features that make it useful across clinical and research contexts. Its broad range of content captures several symptoms not represented in extant measures and it provides differentiated assessment of distinct symptom dimensions of both depression and anxiety. In addition, the IDAS is both straightforward and brief (Watson et al., 2007, Watson et al., 2012), which could represent a critical asset in a busy clinical setting.
Clinical Cutoff Scores
Clinical cutoff scores are designed to provide optimal differentiation between individuals with and without the diagnosis of interest. Although dimensional models and measures of symptoms are increasingly being discussed and implemented (e.g., Jones, 2012; Kraemer, 2007; Kraemer, Noda, & O’Hara, 2004) and have many advantages (e.g., Chmielewski, Clark, Bagby, & Watson, 2015; Markon, Chmielewski, & Miller, 2011), categorical designations remain valuable in clinical settings. In applied clinical contexts, categorical diagnosis guides the clinician in determining whether treatment is appropriate, selecting diagnosis-specific treatments, and keeping track of treatment response (Kraemer, 2007; Kraemer et al., 2004). In some clinical research settings, the use of cutoff scores determines eligibility for treatment studies, assignment to treatment groups, and response to treatment (Kraemer, 2007; Kraemer et al., 2004).
Cutoff scores often represent the best balance between sensitivity (the true positive rate or the likelihood of correctly identifying someone with a diagnosis) and specificity (the true negative rate or the likelihood of correctly rejecting a diagnosis), but might be defined differently depending on the intended application of the cutoff score (e.g., Olofsdotter, Sonnby, Vadlin, Furmark, & Nilsson, 2015). For instance, a screening cutoff, which maximizes sensitivity, can be used to screen for the presence of a disorder; only those meeting the cutoff are given closer examination (Smits, Smit, Cuijpers, & De Graaf, 2007), thereby increasing efficiency and decreasing the probability that someone meeting criteria for the disorder is overlooked. A diagnostic cutoff, which maximizes specificity, is more conservative and favors diagnostic accuracy. Availability of multiple cutoff scores gives the user maximum flexibility in using the instrument across settings and populations of varying severity.
It also is clinically useful to establish severity ranges, allowing for classification of symptoms into differentiated categories, such as “mild” and “severe.” Severity thresholds can be useful indicators of when specific types of treatment (e.g., medication) are warranted, to track symptoms over time, and to facilitate communication via standardized interpretation of scores familiar to clinicians (Fournier et al., 2010; Matza, Morlock, Sexton, Malley, & Feltner, 2010).
Current Study
The IDAS is a factor analytically based self-report measure of depression and anxiety, with considerable evidence of reliability and validity across samples; however, the clinical utility of this instrument warrants further attention and is the central focus of the present study. In particular, no study has yet examined use of the IDAS scales to assist in determining the presence of disorder through the identification of clinical cutoff scores and to describe the magnitude of symptoms through development of severity ranges. Such examination has the potential to expand the utility of the IDAS in both clinical and research settings.
Therefore, the specific aims of the present study were to: (a) examine the test performance of the broad and specific IDAS scales (in other words, to determine how well the IDAS scales discriminate between the presence versus absence of Diagnostic and Statistical Manual of Mental Disorders–Fourth edition (DSM-IV) mood and anxiety disorders); (b) establish clinical cutoff scores of those IDAS scales for which there is a corresponding clinical diagnosis (e.g., panic disorder, social phobia 1 ); and (c) establish severity ranges for each of the IDAS scales. We focus on a mixed sample to identify cutoff scores that will detect disorder presence versus absence in a wide cross-section of the population and, therefore, will be broadly applicable to a range of clinical, research, and community settings. We follow up our primary analyses with a set of generalizability analyses conducted (a) in a less demographically homogeneous sample and (b) using Diagnostic and Statistical Manual of Mental Disorders–Fifth edition (DSM-5) diagnostic criteria.
Method
Participants and Procedures
Primary Sample
The overall sample used in the primary analyses is composed of a range of data sets that contain the IDAS. Participant samples include high school and college students, community adults, psychiatric patients, elderly individuals, diabetic individuals, and postpartum women. Across data sets, we included all cases in which participants completed at least one IDAS scale, and who were assessed (a) on another self-report depression or anxiety scale and/or (b) via a clinician-administered interview. Most of the data sets were drawn from our previous validation studies (n = 4,561), and the remaining samples were added for purposes of the present study (n = 1,189); overall, 5,750 cases are included in the primary analyses. Table 1 and Supplemental Tables S1 and S2 (all supplementary tables are available in the online version of the article) provide basic summary information regarding each of these data sets (encompassing all 5,750 cases). With the exception of two samples (Watson et al., 2007, Study 2 Student Sample; and Watson et al., 2012, Patient Sample 3), all participants resided in the state of Iowa. Annual income, marital status, and education level were collected in two of the studies (McDade-Montez & Watson, 2011; O’Hara et al., 2012) and employment level in one (O’Hara et al., 2012); income generally fell between $20,000 and $69,999 and the majority of participants were married (54% to 70.5%), employed (615.%), and had at least some college education.
Demographic Information by Sample.
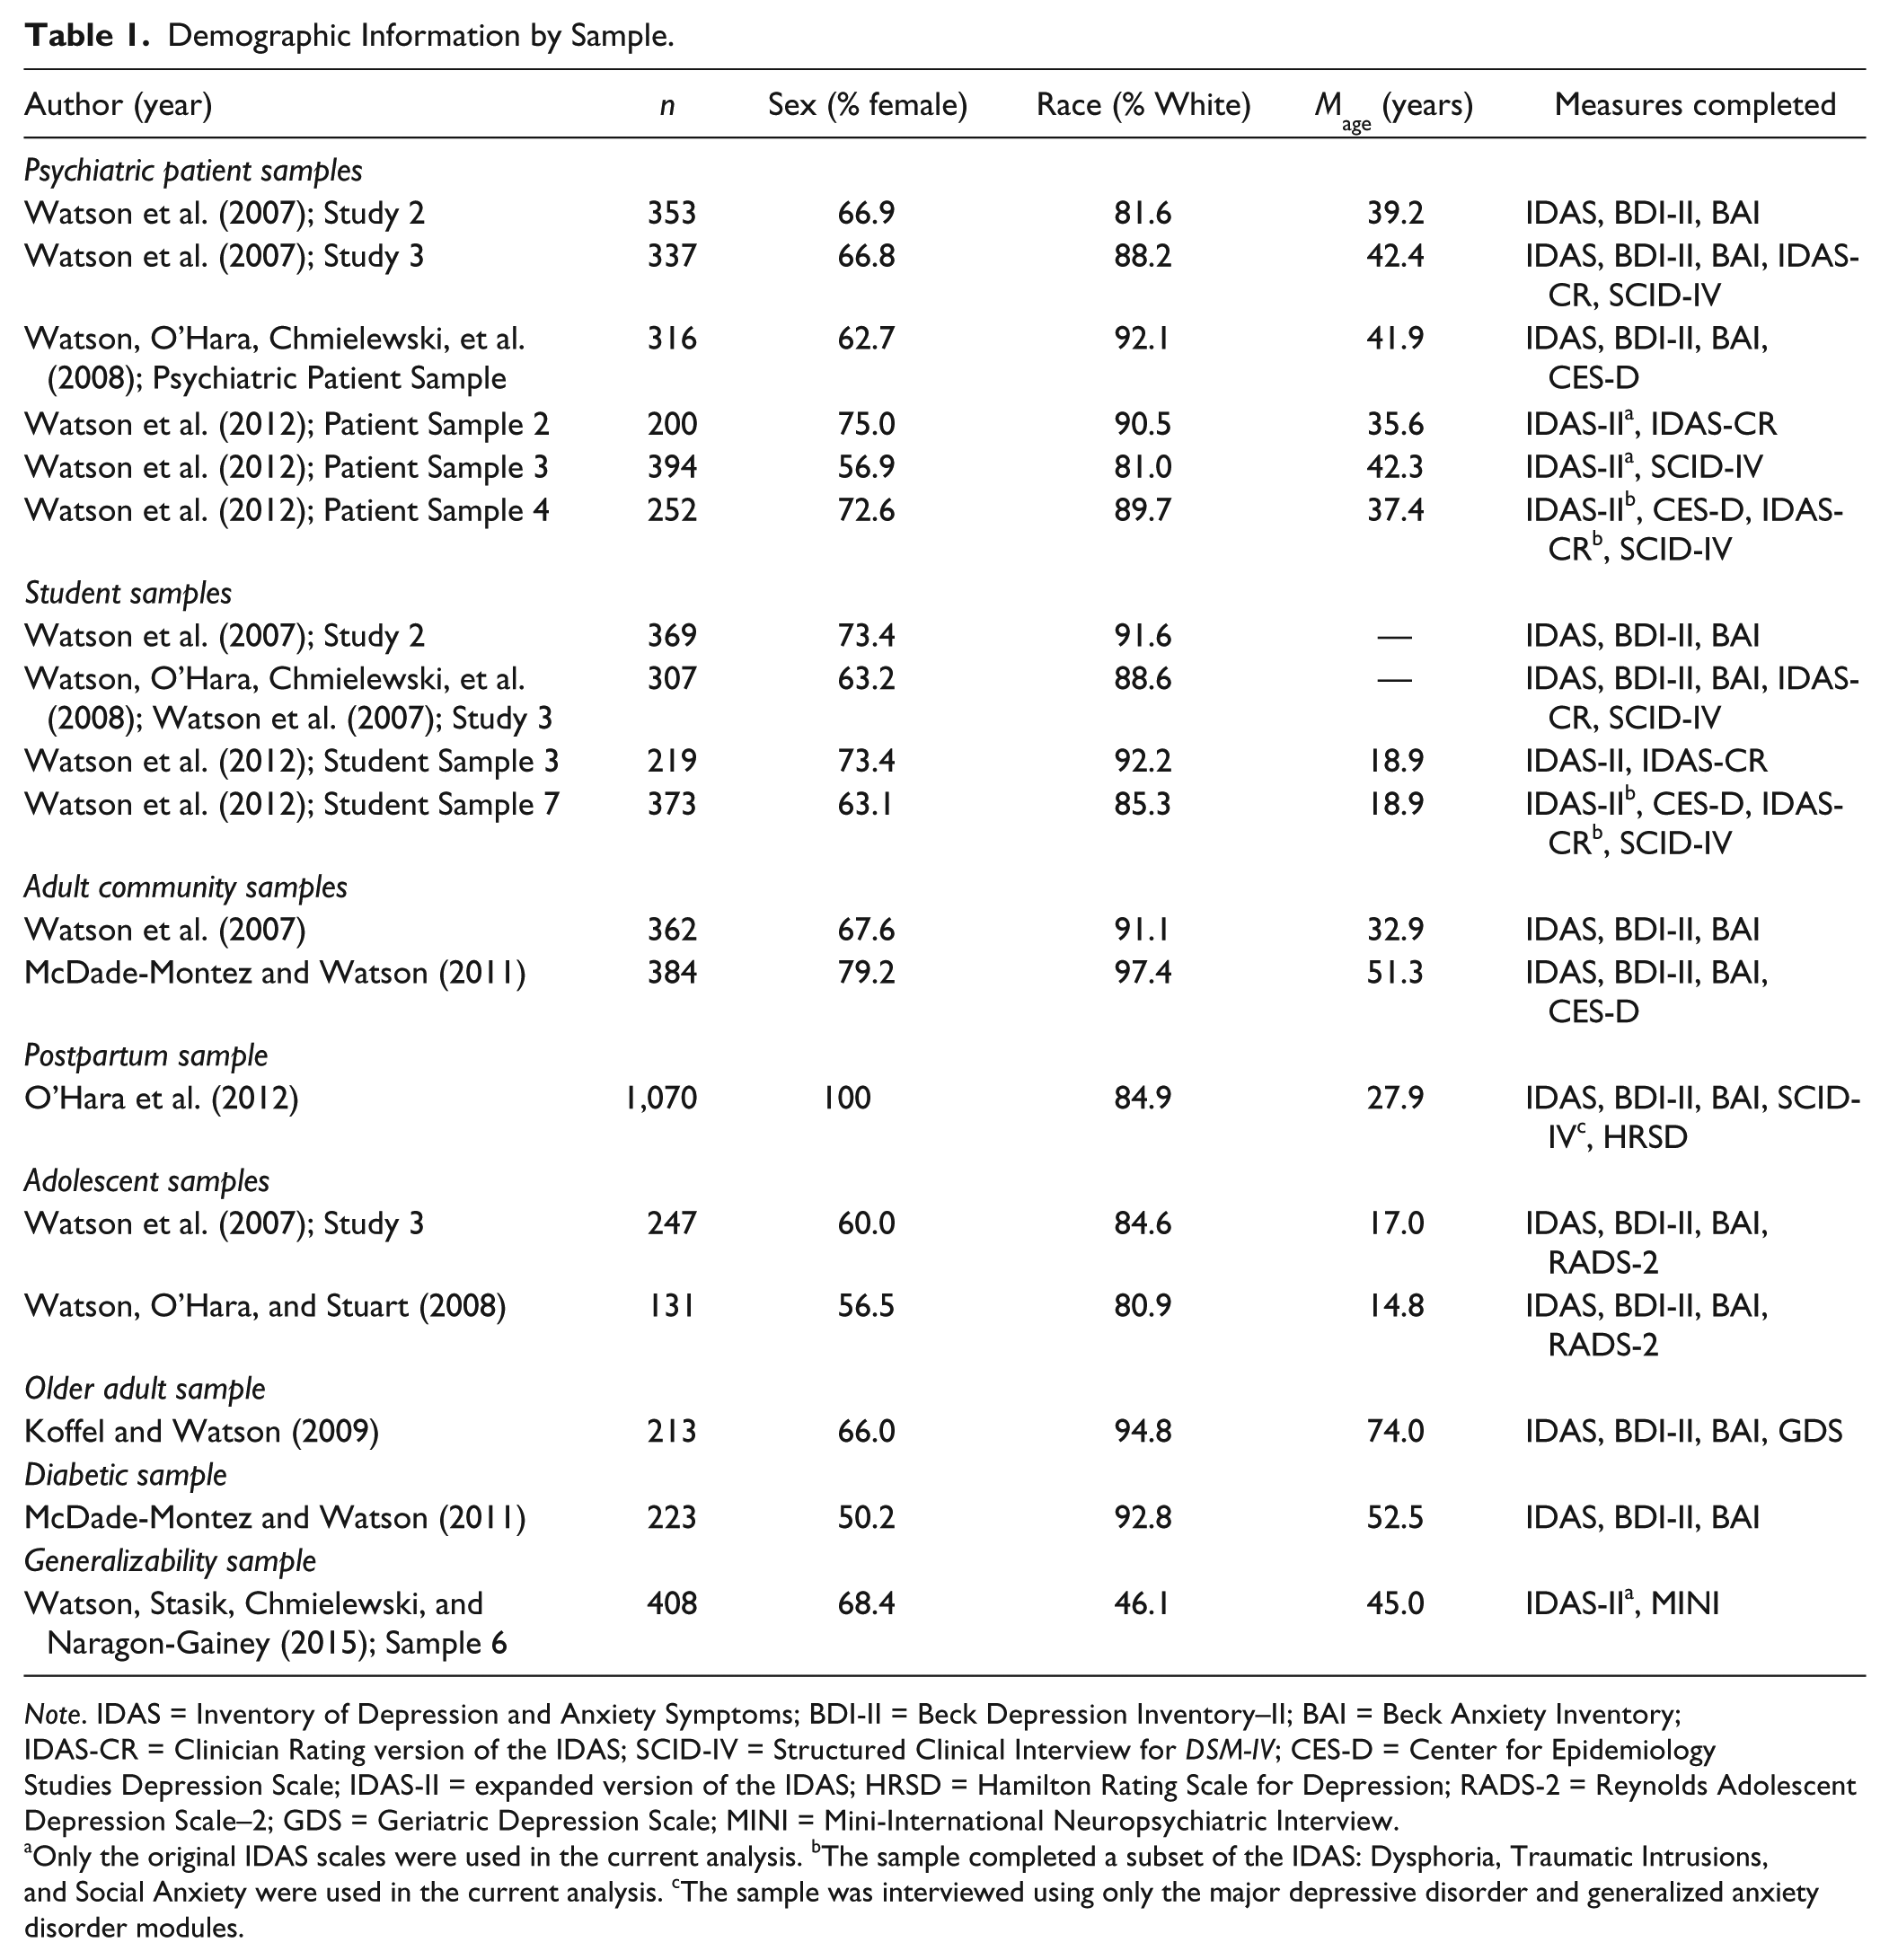
Note. IDAS = Inventory of Depression and Anxiety Symptoms; BDI-II = Beck Depression Inventory–II; BAI = Beck Anxiety Inventory; IDAS-CR = Clinician Rating version of the IDAS; SCID-IV = Structured Clinical Interview for DSM-IV; CES-D = Center for Epidemiology Studies Depression Scale; IDAS-II = expanded version of the IDAS; HRSD = Hamilton Rating Scale for Depression; RADS-2 = Reynolds Adolescent Depression Scale–2; GDS = Geriatric Depression Scale; MINI = Mini-International Neuropsychiatric Interview.
Only the original IDAS scales were used in the current analysis. bThe sample completed a subset of the IDAS: Dysphoria, Traumatic Intrusions, and Social Anxiety were used in the current analysis. cThe sample was interviewed using only the major depressive disorder and generalized anxiety disorder modules.
Because the goal of the current study was to examine the clinical utility of the IDAS in (a) identifying emotional disorders and (b) aiding in the identification of elevated symptom levels so that it may be used as a screening tool across a broad range of settings, we combined the samples into one data set for all primary analyses. Furthermore, because diagnosis was not a rule-out in the nonclinical samples, we were able to compare those with and without diagnoses across populations, permitting identification of cutoff scores and severity ranges using a broad sample. The use of a heterogeneous sample and inclusion of participants irrespective of diagnostic status decreases what is called spectrum or selection bias, a methodological shortcoming identified in diagnostic accuracy studies that can exaggerate the sensitivity and diagnostic value of an assessment measure (Cook, Cleland, & Huijbregts, 2007). The population classifications provided are for descriptive purposes.
Generalizability Sample
Although the primary sample is large and diagnostically heterogeneous, it is comprised primarily of White participants. In addition, DSM-IV diagnostic criteria were used. Therefore, we examined the ability of the IDAS scales to predict clinical diagnoses in a more demographically diverse sample using DSM-5 criteria.
The generalizability sample was composed of 438 adults residing in the greater South Bend, IN area. Portions of this data set have been described in previous papers (Stanton, Daly, et al., 2016; Stanton, Rozek, Stasik-O’Brien, Ellickson-Larew, & Watson, 2016; Watson et al., 2015; Watson, Stanton, & Clark, 2017; Watson, Stasik, Ellickson-Larew, & Stanton, 2015a, 2015b). Participation involved two 3-hour in-person sessions. At Session 1, participants completed a battery of self-report questionnaires unrelated to the current study and the first half of the clinical interview. In Session 2, participants completed the IDAS and other self-report questionnaires not reported on here, as well as the second half of the clinical interview. Session 2 was held roughly 3 weeks after Session 1 (mean interval = 20.3 days). Complete IDAS and interview data are available for 408 participants.
Basic demographic information is presented in Table 1. Compared to with the primary sample, these participants were less likely to be married (29.2%) or employed (43.9%) and had less education (47.8% did not have any college experience). The sample was roughly equally composed of Black (46.3%) and White (46.1%) participants. Because a good number of the participants were outpatients initially recruited from a local mental health services organization, these participants reported a relatively high level of psychopathology. In the current sample, 46.8% of participants (n = 191) answered “yes” to one or more of these three questions: “Are you currently receiving psychological counseling/therapy for mental health issues?” “Have you received psychological counseling/therapy for mental health issues in the past?” “Are you currently taking medications to treat a mental illness?”
Assessment Measures
Self-Report Questionnaires
Inventory of Depression and Anxiety Symptoms (Watson et al., 2007; Watson, O’Hara, Chmielewski, et al., 2008)
As discussed earlier, the 64-item IDAS provides multidimensional assessment of depression and anxiety symptoms. Participants answered the items using a 5-point scale ranging from not at all to extremely, indicating how much they had experienced each symptom during the past 2 weeks. Across the samples used in the present analysis, coefficient alpha values for the IDAS scales ranged from .74 to .92, with the majority falling in the .80 to .89 range; average interitem correlations ranged from .28 to .73, with most falling in the .35 to .60 range (for further data establishing the reliability and validity of the IDAS scales in the current samples, see O’Hara et al., 2012; Watson et al., 2007; Watson et al., 2012; Watson, O’Hara, Chmielewski, et al., 2008). Correlations among all IDAS scales in the primary sample are presented in Table 2.
Correlations Among IDAS Scales in the Primary Sample.
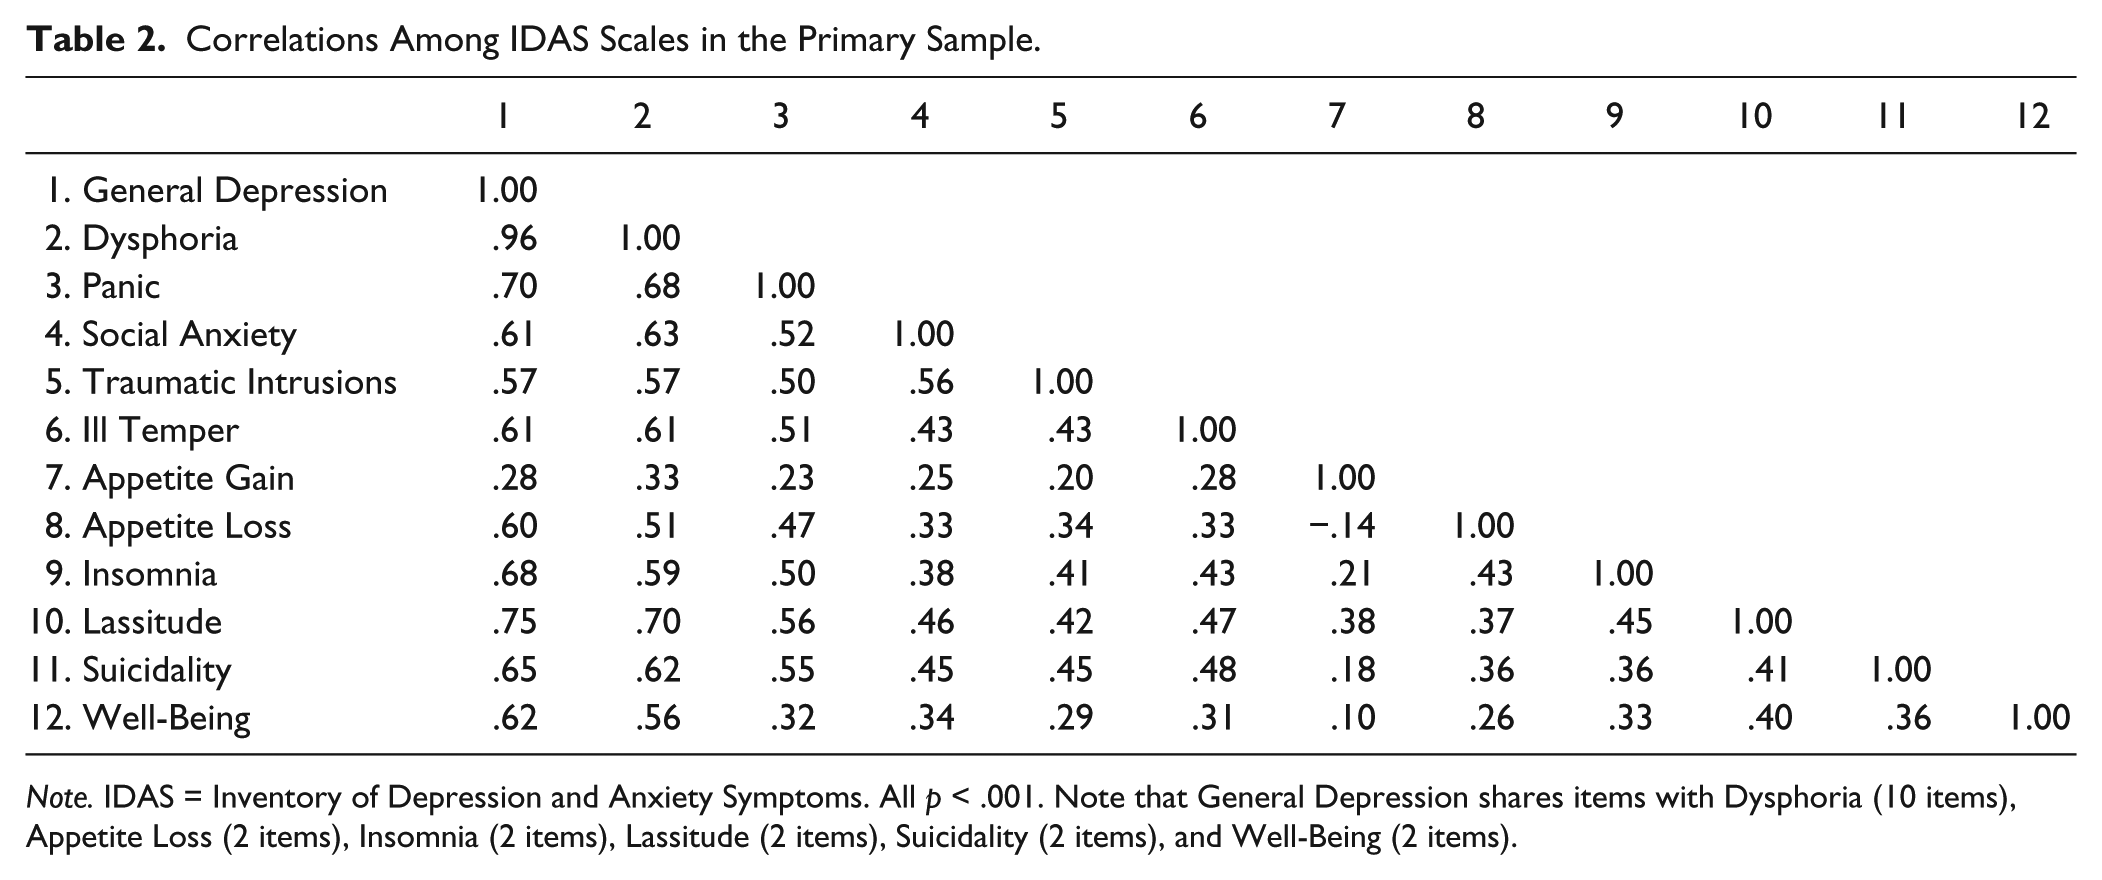
Note. IDAS = Inventory of Depression and Anxiety Symptoms. All p < .001. Note that General Depression shares items with Dysphoria (10 items), Appetite Loss (2 items), Insomnia (2 items), Lassitude (2 items), Suicidality (2 items), and Well-Being (2 items).
Beck Anxiety Inventory (Beck & Steer, 1990)
The BAI is a 21-item measure of anxiety symptoms. Symptoms are rated on a 4-point scale, referencing the past week. Scores range from 0 to 63, with scores over 30 indicating severe anxiety (Beck & Steer, 1990).
Beck Depression Inventory–II (Beck et al., 1996)
The BDI-II is a 21-item measure of depression symptom severity. Symptoms are assessed over the “past 2 weeks.” Scores range from 0 to 63; values over 29 indicate severe depression (Beck et al., 1996).
Center for Epidemiology Studies Depression Scale (Radloff, 1977)
The CES-D is a 20-item depression screen developed to assess depression symptom epidemiology in the general population. Responses are made using a 4-point Likert-type scale over a “past week” timeframe. A score over 15 is indicative of possible clinical depression (Radloff, 1977).
Edinburgh Postnatal Depression Scale (EPDS; Cox & Holden, 2003)
The EPDS assesses depressive symptoms in postpartum women using a 0 to 3 Likert-type scale and “past 7 day” timeframe. A cutoff score of greater than 11 has been used to screen for postpartum depression (Cox & Holden, 2003).
Geriatric Depression Scale (GDS; Yesavage et al., 1983)
The GDS contains 30 true-false items designed to measure depression in older adults. Total scores range from 0 to 30; scores over 19 indicate severe depression (Spreen & Strauss, 1988).
Reynolds Adolescent Depression Scale–2 (RADS-2; Reynolds, 2002)
The RADS-2 is a 30-item screening instrument used to assess the severity of depressive symptomatology in adolescents. Items are rated on a 4-point Likert-type scale. Total scores range from 30 to 120; scores over 76 indicate severe depression.
Clinician-Administered Interviews
Clinician Rating version of the IDAS (IDAS-CR; Watson et al., 2012; Watson, O’Hara, Chmielewski, et al., 2008)
The IDAS-CR is a semistructured interview that provides a clinician rating for each of the 11 nonoverlapping scales from the original IDAS instrument (General Depression is not assessed in this interview). Ratings are made on a 3-point scale (absent, subthreshold, present), asking an initial probe question and standard follow-up questions for each symptom. The IDAS-CR scales have shown strong convergent and discriminant validity relative to their IDAS counterparts (Watson et al., 2012; Watson, O’Hara, Chmielewski et al., 2008).
Hamilton Rating Scale for Depression (HRSD; Hamilton, 1960)
The HRSD is a 17-item clinician-rated scale assessing depression severity. Scores range from 0 to 50, with values over 18 indicating severe depression (Hamilton, 1960). In the present analysis, the HRSD was administered to a subset of the postpartum sample; Watson et al. (2007, Study 3) report an intraclass correlation of .72 for HRSD ratings in this sample.
Mini-International Neuropsychiatric Interview (MINI; Sheehan et al., 1998)
The MINI is a brief semistructured diagnostic interview that provides modular assessment of DSM-IV disorders. An adapted version that incorporated diagnostic changes for DSM-5 was used (with the authorization of the author). 2 The MINI was administered to participants in the generalizability sample. We report on the following MINI modules: panic disorder, posttraumatic stress disorder (PTSD), social anxiety disorder, major depressive disorder (MDD), and generalized anxiety disorder (GAD). The MINI was administered over two sessions. Panic disorder, social anxiety disorder, and PTSD were administered during Session 1; MDD and GAD were administered during Session 2.
Interviewers were graduate students and advanced undergraduate research assistants who underwent extensive training on the MINI, including didactics on DSM criteria, administration of a semistructured interview, and administration of each item in the interview. Each research assistant observed three administrations of the interview by a graduate student and was observed administering the interview on three separate occasions. Each interview was audiotaped and a second rater independently scored 39 of the Session 1 interviews and 34 of the Session 2 interviews (due to audiotape problems, n = 38 and 33, respectively, for some disorders). Kappas for all ratings were in the excellent range, with values ranging from .77 to 1.00 (Cicchetti, 1994).
Structured Clinical Interview for DSM–IV (SCID-IV; First, Spitzer, Gibbon, & Williams, 2002)
The SCID-IV is a clinician-administered semistructured interview for making Axis I DSM-IV-TR diagnoses. The SCID-IV was administered in a subset of the primary sample. Interviewers were trained staff members with a background in clinical/counseling psychology or public health (see Watson et al., 2012; Watson, O’Hara, Chmielewski, et al., 2008). We report on the MDD, PTSD, panic disorder, social phobia, specific phobia, and GAD modules.
To assess interrater reliability, within-sample SCID-IV interviews were audiotaped and a subset was scored independently by a second interviewer. The results indicate good to excellent interrater reliability. For example, Watson, O’Hara, Chmielewski et al. (2008) reported interrater reliability kappa values of .95 (MDD), .87 (social phobia), .86 (PTSD), .84 (panic disorder), .80 (specific phobia), and .70 (GAD). In addition, Watson et al. (2012) reported kappas of 1.00 (GAD), 1.00 (PTSD), .96 (social phobia), .92 (MDD), and .83 (panic disorder).
Data Analysis
Analyses were conducted using IBM SPSS Statistics for Windows, Version 23. Missing data at the item level were minimal (approximately 0.2% of IDAS item responses were missing across samples) and were addressed with multiple imputation (using SAS Proc MI) prior to computing composite scores. Only participants who completed the corresponding measures for a given analysis were included in each analysis; thus, Ns vary across analyses.
Test Performance
In order to examine how well an IDAS scale discriminated between the presence versus absence of a disorder (e.g., IDAS Social Anxiety scale identifying SCID-IV diagnosis of social phobia), we used receiver operating characteristic (ROC) analyses, which plot sensitivity versus 1-specificity. In the context of ROC analyses, the area under the curve (AUC) is examined, and provides a quantitative measure of discrimination between presence and absence of a criterion. Generally, AUC values of .5 indicate no discrimination, between .70 and .80 are considered adequate discrimination, between .80 and .90 good discrimination, and ≥.90 excellent discrimination (Hosmer & Lemeshow, 2000). We therefore examined the 95% confidence interval (CI) of the AUC, and only considered test performance to be adequate if the lower bound of the 95% CI did not fall below .70. A comprehensive approach to the ROC analyses was adopted, such that we examined the AUC values for every combination of IDAS scale and SCID-IV diagnosis; this enabled us to examine patterns of diagnostic specificity for each scale. That is, we could examine whether a particular IDAS scale uniquely identified the presence versus absence of a single SCID-IV diagnosis, or was useful for detecting a range of SCID-IV diagnoses. In addition to investigating the ability of each IDAS scale to detect SCID-IV diagnoses, we also investigated the ability of each scale to detect (a) its corresponding IDAS-CR rating and (b) elevated scores (i.e., scores that fall above the “severe” threshold) on self-report symptom instruments widely used in clinical settings to assess the presence and severity of depression and anxiety symptoms (BDI-II, CES-D, EPDS, RADS, HRSD, BAI, GDS).
Cutoff Scores
Optimal clinical cutoff scores were determined using the SCID-IV as a reference point, as the SCID represents the gold-standard instrument for clinical diagnosis (Cook et al., 2007). We calculated cutoff scores for the broad Dysphoria and General Depression scales, as well as for three of the specific scales that had corresponding diagnoses in our data (i.e., IDAS Panic detecting panic disorder diagnoses, IDAS Social Anxiety detecting social phobia diagnoses, IDAS Traumatic Intrusions detecting PTSD diagnoses). In each of those cases, cutoff scores were calculated only if test performance previously was shown to be adequate (i.e., 95% CI exceeded .70) for detecting the SCID-IV diagnosis.
Youden’s (1950) index was computed to determine the difference between the true positive rate (sensitivity) and false positive rate (1-specificity). The maximum value of the Youden’s index indicates the cutoff score that optimizes the measure’s ability to differentiate between the presence and absence of a diagnosis, giving equal weight to sensitivity and specificity. We considered this the balanced cutoff, which was deemed optimal for discriminating between those who met diagnostic criteria for a disorder and those who did not. In addition, separate cutoff scores for diagnosis and screening were computed (e.g., Olofsdotter et al., 2015). The diagnostic cutoff maximizes specificity and represents the lowest score with a minimum specificity of .90. The screening cutoff maximizes sensitivity and represents the highest score with minimum sensitivity of .90. As such, the diagnostic cutoff is more conservative, maximizing diagnostic accuracy, whereas the screening cutoff is more liberal, decreasing the chances that someone who actually meets diagnostic criteria is missed during the screening process, but at the cost of some diagnostic precision.
Severity Ranges
In order to establish severity ranges for the IDAS scales, T score values (M = 50, SD = 10) were selected to facilitate interpretation of scale scores. For descriptive purposes, we categorized participants using ranges in keeping with prior research (e.g., Butcher, Dahlstrom, Graham, Tellegen, & Kaemmer, 1989; Clark, Simms, Wu, & Casillas, 2014); IDAS scale scores corresponding to T scores of 75 (99th percentile) were labeled severe, scores of 65 (94th percentile) were labeled as moderate, and scores of 55 (70th percentile) were labeled as mild.
Results
Aim 1: Test performance
Primary Analyses
We examined the AUC values for each IDAS scale and each SCID-IV diagnosis in the primary sample (Table 3). We anticipated that we would find strong AUC values for those specific IDAS scales with a corresponding SCID-IV diagnosis (e.g., we expected strong AUC values for IDAS Panic detecting the presence or absence of a SCID-IV diagnosis of panic disorder). In addition, based on previous research, we anticipated that the broad IDAS Dysphoria and General Depression scales would demonstrate the strongest test performance for detecting SCID-IV diagnoses of MDD and GAD (Watson et al., 2007), but would also prove useful for detecting other SCID-IV diagnoses, given their content represents the core features underlying the internalizing disorders. As the remaining IDAS scales did not have unique SCID-IV counterparts, we did not have a priori hypotheses about their test performance; these analyses were exploratory in nature.
Area Under the Curve (AUC) Estimates for SCID-IV and IDAS-CR Ratings in the Primary Sample.
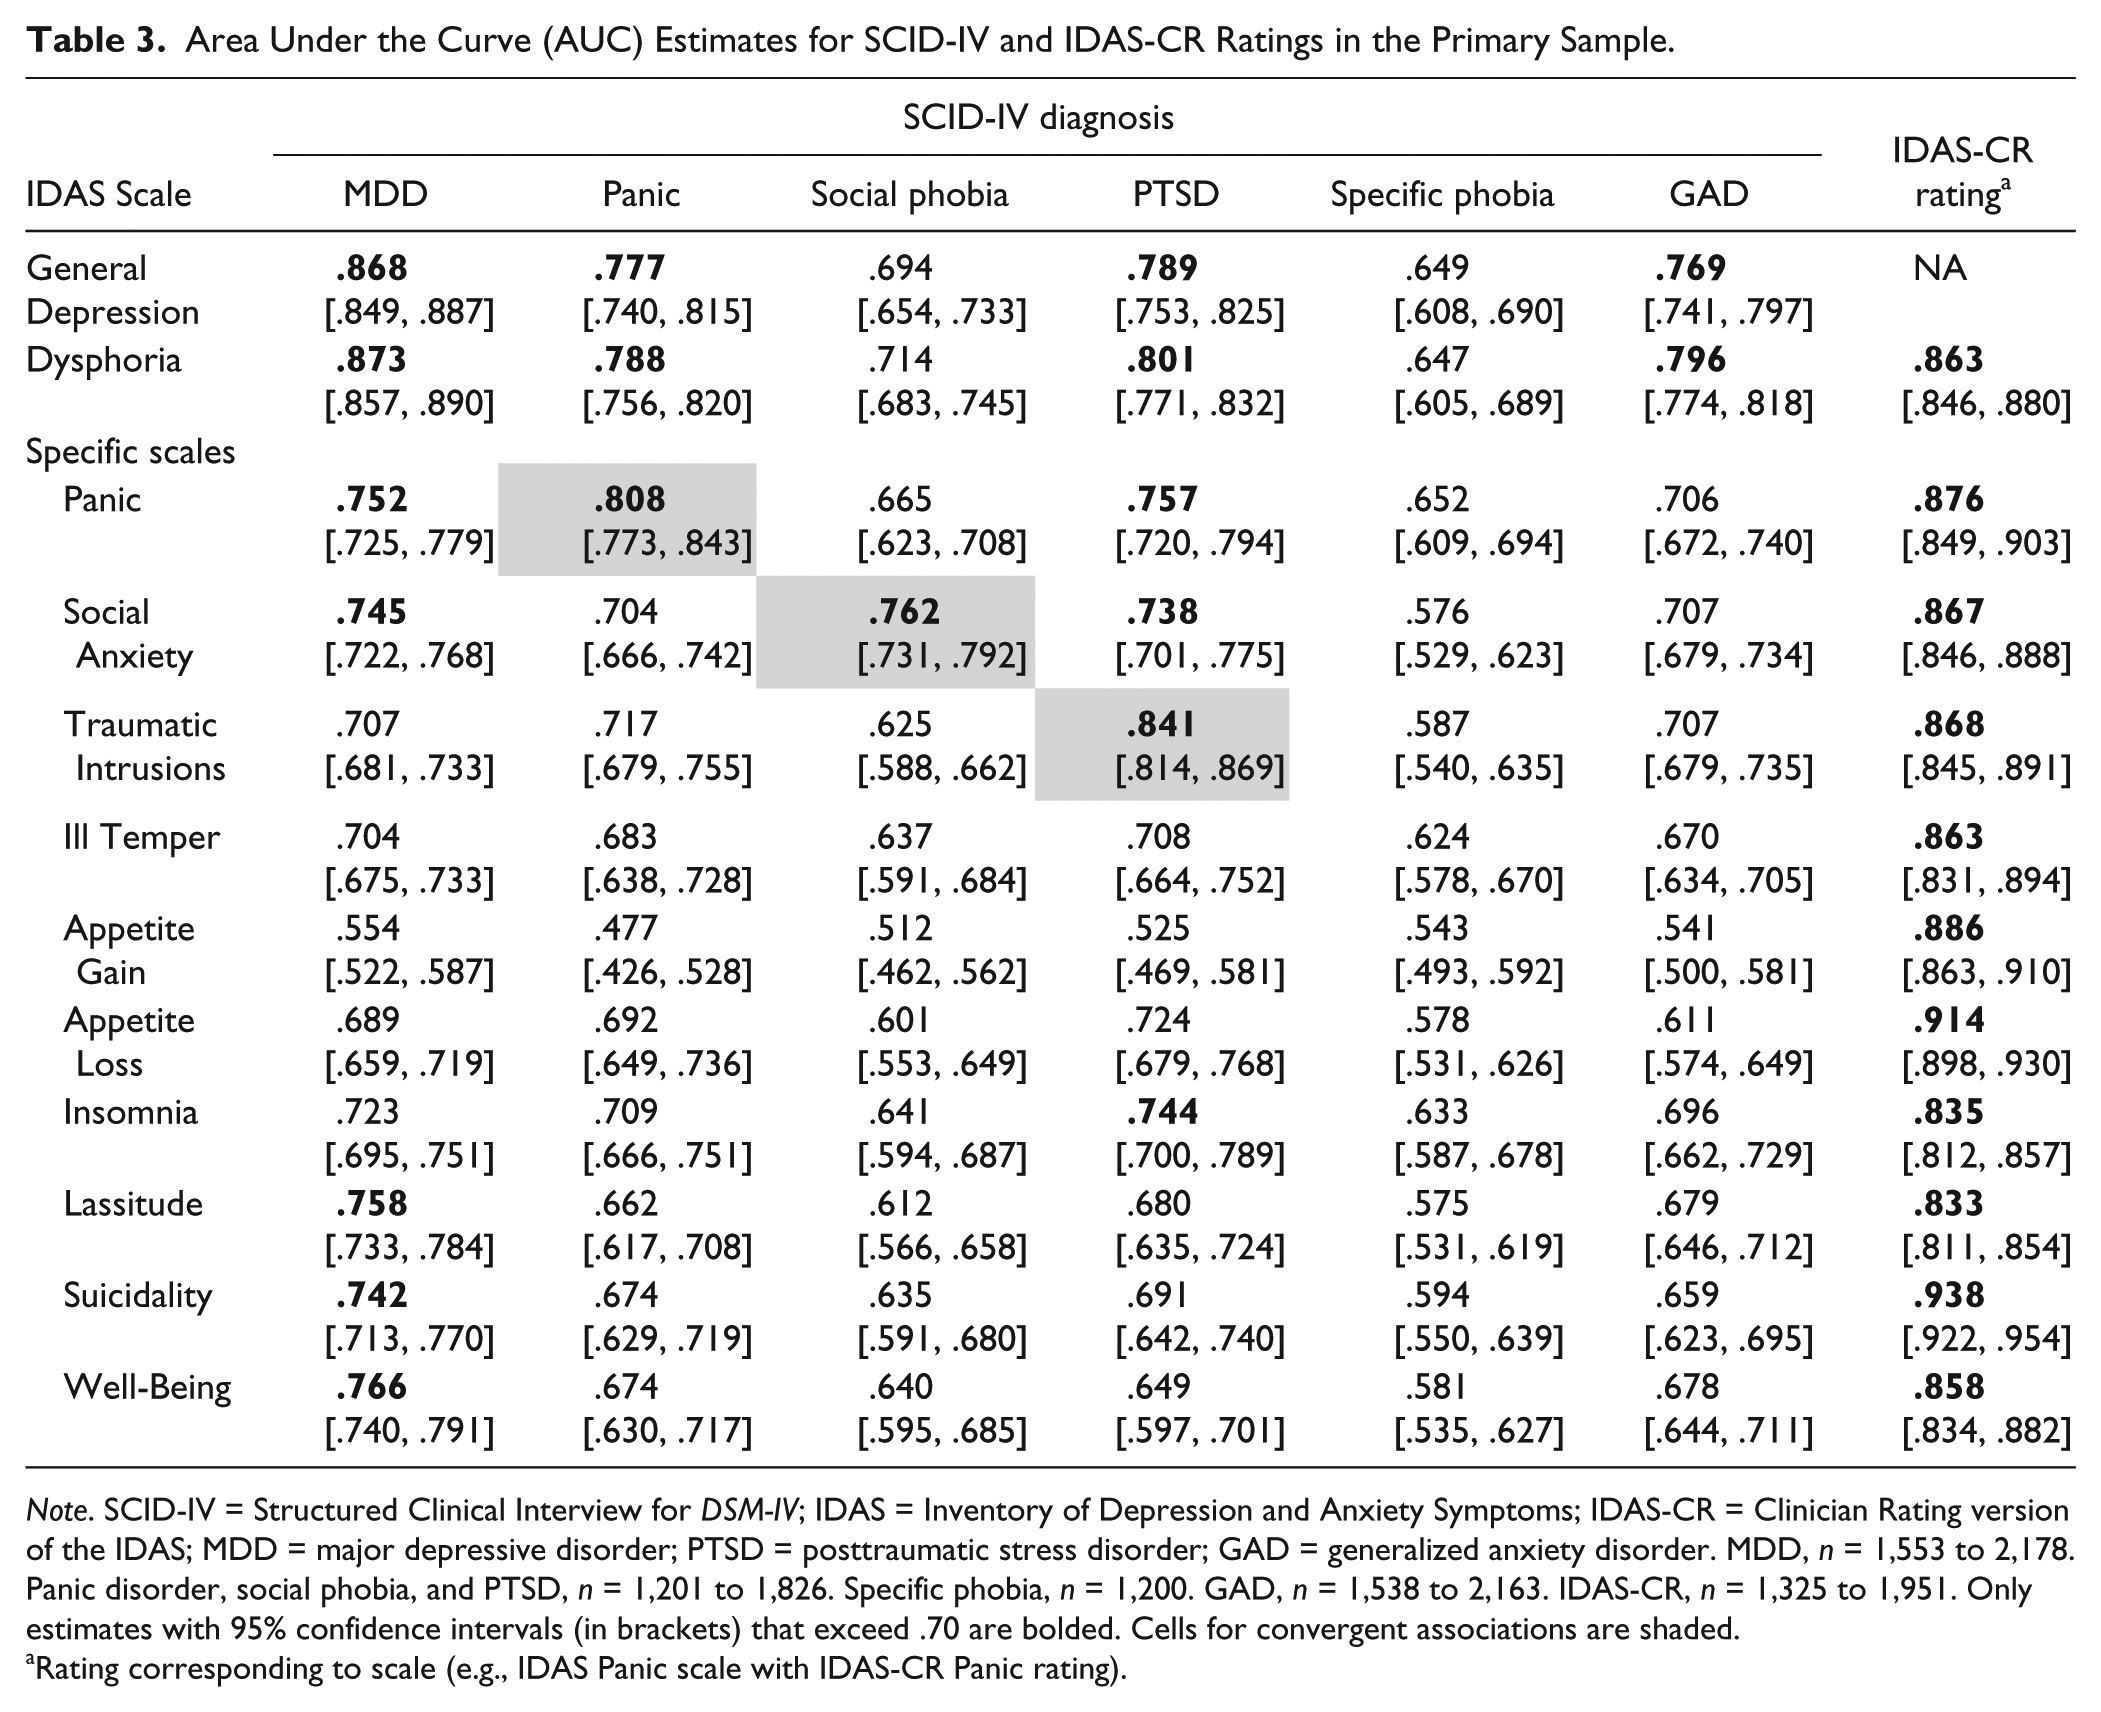
Note. SCID-IV = Structured Clinical Interview for DSM-IV; IDAS = Inventory of Depression and Anxiety Symptoms; IDAS-CR = Clinician Rating version of the IDAS; MDD = major depressive disorder; PTSD = posttraumatic stress disorder; GAD = generalized anxiety disorder. MDD, n = 1,553 to 2,178. Panic disorder, social phobia, and PTSD, n = 1,201 to 1,826. Specific phobia, n = 1,200. GAD, n = 1,538 to 2,163. IDAS-CR, n = 1,325 to 1,951. Only estimates with 95% confidence intervals (in brackets) that exceed .70 are bolded. Cells for convergent associations are shaded.
Rating corresponding to scale (e.g., IDAS Panic scale with IDAS-CR Panic rating).
As would be expected based on the very strong correlation between them (see Table 2) and item overlap, General Depression and Dysphoria functioned similarly in their ability to detect SCID-IV diagnoses (Table 3). Consistent with prediction, both scales demonstrated good test performance in distinguishing the presence or absence of MDD (AUC = .868 and .873, respectively) and GAD (AUC = .862 and .866). In addition, General Depression and Dysphoria both demonstrated adequate ability to identify PTSD (AUC = .789 and .801) and panic disorder (AUC = .777 and .788). However, they did not identify social phobia (AUC = .694 and .714) or specific phobia (AUC = .649 and .647) well.
Turning to the specific scales, IDAS Panic, Social Anxiety, and Traumatic Intrusions each had their highest AUC values with their respective SCID-IV diagnosis (AUC = .808, .762, and .841, respectively). Although General Depression and Dysphoria also had high AUC values with PTSD and panic disorder, it is notable that the specific scales demonstrated greater diagnostic specificity for detecting their target disorders. For instance, Traumatic Intrusions had a much higher AUC for PTSD (.841) than for any other diagnosis (values ranged from .587 to .717), whereas General Depression and Dysphoria were effective in identifying a broad range of internalizing diagnoses. In order to clarify the diagnostic specificity of these scales further, we ran a series of logistic regression analyses that tested the ability of the specific scales to predict their target diagnoses, above and beyond General Depression and Dysphoria. IDAS Panic was a significant predictor of panic disorder, Social Anxiety of social phobia, and Traumatic Intrusions of PTSD, above and beyond General Depression (all p < .001) and Dysphoria (all p < .001; see Tables S3-S5 in the online supplemental material). Although we did not make any specific predictions regarding the remaining IDAS scales, it is notable that Insomnia evidenced adequate test performance for identifying PTSD (AUC = .744), whereas Lassitude, Suicidality, and Well-Being each adequately detected MDD (AUC = .758, .742, and .766, respectively).
As a comparison point, we also examined the AUC values for the BDI-II and BAI against each of the SCID-IV diagnoses (see Table S6 in the online supplemental material). Similar to IDAS General Depression and Dysphoria, we anticipated the BDI-II to be strongly related to MDD diagnoses given its assessment of the core symptoms of depression. Given that the BAI has been found to consist of two factors—Somatic Anxiety (e.g., numbness, dizziness, trembling, feeling faint) and Anxious Affect (e.g., feeling nervous, fear of the worst)—which correlate strongly with panic symptoms and general distress, respectively (Watson et al., 2017), we expected BAI scores to be associated with panic disorder, GAD, and MDD diagnoses.
The BDI-II was borderline acceptable for identifying MDD (AUC = .717, CI [682, .752]), performing more poorly than the IDAS General Depression and Dysphoria scales. Whereas the BAI performed poorly for identifying GAD (AUC = .631, CI [.582, .679]) and MDD (AUC = .608, CI [.571, .645]), it was an adequate predictor of panic disorder diagnoses (AUC = .790, CI [.724, .856]), performing similarly to the IDAS Panic scale. As would be expected given their specific content, each of the IDAS specific scales represented the best predictor of its associated diagnosis (i.e., panic disorder, social phobia, PTSD) relative to the BDI-II and BAI. In sum, the IDAS General Depression and Dysphoria scales provide stronger prediction of MDD and GAD diagnoses than do the BDI-II and BAI, respectively, and both IDAS Panic and the BAI predict panic disorder well. The specific IDAS scales additionally provide good detection of social phobia and PTSD, content not specifically assessed by the BDI-II or BAI.
To examine the potential moderation of population type on scale performance, we conducted separate AUC analyses in the three subgroups that included SCID-IV data (i.e., patients, students, postpartum women). Results are presented in Tables S7 to S9 in the online supplemental material. The general pattern of relations between the IDAS scales and SCID-IV diagnoses was similar across subgroups, in that the scales identified their expected diagnoses in most cases regardless of sample type. In terms of AUC performance, the IDAS scales demonstrated stronger specificity in the patients relative to the students. For instance, in the patient subgroup, General Depression and Dysphoria had adequate AUC values only for MDD diagnoses, whereas in the students, the AUC values were elevated for MDD, panic disorder, PTSD, and GAD. Similarly, although IDAS Panic, Social Anxiety, and Traumatic Intrusions each had their highest AUC value with their associated diagnosis, their AUC values also were significant for identifying other disorders in the students. For example, Social Anxiety also had adequate to good AUC values for identifying MDD, panic disorder, and GAD. MDD and GAD were the only diagnoses assessed in the postpartum sample; General Depression and Dysphoria both had good AUC values for detecting MDD and adequate values for detecting GAD.
Next, we examined the AUC values for each IDAS scale detecting its IDAS-CR counterpart (reported in the final column of Table 3). As expected, each IDAS scale evidenced adequate to excellent test performance for identifying its associated IDAS-CR rating; AUC values ranged from .774 to .938, with a median value of .867. There is no IDAS-CR score associated with IDAS General Depression; therefore, we did not examine the AUC values for General Depression in relation to the IDAS-CR.
To further evaluate the test performance of the IDAS scales, we examined whether each scale could adequately detect elevated scores on clinical instruments assessing depression and anxiety severity (Table 4). Several notable patterns emerged. First, General Depression and Dysphoria both were excellent predictors of elevations on all of these measures, providing evidence of their broad coverage of the core symptoms of the mood and anxiety disorders. There was little variability in AUC values across instruments, although it is noteworthy that both scales did have their strongest AUC values with measures of depression.
Area Under the Curve (AUC) Estimates for Elevated Scores on Instruments.
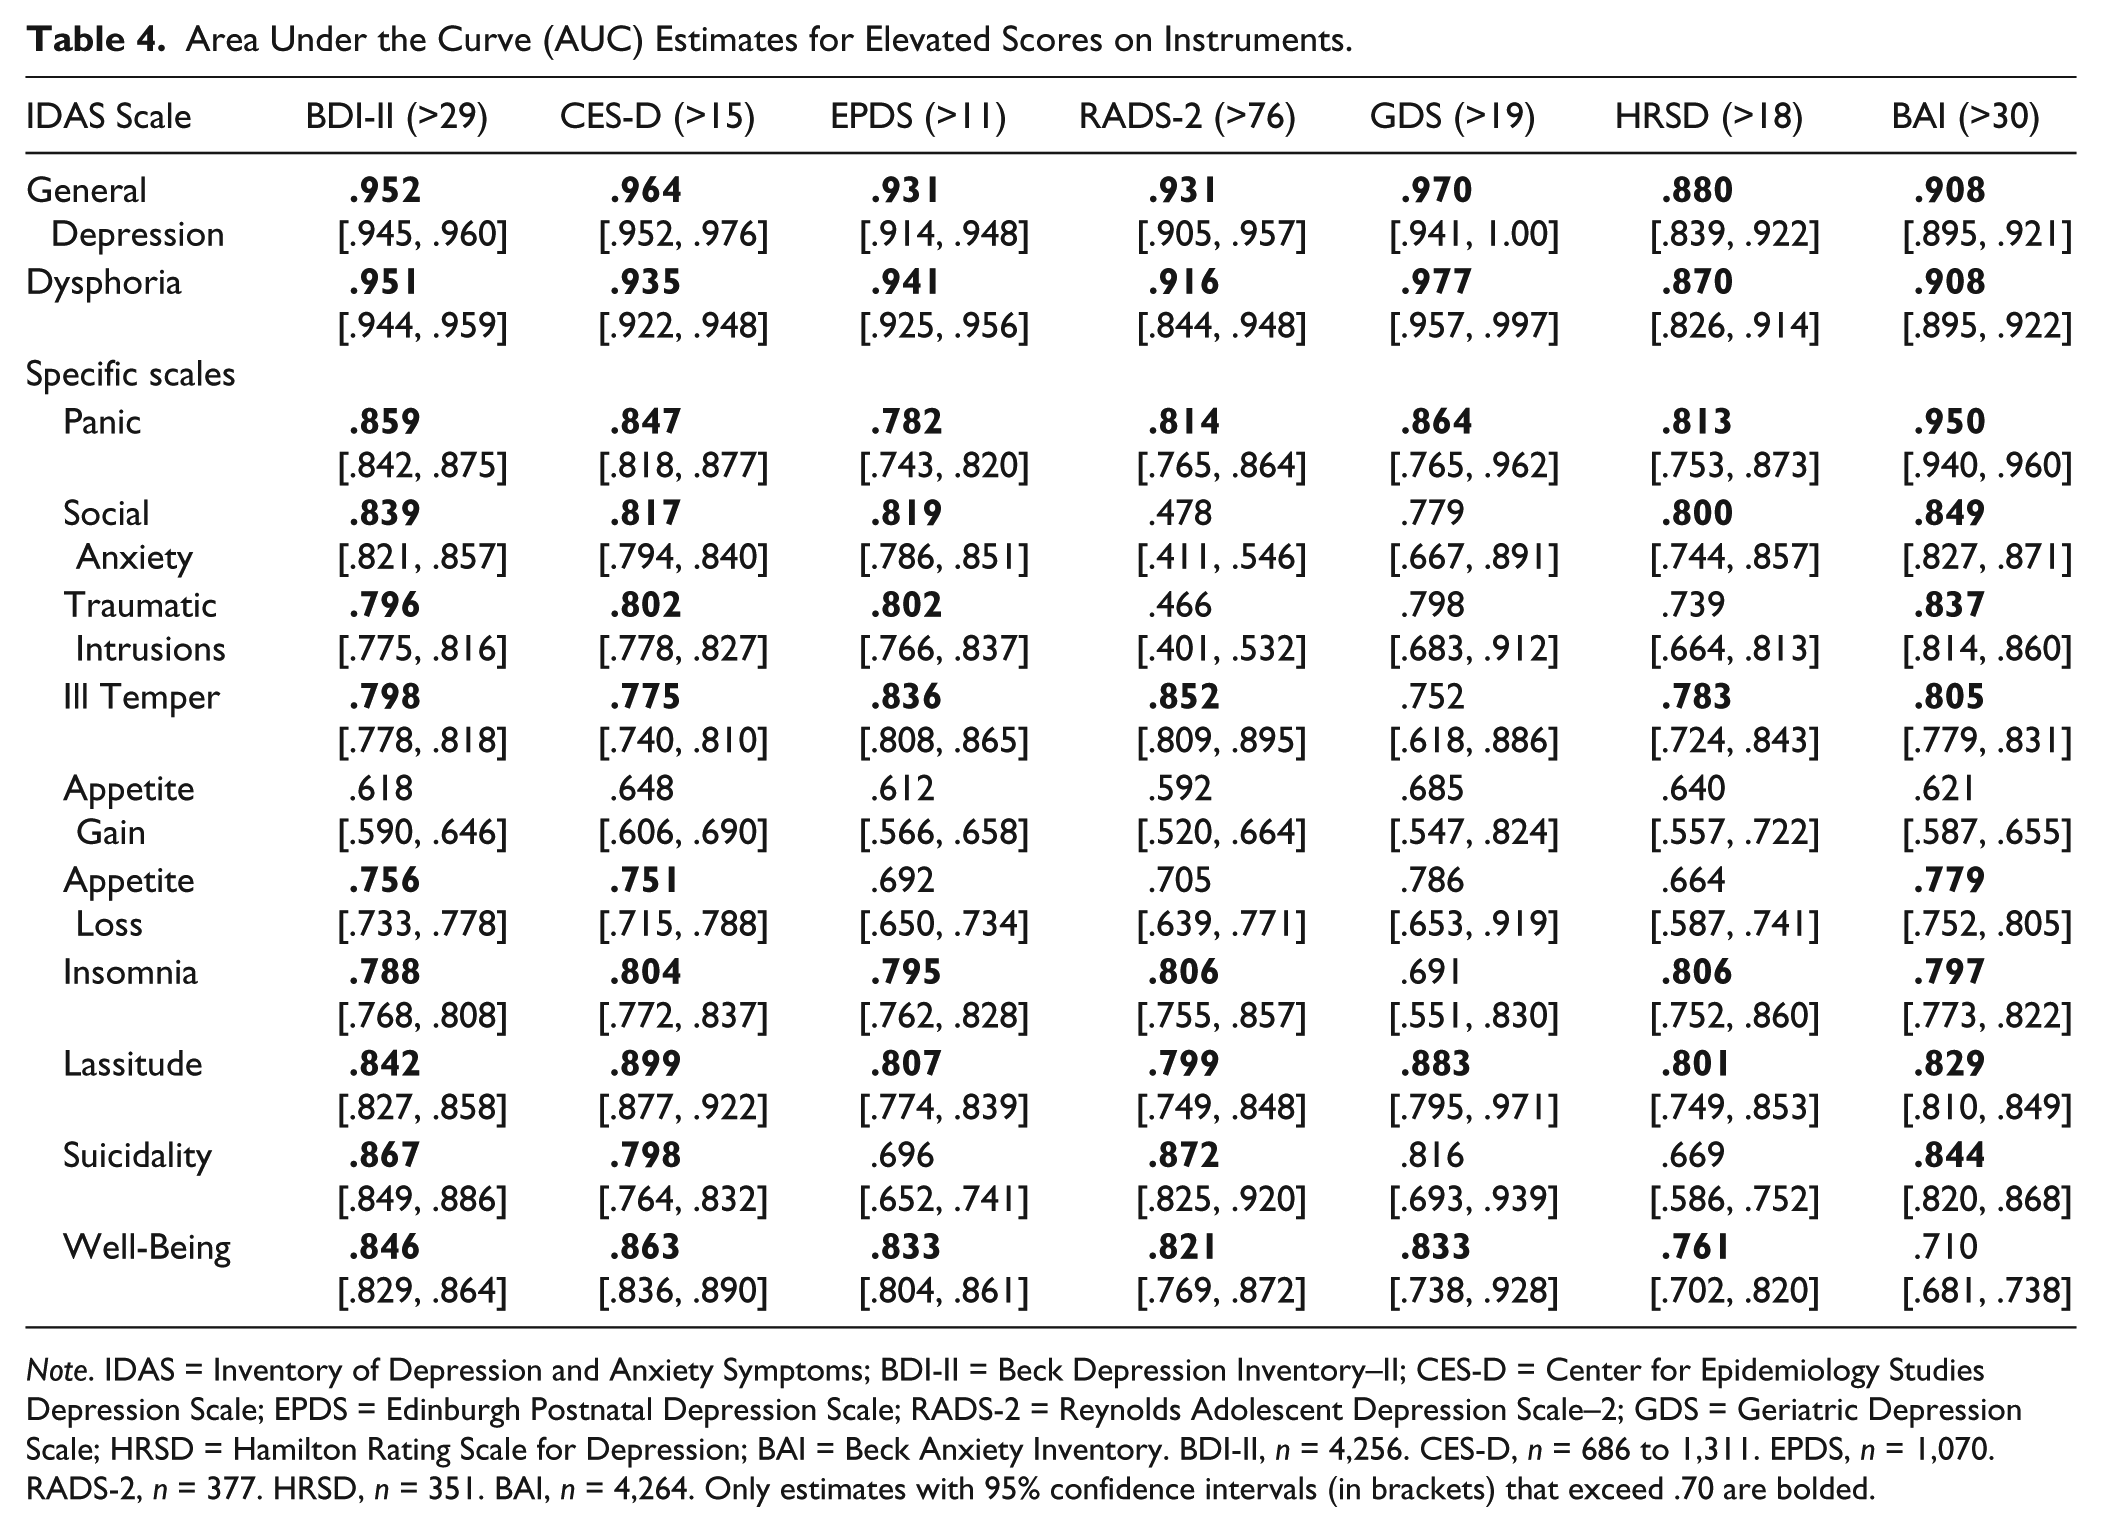
Note. IDAS = Inventory of Depression and Anxiety Symptoms; BDI-II = Beck Depression Inventory–II; CES-D = Center for Epidemiology Studies Depression Scale; EPDS = Edinburgh Postnatal Depression Scale; RADS-2 = Reynolds Adolescent Depression Scale–2; GDS = Geriatric Depression Scale; HRSD = Hamilton Rating Scale for Depression; BAI = Beck Anxiety Inventory. BDI-II, n = 4,256. CES-D, n = 686 to 1,311. EPDS, n = 1,070. RADS-2, n = 377. HRSD, n = 351. BAI, n = 4,264. Only estimates with 95% confidence intervals (in brackets) that exceed .70 are bolded.
Second, the three anxiety scales (Panic, Social Anxiety, Traumatic Intrusions) detected elevated scores on several measures; however, each of the anxiety scales had their strongest AUC value in relation to elevated BAI scores, demonstrating specificity to the assessment of anxiety symptoms. Third, Ill Temper and Suicidality also were able to identify elevations on most instruments, but both had their strongest AUC values with RADS-2 scores. Fourth, Insomnia, Lassitude, and Well-Being also were able to identify elevations on all criteria. Fifth, neither of the appetite disturbance scales was strongly associated with severity scores; Appetite Gain did not detect any criterion, and Appetite Loss only adequately detected scores on three instruments (with its strongest association being the BAI).
Generalizability Analyses
Results of the AUC analyses in the generalizability sample generally mirror the associations found in the primary sample, with a few exceptions. The IDAS scales performed better overall in predicting MINI diagnoses in the generalizability sample; the AUC values in this sample were higher than those of the primary sample in nearly every case (see Table 5). General Depression and Dysphoria again demonstrated good to excellent test performance in detecting MDD (AUC = .911 and .903, respectively) and GAD (AUC = .854 and .857). In addition, both scales demonstrated good ability to identify panic disorder (AUC = .811 and .827), PTSD (AUC = .852 and .843), and social phobia (AUC = .789 and .787).
Area Under the Curve (AUC) Estimates for DSM-5 MINI Diagnosis in the Generalizability Sample.
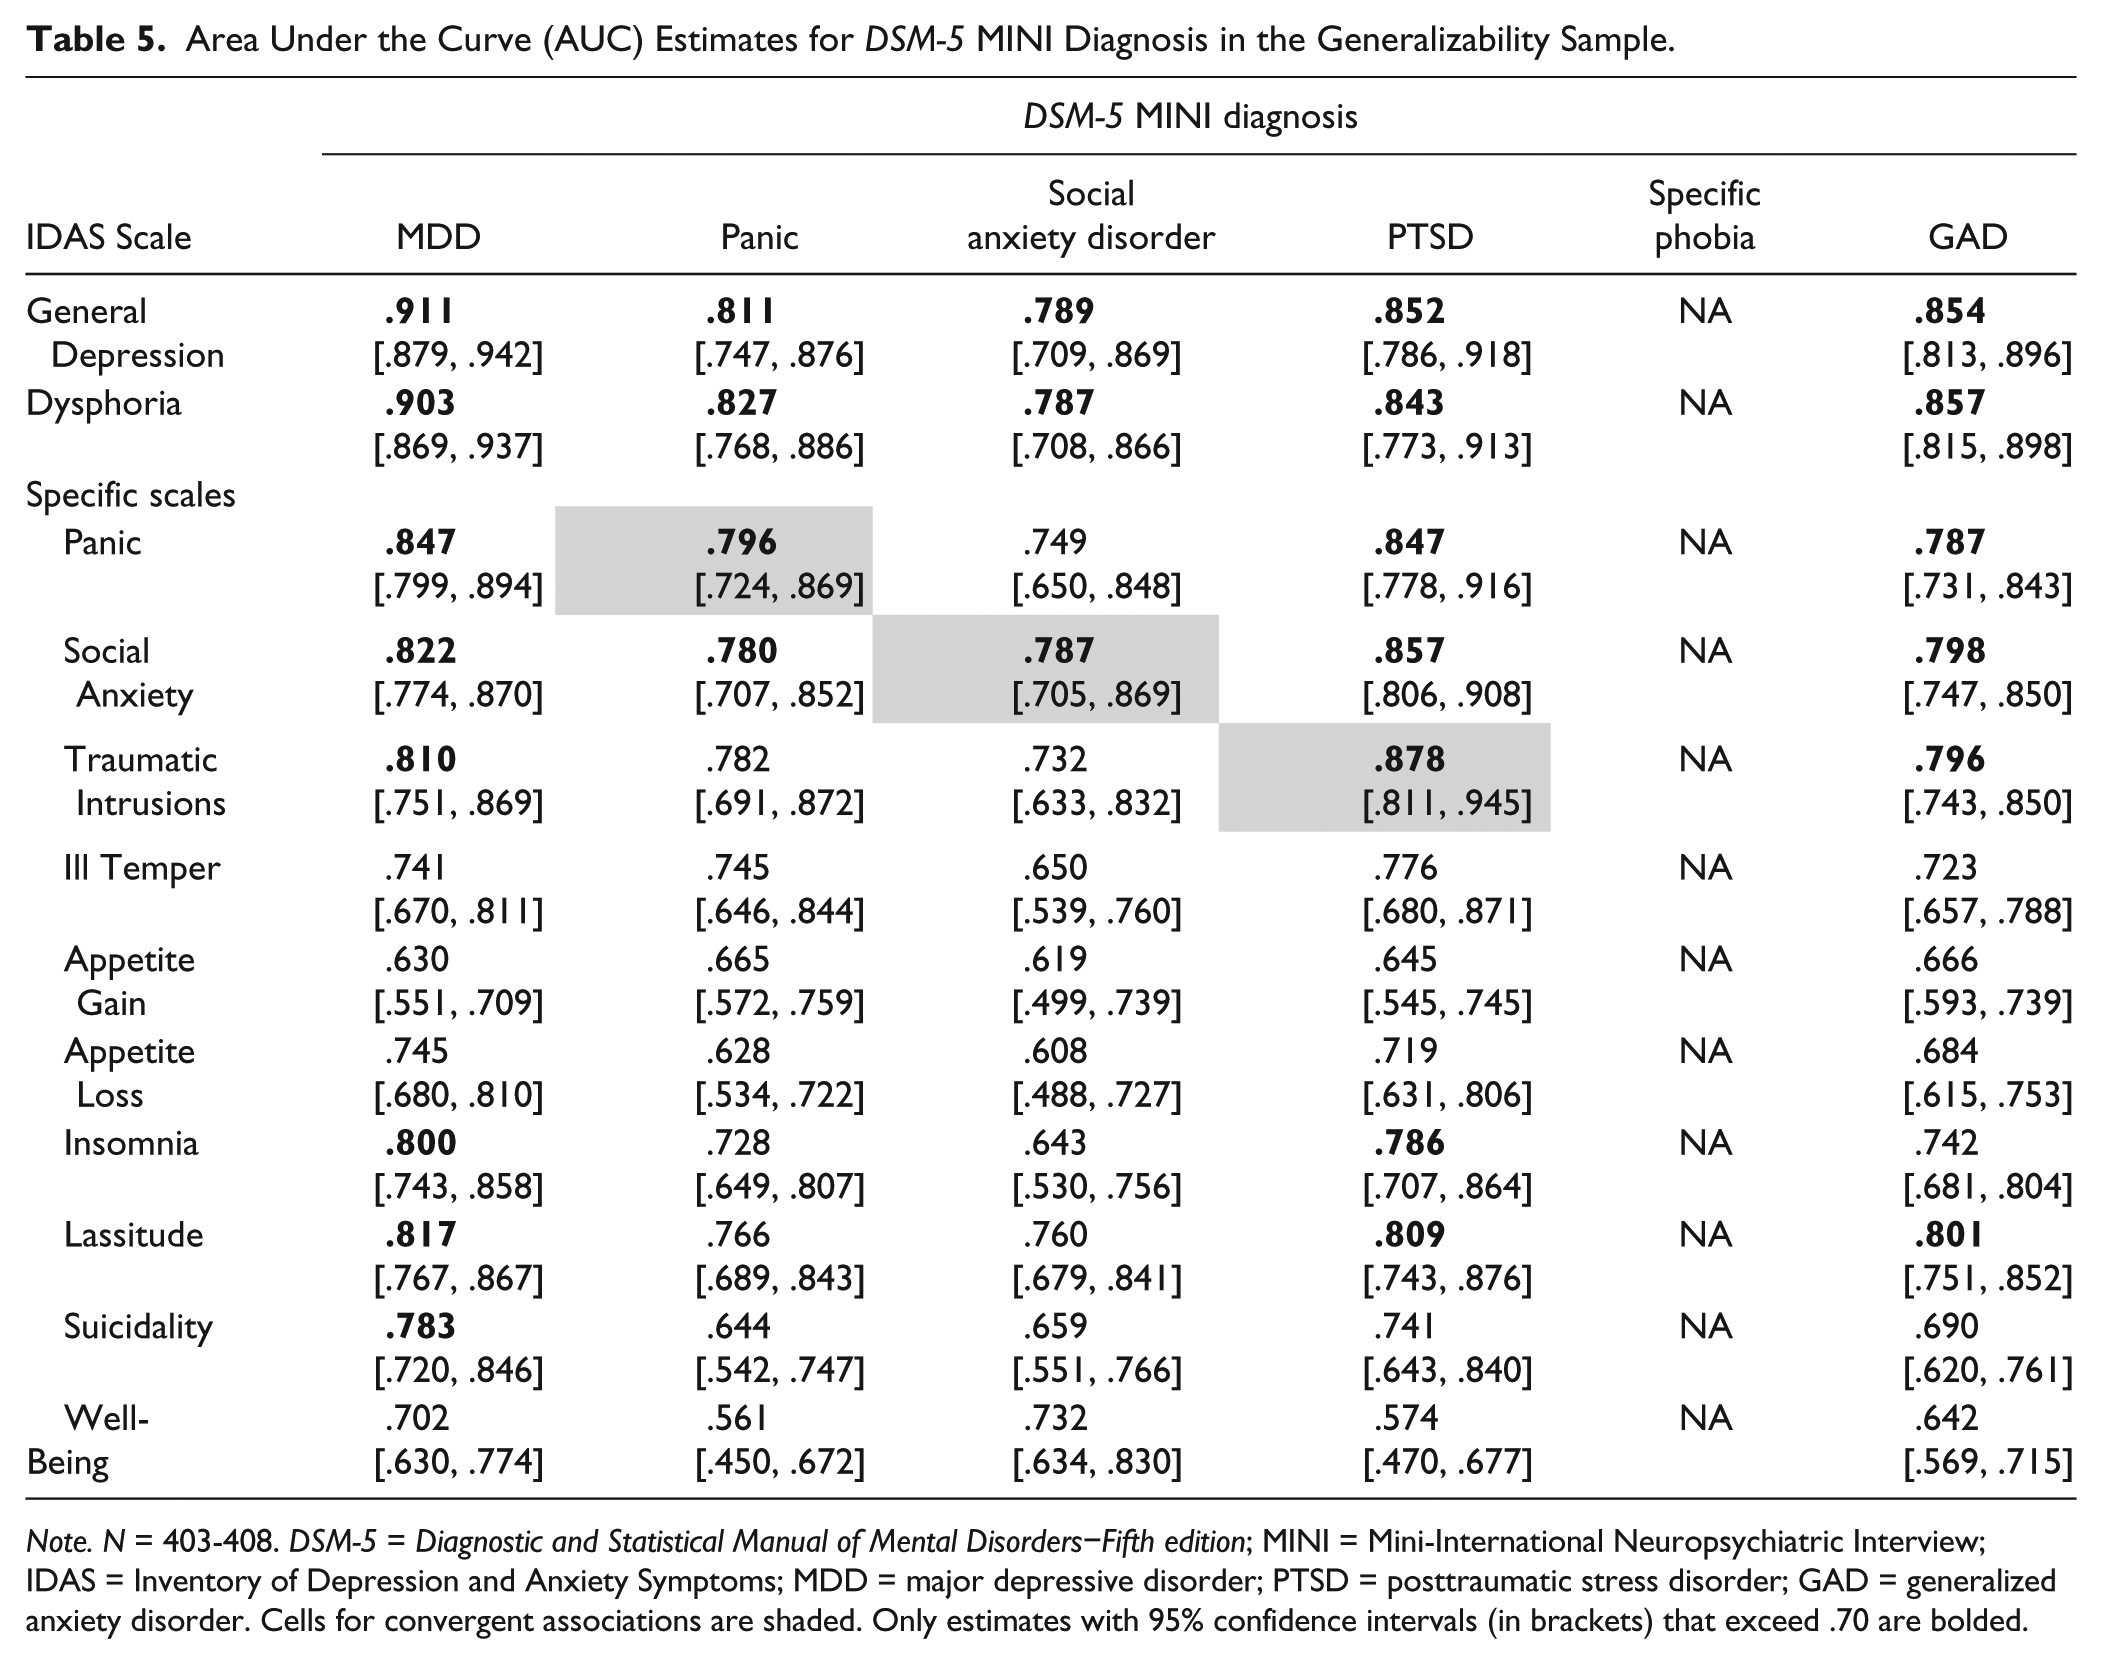
Note. N = 403-408. DSM-5 = Diagnostic and Statistical Manual of Mental Disorders−Fifth edition; MINI = Mini-International Neuropsychiatric Interview; IDAS = Inventory of Depression and Anxiety Symptoms; MDD = major depressive disorder; PTSD = posttraumatic stress disorder; GAD = generalized anxiety disorder. Cells for convergent associations are shaded. Only estimates with 95% confidence intervals (in brackets) that exceed .70 are bolded.
In terms of the specific scales, Traumatic Intrusions had strong ability to predict MINI diagnoses and demonstrated specificity, such that its strongest AUC value (.878) was with PTSD. Social Anxiety and Panic also were strong predictors of their associated MINI diagnoses (AUC = .796 and .796, respectively), however, both scales also had strong AUC values with MDD and PTSD diagnoses.
To further examine the generalizability of our findings, we separated the sample by race. Supplemental Tables S10 and S11 present results of the AUC analyses in White and Black participants, respectively. Similar patterns of relations were seen in both the White participants and Black participants, generally reflecting the pattern seen in the overall generalizability sample. Thus, the present findings replicate well (a) in a sample that is less demographically homogeneous; (b) across two specific racial groups; and (c) using DSM-5 criteria.
Aim 2: Clinical Cutoff Scores
Cutoff scores on the General Depression and Dysphoria scales are provided for each diagnosis with an acceptable AUC; for both scales, cutoff scores therefore are provided for MDD, panic disorder, PTSD, and GAD (see Tables 6 and 7). As described, three cutoff scores are provided—diagnostic, balanced, and screening—to be used based on the nature of the assessment. For instance, a cutoff score of 55.5 on the General Depression scale for identifying MDD had the best balance of sensitivity (.79) and specificity (.79); thus, IDAS scores ≥56 on General Depression represent the balanced screening cutoff. Likewise, General Depression scores ≥65 represent the diagnostic cutoff and scores ≥47 represent the screening cutoff.
Performance and Cutoff Scores of IDAS General Depression Scale and Utility of Predicting Multiple Internalizing Disorders.
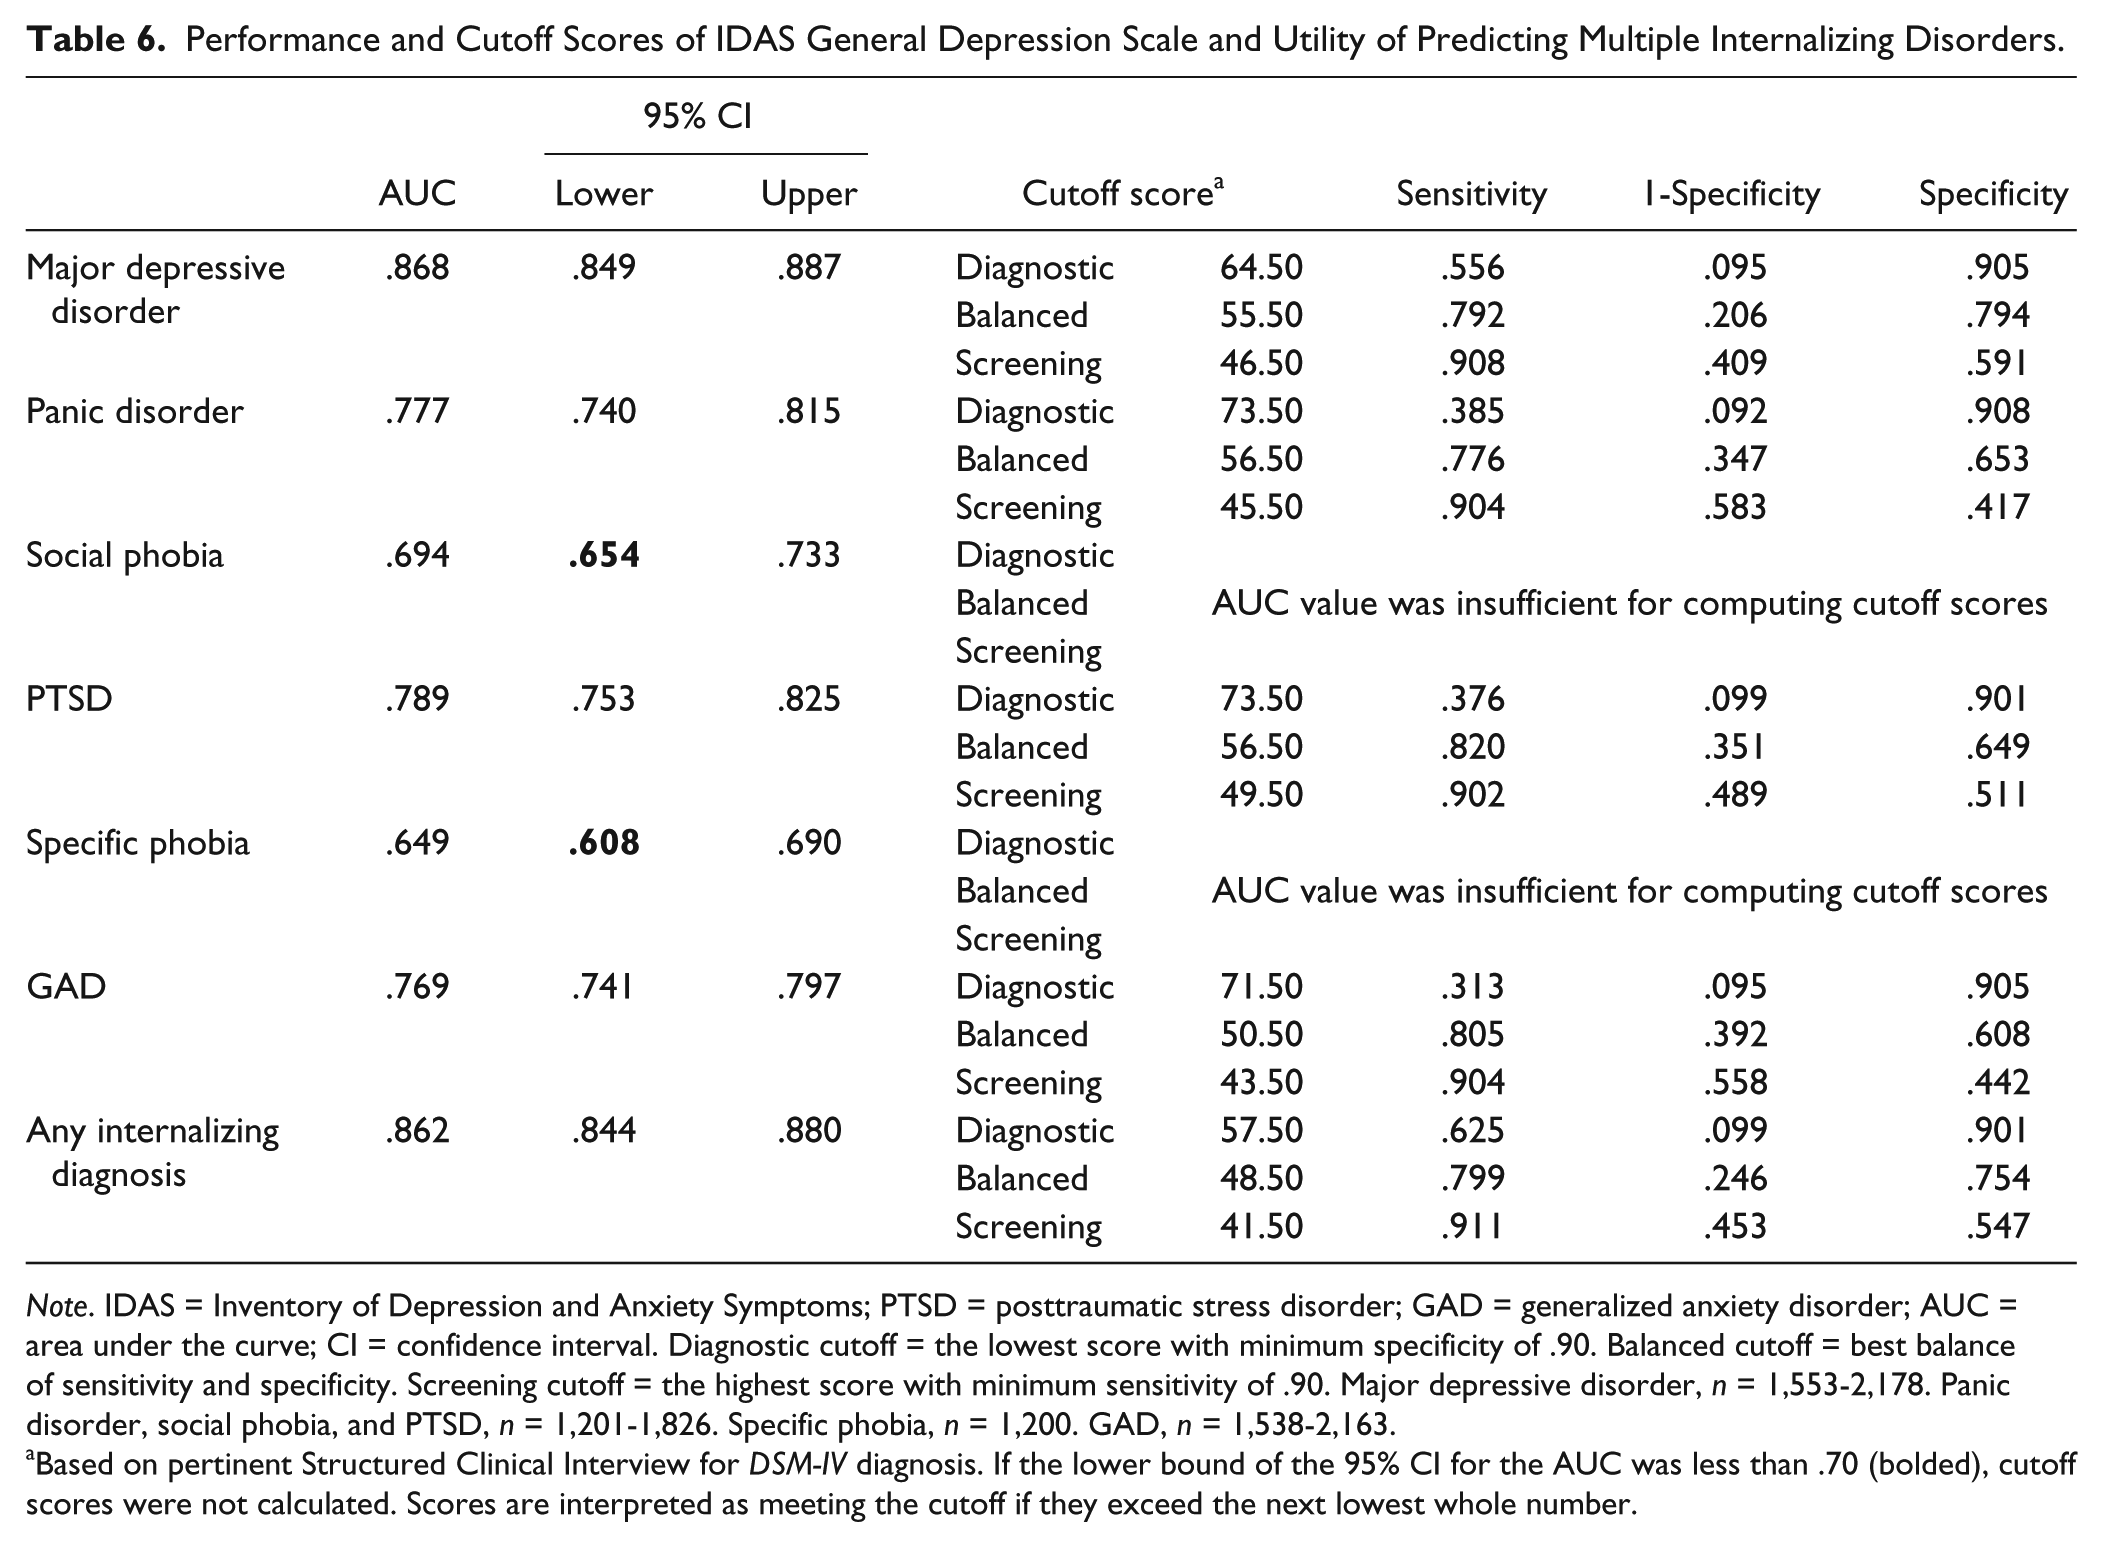
Note. IDAS = Inventory of Depression and Anxiety Symptoms; PTSD = posttraumatic stress disorder; GAD = generalized anxiety disorder; AUC = area under the curve; CI = confidence interval. Diagnostic cutoff = the lowest score with minimum specificity of .90. Balanced cutoff = best balance of sensitivity and specificity. Screening cutoff = the highest score with minimum sensitivity of .90. Major depressive disorder, n = 1,553-2,178. Panic disorder, social phobia, and PTSD, n = 1,201-1,826. Specific phobia, n = 1,200. GAD, n = 1,538-2,163.
Based on pertinent Structured Clinical Interview for DSM-IV diagnosis. If the lower bound of the 95% CI for the AUC was less than .70 (bolded), cutoff scores were not calculated. Scores are interpreted as meeting the cutoff if they exceed the next lowest whole number.
Performance and Cutoff Scores of IDAS Dysphoria Scale and Utility of Predicting Multiple Internalizing Disorders.
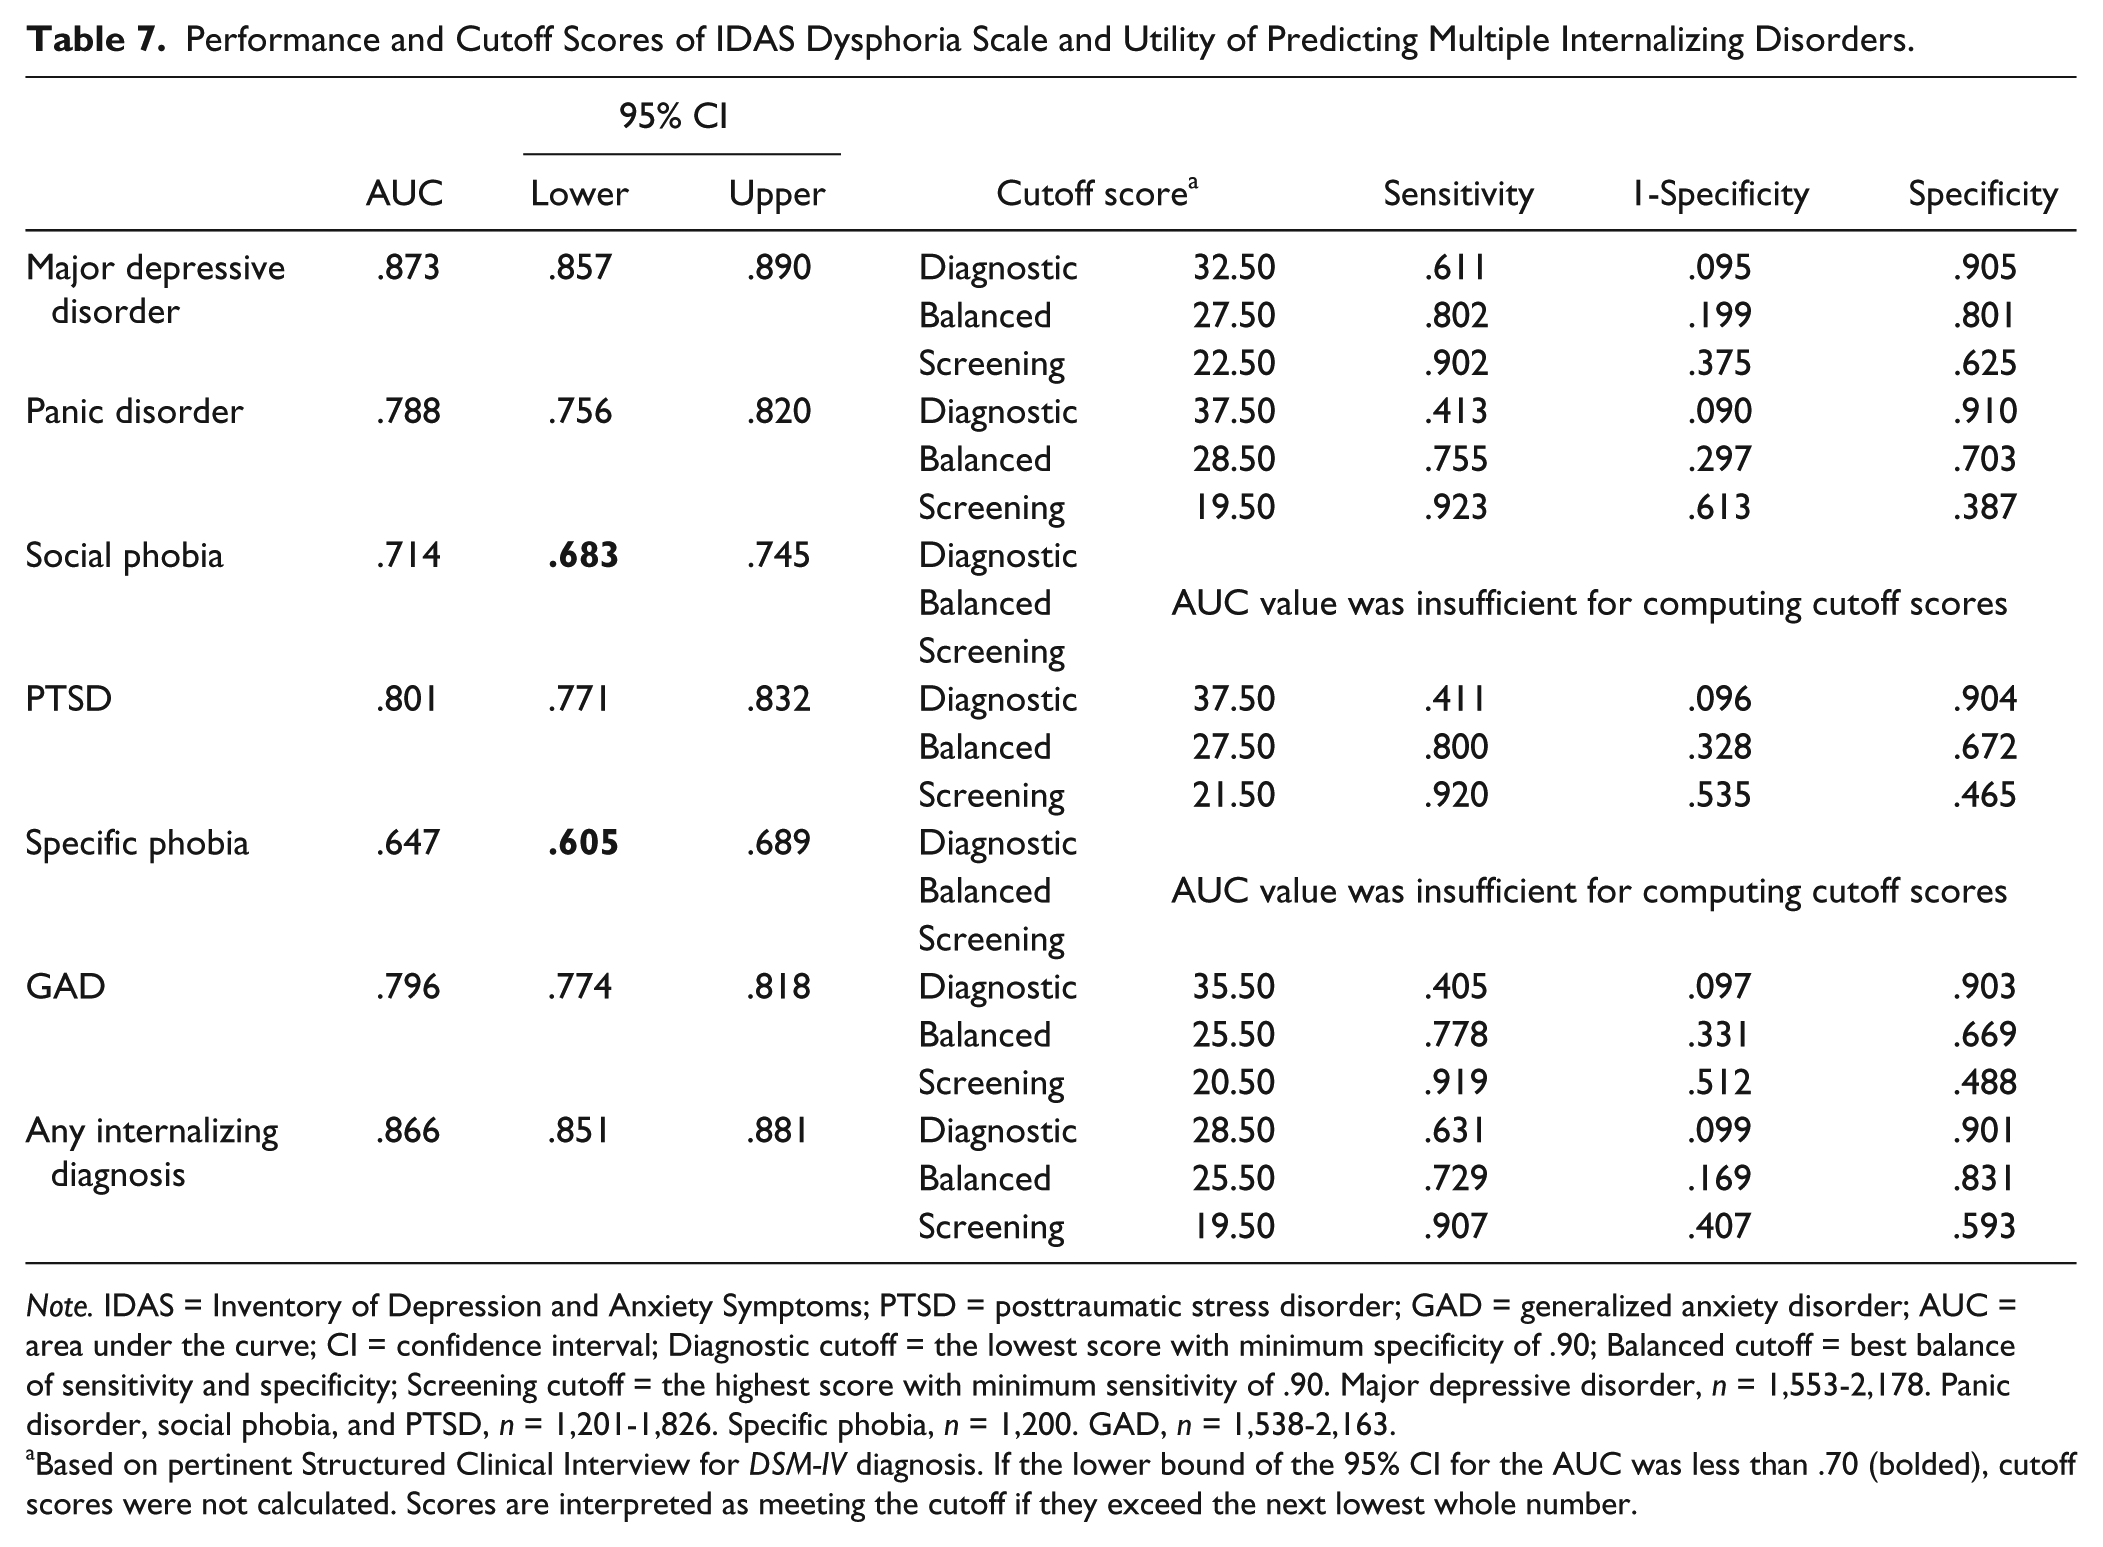
Note. IDAS = Inventory of Depression and Anxiety Symptoms; PTSD = posttraumatic stress disorder; GAD = generalized anxiety disorder; AUC = area under the curve; CI = confidence interval; Diagnostic cutoff = the lowest score with minimum specificity of .90; Balanced cutoff = best balance of sensitivity and specificity; Screening cutoff = the highest score with minimum sensitivity of .90. Major depressive disorder, n = 1,553-2,178. Panic disorder, social phobia, and PTSD, n = 1,201-1,826. Specific phobia, n = 1,200. GAD, n = 1,538-2,163.
Based on pertinent Structured Clinical Interview for DSM-IV diagnosis. If the lower bound of the 95% CI for the AUC was less than .70 (bolded), cutoff scores were not calculated. Scores are interpreted as meeting the cutoff if they exceed the next lowest whole number.
SCID-IV diagnoses were available for IDAS Panic, Social Anxiety, and Traumatic Intrusions. The remaining specific IDAS scales capture symptoms rather than diagnoses; consequently, a diagnostic cutoff was not computed. Table 8 provides cutoff scores for the identification of panic disorder, social phobia, and PTSD by their associated IDAS scale.
Cutoff Scores of Specific IDAS Scales Predicting SCID-IV Diagnoses.
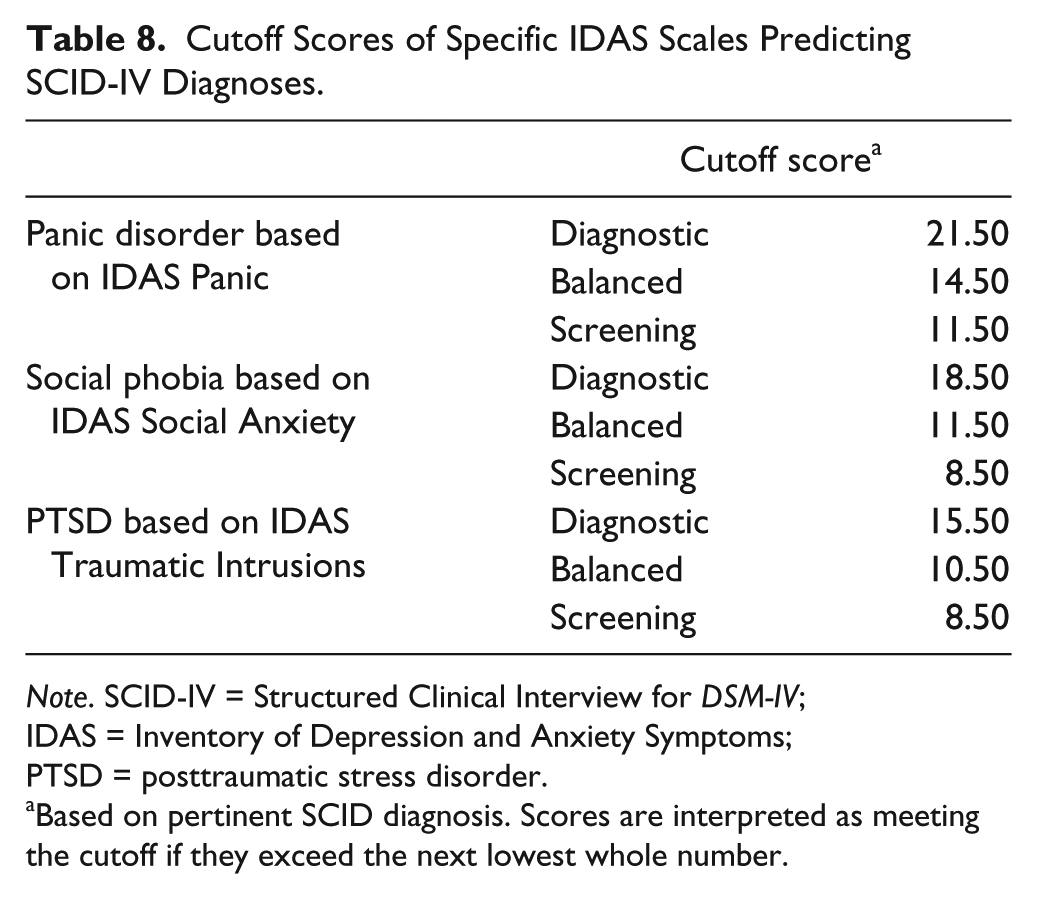
Note. SCID-IV = Structured Clinical Interview for DSM-IV; IDAS = Inventory of Depression and Anxiety Symptoms; PTSD = posttraumatic stress disorder.
Based on pertinent SCID diagnosis. Scores are interpreted as meeting the cutoff if they exceed the next lowest whole number.
Aim 3: Severity Ranges
Severity ranges are reported in Table 9 and were established against a T score distribution. In reviewing the severity ranges in relation to the clinical cutoff scores (Table 8) across relevant scales, it is notable that the balanced cutoff score generally corresponds to the lower bound of the severity ranges (e.g., “mild”), whereas the diagnostic cutoff score generally corresponds to the “moderate” range. This is appropriate given that the intention of the balanced clinical cutoff score is to distinguish between those individuals with and without the disorder (i.e., those identified with the balanced cutoff score are experiencing mild or greater symptoms), whereas the intention of the diagnostic cutoff score is to capture the large majority of the true positives (i.e., those identified with the diagnostic cutoff score are experiencing moderate or greater symptoms). In sum, it appears that the severity ranges adequately capture “clinical degrees of severity,” which is expected given their intended use of identifying those individuals who may be experiencing elevated symptom levels and warrant further assessment.
IDAS Scale Severity Ranges.
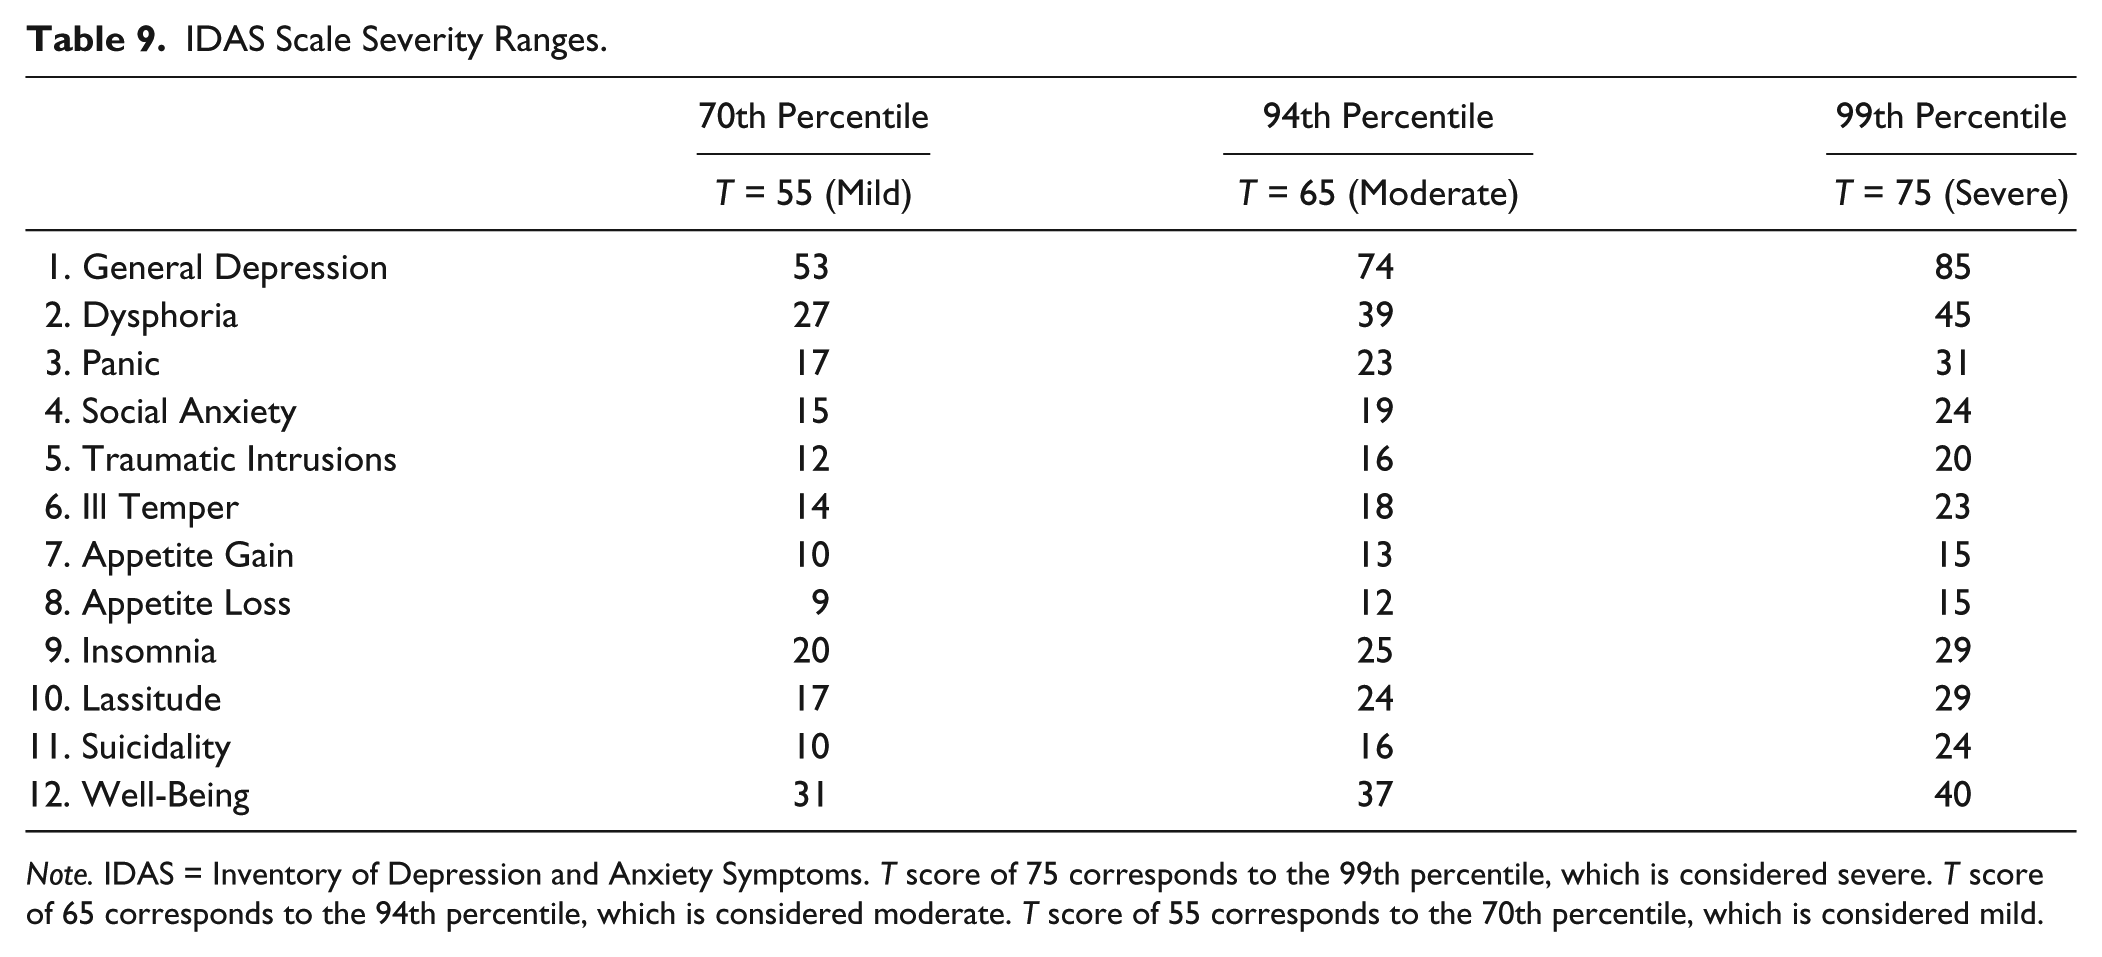
Note. IDAS = Inventory of Depression and Anxiety Symptoms. T score of 75 corresponds to the 99th percentile, which is considered severe. T score of 65 corresponds to the 94th percentile, which is considered moderate. T score of 55 corresponds to the 70th percentile, which is considered mild.
Discussion
The IDAS is a reliable and valid measure of depressive and anxiety disorder symptoms. This is the first study to (a) examine the test performance of each IDAS scale for identifying depression and anxiety diagnoses, (b) identify clinical cutoff scores, and (c) establish severity ranges, thereby increasing the utility of the IDAS scales.
Test Performance
General Scales
The two broad IDAS scales—General Depression and Dysphoria—showed impressive ability to identify both SCID-IV (DSM-IV) and MINI-assessed (DSM-5) mood and anxiety disorders, as well as clinically elevated symptoms on self-report measures. Both scales were particularly strong predictors of MDD diagnoses, but also identified diagnoses of GAD, panic disorder, and PTSD. They were less effective in identifying specific phobia. Indeed, the original IDAS scales do not contain content directly relevant to specific phobia (Watson, O’Hara, Chmielewski, et al., 2008). However, the recently expanded version of the IDAS (described below) contains a Claustrophobia scale that captures the situational subtype of specific phobia and should be examined in future studies (Watson et al., 2012). The relatively low AUC values for social phobia diagnoses are more surprising; however, previous investigations have shown that General Depression and Dysphoria have lower correlations with social phobia relative to other SCID-IV diagnoses (e.g., Watson, O’Hara, Chmielewski, et al., 2008). Notably, both scales were adequate predictors of DSM-5 social anxiety disorder diagnoses in the generalizability sample.
Specific Scales
Panic, Social Anxiety, and Traumatic Intrusions showed good ability to identify panic disorder, social phobia, and PTSD diagnoses, respectively. Additionally, all three scales were excellent detectors of severe BAI scores. Many of the other specific scales demonstrated substantial ability to detect elevated scores on the self-report instruments. For instance, Ill Temper was a good predictor of severe scores on all depression and anxiety measures, in line with findings that suggest symptoms such as irritability are common to both mood and anxiety disorders (Vidal-Ribas, Brotman, Valdivieso, Leibenluft, & Stringaris, 2016). Moreover, Ill Temper had its strongest AUC with RADS-2 scores; as depression may manifest as irritability in youth (American Psychiatric Association, 2013), it is possible that Ill Temper is picking up this specific variance. Insomnia and Lassitude also were able to detect severe scores on each of the instruments; thus, although they may be less informative with regard to presence of a specific clinical disorder, elevated scores are clear markers of internalizing distress. Finally, Well-Being was significantly linked to both MDD and the depression symptom instruments, demonstrating that low Well-Being shares a stronger association with depression symptoms than with anxiety; this further underscores the role of low positive emotionality in depression compared with anxiety (Clark & Watson, 1991; Mineka et al., 1998; Watson et al., 2007).
Cutoff Scores and Severity Ranges
Three cutoff score options are provided—balanced, screening, and diagnostic—giving users maximum flexibility in selecting the most appropriate cut point based on their specific need; moreover, by developing these scores using a mixed sample, we have confidence that they account for heterogeneity across populations and setting, making them more broadly applicable. The severity ranges correspond well to the clinical cutoff points. There is some overlap between the mild scores and scores needed for the balanced and screening cutoffs, meaning some individuals who are not diagnosable may nonetheless score in the mild severity range. This is consistent with dimensional models of psychopathology (Jones, 2012; Kessler, 2002; Kraemer, 2007; Kraemer et al., 2004) and is appropriate given the intention of identifying individuals who may be experiencing elevated symptom levels. The severity thresholds provide IDAS users a reference to differentiate among clinical severity levels for screening, diagnostic classification, and treatment planning relative to specific symptoms of depression and anxiety. In combination, the clinical cutoff scores and severity ranges may be particularly useful not only in classifying individuals but also tracking treatment outcomes. Changes in scores could be used for identifying both those individuals who move from “diagnosis” to “no diagnosis” but also those who experience a change in severity level, providing a more nuanced clinical picture.
Clinical Utility of the IDAS
Clinical cutoff scores and severity ranges provide users with specific criteria that will aid in the use of the IDAS. For instance, the IDAS scales may be a valuable first step in selecting those who need further evaluation. In addition, given the dimensional nature of the IDAS and data suggesting several of the scales are good identifiers of their associated diagnoses, the IDAS could further streamline assessment by indicating which disorder or symptom is likely to be most relevant for a particular individual, thereby facilitating differential diagnosis.
It is important to note that the IDAS includes a suite of scales rather than one single scale, and the user can choose to use any or all of the IDAS scales, depending on the intended purpose of the measurement. Dysphoria and General Depression encompass content that is related to the general distress/negative affectivity dimension comprising the core of the depressive and anxiety disorders (e.g., Clark & Watson, 1991; Mineka et al., 1998; Zinbarg & Barlow, 1996) and thus can serve as very efficient stand-alone measures of a broad range of internalizing pathology. The current findings demonstrate that these scales are essentially interchangeable for use in clinical screening and diagnosis. At only 10 items, Dysphoria would be an appropriate choice should the user require a very brief assessment measure; for instance, it could serve the purpose of a brief measure of “general distress” in research protocols without adding substantial participant burden. In clinical settings, General Depression (20 items) may be more useful, as it provides additional information about specific symptoms (e.g., insomnia, suicidality) that clinicians may want to identify and track. Thus, the IDAS easily can be used to identify broad spectrum symptom elevation (using the General Depression or Dysphoria scales) but also is capable of differentiating between disorders with shared underlying propensities (such as nonspecific negative affect) by administering the specific symptom scales.
The IDAS also has utility for use in furthering the movement to develop an empirically driven classification system based on the consensual structure of psychopathology. As recently articulated by The Hierarchical Taxonomy Of Psychopathology (HiTOP) consortium (Kotov et al., 2017), quantitative research on the structure of psychopathology has led to the development of a hierarchical, dimensional model of symptoms and syndromes. In this model, symptoms are grouped into syndromes based on observations of the natural covariation between like symptoms; likewise, correlated syndromes are combined into spectra, which represent the higher order dimensions of psychopathology. The broad and specific IDAS scales are clear markers of homogenous symptom dimensions within the Internalizing spectrum of this model. In addition, the IDAS has been expanded to provide more comprehensive assessment of the mood and anxiety disorders. The Expanded Version of the IDAS (IDAS-II; Watson et al., 2012) contains seven additional scales (Traumatic Avoidance, Checking, Ordering, Cleaning, Claustrophobia, Mania, Euphoria); the Social Anxiety scale was also revised to include one additional item. With the inclusion of content related to mania, the IDAS-II now models symptoms from the Thought Disorder spectrum of the HiTOP model. The IDAS/IDAS-II thus represents a promising measure for assessment of key components of this model (Kotov et al., 2017).
Given the existence of several well-validated measures of depression and anxiety (e.g., BAI, BDI-II), it is important to highlight several key features that distinguish the IDAS as a measure with unique applicability in research and clinical contexts. First, the IDAS provides assessment of several separable symptom dimensions, rather than a single overall score. Results of the present analysis further demonstrate that cutoff scores on the IDAS scales can identify a range of DSM diagnoses, which is a benefit over measures such as the BDI-II and BAI, which were not designed to measure—and have not been found to be as effective in identifying—the full range of emotional disorders (e.g., Hoyer, Becker, Neumer, Soeder, & Margraf, 2002; Subica et al., 2014). Notably, General Depression and Dysphoria both outperformed the BDI-II and BAI in identifying MDD and GAD diagnoses, respectively. The current sample is heterogeneous with regard to age, severity, and diagnostic status; this may account for the suboptimal results for the ROC analyses involving the BDI-II and BAI, as previous work establishing their diagnostic properties tended to use specific, homogeneous samples. A strength of the general IDAS scales is their ability to identify positive diagnoses effectively, even in a mixed sample.
Second, although the IDAS contains more items than the BDI-II, they both take roughly the same amount of time to complete (Watson et al., 2007). Using the IDAS, clinicians and researchers can gain information on several symptom dimensions and use cutoff scores that can identify multiple DSM diagnoses, without adding any time burden to the participant or patient. Moreover, the General Depression and Dysphoria scales each take less than 5 minutes to complete, making them feasible for use even in busy clinical settings.
Third, General Depression and Dysphoria showed very strong validity in relation to specialty measures designed for use with adolescents (RADS-2), postpartum women (EPDS), and older adults (GDS). This establishes these scales’ clinical utility for identifying symptoms in individuals spanning a wide age range; using the IDAS represents a more efficient way to assess a variety of respondents compared with administering separate measures for each population. Finally, the IDAS is free for noncommercial use, making it more widely accessible than instruments that are commercially published. Furthermore, an IDAS scoring program has been developed, which produces subscale scores and indicates which cutoff and severity threshold the patient’s scores have exceeded. This program is available from the corresponding author on request.
Limitations and Future Directions
Although the heterogeneous nature of our primary sample is a strength, the inclusion of clinical samples in our data set necessarily affects the overall severity level. The provision of different cutoff options allows the user to apply the scores flexibly depending on the population being assessed; nonetheless the normative information established in the mixed sample provides different information than would be obtained using general community samples. Future research that focuses on large-scale community samples, or large-N studies of specific subsamples (e.g., an outpatient-only sample), would provide comparative information on IDAS norms.
Despite showing wide variation in age, medical, and psychological status, the large majority of our primary sample was White. We duplicated the AUC analyses in a sample that was roughly equally composed of Black and White participants and that reported lower education levels and rates of marriage and employment; results demonstrated that the overall level of prediction of the IDAS scales was excellent in this sample. Any differences between the primary and generalizability samples seem to be sample-specific, rather than reflecting a difference due to race, as we obtained the same pattern of relations in both Black and White participants in the latter. Although two different clinical interviews were used in the primary versus the generalizability sample, the SCID-IV and MINI interviews have been shown to have comparable diagnostic stability (Kotwicki & Harvey, 2013). Nonetheless, replication using the SCID-5 (First, Williams, Karg, & Spitzer, 2015) would confirm the present findings. Given the smaller size of the generalizability subsamples, we were unable to compare cutoff scores and severity ranges across the specific racial groups and the primary sample; future investigations should examine and compare cutoff scores obtained in a wider range of individuals.
Second, our results are based on the original IDAS. Clearly, there is need for comparable evaluation of the expanded IDAS-II. It is important to note, however, that no items or scales were removed from the original IDAS in creating the IDAS-II; in fact, the only change to the original IDAS scales was the addition of one item to Social Anxiety. To examine the potential effects of this addition, we ran a series of supplemental analyses comparing the five-item IDAS and six-item IDAS-II Social Anxiety scales in the primary and generalizability samples. Results suggest that the IDAS and IDAS-II Social Anxiety scales function nearly identically in identifying diagnoses. 3 Therefore, someone using the IDAS-II could be fully confident that the properties and cutoff scores reported here would apply to all of the scales that are common across the two versions of the measure.
Third, results that relied fully on the presence of a SCID-IV diagnosis (ROC analyses) reflect only those participants who completed the interview (n = 2,178). In addition, diagnoses in the primary sample were made using DSM-IV criteria. Changes implemented in the recent DSM-5 alter the diagnostic criteria for some of the included disorders (specific phobia, social anxiety disorder, panic disorder, PTSD). The analyses in the generalizability sample allowed us to examine the performance of the IDAS scales in relation to DSM-5 diagnoses; the results strongly suggest that our current findings will generalize well to DSM-5 criteria. Finally, although categorical diagnoses still have utility in basic and applied clinical contexts, DSM diagnoses themselves have been found to be limited in their ability to reliably identify clinical disorders (Chmielewski et al., 2015). In the current study, diagnostic reliability was demonstrated using the audio recording approach. This approach has been shown to be more limited and yield higher kappa values compared with the test–retest method, in which separate interviews are conducted by independent clinicians. Thus, it is likely that our high interrater reliability values are an overestimate of true diagnostic reliability across these samples (Chmielewski et al., 2015).
Fourth, as there is no hard and fast rule for the selection of optimal cutoff points, any choice of a cutoff score is inherently arbitrary. We strove to base our decisions on sound methodological practice and to provide the most clinically useful information possible. Nonetheless, it will be vital to replicate these results and examine the accuracy and utility of the reported cutoff scores and severity ranges in new, more diverse samples.
Finally, these results should be replicated in clinical samples in which behavioral outcome measures are assessed. Although we were not able to address this issue in the current analyses, the IDAS scales are being used in treatment outcome studies and have shown sensitivity to treatment change in relation to clinical indicators such as depression and smoking behavior (Beevers et al., 2017; Capron, Norr, Zvolensky, & Schmidt, 2014; Segre, Brock, & O’Hara, 2015) and medication adherence (Brandt, Bakhshaie, Zvolensky, Grover, & Gonzalez, 2015).
Conclusion
This was the first study to examine test performance, identify clinical cutoff scores, and establish severity ranges for the 12 original IDAS scales. We identified and reported separate cutoff scores that can be used differentially depending on the goal of their use: screening, efficiency, or diagnosis confirmation. Severity ranges corresponded well to the identified clinical cutoffs and will help users characterize the level of symptoms present. Uniquely, we also demonstrated that the broad General Depression and Dysphoria scales evidence utility in detecting internalizing psychopathology and thus have potential to be used as efficient frontline screeners for mood and anxiety disorder problems in a range of settings, without adding any time or burden in administration when compared with existing symptom measures.
Supplemental Material
IDAS_MS_Appendices_6.15.18 – Supplemental material for Clinical Utility of the Inventory of Depression and Anxiety Symptoms (IDAS)
Supplemental material, IDAS_MS_Appendices_6.15.18 for Clinical Utility of the Inventory of Depression and Anxiety Symptoms (IDAS) by Sara M. Stasik-O’Brien, Rebecca L. Brock, Michael Chmielewski, Kristin Naragon-Gainey, Erin Koffel, Elizabeth McDade-Montez, Michael W. O’Hara and David Watson in Assessment
Footnotes
Acknowledgements
We thank Stephanie Ellickson-Larew, Kasey Stanton, and Kailee Groshans for their help in the preparation of this article.
Declaration of Conflicting Interests
The author(s) declared no potential conflicts of interest with respect to the research, authorship, and/or publication of this article.
Funding
The author(s) disclosed receipt of the following financial support for the research, authorship, and/or publication of this article: This research was supported by National Institute of Mental Health Grant R01-MH068472 to David Watson.
Notes
References
Supplementary Material
Please find the following supplemental material available below.
For Open Access articles published under a Creative Commons License, all supplemental material carries the same license as the article it is associated with.
For non-Open Access articles published, all supplemental material carries a non-exclusive license, and permission requests for re-use of supplemental material or any part of supplemental material shall be sent directly to the copyright owner as specified in the copyright notice associated with the article.