
Abstract
Short measures of psychological constructs are routinely used to save assessment time and cost. The downside is a trade-off between resource savings and psychometric quality. When evaluating tests, a pragmatic strategy is frequently applied that neglects the assessment objective, which may result in unfair rejection or unmindfully acceptance of short scales. Our main aim is to demonstrate the consequences of applying a pragmatic test evaluation strategy. We used two tests that measure the same construct—obsessive-compulsive symptomatology—but differ considerably in test length (1:3) and evaluated the measures by taking the assessment objective into account. The two scale scores showed distinct profiles of psychometric qualities. Whereas routinely evaluated reliability, factorial validity, and convergent/discriminant validity did not differ, rendering both tests useful for research purposes, substantial differences were found for qualities that are rarely focused on—measurement precision and diagnostic validity—which are highly relevant for accurate decisions in clinical practice.
Keywords
A short scale is a self-report measure that allows for the more efficient measurement of a psychological construct compared with a scale whose test score has similar evidence for its validity but more items (Kemper, Brähler, & Zenger, 2013). Short scales are increasingly used in diverse domains (e.g., psychology, psychopathology, epidemiology, social sciences, and behavioral economics) as well as in different assessment settings such as clinical research and practice (Coste, Guillemin, Pouchot, & Fermanian, 1997; Rammstedt, Kemper, & Schupp, 2013). The popularity of short scales might be explained to a large extent by their potential to save resources, the most important ones being assessment time and related costs. This feature renders short scales particularly interesting to practitioners in applied clinical settings. Despite pragmatic reasons supporting their use, short scales of psychological constructs have a downside. Whenever a long scale is abbreviated or a short scale is preferred over a longer scale that measures the same construct, a trade-off between resource savings and psychometric quality lost inevitably occurs (Levy, 1968). Thus, a crucial question for a researcher or practitioner who considers the use of a short scale instead of a long measure of the same construct is how the two measures can be optimally compared with selecting the one that is more appropriate. Unfortunately, the current practice in test evaluation seems to entail a strong reliance on cutoff values for specific psychometric criteria, which are oftentimes rigidly applied in a cookbook-like manner to evaluate the psychometric quality of a scale in order to justify or discourage its use (see Sijtsma, 2009). We argue that the question of whether a short or long measure of a construct is more appropriate can be properly addressed only when the assessment objective—for example, studying comorbidity in a sample (clinical research) or assigning a single person to a treatment group (clinical decision making)—is taken into account (see American Educational Research Association, American Psychological Association, & National Council on Measurement in Education, 2014, Standards for Educational and Psychological Testing, hereafter “Standards”; Ziegler, 2014; Ziegler, Kemper, & Kruyen, 2014). It is the fit between a scale score’s profile of psychometric qualities and the assessment objective that counts. We demonstrate our argument by comparing two measures of obsessive–compulsive (OC) symptomatology that are widely used in clinical research and practice. Both target the same construct but differ considerably in length in a ratio of one to three: the Obsessive–Compulsive Inventory–Revised (OCI-R; Foa et al., 2002) and the Vancouver Obsessional Compulsive Inventory (VOCI; Thordarson et al., 2004). Before comparing the two measures with regard to specific psychometric properties, we demonstrate that the two measures capture the same construct and, thus, are comparable.
Long Versus Short Scales in Psychological Assessment
These days, the use of short scales for psychological assessment is highly popular and widespread (Kruyen, Emons, & Sijtsma, 2013). Short scales are used to assess a broad range of clinical and nonclinical constructs from different domains such as ability, personality, physical, or psychological functioning.
The main reasons to use short scales is the saving of assessment time and related costs (cf. Levy, 1968). In applied settings, for example, the burden of testing is alleviated by reducing assessment time for patients with impaired cognitive functioning due to brain damage, pharmacotherapy, or cancer treatment (Goring, Baldwin, Marriott, Pratt, & Roberts, 2004). Moreover, efficient assessments could contribute to an improved identification of comorbid mental disorders in primary care. For example, many cancer clinicians would be prepared to use short measures in routine care (Mitchell, Kaar, Coggan, & Herdman, 2008), where mental health conditions might frequently remain unnoticed (Sharpe et al., 2004). Besides advantages in applied settings, a shorter assessment time yields benefits in research settings as well. For example, by using shorter assessments researchers might reduce costs, especially in expensive epidemiological surveys, improve participation rates in their studies (Edwards, Roberts, Sandercock, & Frost, 2004), and avoid fatigue and other negative reactions of participants in empirical studies, which might result in lower data quality (Credé, Harms, Niehorster, & Gaye-Valentine, 2012). In summary, there are convincing pragmatic reasons for why short scales should be used in applied as well as in research settings. However, the popularity of short scales is accompanied not only by praise but also by criticism that relates to their psychometric quality (Credé et al., 2012; Smith, McCarthy, & Anderson, 2000). Reliability and validity concerns are routinely mentioned. For example, Kruyen et al. (2013) report in their meta-analysis that the abbreviation of 137 subtests by about 40% to 60% yields a decrease in internal consistency from α = .84 to .77. Furthermore, Credé et al. (2012) compared eight measures of Big Five domains with nonoverlapping items and reported a lower internal consistency of scores from short versus long scales and lower predictive power to capture variance in different education-, work-, and health-related outcomes.
Other findings, however, contradict the criticism by Credé et al. (2012) as differences in measurement error and test family between the short and long scales compared were not taken into account. In contrast, Heene, Bollmann, and Bühner (2014) compared long and short scales in terms of test-criterion correlations in a simulation study and found no differences between the long and the short versions after they corrected for measurement error. And even when not correcting for measurement error, several researchers did not find meaningful differences in test-criterion correlations between scores from long and short measures (Kemper, Lutz, & Neuser, 2012; Thalmayer, Saucier, & Eigenhuis, 2011). For example, Thalmayer et al. (2011) investigated the effects of test length on the predictive power of widely used personality questionnaires (i.e., NEO, BFI, and HEXACO). Remarkably, scores from the shortened and original scales did not differ substantially in their ability to predict life outcomes and behavioral observations as long as the comparisons were made within the same test family (cf. Ziegler, Poropat, & Mell, 2014)—a relevant aspect that was not implemented in Credé et al.’s (2012) study.
These results highlight that a rejection of short scales on the basis of the claim that their use involves a general lack or a reduction in psychometric quality (e.g., score reliability or test criterion correlations) compared with longer scales cannot be justified. Nevertheless, short scales are frequently rejected on the basis of psychometric concerns. We argue that these psychometric concerns are related to problematic test evaluation practices and, thus, might not always be well-founded.
Current Practices in Test Evaluation
It is a common tradition that the choice of a psychological test for a given use should be firmly rooted in a comprehensive review of available measures and a comparison of their psychometric quality (see Guilford, 1946). Many guidelines and frameworks are available to support researchers and practitioners in this regard (Evers, Sijtsma, Lucassen, & Meijer, 2010; Kane, 1992; Kersting & Hornke, 2006; Loevinger, 1957; Messick, 1995, 1998; Nunnally & Bernstein, 1994; Ziegler, 2014). However, there are reports that suggest that this support does not always translate into better test evaluation practices.
Examinations of the current practices in test evaluation suggest that two issues might be specifically related to a premature rejection of short scales. First, a study on construct validation procedures of 696 tests listed in the APA Directory of Tests by Hogan (2004) suggests that some types of evidence are more readily reported than others, especially those that allow for a straightforward quantification (e.g., reliability evidence vs. evidence of content validity or construct representation). Second, guidelines for test evaluation are sometimes rigidly applied by using cutoffs for quantifiable psychometric quality criteria, thereby neglecting a test’s assessment objective. It appears to be a common procedure to compare reliability and validity coefficients with ranges of “admissible” values for these coefficients proposed in textbooks (e.g., Nunnally & Bernstein, 1994) and test evaluation guidelines (EFPA Board of Assessment, 2013; Evers et al., 2010) in a cookbook-like manner (for an example see Schepers, Wetzels, & de Ruyter, 2005), despite explicit warnings about their rigid application in the fine print. This approach to test evaluation is efficient and pragmatic, but in most cases, it cannot be considered appropriate as relevant factors that impact these coefficients are disregarded (e.g., the sample dependency of correlation coefficients, criterion contamination and deficiency, and the assessment objective; G. H. Fischer, 1968; Kersting, 2006; Messick, 1989; Watson, 2004; Ziegler & Brunner, 2016).
Both of the aforementioned “ways of doing business”—evaluating available psychometric criteria only and comparing estimates of score reliability/validity with cutoffs while disregarding the assessment objective—may lead to the unjustified rejection of measures (e.g., short scales; see also Rammstedt & Beierlein, 2014; Ziegler, Kemper, et al., 2014).
The Fit Between a Scale Score’s Profile of Psychometric Qualities and the Assessment Objective
Tests in general and short scales in particular can be used in different settings such as clinical research or practice. Within these settings, measures can be put to many different uses. For example, in research the focus usually is on the group and a thorough description of the psychopathology in a sample is usually intended (e.g., to study relations to treatment outcome variables, comorbidity, or to compare subgroups). In clinical decision making, the objectives might be to screen for psychopathology in order to follow up with more extensive assessments (screening), to assess a person’s psychopathology to inform a diagnosis (status or severity assessment), to predict the progression of symptoms (prognosis), to evaluate a treatment outcome (individual change assessment), or to assign the person to a treatment group (classification).
The settings and the assessment objective impose to some extent similar but also considerably different demands on psychometric quality. Without some types of construct validity evidence, the meaning of a test score would remain elusive. Any test score should accurately map the structure of the construct (factorial validity) and its meaning should be derived from item content (content validity) and the nomological network of relations to other constructs (convergent and discriminant validity).
Concerning the importance of other psychometric criteria, however, research and clinical settings differ considerably. For example, in research settings, it is important that certain parameters derived from the individual test scores (e.g., mean and standard deviation) are robust so that sufficient power is achieved for statistical inference testing, whereas in clinical settings, measurement precision (i.e., the accuracy of individual test and change scores) is more important. Thus, practitioners focus on the standard error of measurement to compute confidence intervals (CIs) for individual scores rather than score reliability per se, as high-measurement precision enables accurate decisions about individuals (Kruyen et al., 2013; Sijtsma & Emons, 2011). Further differences in demands involve predictive validity. In research settings, the estimation of the strength of the association between two constructs is of interest, usually estimated by the correlation of the test score and a criterion score. In clinical settings, another aspect of predictive validity is frequently emphasized. Many tests are used to predict group membership (e.g., to screen for clinical levels of symptoms and distress; Emons, Sijtsma, & Meijer, 2007). In this setting, the ability of the test score to accurately assign group membership (i.e., sensitivity and specificity) is more important than achieving a high test-criterion correlation.
In summary, the intended use of a test score matters when evaluating and selecting a test. To make a sound argument that a test score interpretation is valid, it should be supported by evidence related to the specific uses a test is put to (see Standards, 2014, p. 23). In other words, the profile of the psychometric qualities of a scale score—whether a short or comprehensive measure—should fit the assessment objective. In the research presented here, we demonstrate an appropriate test evaluation according to the Standards for Educational and Psychological Testing (2014) by using two tests of OC symptoms as an example. Both tests measure OC symptoms in a similar manner but differ substantially concerning test length.
A Short Versus a Long Assessment of OC Symptoms: OCI-R or VOCI?
Obsessive–compulsive disorder (OCD) is a complex disorder characterized by obsessions and compulsions (American Psychiatric Association, 2013). According to a large epidemiological study, the lifetime prevalence of OCD has been estimated to be 2.3% and the 12-month prevalence to be 1.2% (Ruscio, Stein, Chiu, & Kessler, 2010). Obsessions are recurrent, unwanted, intrusive ideas (e.g., about possible contamination or a lack of symmetry in objects) that are usually associated with considerable anxiety or distress for the individual. OC patients routinely seek to ignore or suppress intrusive ideas, or respond with compulsions. Compulsions are repetitive behaviors (e.g., ordering, flipping of switches, and hand washing) or mental acts (e.g., counting) that are performed to neutralize aversive thoughts and, ultimately, to reduce anxiety and distress, and to avoid harm. Behaviors and acts may vary substantially across individuals and are not functional in achieving what they are designed to prevent.
Attempts have been made to sort the heterogeneous symptoms of OCD into subtypes and dimensions. By applying factor analysis to symptom reports data, four- to six-factor solutions have been reported. The dimensions that were most consistently reported were “contamination and cleaning,” “forbidden thoughts and checking,” “symmetry and ordering,” and “hoarding.” However, no final consensus about the number and characterization of the symptom dimensions has been reached so far (Kathmann, 2015).
For the assessment of OC symptoms, several validated self-report measures are available (see Overduin & Furnham, 2012). The most widely used symptom questionnaire is the OCI-R (Foa et al., 2002), most likely due to its brevity and ease of administration. Many experimental and clinical studies, including psychotherapy trials, report OCI-R group data. The OCI-R shows moderate correlations with clinician ratings of OC symptom severity. The six subscales sufficiently correspond to the factor structure obtained for other symptom measures such as the Yale-Brown Obsessive–Compulsive Scale–Symptom Checklist (Goodman et al., 1989).
The VOCI (Thordarson et al., 2004) has three times more items compared with the OCI-R, also includes cognitive items, and contains six theme-based subscales that cover common OC symptoms. Symptom domains captured roughly parallel those of the OCI-R. Gönner, Ecker, Leonhart, and Limbacher (2010) questioned the robustness of the factor structure reported by Thordarson et al. (2004) due to low size of the validation sample and criticized the lack of representation concerning some OC symptoms (e.g., repugnant obsessions). Strong correlations of the VOCI total score with other OC measures and moderate correlations with measures of depression and anxiety were reported (Overduin & Furnham, 2012), suggesting some overlap of these constructs.
The Present Investigation
Test users frequently face a situation where they have to choose between tests that supposedly measure the same construct but differ in length and psychometric quality. For example, when measuring OC symptoms, clinical researchers and practitioners might be tempted to favor the OCI-R over the VOCI as using the former holds the promise of saving up to 2/3 of the assessment time and related cost. Using these clinical OC measures as an example, the main aim of the research presented here was to shed light on the consequences of such a decision—the trade-off between resource savings and psychometric quality lost—and to elucidate the circumstances under which a preference for a shorter over a longer measure could be warranted. For this purpose, we evaluated evidence for the psychometric quality of OCI-R and VOCI scores by taking the assessment objective into account. We proceeded in a stepwise fashion along the categories of evidence for test quality (capitalized hereafter) proposed in the Standards (2014). Before comparing OCI-R and VOCI scores with regard to psychometric properties, it was tested whether scores from the two measures capture the same construct by showing that factor scores of the OCI-R and VOCI are virtually identical and that external relationships with other constructs from the nomological network (Cronbach & Meehl, 1955) are highly similar.
As the test authors of the OCI-R and the VOCI have claimed that their measures are multidimensional and contain six subdimensions or symptom clusters, we then obtained (a) Evidence Regarding Internal Structure by conducting confirmatory factor analyses (CFAs) of the test items. CFA allows for an evaluation of the degree to which relations among the test items and factors support the interpretation of the test score proposed by the test authors (Standards, 2014). To evaluate the consistency of the test scores, (b) Evidence Regarding Reliability/Precision was collected. In research settings, reliability is emphasized, whereas for individual decision making, reliability is less informative (Kruyen et al., 2013) and measurement precision is more relevant for computing CIs to base diagnostic decisions on. Thus, estimates of both score reliability and measurement precision were obtained. Furthermore, (c) Evidence Regarding Relations with Conceptually Related Constructs was gathered by correlating the OCI-R/VOCI scores with measures of psychological distress. Test scores should be moderately to highly related to these measures (convergent and discriminant validity) as OC symptoms and general distress represent or are related to aversive affective experience. Finally, (d) Evidence Regarding Relations with Criteria (criterion validity) stems from analyses demonstrating the test scores’ power to accurately classify individuals as having an OC disorder or not. These forms of criterion validity (i.e., sensitivity and specificity) are particularly relevant when the test is proposed for individual decision making as the OCI-R and the VOCI are.
Method
Participants and Procedure
Participants in this study were n = 320 patients diagnosed with OCD (OCD group) and a sample of n = 182 controls (Control group). The study data were collected between 2005 and 2010. OCD patients sought treatment in the outpatient clinic of a large German university. During intake assessment, they received several self-report measures commonly used in the outpatient clinic, including the Beck Depression Inventory–II (BDI-II), Brief Symptom Inventory (BSI), OCI-R, and VOCI (for details, see below). Moreover, they were diagnosed in a systematic and standardized multistage procedure by experienced clinicians (i.e., psychologists who either were licensed psychological psychotherapists or were in training and worked under supervision) on the basis of the Structured Clinical Interview for DSM-IV (SCID; First, Spitzer, Gibbon, & Williams, 1995). Patients were included when the criteria for OCD were fulfilled. Besides OCD, 43% of patients had a comorbid affective disorder. Exclusion criteria for participation were diagnoses of substance use disorders or schizophrenia and other psychotic disorders. The ages of the final sample of 320 patients ranged from 18 to 76 years (M = 34, SD = 11), and 53.8% of these participants were male.
The Control group was recruited via newspaper advertisements and flyers. They received monetary incentives of €8 to €10. The study questionnaire was administered with an online test battery. Participants received a link via e-mail and filled out the questionnaires online. After answering some demographic questions, they completed the BDI-II, the BSI, the OCI-R, and the VOCI (for details, see below). Before the data of the Control group were analyzed, exclusion criteria were applied. Persons who were undergoing treatment for a mental or neurological disorder in the past (e.g., anxiety) or were undergoing treatment at the time of study were excluded. Furthermore, we also excluded persons with clinically salient depressive symptoms according to the BDI-II (see below), reducing the number from 212 to 182. Thus, the Control group consisted of nondepressed, nontreatment seeking individuals. The ages of the Control sample ranged from 19 to 65 years (M = 35, SD = 11). The sample of NACs did not differ significantly in age, t(373) = 0.76, p = .45, d = 0.07, or gender, χ2(1) = 1.47, p = .22, w = .11, from the sample of OCD patients.
Descriptive statistics for the OCD and Control group in terms of OC symptoms are depicted in Table 1.
Descriptive Statistics for Both Measures by Group.
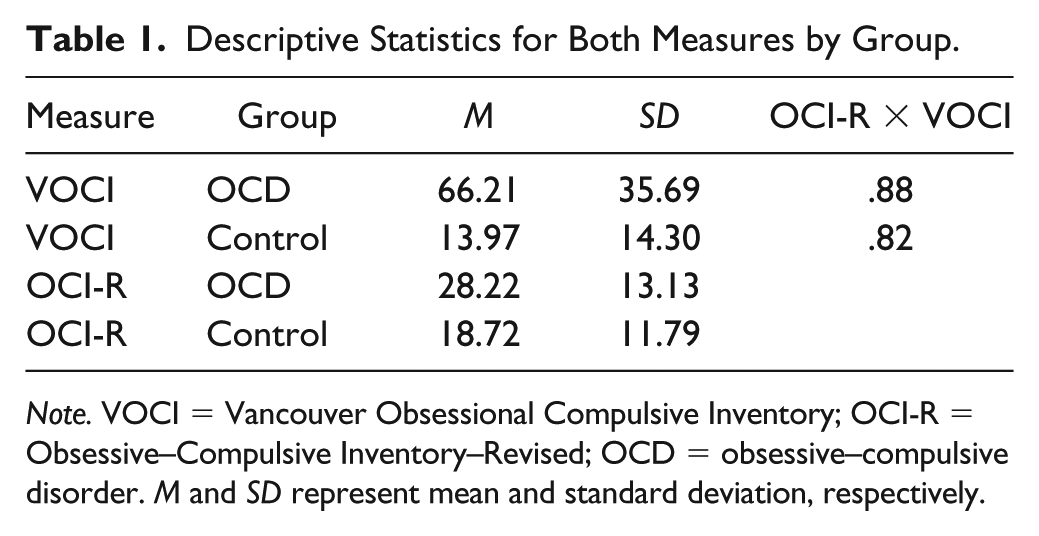
Note. VOCI = Vancouver Obsessional Compulsive Inventory; OCI-R = Obsessive–Compulsive Inventory–Revised; OCD = obsessive–compulsive disorder. M and SD represent mean and standard deviation, respectively.
Measures
VOCI
The VOCI (Thordarson et al., 2004; German adaptation 1 : Gönner et al., 2010) is a 55-item self-report measure of OC symptoms. Statements referring to current concerns and behavior related to OCD are rated on a 5-point scale ranging from 0 (not at all) to 4 (extremely). The VOCI contains six subscales, Hoarding (7 items), Checking (6 items), Contamination (12 items), Obsessions (12 items), Just Right (12 items), and Indecisiveness (6 items), and a total score. The authors reported validation results from samples of OCD patients, nonanxious controls, community adults, and students and suggested that the construct validity of the VOCI scores is sufficient for screening and evaluating treatment outcomes (Thordarson et al., 2004). Psychometric quality of the VOCI was discussed extensively by Overduin and Furnham in 2012 (see also Gönner et al., 2010, for the German adaptation).
OCI-R
The OCI-R (Foa et al., 2002; German version 1 : Gönner, Leonhart, & Ecker, 2008) is a shortened version of the Obsessive–Compulsive Inventory (Foa, Kozak, Salkovskis, Coles, & Amir, 1998) containing 18 items that refer to OC symptoms. Respondents are required to rate their level of distress with regard to these symptoms during the past month on a 5-point scale ranging from 0 (not at all) to 4 (extremely). The OCI-R contains six subscales that correspond to categories of symptoms usually found in persons diagnosed with OCD, Hoarding, Checking, Washing, Obsessions, Ordering, Neutralizing, and a total score. The test authors presented validation results and stated that the OCI-R is “a highly useful diagnostic screening instrument in research and clinical settings” (Foa et al., 2002, p. 494). Further psychometric properties are summarized by Overduin and Furnham (2012) as well as Gönner et al. (2008).
Descriptive statistics and scale intercorrelations of the OCI-R and the VOCI for the sample of OCD patients can be found in Table 2.
Descriptive Statistics and Correlations of the OCI-R and VOCI Scales (OCD Group).
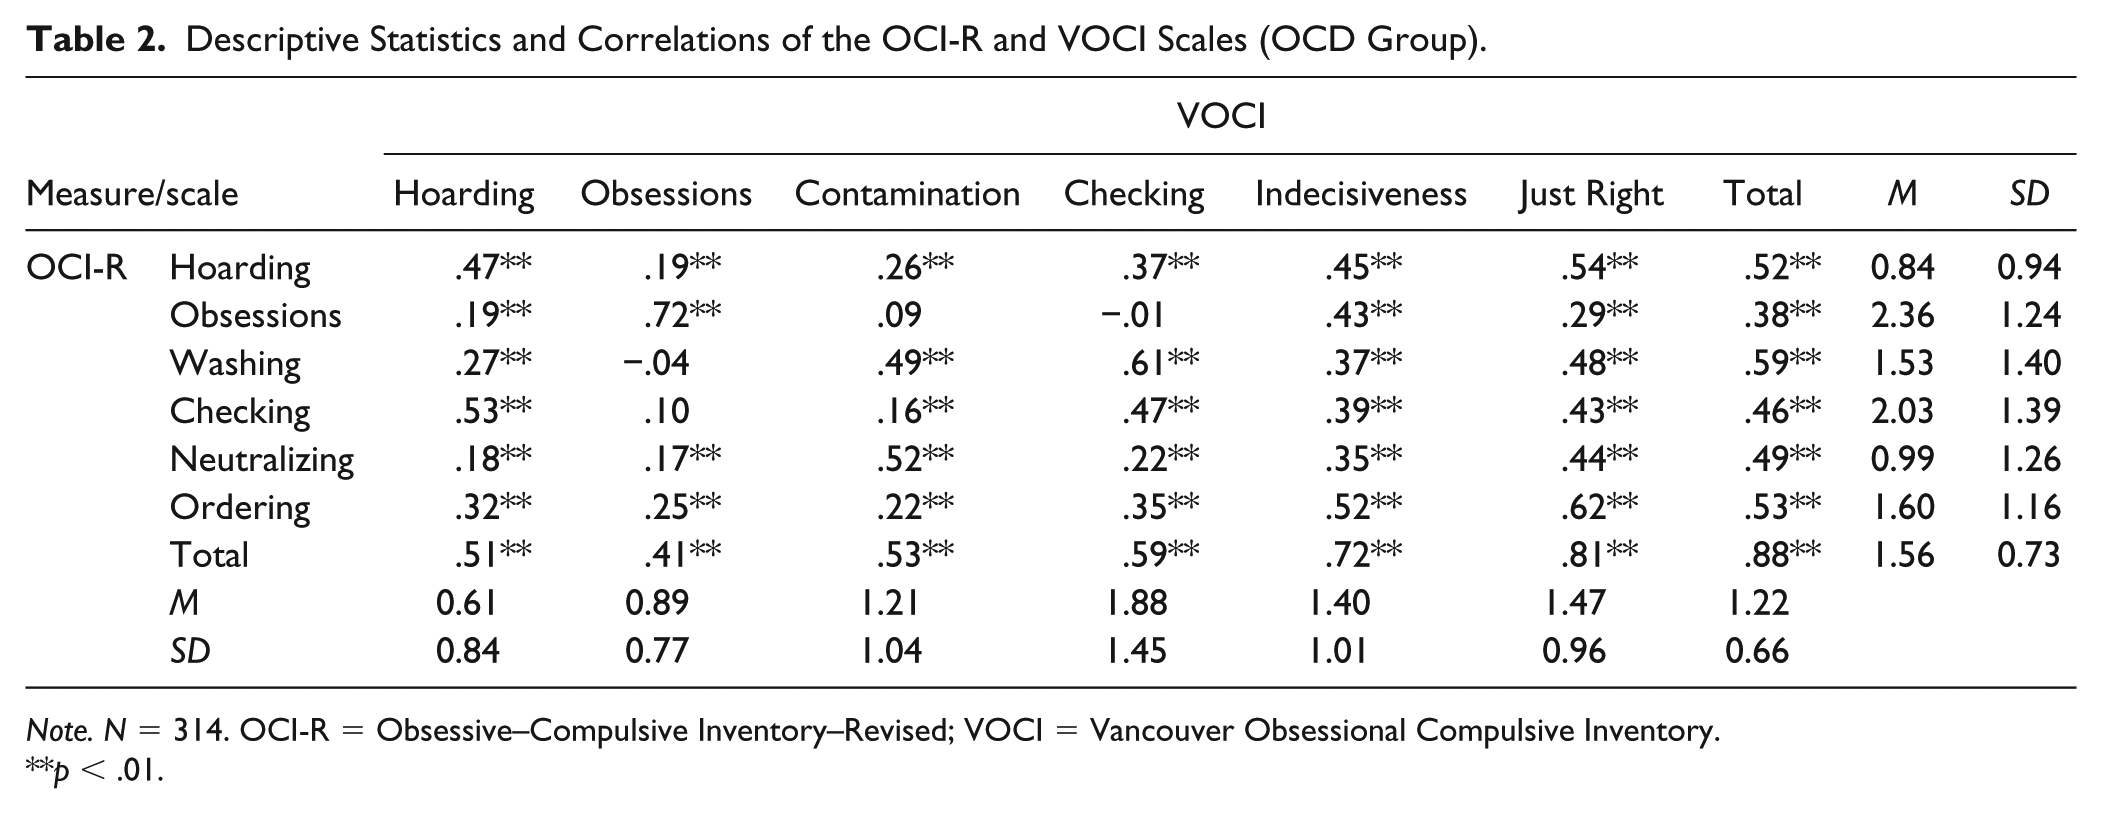
Note. N = 314. OCI-R = Obsessive–Compulsive Inventory–Revised; VOCI = Vancouver Obsessional Compulsive Inventory.
p < .01.
BDI-II
The 21-item BDI (Beck, Steer, & Brown, 1996; Kühner, Bürger, Keller, & Hautzinger, 2007) was administered to measure cognitive, affective, and bodily symptoms of depression. The intensity of each symptom is quantified by choosing one out of four statements. The total score ranges from 0 to 63. Respondents with a total score higher than 18 are considered clinically salient. The construct validity of the BDI-II is well-established (Kühner et al., 2007).
BSI
The BSI (Derogatis & Melisaratos, 1983; Geisheim et al., 2002) is a 53-item self-report measure designed to assess psychological distress. The BSI contains nine subscales that capture a broad array of clinical symptoms related, for example, to somatization, depression, anxiety, hostility, psychoticism, and paranoid ideation as well as global indices of distress. Results on the construct validity of the BSI have been reported in several studies (e.g., Boulet & Boss, 1991; Geisheim et al., 2002).
SCID-IV
The SCID-IV is a semistructured diagnostic interview that is used to determine diagnoses according to the DSM-IV (First et al., 1995; Wittchen, Zaudek, & Fydich, 1997).
Statistical Analyses
Statistical analyses were conducted in five steps. The first analysis aimed at evaluating whether OCI-R and VOCI capture the same construct. We estimated the latent correlation between the general factors of each measure. This was done by combining measurement models for each test in one model. Factor scores of first-order factors (facets or symptom-clusters) were used as indicators for a respective second-order latent variable. Both latent variables were allowed to correlate as were the residuals of first-order factors with corresponding content (e.g., washing in OCI-R and contamination in VOCI). Moreover, a second model was tested in which the correlation between the two latent variables was fixed to one. Both models were compared using a χ2 difference test. A nonsignificant result would support that both latent variables capture the same construct. As this was considered a preliminary step for all further analyses, it was labeled Step 0. Additional evidence for this assumption was provided by directly comparing correlations between OCI-R/VOCI scores and BSI scores representing three key constructs from the nomological network, OC, anxiety, and depression symptoms, by means of Williams’ test as recommended by Steiger (1980).
In Step 1 of the model, Evidence Regarding Internal Structure (see Standards, 2014) was obtained by conducting a CFA on the items from the OCI-R and VOCI. Measurement and structural models were specified according to validation studies conducted by the test authors. As reported by Foa et al. (2002) and Thordarson et al. (2004), a six-factor hierarchical structure was assumed with single test items as indicators of latent variables in turn representing indicators of a higher order OC factor. A WLSMV estimator was used to account for the ordinal rating scale (Beauducel & Herzberg, 2006). The assessment of model fit was guided by Hu and Bentler’s (1998) recommendations. Moreover, suggestions concerning the application of the guidelines proposed by Hu and Bentler were followed (Heene, Hilbert, Draxler, Ziegler, & Bühner, 2011). Heene et al. (2011) could show that definite cutoffs for fit indices are problematic and instead suggested that the sources of misfit be modeled when the fit indices do not exceed the proposed cutoffs. They further noted that parameters derived from the model should only be interpreted afterwards to avoid that model misfit contorts the parameters in focus. We followed this advice here. In Step 2, Evidence Regarding Reliability/Precision was gathered. Reliability estimates were obtained by calculating weighted McDonald’s Ωw from parameter estimates of the CFA model (Zinbarg, Revelle, Yovel, & Li, 2005). Measurement precision was evaluated by calculating and comparing the 95% CI of each test relative to scale length. To directly compare two tests that differ in test length, scale length has to be taken into account. Scale length is the maximum possible test score minus the minimum possible test score, and these two scores might differ substantially depending on the number of items on the test, leaving less room for individual scores to differ significantly (e.g., a person’s test score and a cutoff score set for treatment selection). Thus, measurement precision should be defined by the ratio of the CI for the test score to scale length (Kruyen et al., 2013). To evaluate the implications of relative CIs for clinical decision making, we calculated and compared the interval of uncertainty around the cutoff, in which a clear decision cannot be made on the individual level (Emons et al., 2007). As the OCI-R and the VOCI are both used as screening tools to detect persons with clinically salient levels of OC symptoms in clinical practice (e.g., Foa et al., 2002), we defined a sensitivity of .90 as desirable. Corresponding to this sensitivity value, 95% CIs were computed around the cutoff.
In Step 3, Evidence Regarding Relations with Conceptually Related Constructs was collected by correlating the total scores from the OCI-R and the VOCI with the total scores from the BDI-II and BSI as well as the subscale scores from the BSI. We expected very strong correlations with the BSI OC subscale, an alternative measure of OC symptoms (convergent validity) and moderate to strong correlations with BDI-II depression and the remaining BSI symptom subscales (discriminant validity). Finally, validity coefficients of both OC measures were compared by means of Williams’ test as recommended by Steiger (1980) to examine whether both OC measures map the nomological net of the construct in a similar fashion.
In Step 4, Evidence Regarding Relations with Criteria was collected by computing ROC (receiver operating characteristic) analyses (for details, see Swets, 2014). ROC analyses are useful for assessing the ability of a measure to accurately predict group membership, that is, to distinguish between positive cases (i.e., a diagnosis of OCD) and negative cases (i.e., no diagnosis) on the basis of a fallible test score. The diagnostic accuracy is quantified by using the association between sensitivity and specificity to estimate the area under the curve (AUC). A hypothetical value of 1.0 indicates perfect diagnostic prediction, whereas a value of .50 indicates the level of chance. In practice, values in between .50 and 1.0 are observed and evaluated as representing low (.50 < AUC < .70), moderate (.70 < AUC < .90), and high accuracy (AUC > .90; J. E. Fischer, Bachmann, & Jaeschke, 2003).
For all steps except Step 4, we analyzed data from the OCD group as both measures were proposed for clinical practice by test authors (Foa et al., 2002; Thordarson et al., 2004). To examine the identification of positive and negative cases (Step 4), we merged the OCD group and Control group. Statistical analyses were primarily conducted in the program R (e.g., package “psych” version 1.4.8.11; Revelle, 2014). Structural equation models were specified in Mplus 7.2 (Muthén & Muthén, 1998-2012). Significance testing was conducted with α = .05.
Results
Results regarding the comparability of the OCI-R and the VOCI will be reported first. The model in which factor scores of the first-order factors served as indicators for a latent OCI-R and a latent VOCI variable fitted well: χ2(48) = 142.19, p < .01, standardized root mean square residual (SRMR) = .059, root mean square error of approximation (RMSEA) = .079, 90% RMSEA CI [.065, .094], comparative fit index (CFI) = .959. The latent correlation was significant and large (r = .98, p < .001). A model in which the latent correlation was fixed to one also fitted well: χ2(49) = 144.96, p < .01, SRMR = .059, RMSEA = .079, 90% RMSEA CI [.065, .094], CFI = .959. In line with no differences in fit indices, the scaled χ2 difference test was also not significant (Δχ2 = 2.79, Δdf = 1, p = .09). Further evidence concerning the comparability of OCI-R and VOCI were obtained by directly comparing correlations between OCI-R/VOCI scores and BSI scores of three key constructs from the nomological network. Correlations with BSI OC, BSI Anxiety, and BSI Depression were highly similar across OCI-R and VOCI (Δr < .07; see Table 3) corroborating that both measures have a highly similar position in the nomological network. This indicates that the underlying concepts of OC symptomatology are captured in a highly similar manner, which means that comparison between psychometric properties, displayed below, are unlikely to be due to differing content covered.
Comparison of Validity Coefficients (Convergent and Discriminant) for the OCI-R and VOCI.
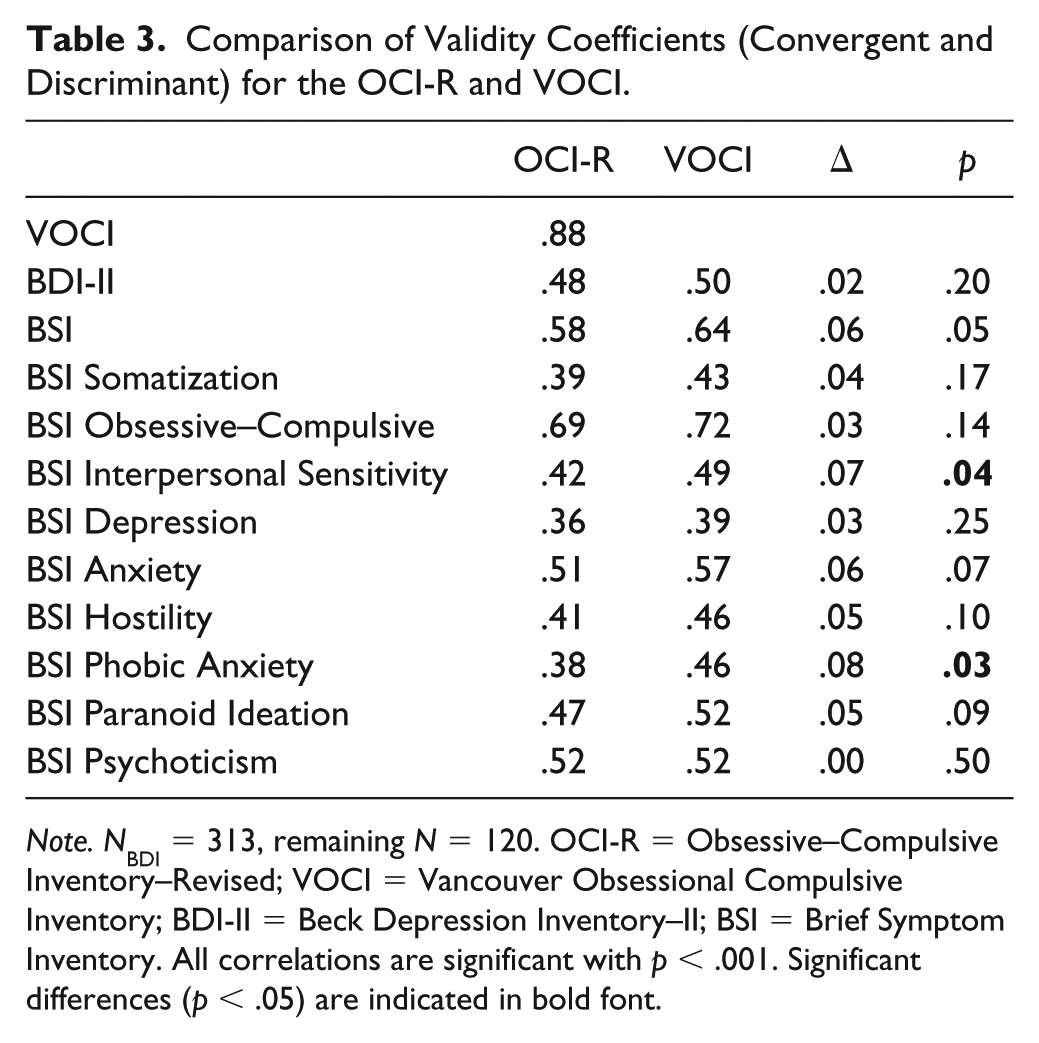
Note. NBDI = 313, remaining N = 120. OCI-R = Obsessive–Compulsive Inventory–Revised; VOCI = Vancouver Obsessional Compulsive Inventory; BDI-II = Beck Depression Inventory–II; BSI = Brief Symptom Inventory. All correlations are significant with p < .001. Significant differences (p < .05) are indicated in bold font.
In Step 1 of the comparison, we will consider evidence regarding the internal structures of OCI-R and VOCI. The model for the OCI-R is depicted in Figure 1. All loadings were substantial and exceeded .7, thus suggesting that the items are homogeneous indicators of the OC dimensions. Loadings of the lower order factors on the higher order factor ranged from .28 (Washing) to .91 (Ordering). Fitting the model to the sample data yielded an acceptable fit for the specified six-factor hierarchical model, χ2(129) = 444.00, p < .01, WRMR = 1.128, RMSEA = .089, 90% RMSEA CI [.080, .098], CFI = .987. By contrast, the six-factor hierarchical VOCI model did not yield an acceptable fit due to substantial content overlap in items from several subscales. To model the source of the misfit, correlated errors were specified accordingly (see Table 4), leading to a more acceptable model fit, χ2(1413) = 8176.63, p < .01, WRMR = 1.816, RMSEA = .123, 90% RMSEA CI [.121, .126], CFI = .965, with all loadings in the measurement model exceeding .5 except for the Obsessions subscale (λ = .49, p < .001). Loadings of the lower order factors on the higher order factor ranged from .35 (Contamination) to .99 (Just Right). The VOCI model is shown in Figure 2.
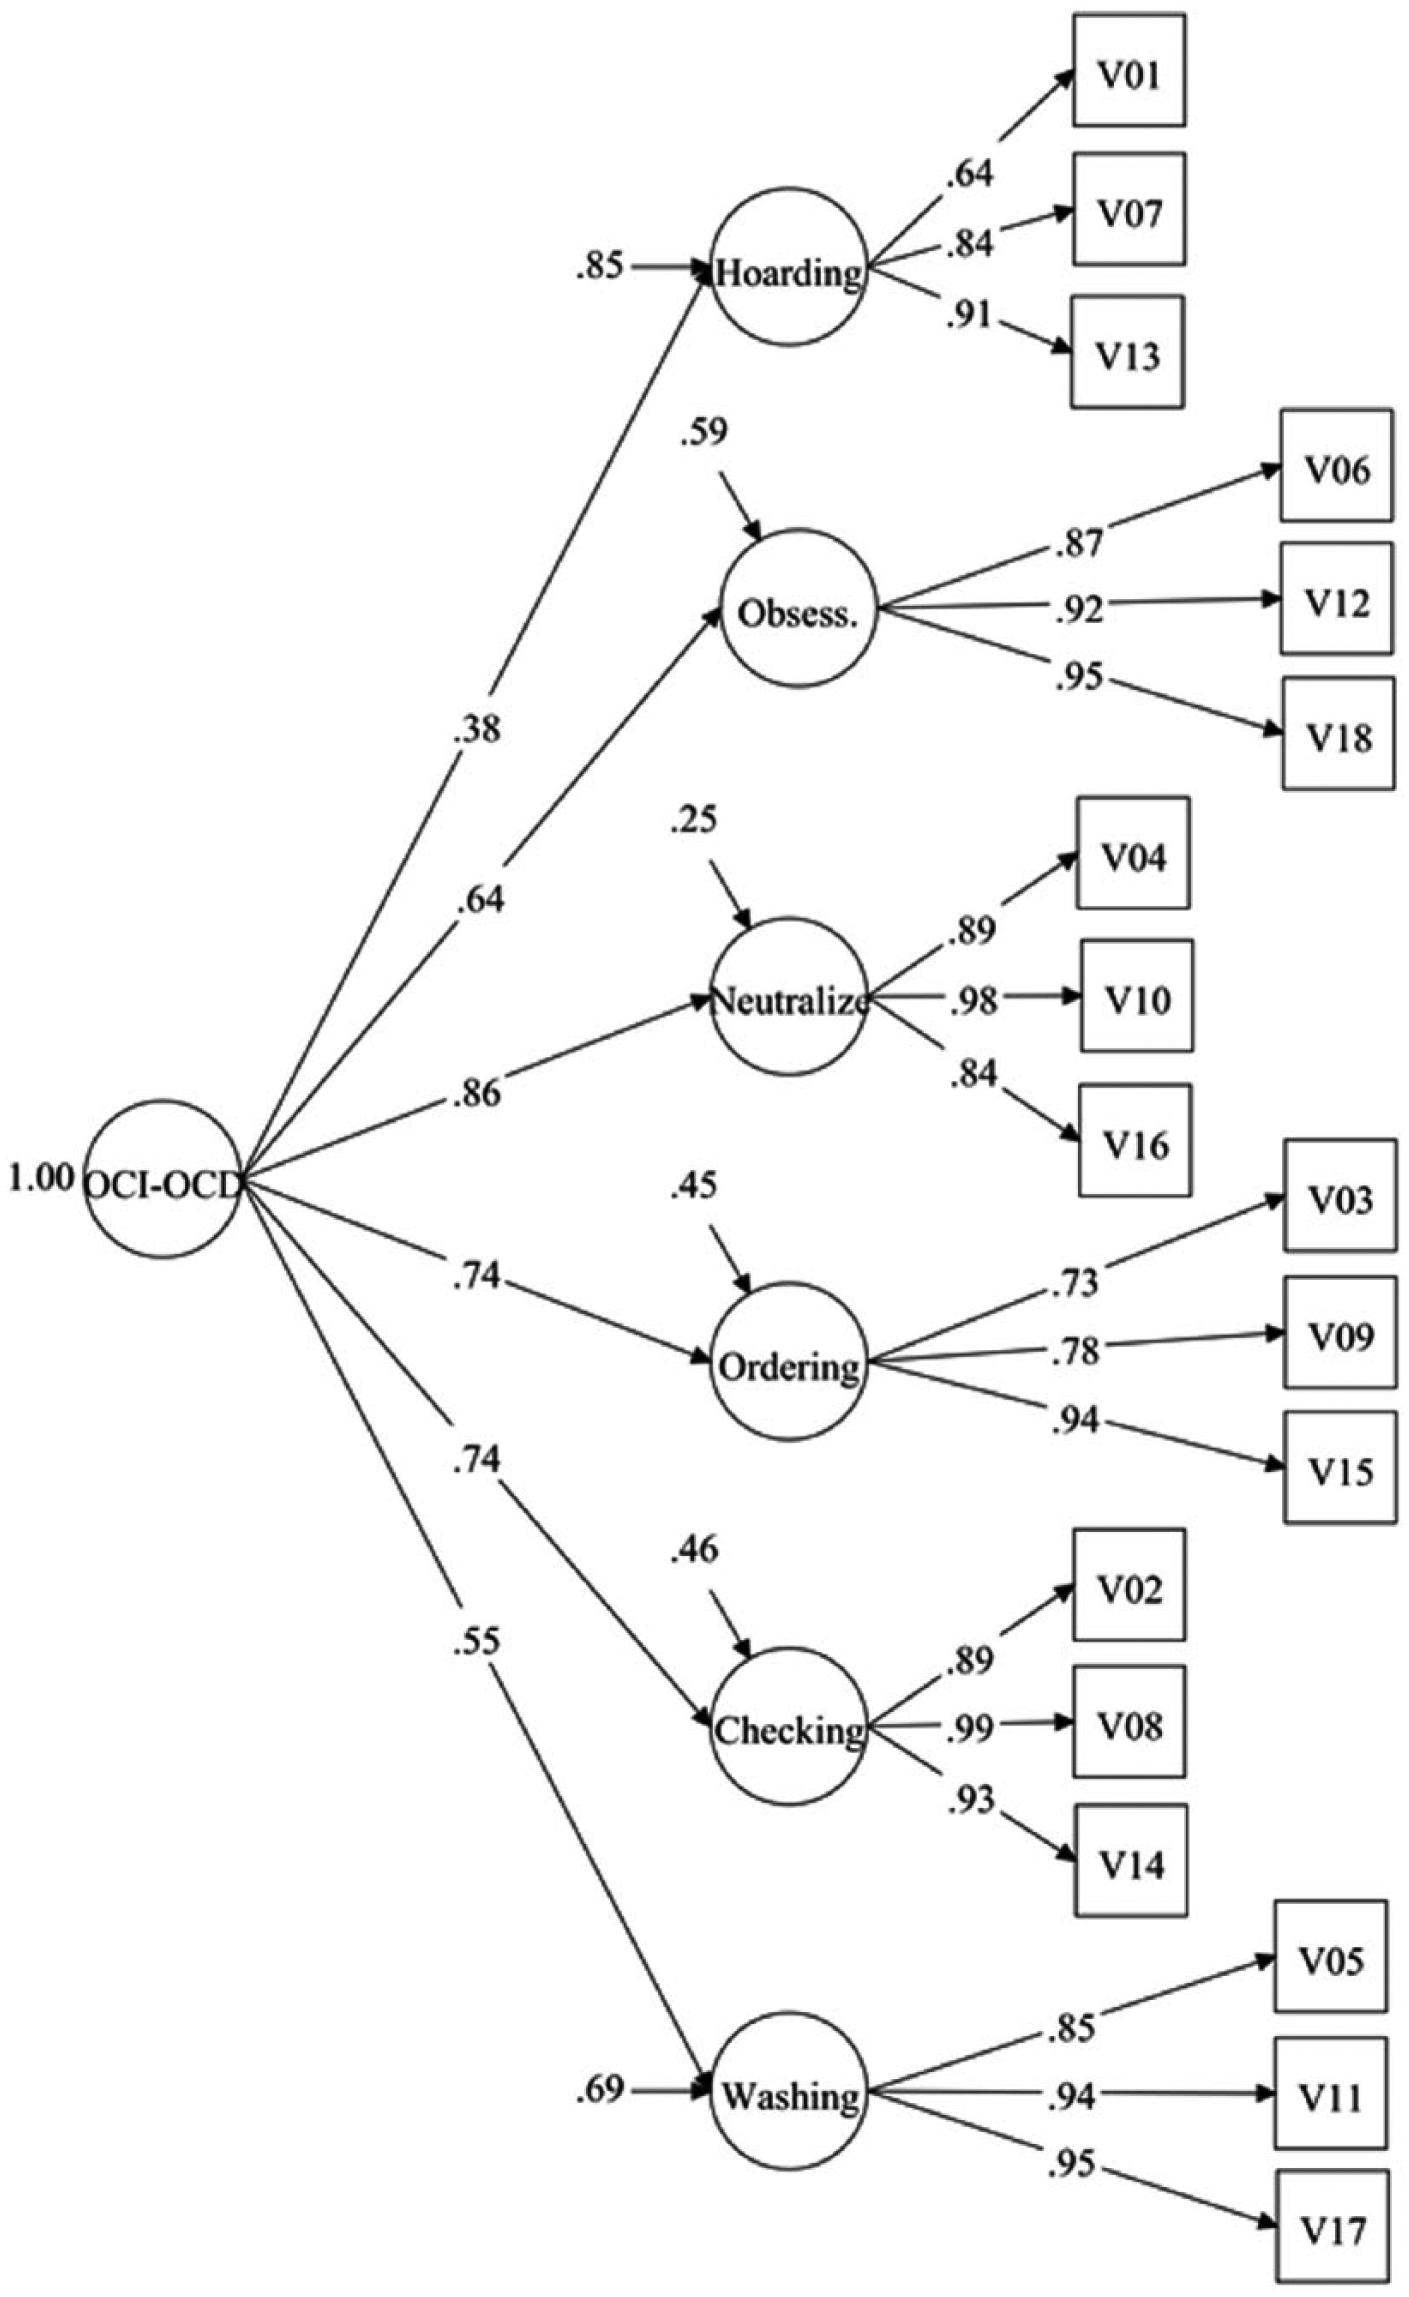
CFA model for the OCI-R.
Fit Indices for (Modified) Measurement Models of VOCI Subscales.

Note. df = degrees of freedom; WRMR = weighted root mean residual; RMSEA = root mean square error of approximation with 90% [confidence interval]; CFI = comparative fit index; VOCI = Vancouver Obsessional Compulsive Inventory.
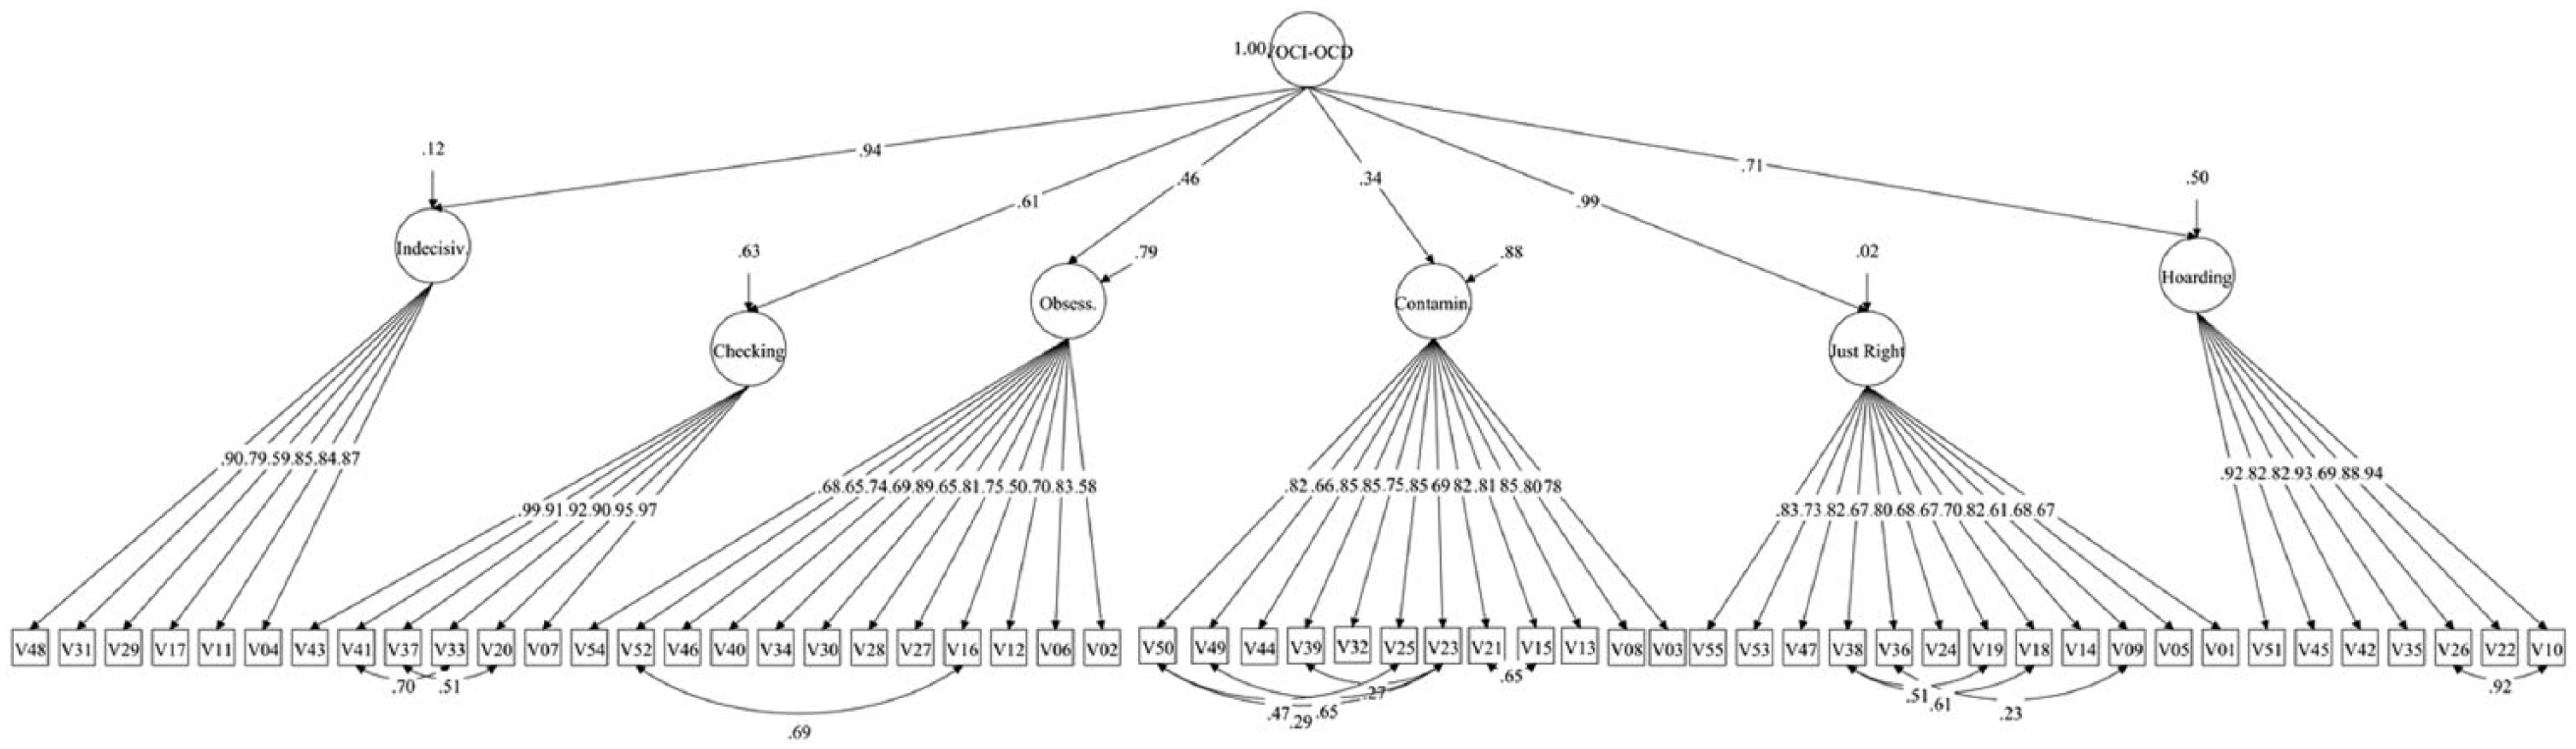
CFA model for the VOCI.
In Step 2, reliability estimates for the total and subscale scores of the OCI-R and VOCI were calculated (see Table 5). For the OCI-R, the estimates were generally high (Ω W > .80). Despite the small number of three items on each of the subscales, the reliability estimates for the subscale scores were higher than the estimate for the total score, suggesting a high homogeneity and low bandwidth of the subscales. Considering the statistics-driven strategy that focused on the high loading items in a principal component analysis by which the OCI subscales were shortened, this result is not surprising. Concerning the VOCI, estimates of most of the subscale scores exceeded .84. For the total score, Ω W was .98. When applying the widely used cookbook-like interpretation of reliability estimates, the OCI-R/VOCI total scores as well as the subscale scores would have to be considered highly reliable.
Reliability Estimates Ω w for Subscales and Total Scores of the OCI-R and VOCI.
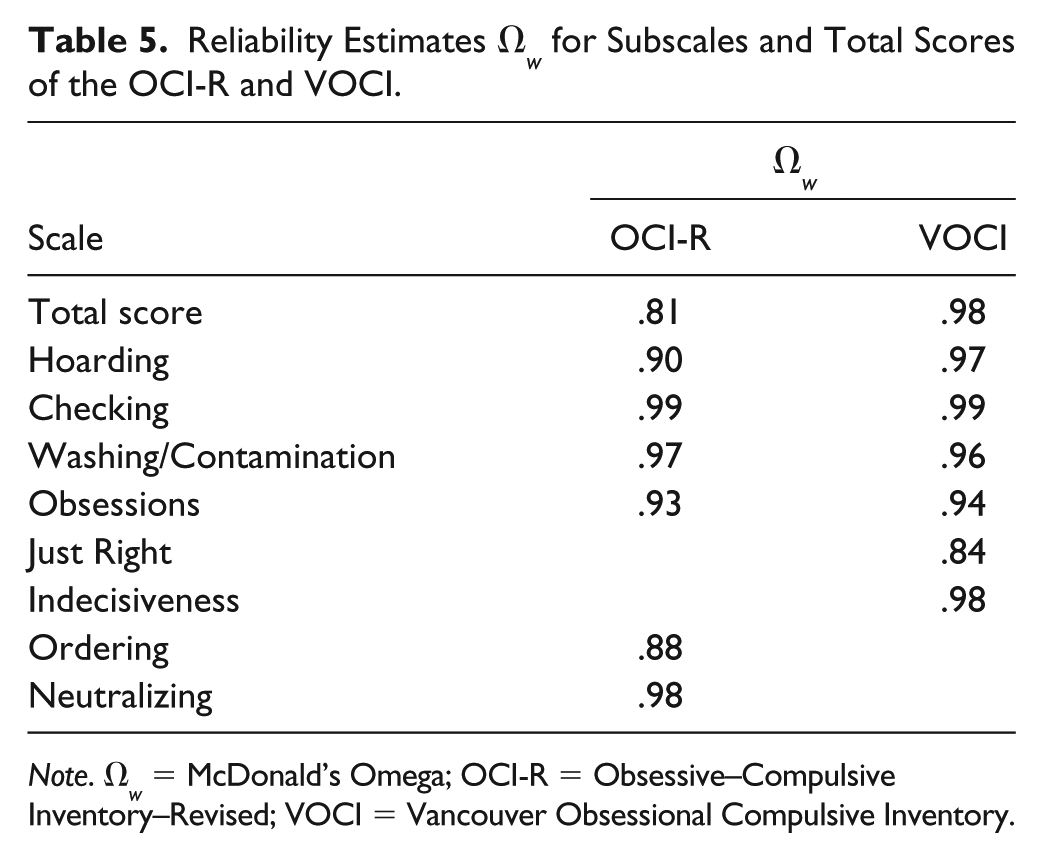
Note. Ω w = McDonald’s Omega; OCI-R = Obsessive–Compulsive Inventory–Revised; VOCI = Vancouver Obsessional Compulsive Inventory.
To evaluate measurement precision, we compared the relative CIs for the OCI-R and the VOCI (see Table 6). Remarkably, whereas the standard errors of measurement of both tests were similar in the current data set, the relative CIs differed substantially when test length (maximum scale score of 72 vs. 208 for the OCI-R and VOCI, respectively) was taken into account, CIrel (OCI-R) = .31 and CIrel (VOCI) = .10. This implies that the CI for the OCI-R test score covered 31% of the scale, whereas the CI for the VOCI score covered only 10% of the scale. Applying the CIs around the predefined cutoffs, yields the following results. For the OCI-R with a range of admissible test scores between 0 and 72, the interval of uncertainty ranged from 2.3 to 24.7. For the VOCI with a range of admissible test scores between 0 and 208, the interval of uncertainty ranged from 13.6 to 33.4. Overall, these results demonstrate that measurement precision differs substantially between the OCI-R and the VOCI. This in turn has implications for individual decision making, for example, the classification of persons to a treatment or no treatment condition or to the OCD or the Control group (see results on diagnostic accuracy below).
Measurement Precision of OCI-R and VOCI.
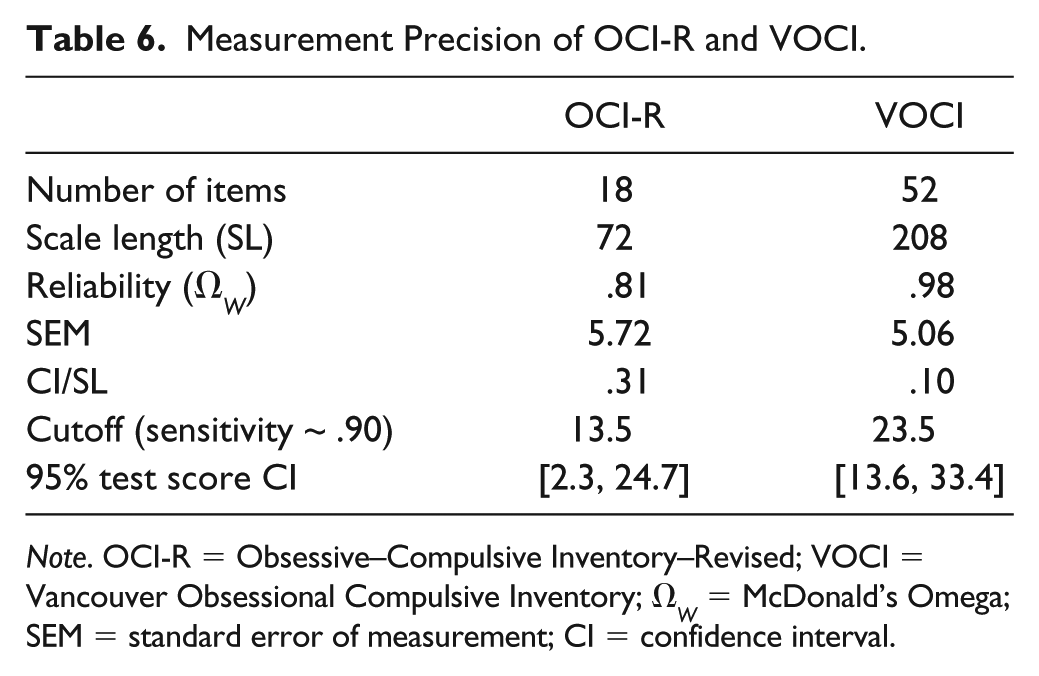
Note. OCI-R = Obsessive–Compulsive Inventory–Revised; VOCI = Vancouver Obsessional Compulsive Inventory; Ω W = McDonald’s Omega; SEM = standard error of measurement; CI = confidence interval.
In Step 3, Evidence Regarding Relations with Conceptually Related Constructs were obtained by correlating the OCI-R and VOCI scores with BDI-II and BSI scores (see Table 2). As expected, the strongest correlations of both OC measures were observed with an alternative measure—BSI OC—supporting convergent validity. Moderate to strong correlations were observed with the remaining BSI symptom scales as well as the BDI-II supporting discriminant validity. When evaluating the ability of both OC measures to map relations in the nomological net by comparing validity coefficients directly, significant differences were observed for BSI Phobic Anxiety and BSI Interpersonal Sensitivity. However, the effect sizes of these differences were marginal (Δr < .10). Overall, the pattern of convergent and discriminant relations was highly similar across the OCI-R and the VOCI (Spearman r = .97). In sum, these results demonstrate that the test scores of the two OC measures replicate relations in the nomological network in a similar fashion. This is in line with the strong overlap between the underlying latent variables.
Finally, we gathered Evidence Regarding Relations with Criteria. We conducted ROC analyses for the OCI-R and VOCI total scores to determine the diagnostic accuracy of each test score and to determine which of the test scores could best distinguish between persons diagnosed with OCD and controls. The ROC curves are depicted in Figure 3. As can be seen, both test scores allowed for an identification of persons with clinical levels of OC symptoms above the level of chance. However, the two curves differed substantially, suggesting a lower diagnostic accuracy of the OCI-R score. Table 7 shows combinations of sensitivity and specificity values and related cutoffs for both total scores. These results clearly show that the VOCI score is superior to the OCI-R score for the identification of OCD patients and the avoidance of false positives. Overall, diagnostic accuracy estimates obtained for the OCI-R score (AUC = .69, 95% AUC CI [.64, .74], p < .001) can be considered as rather low (cf. J. E. Fischer et al., 2003). Accordingly, distinguishing OCD patients from controls in our study was difficult with the OCI-R. By contrast, the diagnostic accuracy estimate for the VOCI suggested a very good differentiation between OCD patients and controls in our sample (AUC = .94, 95% AUC CI [.92, .96], p < .001).
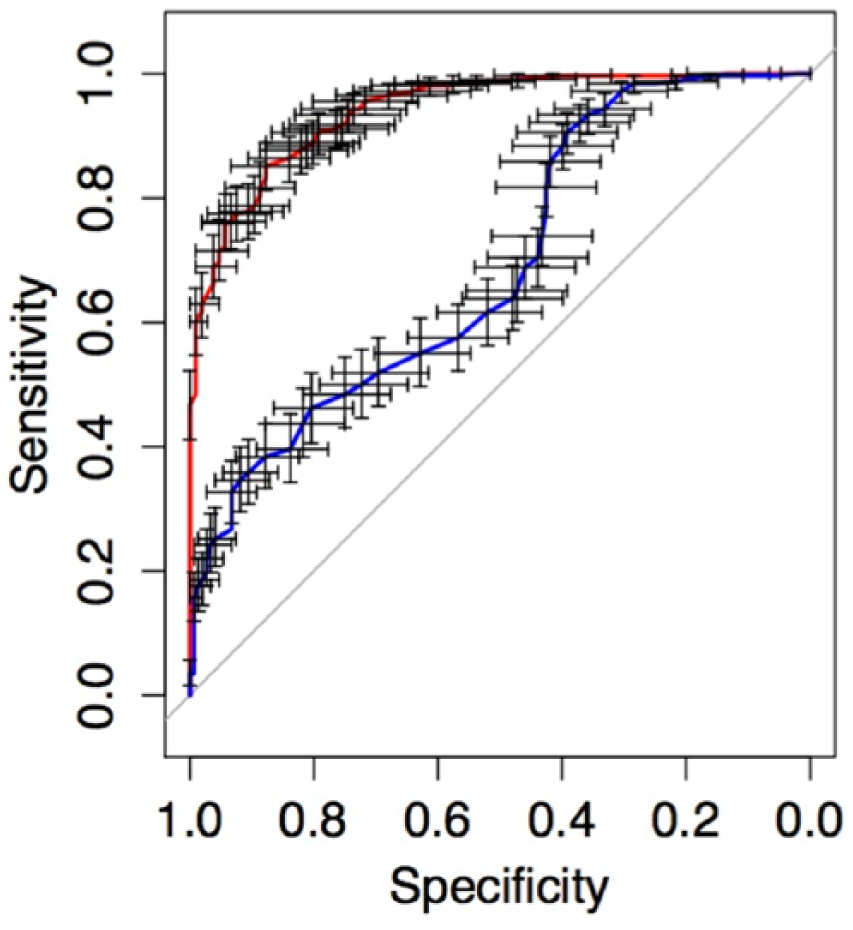
Receiver operating characteristic curves (ROCs) for the OCI-R (blue curve) and VOCI (red curve).
Cutoff Values for the OCI-R and VOCI Total Score and Resulting Sensitivity and Specificity for Discriminating Between OCD Group and Control Group.
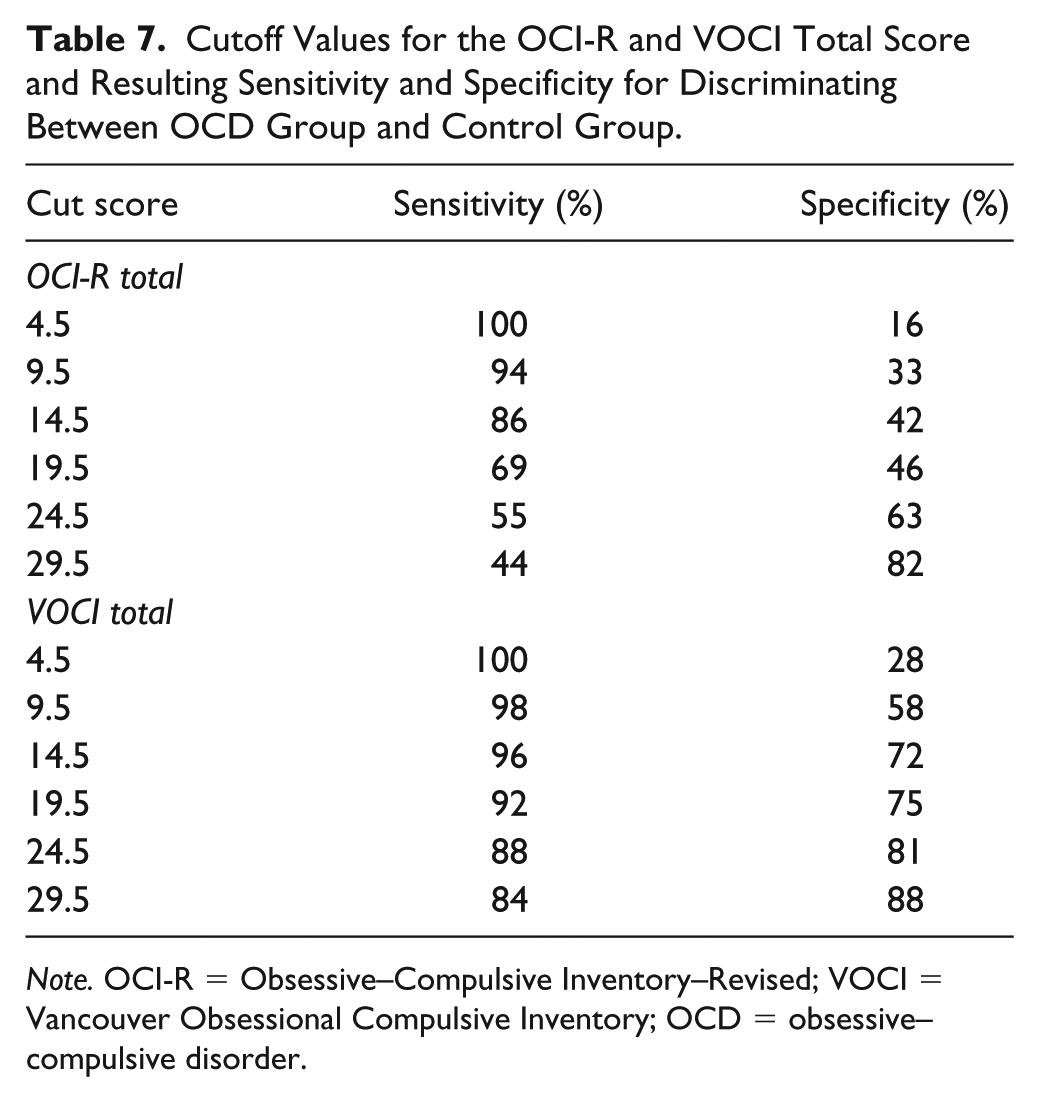
Note. OCI-R = Obsessive–Compulsive Inventory–Revised; VOCI = Vancouver Obsessional Compulsive Inventory; OCD = obsessive–compulsive disorder.
Discussion
Researchers or practitioners usually face a situation in which it is necessary to make a choice between several potentially viable scales that are designed to measure a certain construct. As each scale score has a unique profile of psychometric strengths and weaknesses, this decision is not trivial. Detailed guidelines and frameworks on test evaluation exist to allow for an informed choice (e.g., Standards, 2014). However, in current test evaluation practice it is sometimes neglected to make such an informed choice in favor of applying the more pragmatic approach of comparing the psychometric evidence that is currently at hand with the cutoff values that are proposed in the literature. Notably, there is a crucial decision criterion that is frequently overlooked: the intended use or assessment objective. The main aim of the research presented here is to raise awareness of this theory-practice divide and to demonstrate the consequences of the pragmatic test evaluation approach. We used two measures of OC symptoms that differed considerably in test length—a test property with high appeal to many researchers and practitioners alike—and evaluated the measures by taking the assessment objective into account.
First, we discuss what a decision to choose one of the two OC measures would look like when following a pragmatic test evaluation approach. Hogan (2004) reported that results on reliability, internal structure, and correlations with related constructs are routinely mentioned in test validation studies. Accordingly, we evaluated results on reliability, internal structure, and correlations with related constructs by applying a cookbook-like interpretation and finally compared the evidence that supported the use of the two OC measures.
Concerning the reliability, both OC scale scores captured a high percentage of true score variance that well-exceeded the commonly proposed cutoffs. Concerning the internal structure, the OCI-R demonstrated slightly better fit statistics, presumably because problematic items (i.e., items with correlated errors) were removed during the revision of the OCI-R (see Foa et al., 2002). For the VOCI, the higher number of items implied more problems regarding its factorial validity. According to Heene et al.’s (2011) advice, sources of misfit for the VOCI were modeled in our analysis, thus revealing that the inferior model fit was primarily caused by analogous item wordings or similar method effects. These observed correlated errors could be interpreted as a general flaw in the longer VOCI scale. Alternatively, it could be argued that on the longer scale, the item difficulties varied to a greater extent (Ziegler, Poropat, et al., 2014). Thus, having some redundancy in the item content was unavoidable. One way to overcome the resulting correlated error terms in CFA models is to pay more attention to this issue during test construction. That having more items in a test might be a worthwhile endeavor is supported by the superior results for the VOCI in the ROC analyses (discussed below). In general, the results on the internal structure supported an acceptable degree of structural validity for both scales. Concerning relations with conceptually related constructs, both scale scores successfully replicated the known relations from the nomological network—correlations of OC measures with depression and psychological distress (Thordarson et al., 2004)—in a similar manner.
In sum, evaluating and comparing the two OC measures by applying a pragmatic test evaluation approach did not yield a clear winner even though the scales differed considerably in length in a ratio of one to three. This is supported by the finding that the two latent variables underlying the respective measures were virtually identical. Thus, the two OC scales performed similarly with regard to commonly evaluated types of evidence. Consequently, preferring the shorter scale over the longer scale seems to be a prudent and appropriate decision on the basis of this test evaluation strategy.
Applying an objective-driven test evaluation strategy (see, e.g., Standards, 2014; Ziegler, 2014), however, completely changes the picture and would lead to a very different choice. Both OC scales were not exclusively recommended for clinical research for which the aforementioned evidence of psychometric quality can be deemed sufficient. The test authors proposed the use of their OC scale in clinical practice (Foa et al., 2002; Thordarson et al., 2004). Besides demonstrating the scale score’s ability to accurately map the OC construct (e.g., by establishing reliability, factorial validity, and convergent and discriminant validity), scores have to provide accurate estimates of a person’s true score when scales are used in individual decision making. This is a necessary condition that affects other psychometric qualities of the test score that are of crucial importance in clinical practice, such as assigning a person to a treatment condition on the basis of clinical levels of symptoms with high certainty (screening) or evaluating individual treatment outcomes (assessment of individual change). Taking into account this assessment setting and the specific demands it entails, a preference for the shorter OCI-R over the longer VOCI would be a poor choice as the profile of psychometric qualities of the OCI-R does not fit this intended use.
Findings regarding measurement precision support this conclusion. Measurement precision for the OCI-R total score was considerably lower than for the VOCI total score. The resulting interval of uncertainty for the OCI-R ranged from 2.3 to 24.7 with a range of admissible test scores from 0 to 72. Thus, there was a large part of the scale—about one third—for which a reliable classification of individuals would not be possible. For the VOCI, the interval of uncertainty ranged from 13.6 to 33.4 with a range of admissible test scores from 0 to 208. The interval of uncertainty covered a much narrower part—about one tenth—of the scale for the VOCI. This relatively larger effect of random measurement error involved in the OCI-R score paved the way for inaccurate decisions as indicated by the ROC analysis. Due to the higher ratio of measurement error to scale length, the CI was rather large, an outcome that results in more classification errors and lower sensitivity and specificity (cf. Emons et al., 2007). The inferior performance in the ROC analysis is an important argument against using the OCI-R in clinical settings where individual diagnoses are made.
In sum, when applying an objective-driven test evaluation strategy, for example, by paying attention to measurement precision and by focusing on sensitivity and specificity instead of criterion correlations, the test evaluation resulted in a different choice. The additional evidence clearly showed that a selection of the shorter measure would undermine the intended goal of the testing. That is, obtaining an accurate assessment of OC symptoms as a basis for decisions for specific individuals in clinical practice.
What are the implications of the analysis presented for the measurement of OC symptoms? The evidence clearly supports the use of the OCI-R and the VOCI in clinical research. Due to the observed shortcomings, however, the OCI-R cannot be recommended without limitations for clinical decision making. Classification decisions based on observed OCI-R scores cannot be made with high certainty as its sensitivity and specificity were mediocre at best. The ability of the OCI-R score to accurately detect persons with clinical levels of OC symptoms is not sufficiently high to recommend its use as a screening tool either, especially as a stand-alone assessment. Furthermore, the results of computational studies suggest that assessing individual change could also be adversely affected when short scales are used (Kruyen, Emons, & Sijtsma, 2014). Thus, although the measures were largely equivalent as indicators of the construct so that both would be suitable when dimensional scores are important, preferring the OCI-R over the VOCI because of its brevity cannot be recommended when individual test scores and categorical decisions are sought.
Regarding the conclusions drawn, three issues need further consideration. In our study, we analyzed data from only one clinic, which may limit the generalizability of the results that we obtained. Moreover, we used two measures of OC symptoms as an example. The two scales are multidimensional measures of OC symptoms that differ not only in test length but also in homogeneity of item content. All else being equal, different results might have been obtained if we had compared, for example, two OC scales with highly homogenous subscales or a short and long version from the same test family. Thus, the current results are to some extent specific to the pair of tests we used. Nonetheless, we believe that our research addresses an undertested aspect in assessment and is, thus, informative in its own right. It provides a template for the examination of the trade-off between resources and psychometric quality and informs decisions on the selection of appropriate measures in clinical research and practice. A final issue to consider is that our ROC analysis might have been affected by the choice of controls. The exclusion criteria we applied do not fully exclude the possibility of individual cases with clinically salient levels of anxiety who never sought treatment. A direct assessment of anxiety pathology would have been preferable. However, if such cases were present in the data, estimates of diagnostic validity of both measures would have been attenuated.
General Implications
Some conclusions that can be drawn from our research pertain to the use of short versus long scales in general (for a summary of pros and cons for the use of short scales including our own conclusions see Table 8). Short scales are still criticized by some researchers who call their psychometric quality into question and discourage their use (e.g., Credé et al., 2012). Given that a short- and long-measure map the same construct and efficiency is only a minor issue, the longer measure should be the default option. Using a measure with many items usually results in substantial true score variance being captured by the test score, a good discrimination of persons, more accurate classifications and assessment of individual change, and a broader construct coverage (see, e.g., Kruyen et al., 2014; Lord & Novick, 1968; Sijtsma & Emons, 2011).
Pros and Cons for the Use of Short Scales.
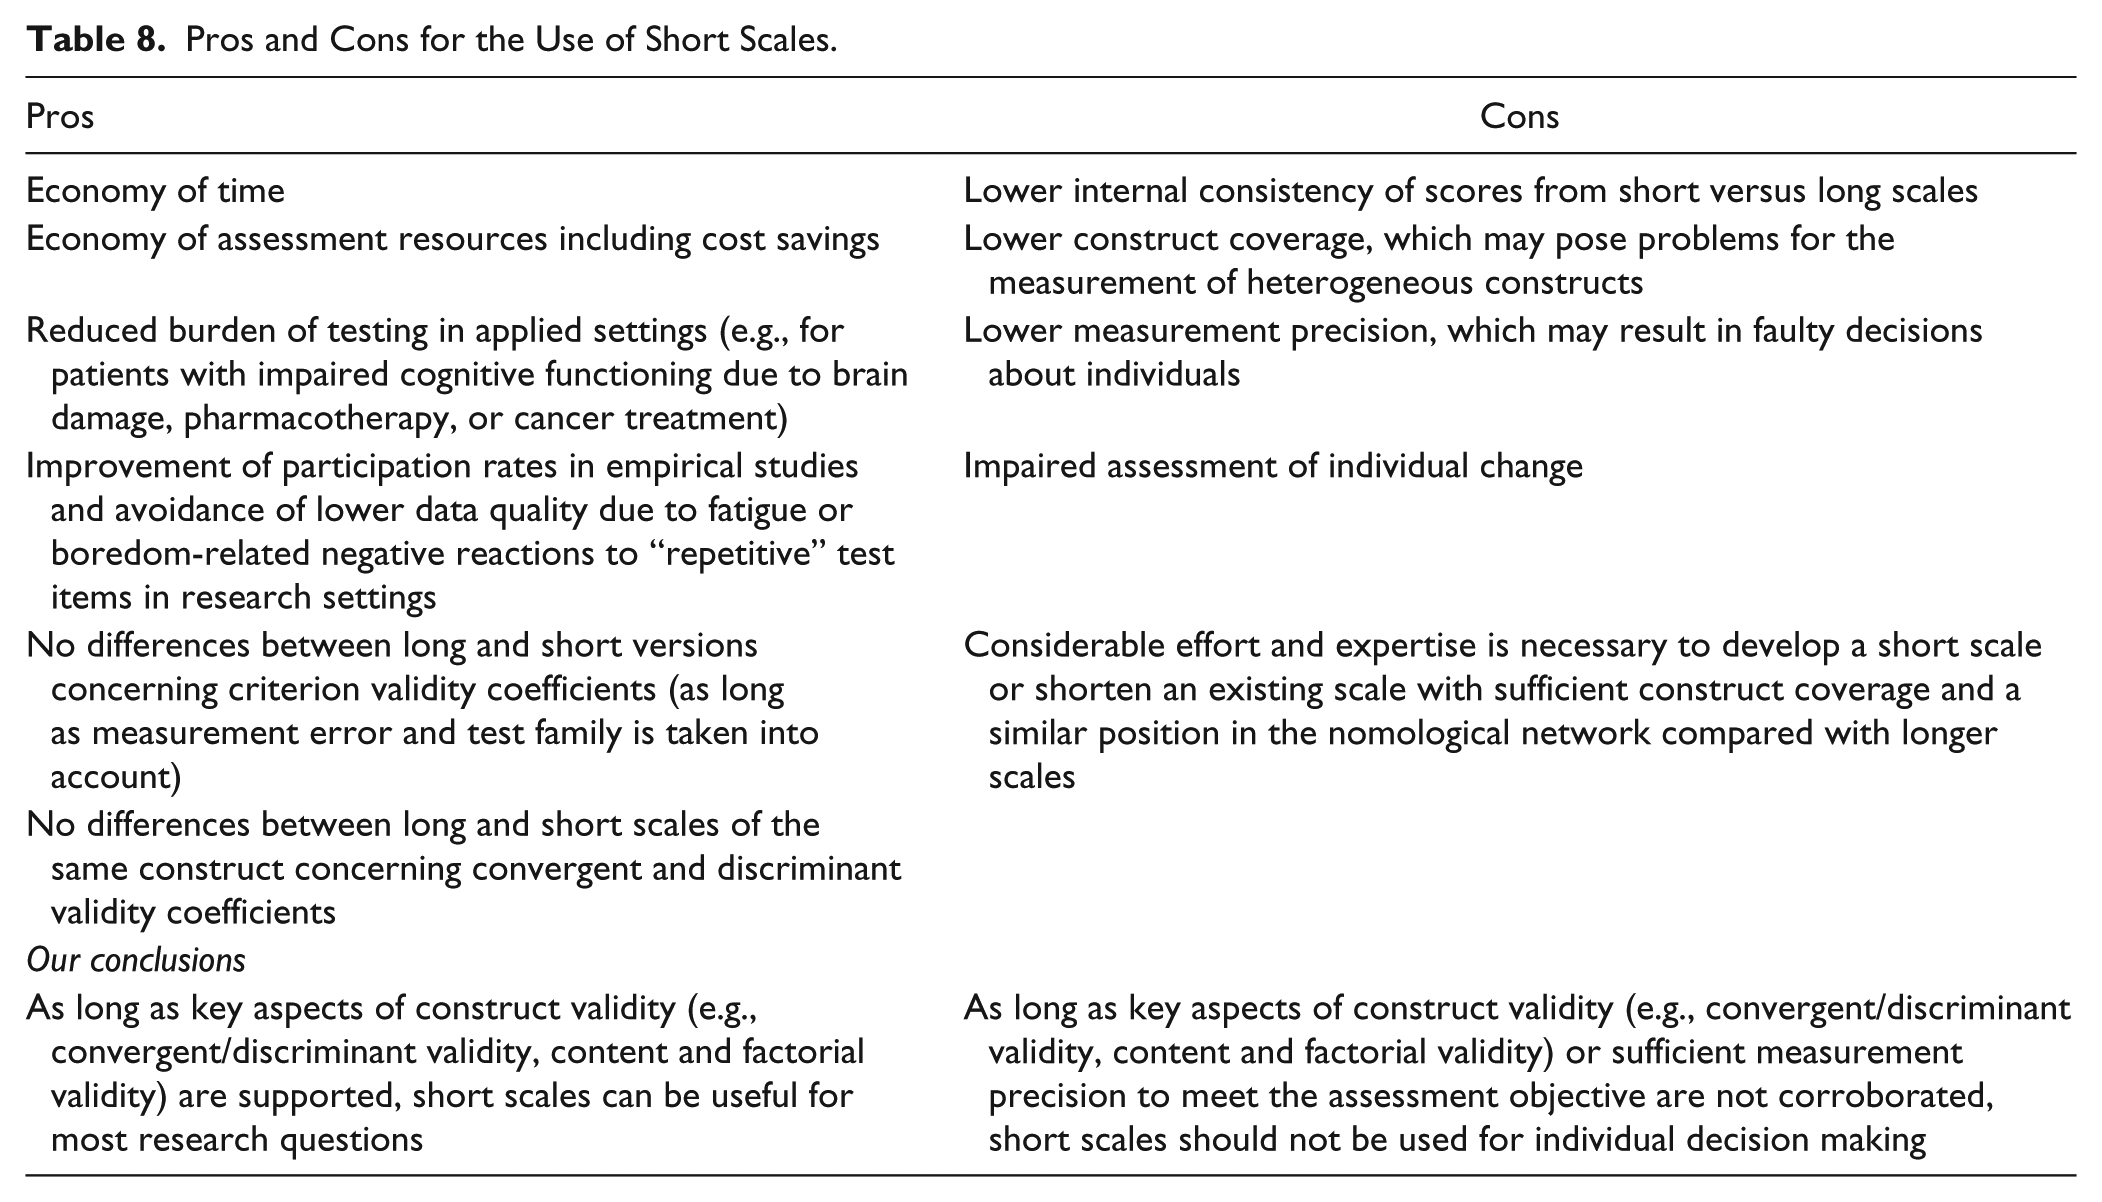
However, researchers and practitioners may frequently face assessment situations, in which restrictions on time and financial resources are in place. For these settings, short scales can be a reasonable option, given their profile of psychometric properties fits the demands of the assessment situation. Our analysis demonstrated what has been repeated over and over in the psychometric literature but appears to be frequently overlooked by critics—that the psychometric quality of a short scale cannot be appropriately evaluated without considering the assessment objective. We showed that a rigid application of cutoff scores may lead to suboptimal choices of self-report measures, and such choices in turn may result in decision errors and suboptimal assessment procedures. Accordingly, it is not justifiable to reject the use of a short scale on the basis of a pragmatic test evaluation of the evidence at hand, say a reliability estimate of .67, which is well-below the commonly applied cutoff value. When evidence for the construct validity of this short scale is compelling, the short scale may still be valuable for research purposes for which a large sample size can be more important than the high reliability of a score (e.g., when testing group-means difference; Sijtsma & Emons, 2011). Looking at the other side of the coin, it is of course also not appropriate to readily accept the use of a short scale on the basis of a reliability estimate that exceeds a widely used cutoff, especially when individual test scores matter (Sijtsma, 2009). Thus, the crucial question to be asked when considering the use of a short scale in psychological assessment is whether the psychometric evidence supports the intended use of the scale.
Footnotes
Acknowledgements
We would like to thank Lea Späth, Johanna Eisenhofer, Nilima Chowdhury, and the team of the academic outpatient unit for psychotherapy at Humboldt University for their help in collecting the data and running the analyses.
Declaration of Conflicting Interests
The author(s) declared no potential conflicts of interest with respect to the research, authorship, and/or publication of this article.
Funding
The author(s) received no financial support for the research, authorship, and/or publication of this article.