
Abstract
Forced choice (FC) measures may be a desirable alternative to single stimulus (SS) Likert items, which are easier to fake and can have associated response biases. However, classical methods of scoring FC measures lead to ipsative data, which have a number of psychometric problems. A Thurstonian item response theory (TIRT) model has been introduced as a way to overcome these issues, but few empirical validity studies have been conducted to ensure its effectiveness. This was the goal of the current three studies, which used FC measures of domains from popular personality frameworks including the Big Five and HEXACO, and both statement and adjective item stems. We computed TIRT and ipsative scores and compared their validity estimates. Convergent and discriminant validity of the scores were evaluated by correlating them with SS scores, and test-criterion validity evidence was evaluated by examining their relationships with meaningful outcomes. In all three studies, there was evidence for the convergent and test-criterion validity of the TIRT scores, though at times this was on par with the validity of the ipsative scores. The discriminant validity of the TIRT scores was problematic and was often worse than the ipsative scores.
The most commonly used item type in personality assessment is a single stimulus (SS) item, such as the Likert-type item, even though its shortcomings, such as susceptibility to responses biases, have been widely discussed (Cheung & Chan, 2002; Danner et al., 2016). One alternative is the forced choice (FC) method. Respondents are presented with items representing opposite poles of the same trait continuum (e.g., introversion and extraversion), or respondents are presented with multidimensional FC blocks containing at least two items, each one an indicator of a different latent trait. Respondents are instructed to either partially or fully rank the items according to which is most-least descriptive of them. Items within multidimensional blocks are often matched in terms of their level of social desirability or perceived relevance, which reduces the potential for faking. That is, respondents cannot simultaneously make themselves look good on all traits represented within that block so the tendency to respond in a desirable manner is diminished. As a result, the FC method has been conceptualized as a solution to the problem of faking, particularly on high stakes assessments such as those used for personnel selection. Indeed, several empirical studies have established that FC scales are less susceptible to faking (Christiansen, Burns, & Montgomery, 2005; Jackson, Wroblewski, & Ashton, 2000; cf. Heggestad, Morrison, Reeve, & McCloy, 2006). Moreover, given that no scales are used (e.g., multipoint Likert scales), response biases such as acquiescent responding or halo effect should be eliminated (Cheung & Chan, 2002). Finally, meta-analytic findings suggest that FC inventories have greater predictive validity than normative data (Bartram, 2007; Salgado & Táuriz, 2014).
Despite some noted advantages of FC assessments, they have also been met with criticism. One commonly cited problem with the multidimensional FC design is the scoring procedure. Typically with a classical ipsative approach, the item selected to be most like the respondent is given a score of 2, the item(s) not selected is given a score of 1, and the item selected to be least like the respondent is given a score of 0 (or some mathematical equivalent of these scores). Alternatively, in the case of fully ranking items, scores of 4, 3, 2, and 1 are given to items ranked 1, 2, 3, and 4, respectively (in blocks consisting of four items; Hontangas et al., 2015). This yields ipsative scores; that is, the total score (i.e., the sum across dimensions) is constant for all individuals. Moreover, given that respondents must select among items representing different traits, there is a degree of dependability among trait scores; being high on one trait necessitates being lower on other traits. Therefore, an individual’s trait scores are relative to one another and cannot be considered absolute, rendering meaningful interindividual comparisons difficult. Meade (2004) provided an in-depth look at several problems associated with FC ipsative data and noted that the psychometric properties of such data render reliability and factor analyses impossible. Furthermore, he showed that normative versus ipsative measures can lead to different selections in hypothetical hiring decision processes, particularly when using moderate or high cut-scores, and cautioned against using FC ipsative data for such high stakes purposes.
Several authors have argued that such items can be more appropriately modeled with item response theory (IRT) models, which would allow for normative comparisons (Maydeu-Olivares & Brown, 2010; Wang, Lee, Joo, Stark, & Louden, 2016; Wang, Qiu, Chen, Ro, & Jin, 2017). There are a few such models. For example, Stark, Chernyshenko, and Drasgow (2005) proposed the multi-unidimensional pairwise-preference model for two-item blocks, which can be extended to handle different response formats with more than two items per block (Hontangas et al., 2015), and McCloy, Heggestad, and Reeve (2005) proposed an IRT model for scoring data that are partially ipsative (i.e., being high on one trait necessitates being lower on other traits, but total score variability is allowed). We will focus on the Thurstonian IRT model (TIRT; Maydeu-Olivares & Brown, 2010), a normal ogive model with structured loadings, uniquenesses, and local dependencies. Binary outcomes, which are comparisons of different items within the same block, are modeled (see Brown & Maydeu-Olivares, 2011, or Dueber, Love, Toland, & Turner, 2018, for a more “elementary level” introduction to the model). This model is increasingly popular in part due to the easily accessible Mplus scoring syntax (Brown & Maydeu-Olivares, 2012) and its ability to yield accurate latent trait estimates. To fully evaluate the appropriateness of this model, Brown and Maydeu-Olivares (2011) carried out a number of simulation studies to assess the recovery of item parameters and latent trait scores under various conditions (see also Xiao, Liu, & Li, 2017). They concluded that when design recommendations are met for parameters such as the number of traits assessed, block size, number of items per trait, correlations among traits, and the keyed direction of the items, the method yields accurate latent trait estimates.
The introduction of such models seems to have spurred greater interest in the use of FC inventories for both research and practice. It is critical, however, to ensure that such scoring approaches produce valid scores, relative to classical ipsative approaches. Given that these approaches are in their infancy, there is limited validity evidence to support them. In one study, researchers examined the validity evidence for an emotional intelligence FC measure and concluded that TIRT-derived scores had greater convergent and test-criterion validity evidence than scores derived from the classical ipsative approach (Anguiano-Carrasco, MacCann, Geiger, Seybert, & Roberts, 2015). In contrast, findings from a study on narcissism indicated that the scores derived from the two approaches had similar correlations with criterion-related variables (Wetzel, Roberts, Fraley, & Brown, 2016). The current study focuses on two popular and well-validated personality frameworks, the Big Five and HEXACO models, thus a study examining validity evidence for Big Five personality scores derived from the TIRT model is particularly relevant. In a study of Korean university students, Lee, Lee, and Stark (2018) reported acceptable convergent, discriminant, and test-criterion validity estimates for TIRT Big Five scores, though these were similar to or only slightly better than ipsative scores.
Rationale for the Current Studies
Alone or in concert with other item types, FC inventories may be desirable when faking is a concern or when one wants to mitigate response biases. They have the added advantage of being as or more valid than SS items, according to meta-analytic data. When using FC inventories, one must consider various scoring options. Until recently, scores derived from FC items have been ipsative, not allowing for interindividual comparison. Newer IRT-based approaches are necessary for creating normative scores that allow for interindividual comparisons, and the TIRT approach is experiencing an upswing in usage. Particularly, when the goal is to generate broad personality factor scores often used in high stakes settings like personnel selection (e.g., Barrick & Mount, 1991; Rothstein & Goffin, 2006), it is necessary to establish the validity of this approach, specifically with a head-to-head comparison of scores derived from the TIRT approach versus the ipsative approach. Lee et al. (2018) made a solid first step in this endeavor. We extend this work by exploring multiple item types and personality taxonomies and use three different samples ranging from high school students to community adults. Specifically, across three studies, our goal was to compare the convergent, discriminant, and test-criterion validity evidence of TIRT scores with classical ipsative FC scores. 1
Study 1
Rationale
To our knowledge, the only empirical study on the validity of Big Five TIRT scores examined statement item stems. We were interested in extending this work to examine the robustness of the TIRT model fit to responses to adjective ratings rather than statements.
Method
Participants
Prospective participants were all registered ACT test takers for the June 2017 national test date who were in Grades 9 to 12 and were in the United States (N = 363,797). Of those who received an invitation to take part in the study, 7,373 initiated the survey. Cases were removed from the data set if they skipped more than 20% of the FC items. The final data set included 5,268 students in Grades 10 to 12. Three thousand eight hundred seventy-one (73.5%) were female. Three percentage of the participants chose not to report their race/ethnicity, but of the remaining participants, the percentage of each category represented were as follows: White (69.1%), Hispanic or Latino (12.9%), Black or African American (6.7%), Asian (5.2%), and two or more races (3.1%).
Procedure and Measures
Participants’ contact information was obtained from ACT’s national database of registered test takers. After completing the ACT, students received an e-mail inviting them to participate in a short survey. It described the purpose of the study, indicated that participation was voluntary and would in no way affect students’ ACT scores, and stated that survey responses would not be provided to students’ chosen universities. The message included a Qualtrics survey link unique to each participant where they were directed to the measures described below. These survey responses were then matched to the ACT database that includes students’ ACT scores (i.e., composite score and subject-specific scores), grade point average (GPA), school involvement information, and self-reported demographic information, among other things.
In addition to some of the measures discussed below, school involvement, GPA, and ACT scores were included to evaluate test-criterion validity. Students were asked whether they participated in 12 school activities (e.g., band, student government, athletics, and theater), and participation was quantified by summing these 12 binary variables. One would expect school participation to have the greatest correlation with extraversion, given that individuals high in extraversion tend to be more social and active. Participants indicated their GPA on a 7-point scale in .5 increments ranging from “.5-.9 or lower” to “3.5-4.0 or higher.” GPA was expected to have the strongest relationship with conscientiousness (Poropat, 2009). Specific ACT-personality relationships were expected based on prior research with standardized test scores. In one study (Noftle & Robins, 2007), SAT verbal scores were positively related to openness, but no other Big Five traits were consistently related to SAT verbal scores, and no consistent associations with SAT math scores were observed.
It is common for students to quit such surveys before finishing so the amount of available data decreases with each measure in the survey. The amount of missing data for each measure is described below. Missing data were handled by excluding cases pairwise. Distributions of scores on all measures were close to normal.
Big Five forced choice—adjectives
The questionnaire consists of 10 blocks containing three adjectives each, one of which was negatively keyed. An example triad might include the adjectives: sympathetic, organized, and shy. The blocks were balanced so all permutations of three out of five traits were represented and each trait was assessed with the same number of items. In response to each block, participants were instructed to select the adjective that is “most like” them, select the adjective that is “least like” them, and do nothing with the third adjective. To score the FC measure, two approaches were taken. First, we computed classical ipsative scores (below referred to as “ipsative”). Each item received a score of 1 (“least like me”), 2 (“not selected”), or 3 (“most like me”). Within each trait, items were averaged to derive domain scores. Next, we estimated the TIRT model using Mplus (below scores derived from this model are referred to as “TIRT”). The TIRT model converged, had a reasonable fit to the data (comparative fit index [CFI] = .92; root mean square error of approximation [RMSEA] = .03), and produced reasonable parameter estimates with small standard errors. Factor scores from this model estimation were saved and used in subsequent analyses. One hundred nineteen participants were missing data for one triad but were still scored (Mplus uses all available data to estimate the model).
Big Five Inventory–10 (BFI-10)
The BFI-10 (Rammstedt & John, 2007) was included to evaluate the convergent and discriminant validity of the FC scores. The BFI-10 measures the broad Big Five domains with 10 SS items. Respondents indicated their level of agreement with each item on a scale from strongly disagree (1) to strongly agree (5). Given that these are two-item scales, we are not reporting Cronbach’s alpha. One thousand sixty-two participants did not complete the BFI-10.
Students’ Life Satisfaction Scale (SLSS)
We used the seven-item SLSS (Huebner, 1991) to assess students’ global well-being. Previous research suggests that life satisfaction should have the highest correlations with extraversion and emotional stability (Diener & Lucas, 1999). Respondents indicated their level of agreement with each item from strongly disagree (1) to strongly agree (5). The scale was reliable in our sample with Cronbach’s alpha reaching .85. One thousand one hundred thirty-six participants did not complete the SLSS.
Missing Data Analysis
Given the high number of students who did not complete the BFI-10 or the SLSS, we created a binary variable of “completers” versus “noncompleters” where noncompleters were students who were missing data for the BFI-10 or the SLSS. We compared the two groups on TIRT FC scores, school participation, GPA, and composite ACT scores. They differed significantly on extraversion (d = −.08), emotional stability (d = .08), openness (d = .07), GPA (d = .09), and ACT scores (d = .17), though the effect sizes were small (positive effect sizes indicate the completers had higher scores).
Results
Means and standard deviations for variables can be found in Tables 1 and 2.
Correlations Between Forced Choice and Single Stimulus Scores: Study 1.
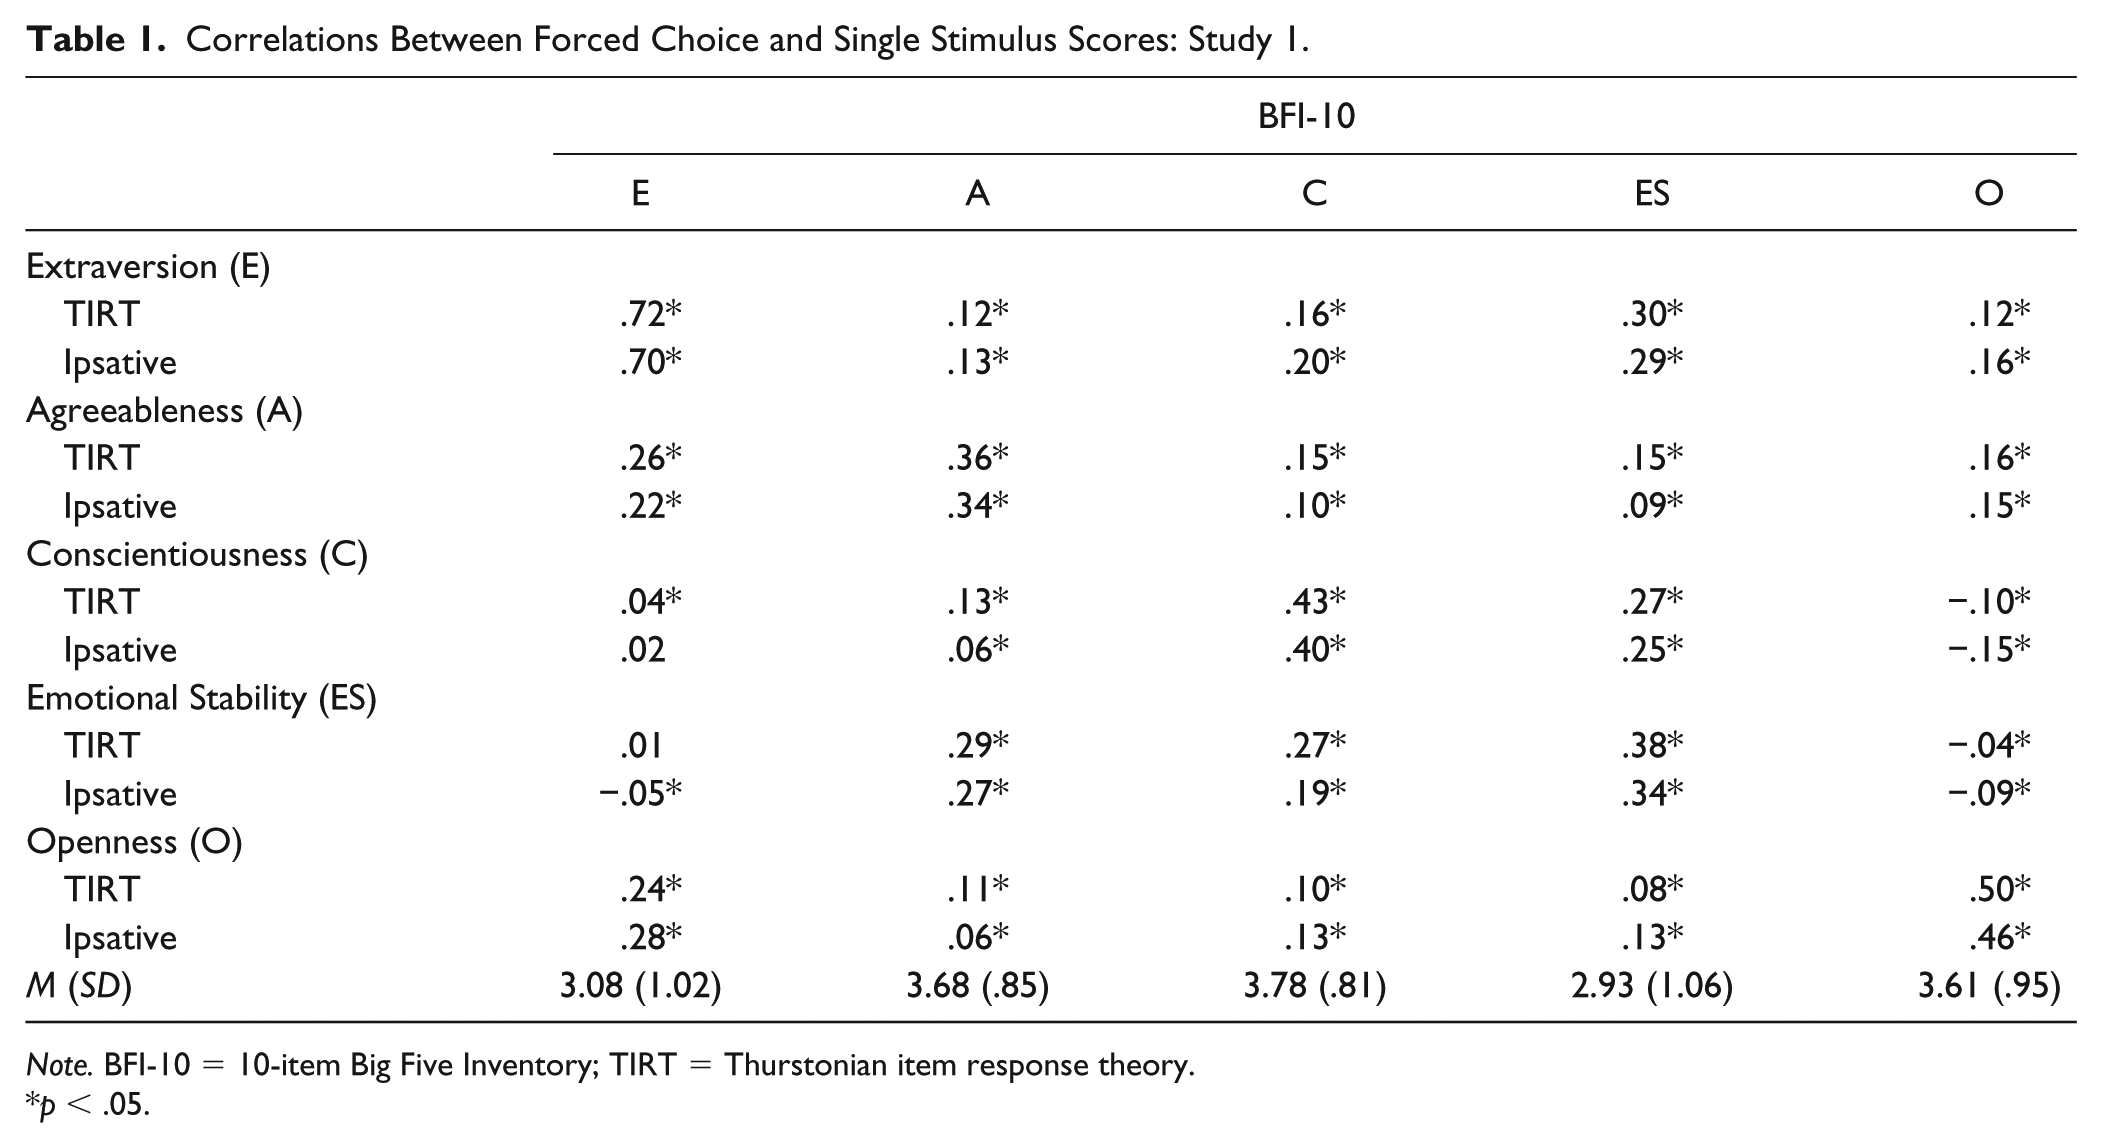
Note. BFI-10 = 10-item Big Five Inventory; TIRT = Thurstonian item response theory.
p < .05.
Correlations Between Forced Choice Scores and Outcome Variables: Study 1.
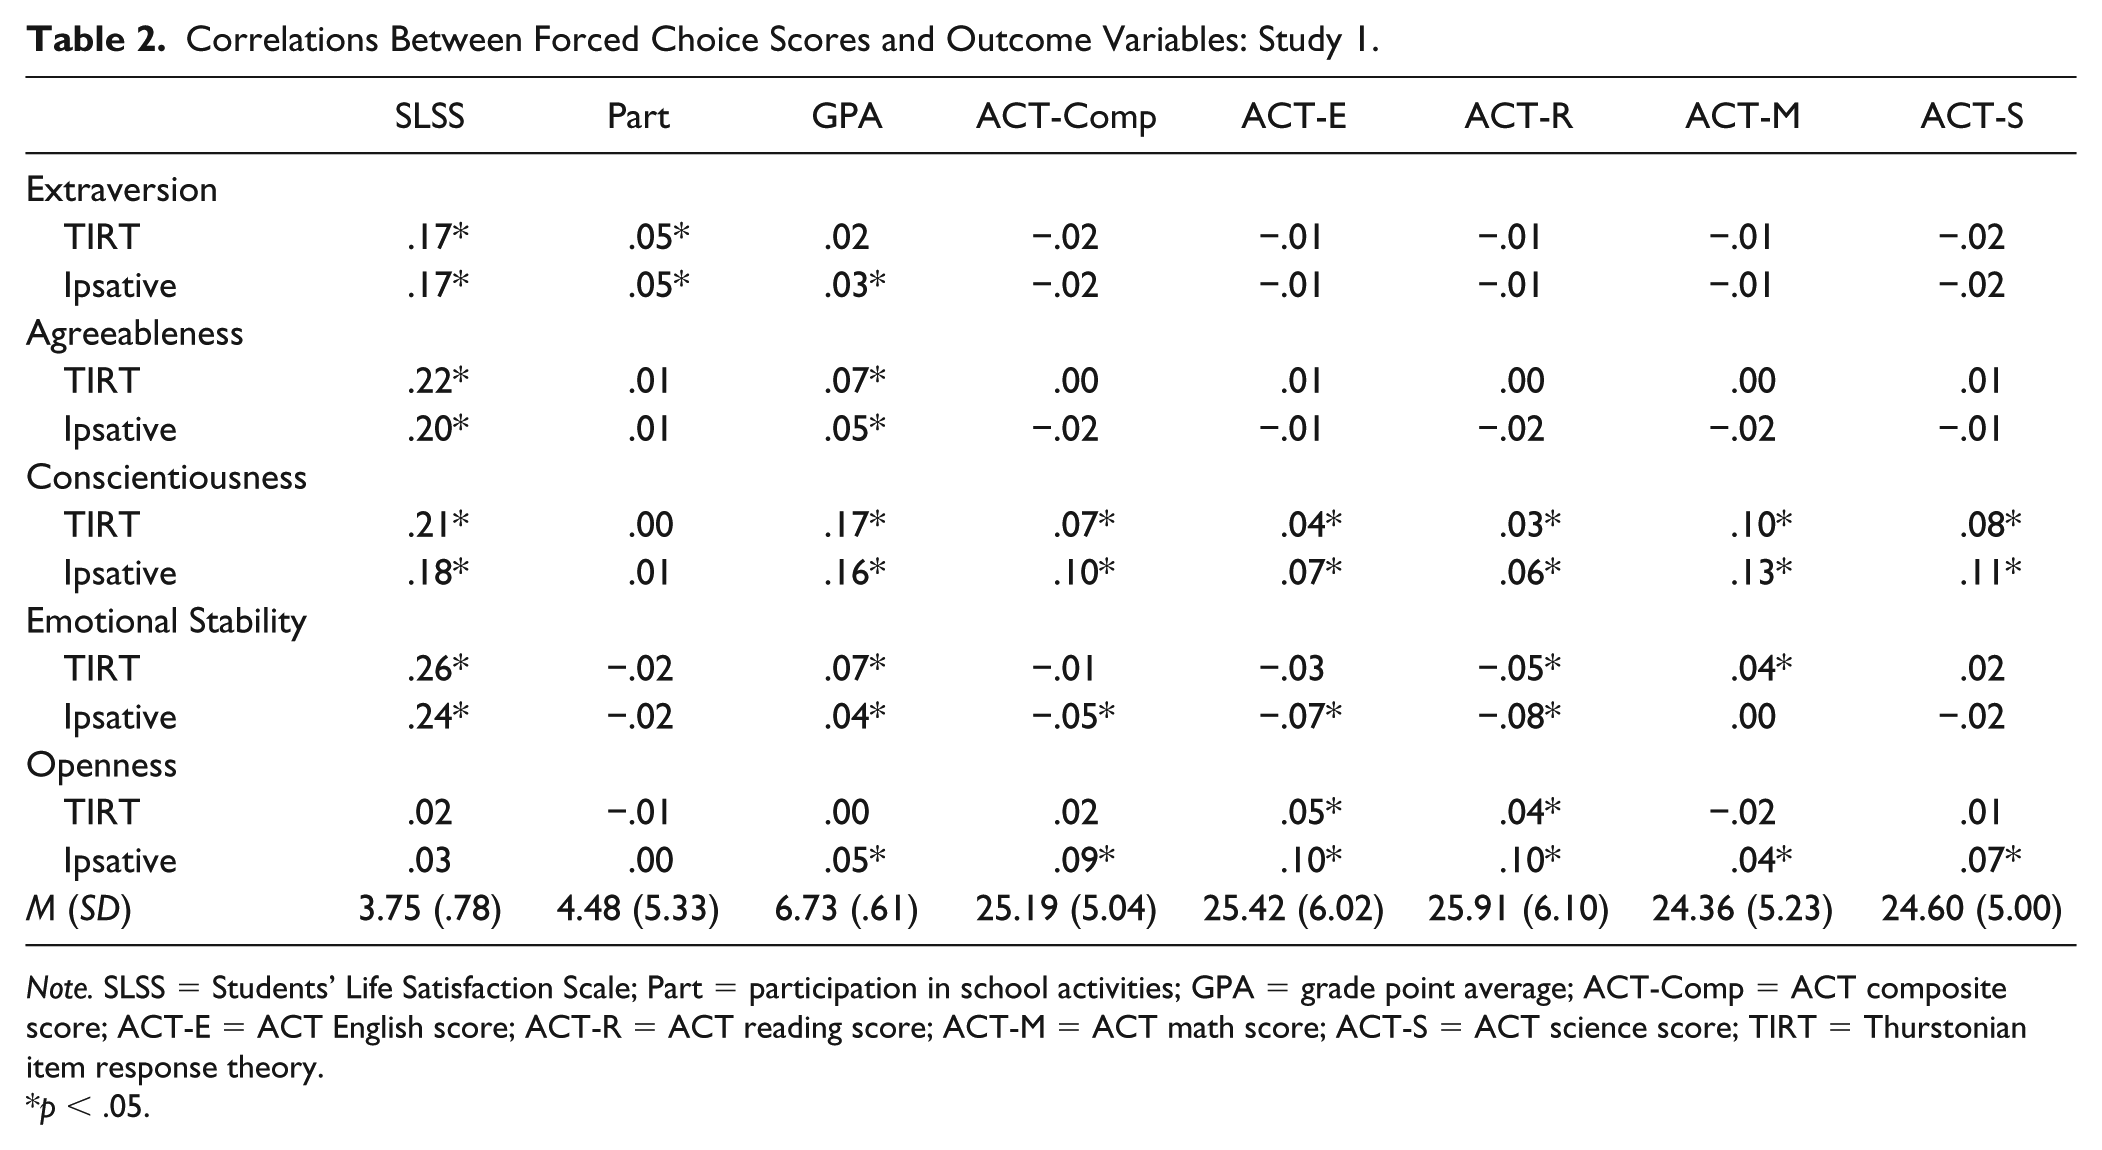
Note. SLSS = Students’ Life Satisfaction Scale; Part = participation in school activities; GPA = grade point average; ACT-Comp = ACT composite score; ACT-E = ACT English score; ACT-R = ACT reading score; ACT-M = ACT math score; ACT-S = ACT science score; TIRT = Thurstonian item response theory.
p < .05.
The complete inter-scale correlation matrix can be found in the online supplemental material.
Evidence for Convergent and Discriminant Validity
To evaluate evidence for their convergent and discriminant validity, we compared the two sets of FC scores’ associations with the BFI-10 scales (see Table 1). The two sets of FC scores were highly similar in terms of their correlations with their respective BFI-10 scales. These ranged from .36 to .72 (M =.48) for the TIRT scores and from .34 to .70 (M =.45) for the ipsative scores. The two sets of scores were also highly similar in terms of discriminant validity. The TIRT scores’ off-trait correlations ranged (in absolute value) from .01 to .30 (M = .16), and the ipsative scores’ correlations ranged from .02 to .29 (M = .15).
Evidence for Test-Criterion Validity
We next evaluated the test-criterion validity of the FC scores by correlating them with the various outcome measures (see Table 2). The two sets of FC scores had highly similar correlations with SLSS, school participation, and GPA. SLSS’s correlations with extraversion and emotional stability were high, though the correlations with agreeableness and conscientiousness were approximately the same magnitude. School participation had a modest yet significant correlation with extraversion, which is in line with what one would expect. Also as expected, GPA had the highest correlation with conscientiousness. We correlated the two sets of Big Five scores with the ACT composite score and the scores from the four sections. The TIRT and ipsative scores had a similar pattern of associations with the ACT scores, but the ipsative openness scores’ correlations with the English and Reading scores were a bit higher than the TIRT openness scores.
Finally, we fit separate multiple linear regression models with the five ipsative FC scores or the five TIRT scores as the predictors. Each outcome variable was a separate criterion variable. Note that we included only ACT composite scores here to conserve space and because there were not many notable subtest differences in terms of correlations. We sought to determine which set of FC scores could account for the greatest amount of outcomes’ variance. The two sets of scores were highly similar in terms of variance accounted for in all outcome variables (see Table 3).
Regressing Outcomes on Forced Choice Scores: Study 1.
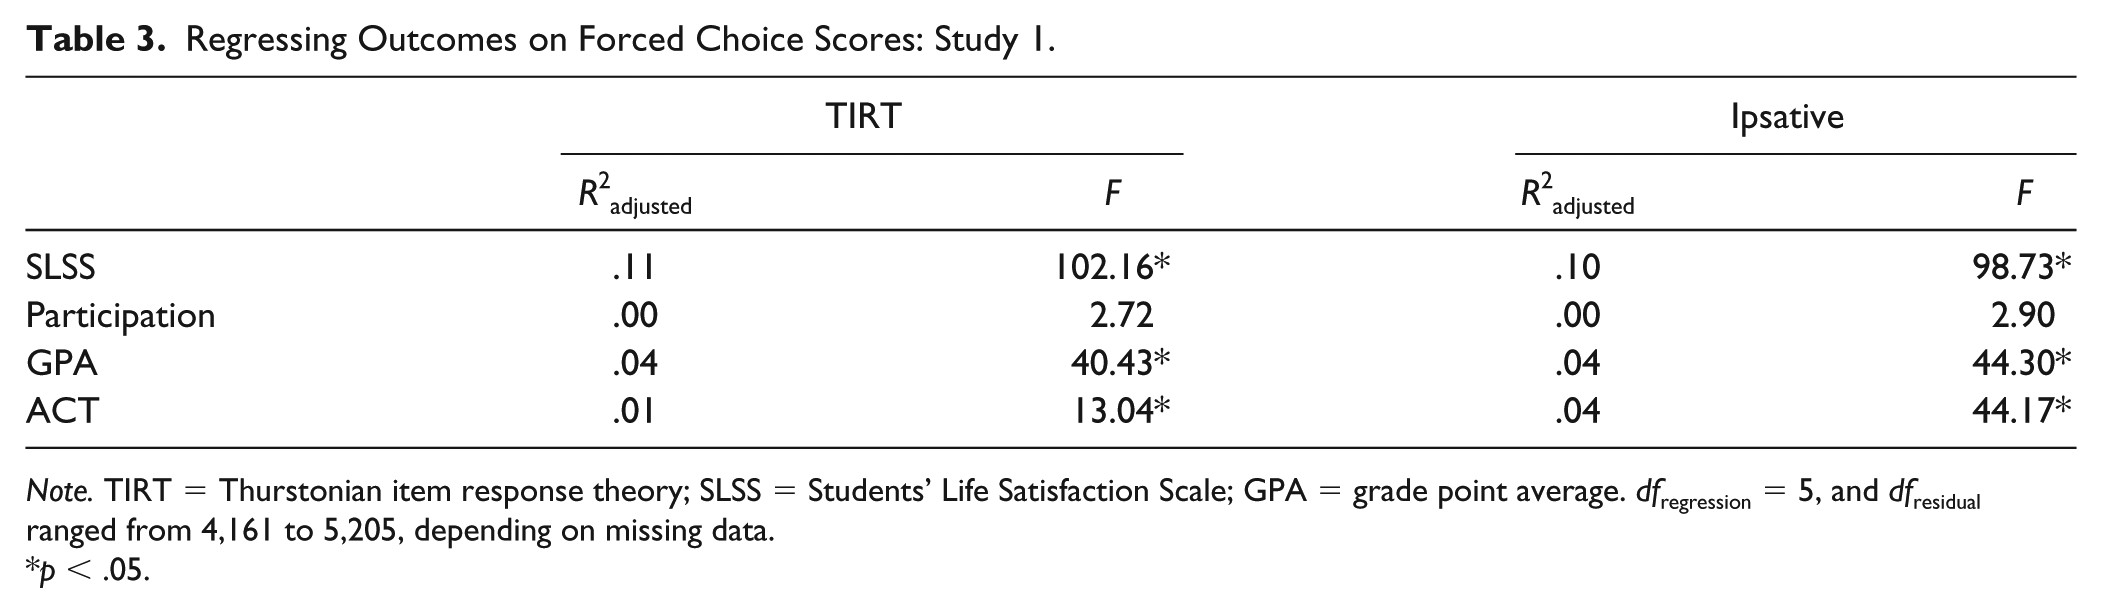
Note. TIRT = Thurstonian item response theory; SLSS = Students’ Life Satisfaction Scale; GPA = grade point average. dfregression = 5, and dfresidual ranged from 4,161 to 5,205, depending on missing data.
p < .05.
Discussion
In Study 1, we were able to evaluate evidence for convergent, discriminant, and test-criterion validity of FC scores derived from the TIRT model. On the whole, we conclude that there is evidence for the validity of these scores. The TIRT and ipsative scores were fairly similar in terms of the three types of validity. For the most part, all exhibited the pattern of associations one would expect to see based on theory and previous findings.
Study 2
Rationale
Study 1 had the advantage of being the first time to apply the TIRT model to a FC adjective measure. In Study 2, we examined a slight deviation from the Big Five model, one in which one of the five domains is split into two related, yet distinct factors. This will enable us to further evaluate the robustness of the TIRT model in an instance when two dimensions are more highly correlated than the others (and possibly more highly correlated than factors in Brown and Maydeu-Olivares’s [2011] simulation studies), which could arise if one were interested in measuring personality trait facets instead of, or in addition to, broad factors.
Method
Participants
Participants were undergraduate and graduate students at a large private university in the Northeast United States who participated for extra course credit or to fulfill a course requirement. Three hundred ninety-five individuals initiated the survey, but a number did not complete it. Cases were removed from the data set if they were missing five or more of the seven questionnaires (described below) and had completed only one of the two FC questionnaires (n = 55). One additional case was removed for missing both data check items (i.e., items designed to flag individuals responding carelessly). The final data set included 339 individuals ranging in age from 17 to 37 years (M = 20.0, SD = 2.3; age missing for one participant). Two hundred fifty-five (75.2%) were female. The largest race/ethnicity categories represented were as follows: White (38.3%), Hispanic or Latino (18.3%), Asian (17.4%), and Black or African American (17.4%). The remaining participants selected American Indian or Alaska Native, or “other,” or did not report this information.
Procedure and Measures
Participants completed the assessment online in Qualtrics. In addition providing demographic information, participants were asked to complete the measures described below. We asked participants to report their cumulative GPAs because it was expected to correlate positively with conscientiousness-related scores (Poropat, 2009). Unless otherwise stated, there were no missing data and distributions of scores on these measures were close to normal. Missing data were handled by excluding cases pairwise.
Big Five variation forced choice—statements
This measure, which was designed for use as part of a different assessment (ACT, Inc., 2018), assesses six personality constructs stemming from the Big Five personality model (McCrae & Costa, 2003). The traits of extraversion, agreeableness, emotional stability, and openness to experience were assessed, as well as two components of conscientiousness, namely grit and responsibility. The measure is typically used operationally in educational settings where conscientiousness is the best predictor of academic success (Poropat, 2009), which is why those who developed the measure included a more fine-grained assessment of conscientiousness. The measure consists of 20 blocks containing three items each, one of which was negatively keyed. The blocks were balanced so all permutations of three out of six traits were represented and each trait was assessed with the same number of items. Below is an example.
I complete my assignments on time. I enjoy creating art projects. I avoid challenging tasks.
In response to each block, participants were instructed to select the one item that is “most like” them, select the one that is “least like” them, and do nothing with the third item. Two participants did not complete this measure. The same two scoring approaches used in Study 1 were used here. The TIRT model converged, had a reasonable fit to the data (CFI = .89; RMSEA = .02), and produced reasonable parameter estimates with small standard errors. Factor scores from this model estimation were saved and used in subsequent analyses.
Big Five Inventory–2 (BFI-2)
The BFI-2 (Soto & John, 2017) was included to evaluate the convergent and discriminant validity of the FC scores. The BFI-2 measures the broad Big Five domains and facets with 60 SS items. Respondents indicated their level of agreement with each item on a scale from disagree strongly (1) to agree strongly (4). We calculated mean scores for the domains only. All scales were reliable with the following Cronbach’s alpha values in the current sample: .85 (extraversion), .74 (agreeableness), .85 (conscientiousness), .89 (emotional stability), and .83 (openness to experience).
Satisfaction With Life Scale (SWLS)
The widely used, reliable, and valid five-item SWLS (Diener, Emmons, Larson, & Griffin, 1985) assesses individuals’ satisfaction with life as a whole. SWLS was expected to have the highest correlations with extraversion and emotional stability (Diener & Lucas, 1999). Respondents indicated their level of agreement with each item from disagree strongly (1) to agree strongly (4). The scale was reliable in our sample with Cronbach’s alpha reaching .87. Two participants did not complete this measure.
Computerized Adaptive Assessment of Personality Disorder (CAT-PD)
The CAT-PD (Simms et al., 2011) is a reliable and valid self-report measure of personality disorder trait dimensions. We selected and administered four scales with high face validity for internalizing (anxiousness and depressiveness) and externalizing (hostile aggression and norm violation) psychopathology. The CAT-PD internalizing scores were expected to have the strongest (negative) associations with emotional stability, extraversion, and conscientiousness-related scales (Kotov, Gamez, Schmidt, & Watson, 2010), and the CAT-PD externalizing scores were expected to have the strongest (negative) associations with agreeableness and the conscientiousness-related scales (Ruiz, Pincus, & Schinka, 2008). Participants indicated how well each of the 28 statements described them on a scale from very untrue of me (1) to very true of me (5). The two internalizing scales and the two externalizing scales were combined, and the two resulting scales were reliable with Cronbach’s alpha values reaching .91 (internalizing) and .88 (externalizing). Two participants did not complete this measure.
Counterproductive School Behaviors (CSB)
The CSB was designed to assess frequency of students’ counterproductive behavior in the school setting in the past year. The items were adapted from a measure of counterproductive behaviors in the workforce (Bennett & Robinson, 2000). CSB was expected to be most highly (negatively) associated with agreeableness and the conscientiousness scales (Berry, Ones, & Sackett, 2007). It consists of seven items to which respondents indicate their level of behavioral frequency from never (1) to daily (7). The scale was reliable in our sample with Cronbach’s alpha reaching .83. More than 45% of the sample claimed to have never engaged in any of the behaviors so scores on this measure were positively skewed (2.67), and the distribution had a high kurtosis value (8.42). To correct for this, we used an inverse transformation, which made the variable’s distribution more closely resemble the normal distribution (skew = −.77, kurtosis = −.55). However, this also reversed the signs for all CSB-Big Five correlations. The absolute value of the correlations with the Big Five changed very little from raw to transformed CSB scores (a maximum of .04), though, so we used the raw CSB scores in all analyses reported below.
Results
Means and standard deviations for all SS scales and GPA can be found in Tables 4 and 5. The complete inter-scale correlation matrix can be found in the online supplemental material.
Correlations Between Forced Choice and Single Stimulus Scores: Study 2.
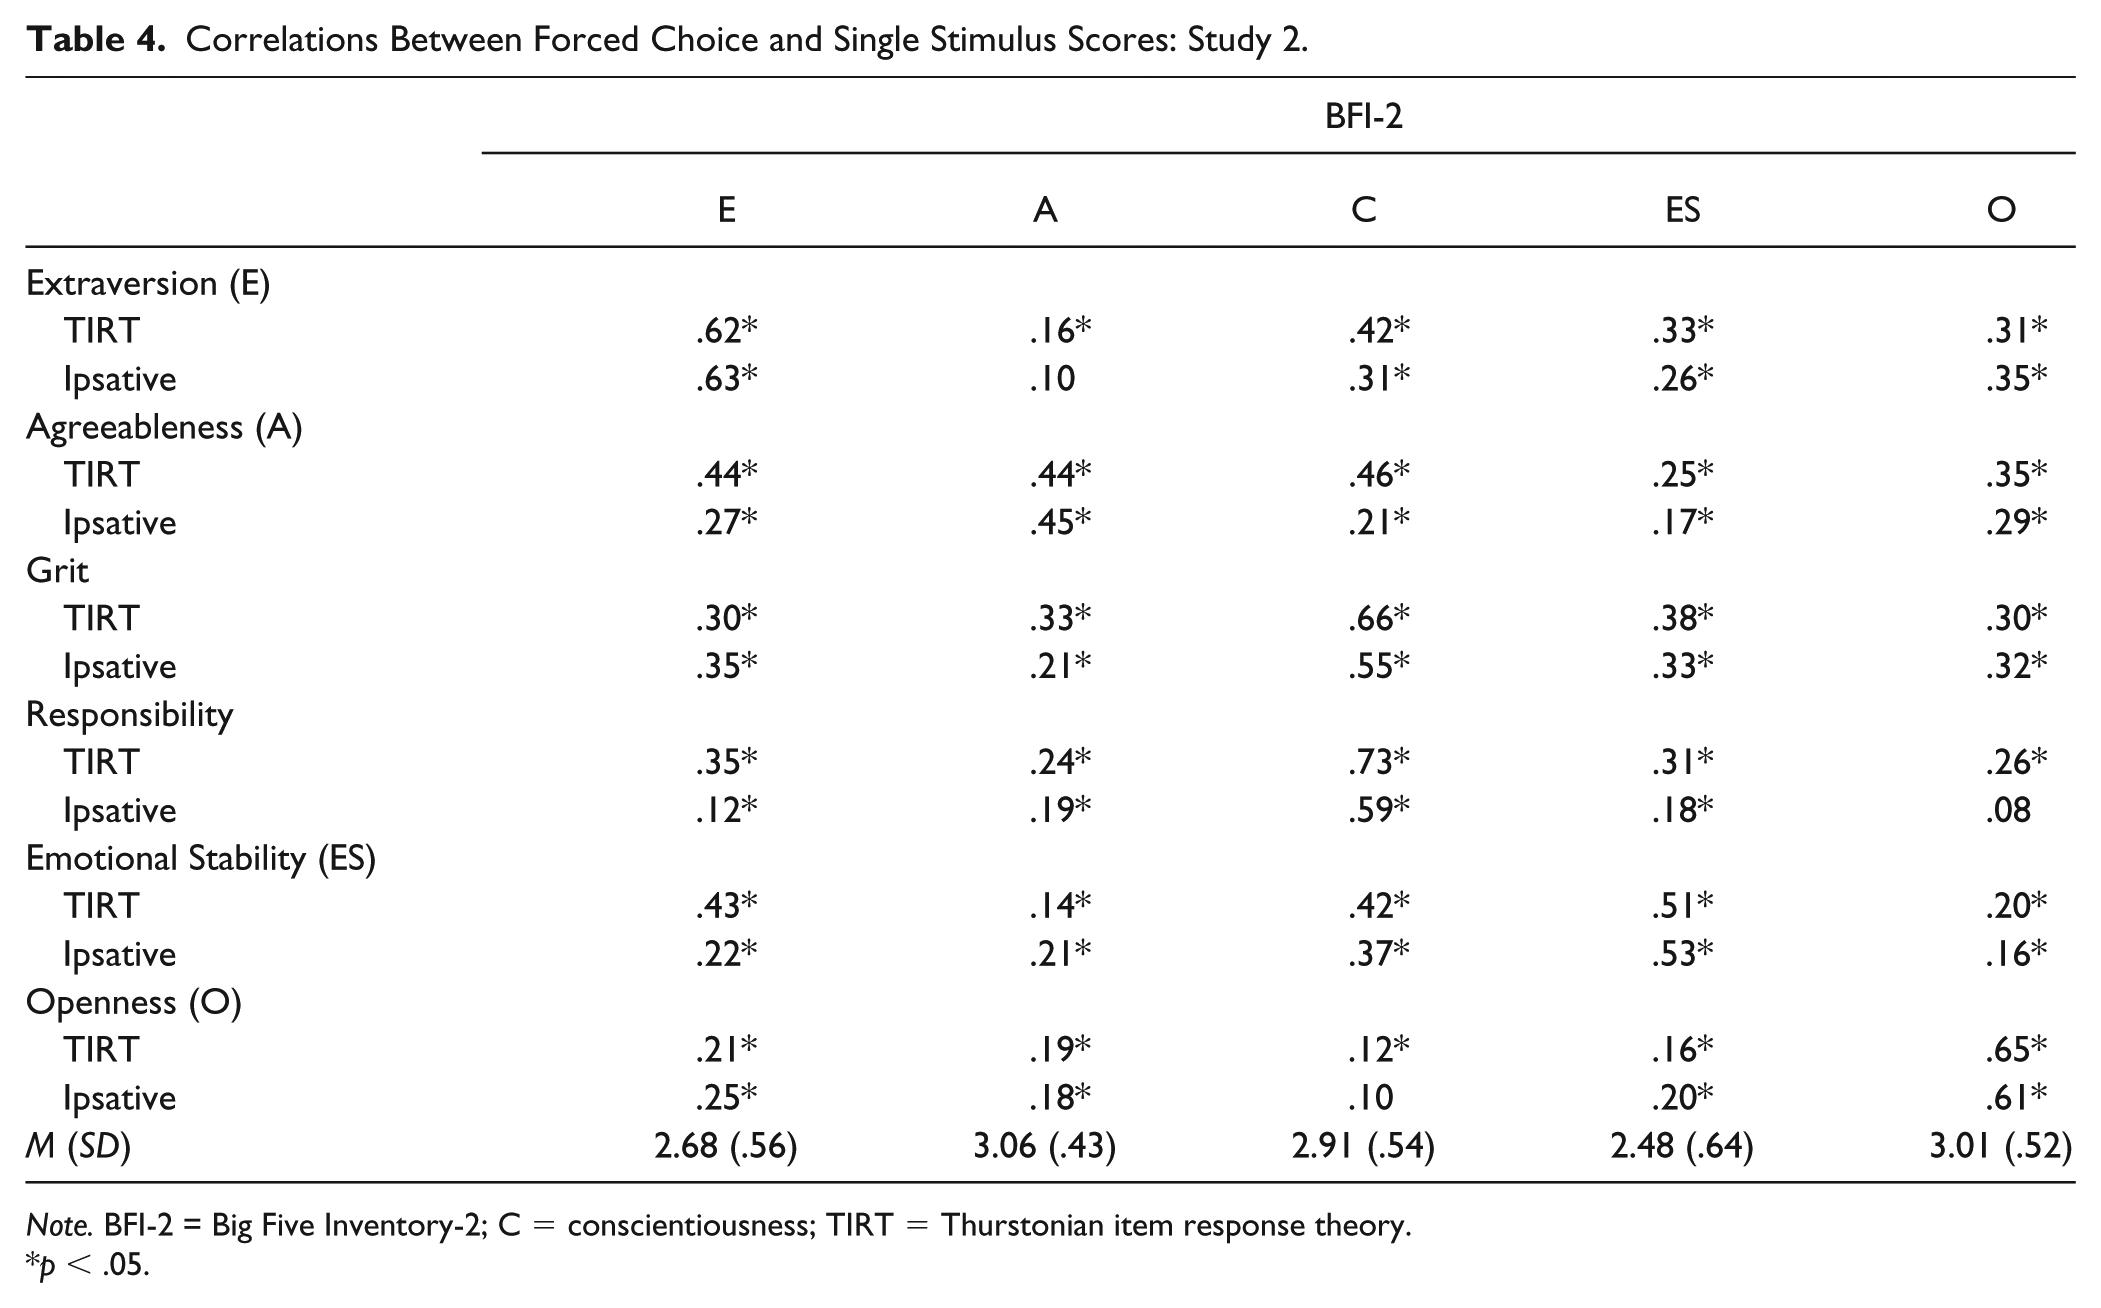
Note. BFI-2 = Big Five Inventory-2; C = conscientiousness; TIRT = Thurstonian item response theory.
p < .05.
Correlations Between Forced Choice Scores and Outcome Variables: Study 2.
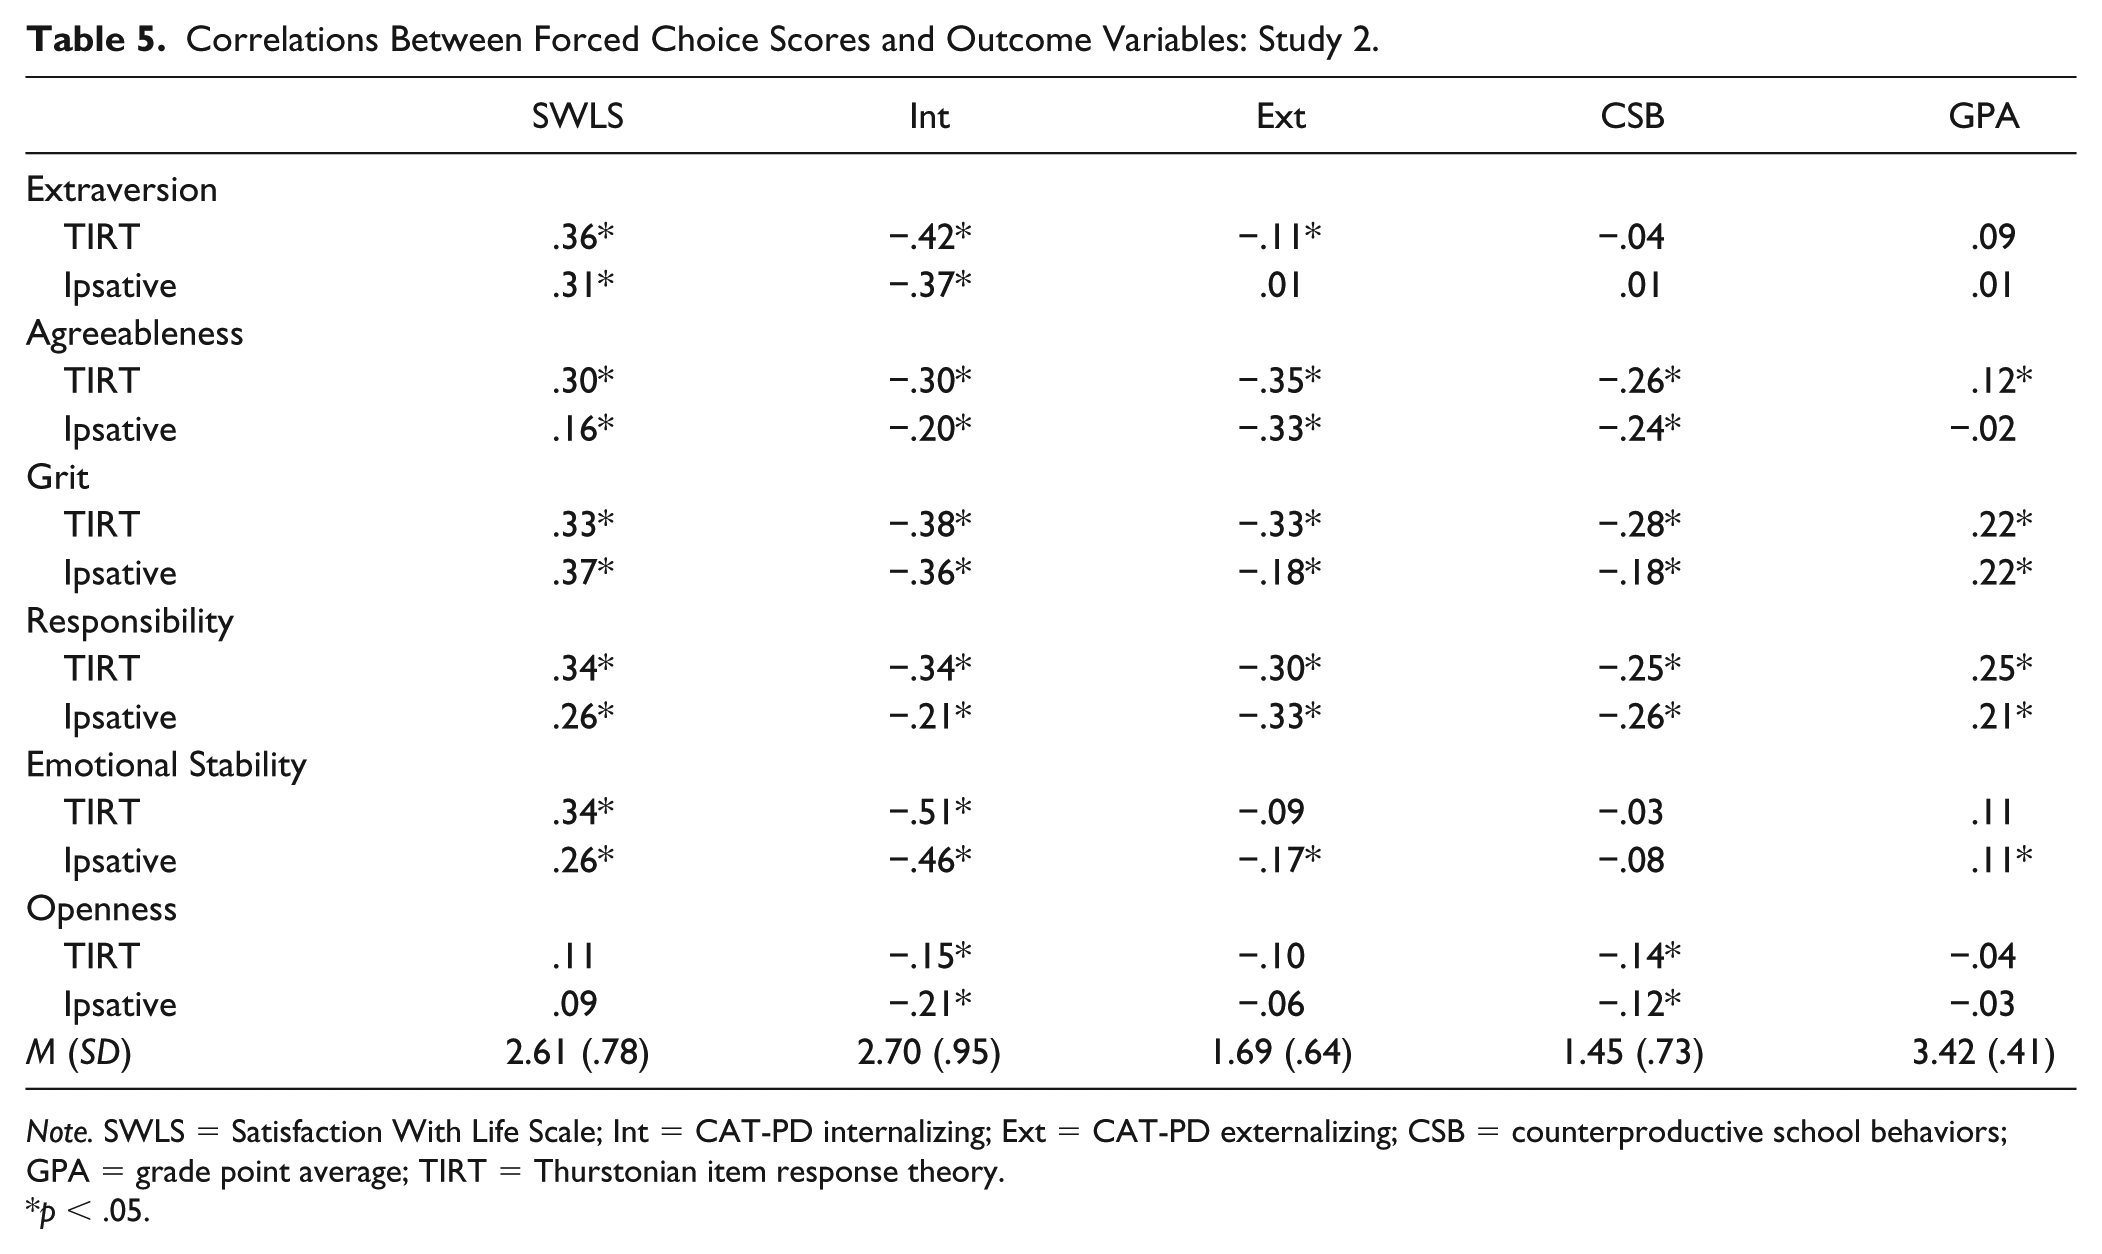
Note. SWLS = Satisfaction With Life Scale; Int = CAT-PD internalizing; Ext = CAT-PD externalizing; CSB = counterproductive school behaviors; GPA = grade point average; TIRT = Thurstonian item response theory.
p < .05.
Evidence for Convergent and Discriminant Validity
To evaluate evidence for their convergent and discriminant validity, we compared the two sets of FC scores’ associations with the BFI-2 scales (see Table 4). The TIRT scores, on average, proved to have slightly better convergent validity, exhibiting the highest correlations with their respective BFI-2 scales. These ranged from .44 to .73 (M = .60). The ipsative scores’ correlations ranged from .45 to .63 (M =.56). Differences were slight, though, except for the conscientiousness scales. On average, the scores derived from the ipsative approach had better discriminant validity than the scores derived from the TIRT approach. The ipsative scores’ off-trait correlations ranged from .08 to .37 (M = .23), and the TIRT scores’ correlations ranged from .12 to .46 (M = .29). There were some instances of the discriminant validity of the TIRT scores being considerably worse than the ipsative scores’. As one example, the correlation between BFI-2 conscientiousness reached .46 with TIRT agreeableness versus .21 with the ipsative agreeableness score.
Evidence for Test-Criterion Validity
We next evaluated the test-criterion validity of the FC scores by correlating them with the various outcome measures (see Table 5). In general, the TIRT scores slightly outperformed the ipsative scores. As expected, SWLS correlated highly with extraversion and emotional stability (Diener & Lucas, 1999), but it correlated with other domains to a relatively large degree. Both sets of FC scores correlated with the CAT-PD internalizing and externalizing scores, CSB, and GPA as expected.
We next regressed the outcome variables on the two sets of FC scores to compare their criterion validity (see Table 6). Both sets of FC scores were statistically significant and performed very similarly in terms of variance accounted for (see Table 4).
Regressing Outcomes on Forced Choice Scores: Study 2.
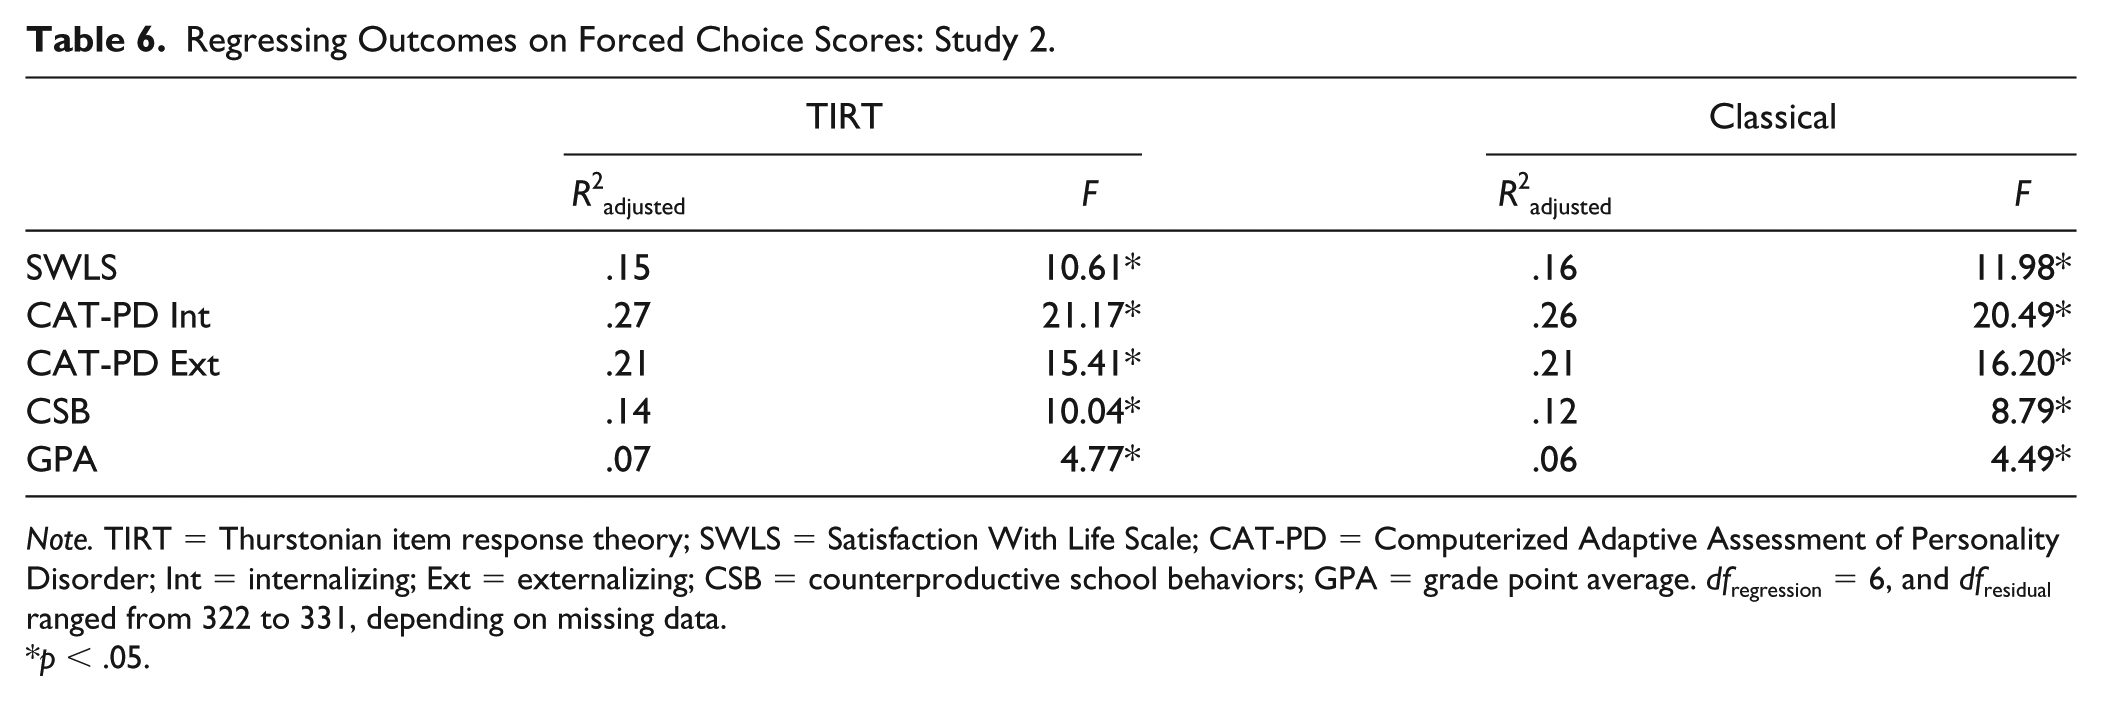
Note. TIRT = Thurstonian item response theory; SWLS = Satisfaction With Life Scale; CAT-PD = Computerized Adaptive Assessment of Personality Disorder; Int = internalizing; Ext = externalizing; CSB = counterproductive school behaviors; GPA = grade point average. dfregression = 6, and dfresidual ranged from 322 to 331, depending on missing data.
p < .05.
Discussion
In this study, we were able to evaluate evidence for the convergent, discriminant, and test-criterion validity of Big Five FC scores derived from the TIRT model in a student sample. The model was somewhat different than the pure Big Five model used in Study 1; here two subcomponents of conscientiousness were assessed. The convergent and test-criterion validity evidence for the TIRT scores was slightly better than the evidence for the ipsative scores (with the exception of convergent validity for conscientiousness scores where the TIRT scores performed considerably better than the ipsative scores). However, when evaluating the discriminant validity, the TIRT scores often had high correlations with off-target traits, and this was often significantly worse than for the ipsative scores.
Study 3
Rationale
As discussed above, the literature on the use of the TIRT model for FC scales is relatively limited; therefore, additional research on the applicability of this model for various item types and personality models, for example, is needed. In Study 1, we extended previous work to examine the validity of the model as applied to adjective ratings of the Big Five in a large national sample of prospective college students. In Study 2, we altered the Big Five model to score two components of one of the broad domains. In our final study, we extend this to examine the validity of the model as applied to adjective ratings of the HEXACO domains in an adult online community sample. Study 3 allows us to further assess the TIRT model robustness as the FC measure used here is fairly dissimilar to Big Five statement measures used in practice and prior research.
Method
Participants
Participants were Amazon Mechanical Turk workers who were paid for their participation. Cases were removed from the data set if they did not complete the FC questionnaire or if they missed both data check items (i.e., items designed to flag individuals responding carelessly). The final data set included 721 individuals ranging in age from 18 to 70 years (M = 34.5, SD = 9.9). Three hundred sixty-two (50.2%) were female. The percentage of each race/ethnicity category represented were as follows: White (72.4%), Black or African American (14.7%), and Hispanic or Latino (12.9%).
Procedure and Measures
Participants completed the assessment online in Qualtrics. Participants were asked to complete the measures described below in addition to giving informed consent and providing demographic information, including highest level of education, which was on a 9-point scale ranging from up to Grade 8 to graduate degree. The mean education level was 5.96, where 6 indicates a 2-year associate’s degree. Prior research on the relationship between the Big Five and educational attainment shows that (positive) openness and emotional stability are the best predictors of educational attainment followed by (negative) extraversion (Rammstedt, Danner, & Lechner, 2017). Distributions of scores on these measures were close to normal. Missing data, which is detailed below when relevant, were handled by excluding cases pairwise.
HEXACO forced choice
This questionnaire assesses the six personality constructs of the HEXACO model (Ashton et al., 2004), namely honesty/humility, emotionality, extraversion, agreeableness, conscientiousness, and openness to experience. The questionnaire consists of 20 blocks containing three adjectives each, one of which was negatively keyed. The blocks were balanced so all permutations of three out of six traits were represented and each trait was assessed with the same number of items. In response to each block, participants were instructed to select the adjective that is “most like” them, select the adjective that is “least like” them, and do nothing with the third adjective. The same two scoring approaches used in Studies 1 and 2 were used here. The TIRT model converged, had a reasonable fit to the data (CFI = .87; RMSEA = .03), and produced reasonable parameter estimates with small standard errors. Factor scores from this model estimation were saved and used in subsequent analyses.
HEXACO single stimulus
This questionnaire was included to evaluate the convergent and discriminant validity of the FC scores. It assesses the six HEXACO domains and facets with 72 SS items. Respondents indicated their level of agreement with each item on a scale from strongly disagree (1) to strongly agree (6). We calculated mean scores for the domains only. In the current sample, the scales had the following Cronbach’s alpha values: .67 (honesty/humility), .65 (emotionality), .85 (extraversion), .83 (agreeableness), .78 (conscientiousness), and .86 (openness to experience). Seven individuals were not scored due to complete or excessive missing data. Due to a technical error, 505 participants did not complete a total of 15 items which covered all construct domains.
Big Five Inventory–10 (BFI-10)
The BFI-10 (Rammstedt & John, 2007; described above in Study 1) was included to further assess convergent and discriminant validity. According to prior research reporting correlations between the two constructs reaching .30 or higher (Ashton, Lee, & de Vries, 2014; Gaughn, Miller, & Lynam, 2012), the following correlations were expected to be the highest: HEXACO honesty–BFI-10 agreeableness, HEXACO emotionality–BFI-10 emotional stability, HEXACO emotionality–BFI-10 agreeableness, HEXACO extraversion–BFI-10 extraversion, HEXACO extraversion–BFI-10 emotional stability, HEXACO agreeableness–BFI-10 agreeableness, HEXACO agreeableness–BFI-10 emotional stability, HEXACO conscientiousness–BFI-10 conscientiousness, and HEXACO openness–BFI-10 openness. Eighteen participants did not complete the BFI-10.
Results
Means and standard deviations for variables can be found in Tables 7 and 8. The complete inter-scale correlation matrix can be found in the online supplemental material.
Correlations Between Forced Choice and Single Stimulus Scores: Study 3.
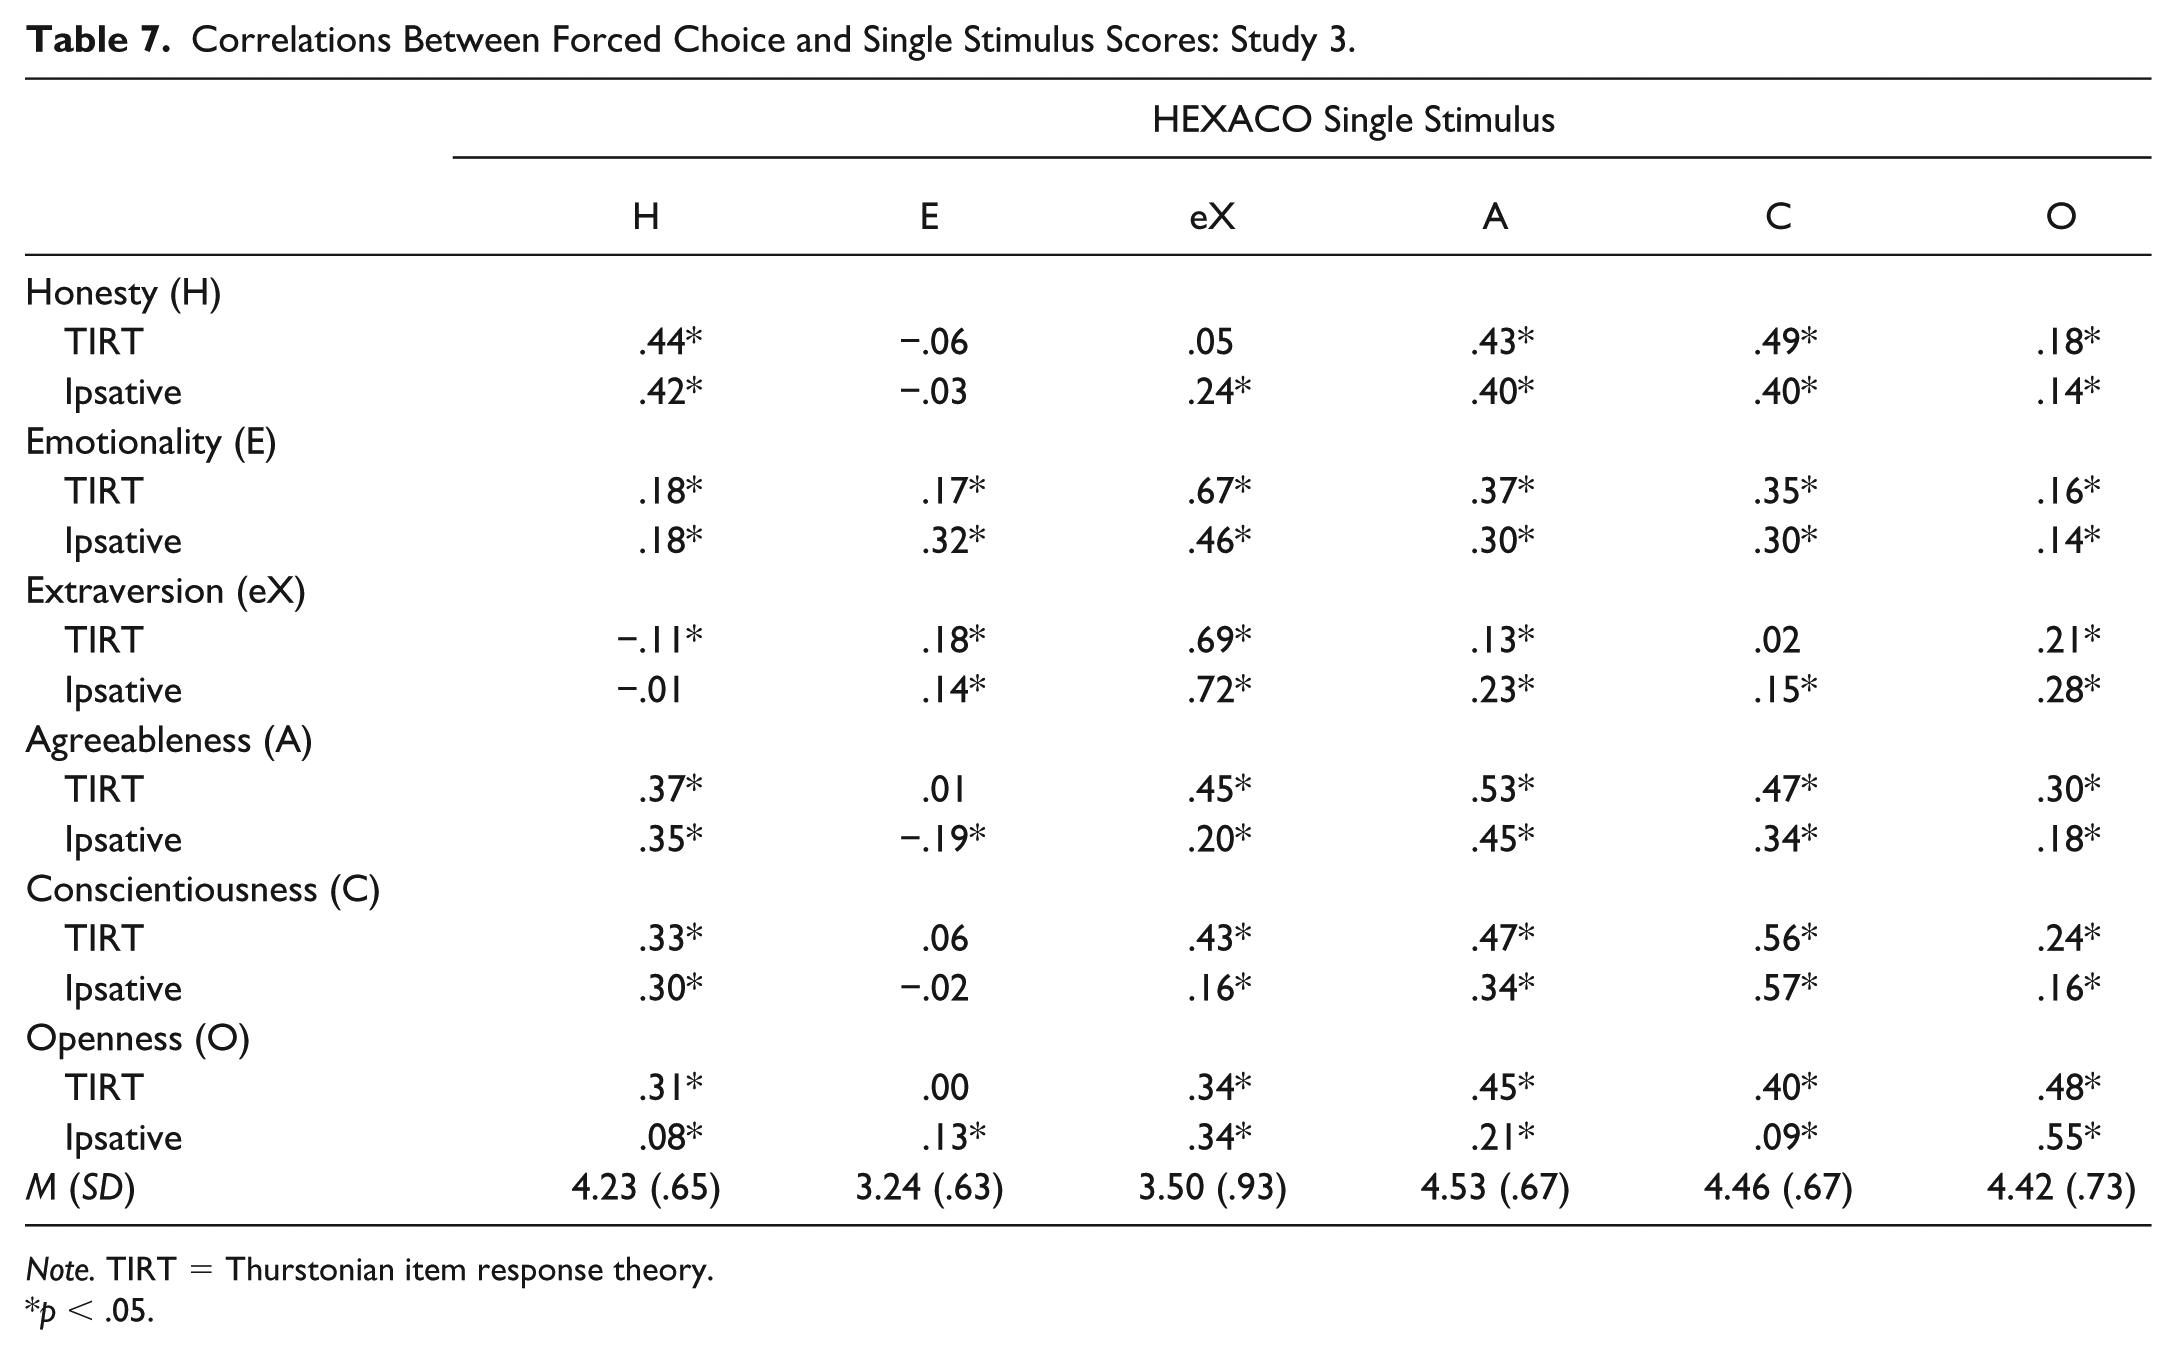
Note. TIRT = Thurstonian item response theory.
p < .05.
Correlations Between Forced Choice Scores and Outcome Variables: Study 3.
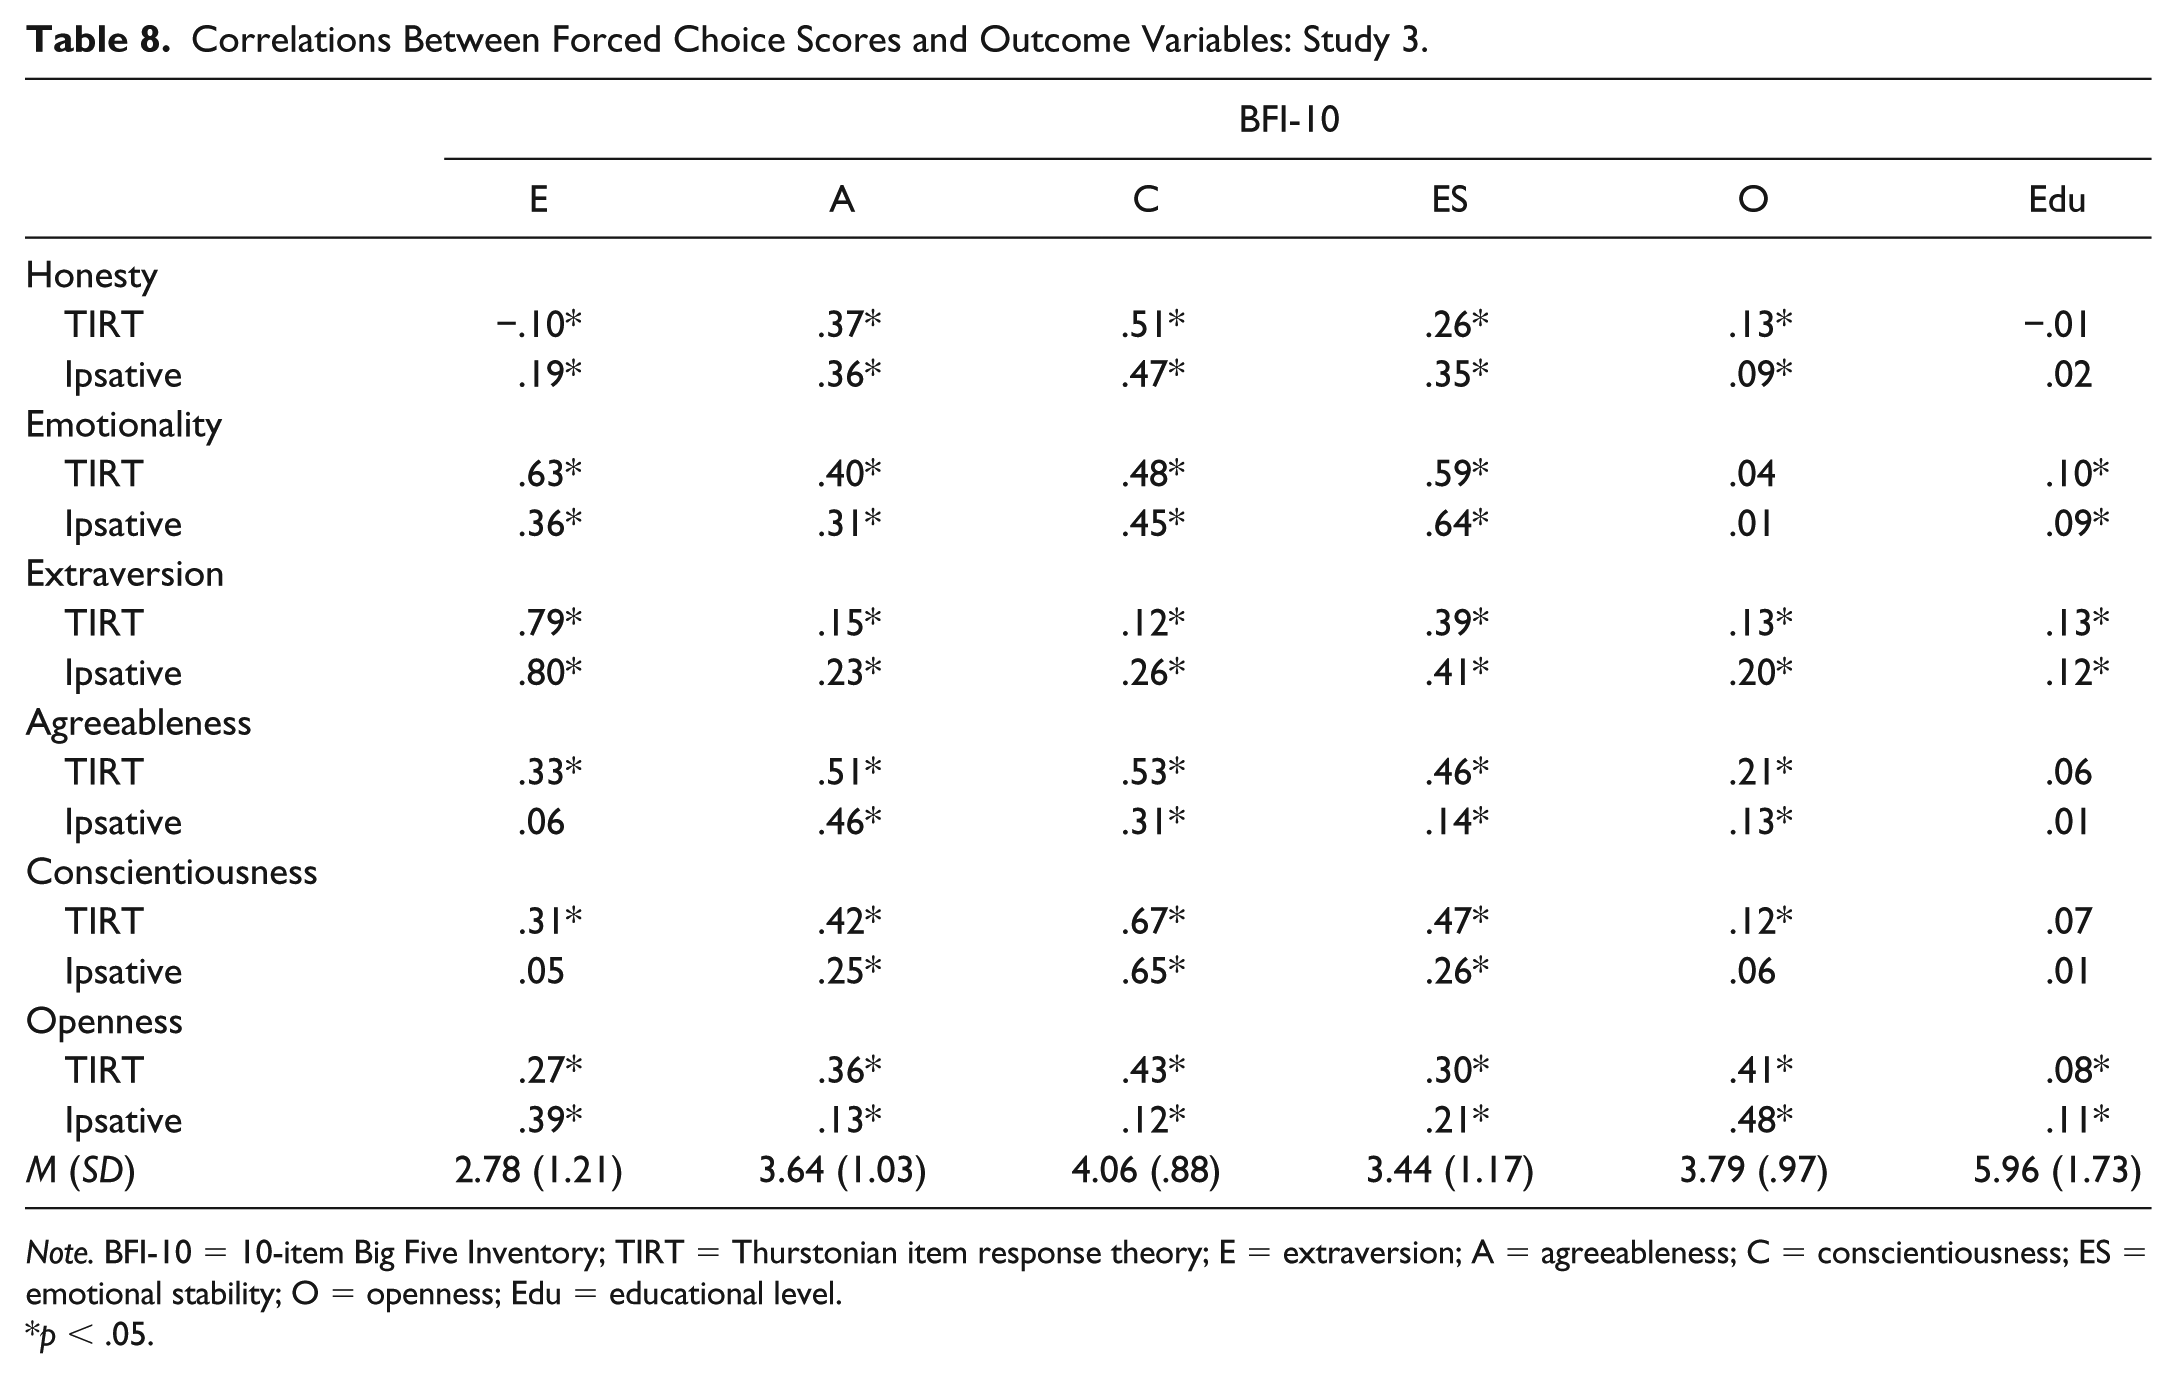
Note. BFI-10 = 10-item Big Five Inventory; TIRT = Thurstonian item response theory; E = extraversion; A = agreeableness; C = conscientiousness; ES = emotional stability; O = openness; Edu = educational level.
p < .05.
Evidence for Convergent and Discriminant Validity
To evaluate evidence for their convergent and discriminant validity, we compared the two sets of FC scores’ associations with the HEXACO SS scales (see Table 7). On the whole, the ipsative scores proved to have slightly better convergent validity. The ipsative scores’ correlations ranged from .32 to .72 (M = .51). The TIRT scores’ correlations with their respective HEXACO SS scales ranged from .17 to .69 (M = .48). The scores derived from the ipsative approach had better discriminant validity than the scores derived from the TIRT approach. The absolute values of the ipsative scores’ off-trait correlations ranged from .01 to .46 (M = .22), and the absolute values of the TIRT scores’ correlations ranged from .01 to .67 (M = .27). For both sets of FC scores, in some instances, the off-trait correlations were higher than the target trait correlations (e.g., the FC emotionality scores), though this was particularly problematic for the TIRT scores. As one example, the correlation between the SS conscientiousness scores reached .40 with TIRT openness versus .09 with the ipsative openness score.
We also evaluated the convergent and discriminant validity of the FC scores by correlating them with the BFI-10 (see Table 8). In general, both sets of FC scores had high correlations with the expected BFI-10 scales; however, there were some high correlations that were not expected. It was difficult to distinguish the two sets of FC scores in terms of which had stronger validity evidence. Relative to the ipsative scores’ correlations, in some cases, the TIRT scores’ correlations were greater in magnitude (e.g., HEXACO agreeableness–BFI-10 agreeableness), in some cases, they were very similar (e.g., HEXACO extraversion–BFI-10 extraversion), and in some cases, they were smaller in magnitude (e.g., HEXACO openness–BFI-10 openness).
Evidence for Test-Criterion Validity
The two sets of FC scores had a similar pattern of correlations with educational attainment (see Table 8). We fit two regression models predicting educational attainment with the two sets of scores. Both models were statistically significant, though the amount of variance accounted for was slight (TIRT: R2adjusted = .02, F6,714 = 2.85, p < .05; ipsative: R2adjusted = .01, F6,714 = 2.64, p < .05).
Discussion
In this study, we were able to evaluate evidence for convergent, discriminant, and test-criterion validity of FC scores of an adjective-based HEXACO measure derived from the TIRT model in a community-based online sample. In terms of convergent and discriminant validity, the ipsative scores generally fared better than the TIRT scores. Discriminant validity for the TIRT scores was particularly problematic. The TIRT and ipsative scores were fairly similar in terms of evidence for test-criterion validity.
The validity evidence for the TIRT scores was arguably worse in Study 3 than in Studies 1 and 2. It is possible that there could be something inherent to HEXACO model that poses a problem for the TIRT model. One possibility is that the latent factor correlations are too high. In this model, 9 of the 15-factor correlations exceeded .7. In Study 1, 0 of the 10 exceeded .7, and only 1 of the 15 did in Study 2 (the two conscientiousness-related factors).
General Discussion
IRT models for scoring FC data, including the TIRT, are relatively new and are likely to increase in popularity given that they are a solution to what has been thought to be a key problem with FC data, namely its ipsative nature (Meade, 2004). Prior to embracing the use of TIRT scoring, the validity of the scores needs to be fully evaluated. Our objective was to do this by comparing the validity of TIRT scores to ipsative scores and to focus on domain scores from two major personality frameworks. To accomplish this, across three samples with varied demographic characteristics, we examined both Big Five and HEXACO scores assessed with different item types, including both statements and adjectives. In general, we found convergent and test-criterion validity evidence for the TIRT scores, although the evidence was a bit stronger in Studies 1 and 2 in which the Big Five personality model (or a slight variant of it) was used rather than the HEXACO model. There was not strong evidence for the discriminant validity of the TIRT scores.
It is worth pointing out that there was evidence for the validity of the ipsative scores as well, and the ipsative scores had better discriminant validity evidence than the TIRT scores. TIRT score discriminant validity evidence was stronger in previous research (e.g., Lee et al., 2018) so additional data are needed to more fully evaluate whether ipsative scores are generally superior to TIRT scores in terms of discriminant validity. Problems with ipsative scores’ test-criterion validity coefficients have been discussed in prior literature (e.g., Baron, 1996). In their study of emotional intelligence, Anguiano-Carrasco et al. (2015) reported that the validity evidence for the IRT-derived scores was much stronger than scores derived from the ipsative approach and noted that many of those correlations were actually in the opposite direction than one would expect based on theory. In contrast, others have reported that their ipsative scoring approach did not distort test-criterion validity estimates relative to TIRT scores (Lee et al., 2018; Wetzel et al., 2016). Likewise, in the current studies, the ipsative scores’ correlations with external criteria did not appear to be distorted. All were in the expected direction and were generally on par with the TIRT scores. The ipsative and TIRT scores were highly correlated ranging from .91 to .98 (M = .95) in Study 1, from .77 to .93 (M = .86) in Study 2, and from .74 to .95 (M = .79) in Study 3. This is consistent with prior work reporting correlations exceeding .90 between such scores (Lee et al., 2018).
Although there is some mixed evidence regarding the validity of TIRT scores relative to ipsative scores, IRT-based FC scores can alleviate other problems with ipsative data such as the inability to carry out factor analyses or make interindividual comparisons. Moreover, studies to date, including this one, provide evidence of their convergent and test-criterion validity. As a result, we conclude that TIRT scoring may be a solution to the problem of ipsative data for those who wish to use FC inventories to alleviate concerns about faking or responses biases associated with Likert items. However, before using TIRT scores in place of ipsative scores, one must carefully consider whether there is sufficient discriminant validity evidence and in the event that any validity estimates are poor, one should use ipsative scores instead. In addition, certain features of the FC design may preclude the use of the TIRT. These include the keyed direction of items, the number of traits measured, the correlations between the traits, and the number of items per block (Brown & Maydeu-Olivares, 2011). Brown and Maydeu-Olivares concluded that the TIRT model can reproduce latent trait estimates well when recommended design guidelines are followed. However, most often researchers use preexisting measures and do not have control over the design. When the parameters of the design fail to conform to the TIRT model specifications or when validity estimates are poor, one can use ipsative scores and have confidence in their validity based on the findings presented here and elsewhere (Lee et al., 2018; Wetzel et al., 2016).
Some additional considerations should be made in future research. We considered only triads and fully ipsative data. Although triads seem to be a popular choice in recent research using the TIRT model (Anguiano-Carrasco et al., 2015; Guenole, Brown, & Cooper, 2016; Lee et al., 2018), the validity of scores garnered from other designs and partially ipsative data should be evaluated as well. In addition, the outcomes used to evaluate test-criterion validity evidence were included in these studies simply out of convenience. That is, in some cases, the data used here were collected for purposes for a different study. Many of the outcome measures were self-report Likert-type scales, and more varied outcomes would be beneficial.
Supplemental Material
supplemental_mega_table – Supplemental material for On the Validity of Forced Choice Scores Derived From the Thurstonian Item Response Theory Model
Supplemental material, supplemental_mega_table for On the Validity of Forced Choice Scores Derived From the Thurstonian Item Response Theory Model by Kate E. Walton, Lina Cherkasova and Richard D. Roberts in Assessment
Footnotes
Declaration of Conflicting Interests
The author(s) declared no potential conflicts of interest with respect to the research, authorship, and/or publication of this article.
Funding
The author(s) received no financial support for the research, authorship, and/or publication of this article.
Supplemental Material
Supplemental material for this article is available online.
Notes
References
Supplementary Material
Please find the following supplemental material available below.
For Open Access articles published under a Creative Commons License, all supplemental material carries the same license as the article it is associated with.
For non-Open Access articles published, all supplemental material carries a non-exclusive license, and permission requests for re-use of supplemental material or any part of supplemental material shall be sent directly to the copyright owner as specified in the copyright notice associated with the article.