
Abstract
The Center for Epidemiological Studies–Depression Scale (CES-D) is the most widely used instrument to assess depressive symptoms in people living with HIV. However, its differential item functioning (DIF) by HIV status and sexual orientation has yet to be explored. This study examined DIF and measurement invariance of the CES-D using an item response theory (IRT) framework, and a more traditional factor analytic approach. Data from 841 HIV-infected and HIV-uninfected individuals, from Miami, Florida, were analyzed. Uniform DIF by HIV status was detected in Items 4, 12, and 16 from the Positive Affect factor. Nonuniform DIF was detected in Items 13 and 17. Uniform DIF by sexual orientation was detected in Items 2, 15, and 19, two of them from the Interpersonal factor. Nonuniform DIF was detected in Item 2. Using a factor analytic approach, the CES-D was invariant at the configural and metric levels by HIV and sexual orientation. These findings indicate that overall, however, using IRT, the magnitudes of DIF were negligible, the CED-D was somewhat invariant using factor analytic methods; the CES-D may be reliably used to compare by HIV status or sexual orientation.
Depression is the most prevalent mental health problem in people living with HIV (PLWH; Adams, Zacharia, Masters, Coffey, & Catalan, 2016; Cholera et al., 2017; Nacher et al., 2010; Nanni, Caruso, Mitchell, Meggiolaro, & Grassi, 2015), and the prevalence of depression in this population ranges from 36% to 42% in the United States (Rabkin, 2008), twice as high as in the general population (Ciesla & Roberts, 2001). Depressive symptoms are predictors of negative outcomes for the health and well-being of PLWH, and depression has been associated with poor adherence to antiretroviral treatment (Mayston, Kinyanda, Chishinga, Prince, & Patel, 2012) and adverse clinical events, such as increased HIV symptoms, detectable viral load, and a faster disease progression (Brandt, Bakhshaie, Zvolensky, Grover, & Gonzalez, 2015; Norcini Pala & Stecca, 2011; Sumari-de Boer, Sprangers, Prins, & Nieuwkerk, 2012). As such, depression is an important target for interventions to improve PLWH’s retention in HIV care, health outcomes, and overall quality of life.
In the context of HIV, valid and reliable instruments are essential in the assessment of depressive symptoms and its severity. The Center for Epidemiological Studies–Depression Scale (CES-D; Radloff, 1977) is used to evaluate the frequency and severity of depressive symptoms; it also includes cutoff scores to enable its use as a screening instrument. The CES-D is one of the most widely used instruments in the public domain (Gay, Kottorp, Lerdal, & Lee, 2016), and it is the most commonly used measure of depression in HIV research (Simoni et al., 2011). Initially, Radloff (1977) identified four factors in the CES-D using principal components analysis: Depressed or Negative Affect, Positive Affect, Somatic Symptoms/Retarded Activity, and Interpersonal. However, the author has since argued against excessive emphasis on separate factors and suggested using the total score to measure depressive symptomatology.
In addition to the sound psychometric properties of the CES-D (Devins et al., 1988; Shafer, 2006), the extensive use of this scale requires that the measure functions similarly across groups. Differential item functioning (DIF) is related to unequal probabilities of giving a certain response on an item for members of different groups, after matching on the attributes the test is intended to measure. The absence of DIF indicates that groups can be meaningfully compared (Choi, Gibbons, & Crane, 2011). Presence of DIF indicates that differences in scores may be attributable to response bias rather than to actual differences in the frequency or severity of depressive symptoms, and may also suggest that other variables, besides the latent construct of interest, may be influencing the scores. This may compromise the reliable interpretation and validity of the scores and the comparison across groups (Yang & Jones, 2007). DIF also indicates that the items in a scale operate inconsistently across groups and, therefore, lack measurement equivalence (Hambleton, Swaminathan, & Rogers, 1991). In this sense, DIF may suggest lack of measurement invariance, which may lead to conclude that CES-D DIF has been examined across a variety of characteristics with disparate and inconsistent results—for example, gender (Gay et al., 2016; Yang & Jones, 2007), age (Covic, Pallant, Conaghan, & Tennant, 2007), ethnicity, cultural background, and/or level of acculturation (Jang, Kwag, & Chiriboga, 2010).
Despite the widespread use of the CES-D in people with HIV and the prevalence of depressive symptoms in this population, few studies have examined CES-D DIF in HIV. Using an item response theory approach, Gay et al. (2016) analyzed DIF of the CES-D in a sample of PLWH. DIF was found for eight items according to race, gender, and AIDS diagnosis. For example, the item “I felt hopeful about the future” was more easily endorsed by people who had not been diagnosed with AIDS, whereas African Americans were more likely to endorse the item “I felt that people disliked me.” As differential responding may cause scores to vary systematically across subgroups, it is essential to determine if differences are clinically meaningful for diagnosis and if cutoffs should be adjusted to be more appropriate for specific subgroups, for a more reliable interpretation of scores. In addition to this, to our knowledge, DIF has not been evaluated by HIV diagnosis, although HIV-uninfected and HIV-infected individuals are frequently compared, and this comparison is necessary to establish evidence-based practices tailored to this population. The absence of DIF would support the validity of mean-level comparisons across HIV-infected and HIV-uninfected individuals.
Moreover, little research has examined DIF of the CES-D associated with sexual orientation. The limited evidence available indicates that specific items, such as those related to interpersonal problems or relations (e.g., people were unfriendly), are more frequently endorsed by transgender persons (Gay et al., 2016). Accordingly, the same effect was observed among other highly stigmatized groups, such as African Americans (Yang & Jones, 2007). Evidence has consistently shown the association between stigma and depression in sexual minorities (Herek, Saha, & Burack, 2013; McDowell, Hughto, & Reisner, 2019). Excessive chronic social stress, due to the experience or constant expectation of stigma and discrimination, known as minority stress, underlies the high levels of emotional distress and depressive symptoms in sexual minorities (Meyer, 2003; Valentine & Shipherd, 2018). Within an intersectionality framework, co-occurring stigmas, such as sexual orientation and HIV-related stigmas, interact, exacerbating and increasing their negative impact on health and well-being (Logie, James, Tharao, & Loutfy, 2011). This may lead to even higher levels of depression in sexual minority individuals with HIV. Thus, these individuals are expected to endorse the Interpersonal items more readily than individuals from general population, which may be due to actual experiences of rejection from others, independent of their level of depression. Therefore, they may endorse these items more frequently even in the presence of lower levels of depression. As a result of differential functioning of these items, comparison of CES-D across groups by sexual orientation may be limited. Conversely, absence of DIF would suggest that mean-level comparisons between individuals who identify as a sexual minority and those who do not, are valid.
These studies highlight the importance of exploring DIF of the CES-D by HIV status and sexual orientation. The objective of this study was to examine DIF of the CES-D using an item response theory framework (Bernstein, Ahluvalia, Pogge, & Handelsman, 1997; Bernstein et al., 2003), as well as a more traditional factor analytic approach. It was hypothesized that nonuniform DIF and measurement non-invariance would be present by sexual orientation and HIV status. Sexual minorities were anticipated to be more likely to endorse Interpersonal items, whereas HIV negative individuals were expected to endorse Positive Affect items more readily.
Method
Study Recruitment and Design
To maximize the inclusion of sexual minorities and increase sample heterogeneity, which increases the stability of the estimated parameters in item response theory (Hambleton et al., 1991), data from two studies were aggregated for analyses. Study 1 focused on HPT (hypothalamic pituitary thyroidal) and HPA (hypothalamic pituitary adrenal) axis functioning among MSM (men who have sex with men) from ethnically and racially diverse backgrounds recruited from Miami, Florida (N = 347); this study has been previously described (Carrico, Rodriguez, Jones, & Kumar, 2017). Study 2 focused on predictive biomarkers of cardiovascular disease among HIV-infected and HIV-uninfected individuals in Miami, Florida (N = 494) and has been previously described (Rodriguez et al., 2019).
Ethical Approval
Ethical approval from the University of Miami Miller School of Medicine institutional review board was obtained prior to study onset.
Participants and Procedures
All participants (N = 841) completed all measures in person at the study site on Qualtrics, a web-based data collection platform. Participants were compensated US$50 for their time and transportation to the study site.
Measures
Demographic Characteristics
Participants completed a demographic questionnaire that included age, gender, race, ethnicity, and sexual orientation.
Depressive Symptoms
The CES-D (Radloff, 1977) was used to measure depressive symptoms. The CES-D is a 20-item scale that has been shown to have adequate internal consistency and concurrent validity (Shinar et al., 1986; Wells, Klerman, & Deykin, 1987). The CES-D asks participants to rate how they felt and behaved in the past week, ranging from 0 = rarely (less than 1 day a week) to 3 = most or all of the time (up to 7 days a week). The original scale has four factors, including Depressive Affect (in this sample, α = .89), Somatic Symptoms (α = .82), Positive Affect (α = 0.84), and Interpersonal (α = .76), which have demonstrated good to adequate internal consistency in this sample. The full scale demonstrated excellent reliability (α = .91).
Statistical Analysis
Descriptive Statistics and Unidimensionality
Univariate analyses, such as frequencies, means, and standard deviations, were used to describe participants. The internal consistency of the CES-D was evaluated using the Cronbach’s α coefficient. Then, a single-factor confirmatory factor analysis (CFA) was conducted to evaluate the assumption of unidimensionality of the scale. Mardia’s multivariate normality test was used in the MVN package, Version 5.7 (Korkmaz, Goksuluk, & Zararsiz, 2014) to decide on the appropriate estimation procedure. To assess model fit, a chi-square test of model fit, the comparative fit index (CFI), the Tucker–Lewis index (TLI), and the root mean square error of approximation (RMSEA) were used. CFI and TLI values ≥0.90 or RMSEA values <0.05 indicate adequate fit of the model to the data (Kline, 2015).
Measurement Invariance
Tests of measurement invariance were performed according to guidelines provided by Brown (2014) and Chen (2007). A preliminary step in testing measurement invariance is to ensure that the factor structure of the CES-D applied to the different groups by HIV status and sexual orientation. Measurement invariance tests involve increasingly restrictive levels, starting with configural invariance, followed by equality of factor loadings or metric invariance, equality of indicator thresholds or scalar invariance, and equality of indicator residual variances or strict invariance. The recommended order of testing these levels of invariance is (1) configural invariance, (2) metric invariance, (3) scalar invariance, and (4) strict invariance (Brown, 2014). Fit indices previously described were used to test measurement invariance. According to Chen (2007), when sample size is N > 300, to test measurement invariance in factor loadings, a change of ≥−0.010 in CFI, in addition to a change of ≥0.015 in RMSEA or a change of ≥0.030 in standardized root mean residual (SRMR) would suggest noninvariance. To test measurement invariance of intercept or residual invariance, a change of ≥−0.010 in CFI, in addition to a change of ≥0.015 in RMSEA or a change of ≥0.010 in SRMR would suggest noninvariance.
Differential Item Functioning
DIF by HIV status and sexual orientation was tested using the lordif 0.3-3 package in R Version 1.1.453 (Choi et al., 2011), which utilizes ordinal logistic regression to test DIF, as indicated by tests of the models below:
Model 0: logit P(ui ≥ k) = αk
Model 1: logit P(ui ≥ k) = αk + β1 * CES-D
Model 2: logit P(ui ≥ k) = αk + β1 * CES-D + β2 *; HIV (or sexual minority status)
Model 3: logit P(ui ≥ k) = αk + β1 * CES-D + β2 *; HIV + β3 * CES-D *( HIV (or sexual minority status)
Total DIF effect is said to be present when there is a statistically significant difference between Models 1 and 3 at α = .01, which would suggest that the model with an interaction is significantly better than a model without the interaction between the scores and HIV status or sexual orientation. Uniform DIF, which suggests consistent item performance across all score groups, is said to be present when a statistically significant difference exists between Models 1 and 2 at α = .01. Nonuniform DIF, which is the more problematic form of DIF, indicates a probability of responding that is not constant across different score groups and is therefore denoted by a statistically significant difference between Models 2 and 3 at α = .01 (Choi et al., 2011).
With large sample sizes, −2 likelihood ratio chi-square tests may overestimate DIF. As such, empirical thresholds to identify DIF were derived from Monte Carlo simulations in DIF-free samples (α = .01, 1,000 replications). The highest empirical threshold derived from simulations was used to identify uniform DIF and nonuniform DIF in this study (Choi et al., 2011).
Results
Demographic Characteristics of Participants
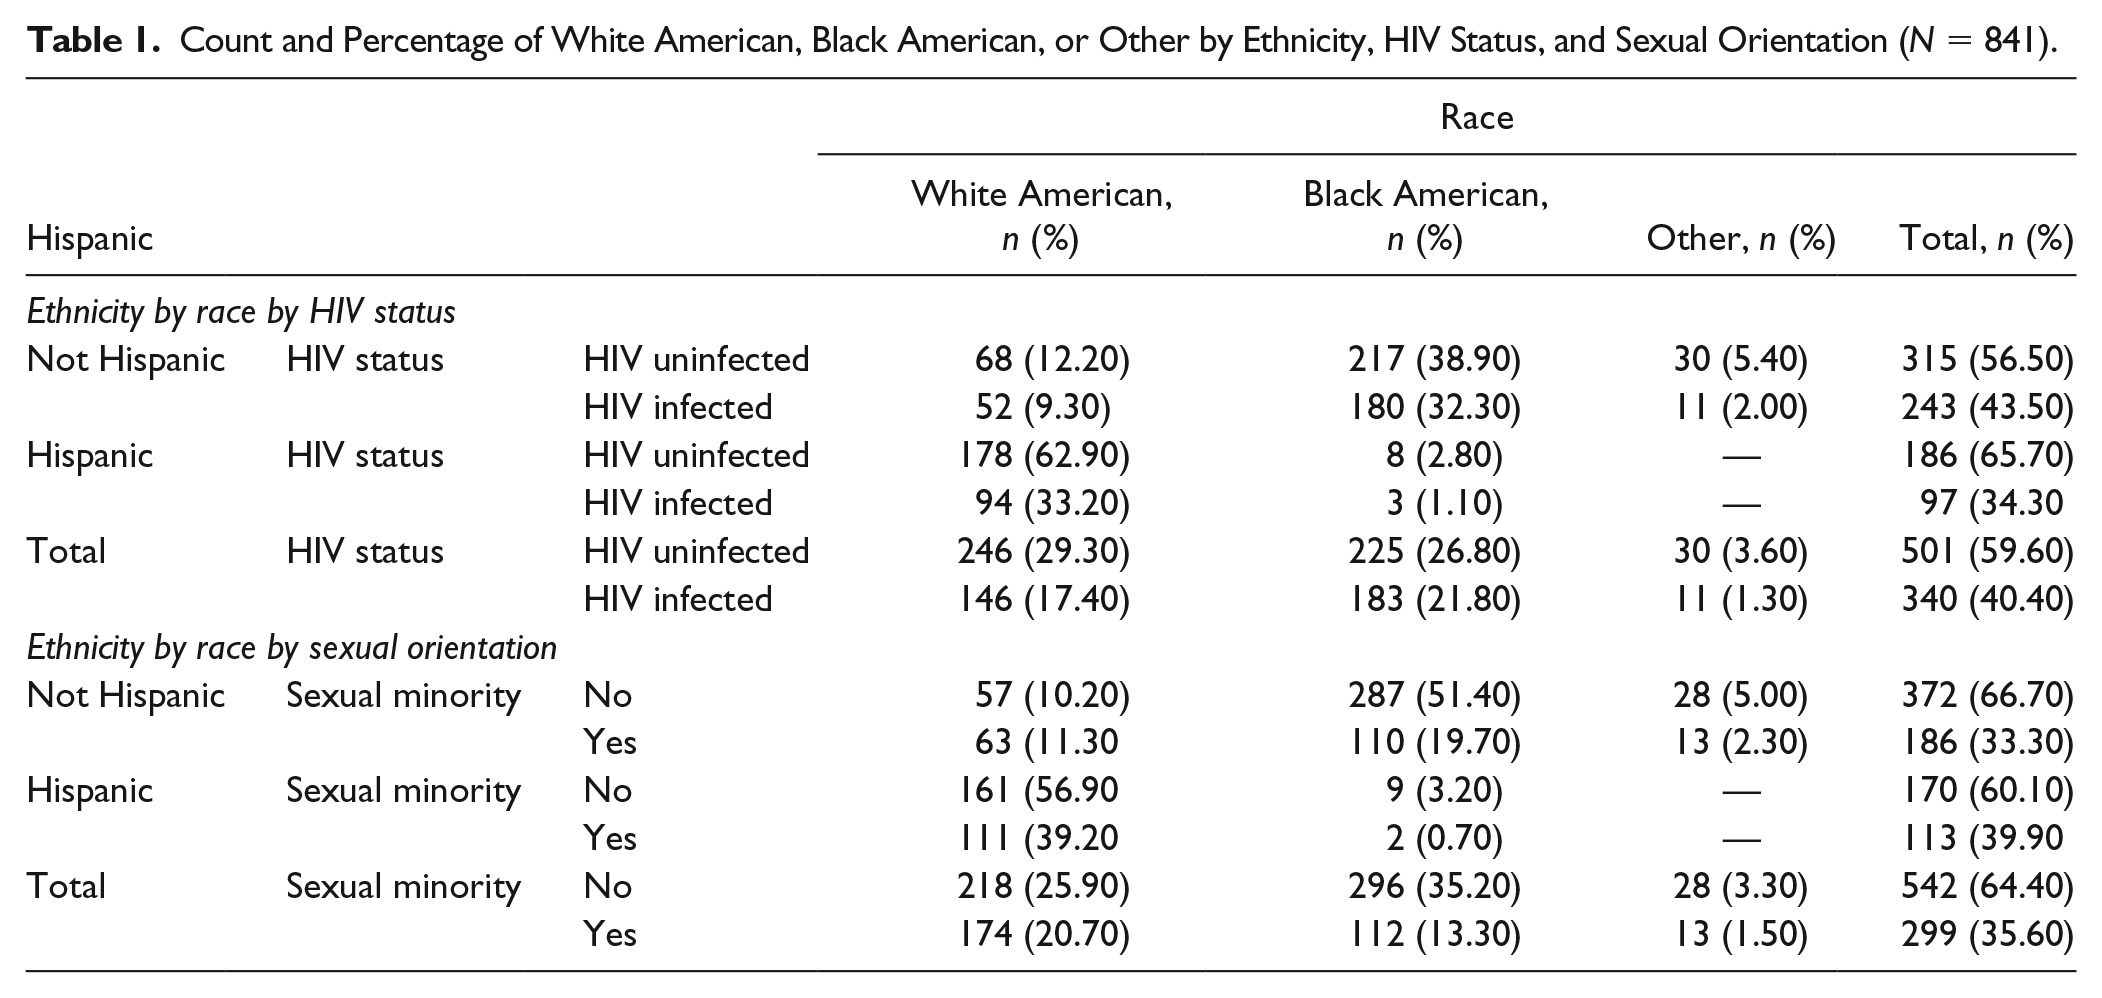
Participants were an average of 36 years of age (SD = 9.69). Three fourths of participants (71%) were men. Approximately half (47%) of participants identified as White American, 49% as Black African American, and 5% as other; 34% identified as Hispanic. In terms of HIV status, 60% of participants were HIV-uninfected, and 40% were HIV-infected. One third (36%) identified as sexual minority (either gay, lesbian, bisexual, or MSM). Nearly half of participants (n = 409, 49%) identified as heterosexual and were HIV-uninfected; 16% (n = 133) identified as heterosexual and were HIV-infected. HIV-uninfected participants who identified as sexual minority constituted 11% of the sample (n = 92); HIV-infected participants who identified as sexual minority were 25% of the sample. The number of participants by ethnicity, race, and sexual orientation or HIV status is presented in Table 1.
Count and Percentage of White American, Black American, or Other by Ethnicity, HIV Status, and Sexual Orientation (N = 841).
Scale Descriptive Statistics
The count and proportions for CES-D items are displayed in Table 2. As shown in Table 2, there was no need to merge any categories, as such, the original scale response options were used for analysis. There was no missing data in any of the items.
Center for Epidemiological Studies–Depression Scale Items Count and Proportions (N = 841).
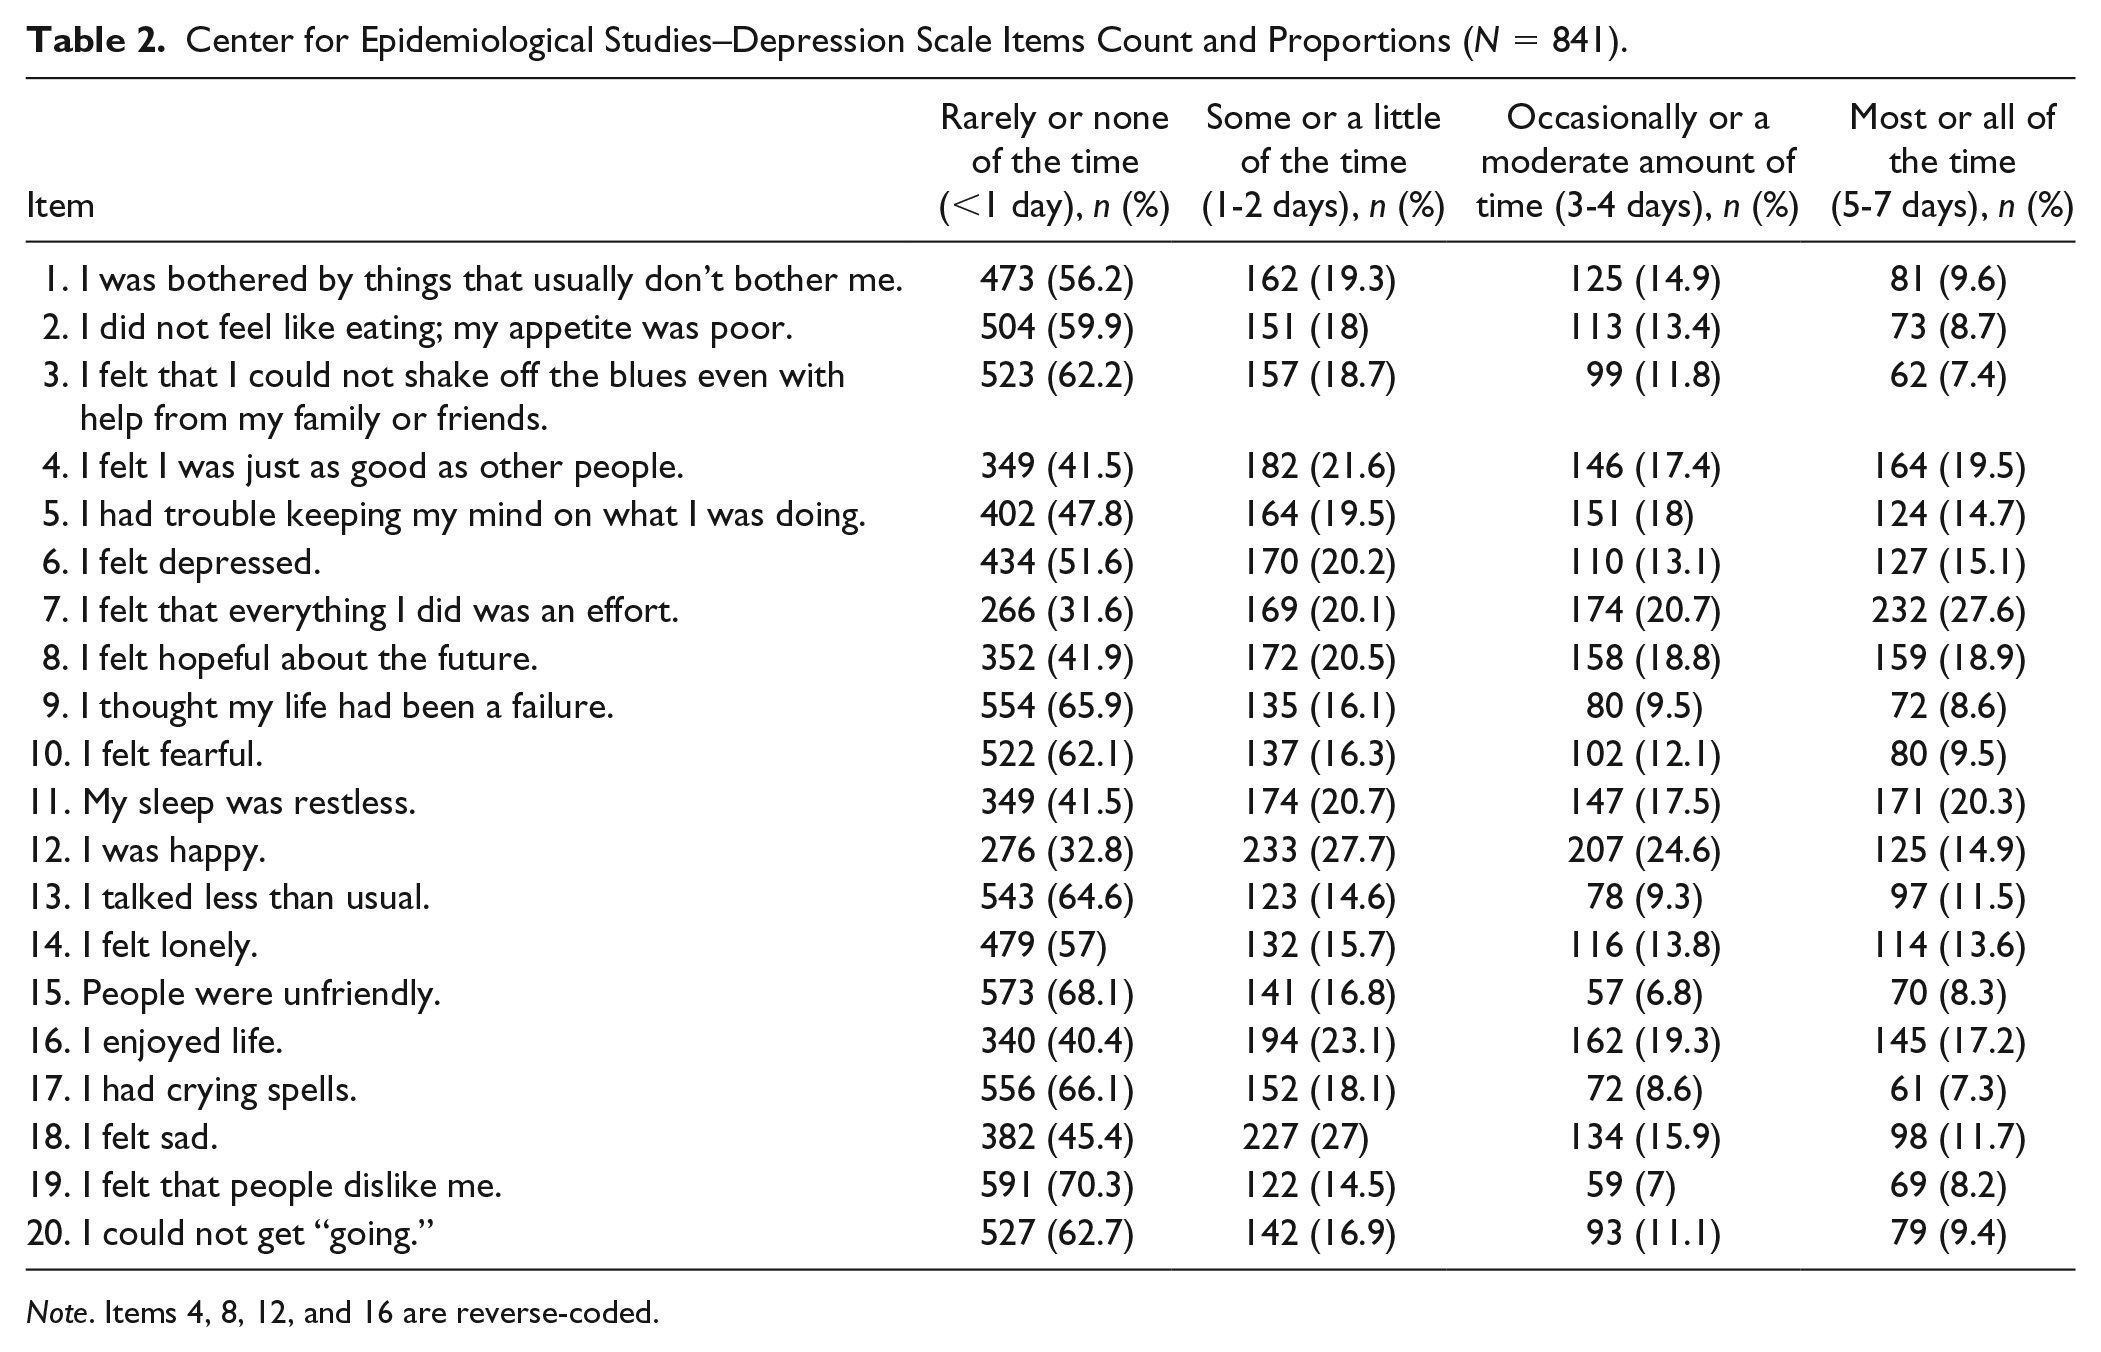
Note. Items 4, 8, 12, and 16 are reverse-coded.
Unidimensionality
The results of Mardia’s multivariate normality test revealed nonnormal multivariate data (Mardia’s estimation of multivariate skewness = 6482.9, p <.001; Mardia’s estimation of multivariate kurtosis = 74.29, p <.001). Therefore, a WLSMV (mean and variance adjusted weighted least squares) estimator with theta parameterization was used, given that it does not assume a normal distribution, and as such, is the preferred method for modeling ordinal data (Brown, 2014). A CFA was used to investigate the unidimensionality of the CES-D using a four-factor model of depressive symptoms (1) Depressive Affect, (2) Somatic Symptoms, (3) Positive Affect, and (4) Interpersonal, under a general depressive symptoms factor. Table 3 includes the standardized factor loadings of the CES-D, the standard error, and their respective level of significance for the CES-D factors. Results of the CFA of depressive symptoms had a good fit to the data χ2 = 910.89, p < .001, CFI = 0.91, TLI = 0.90, and RMSEA = 0.073. The bifactor model had a slightly worse fit, χ2 = 754.07, p < .001, CFI = 0.93, TLI = 0.92, and RMSEA = 0.071. A hierarchical model had the best fit, χ2 = 418.30, p < .001, CFI = 0.97, TLI = 0.96, and RMSEA = 0.043. Because the hierarchical model had the best fit to the data, the hierarchical model was used (see Table 3).
Center for Epidemiological Studies–Depression Scale (CES-D) Item Factor Loadings (N = 841).
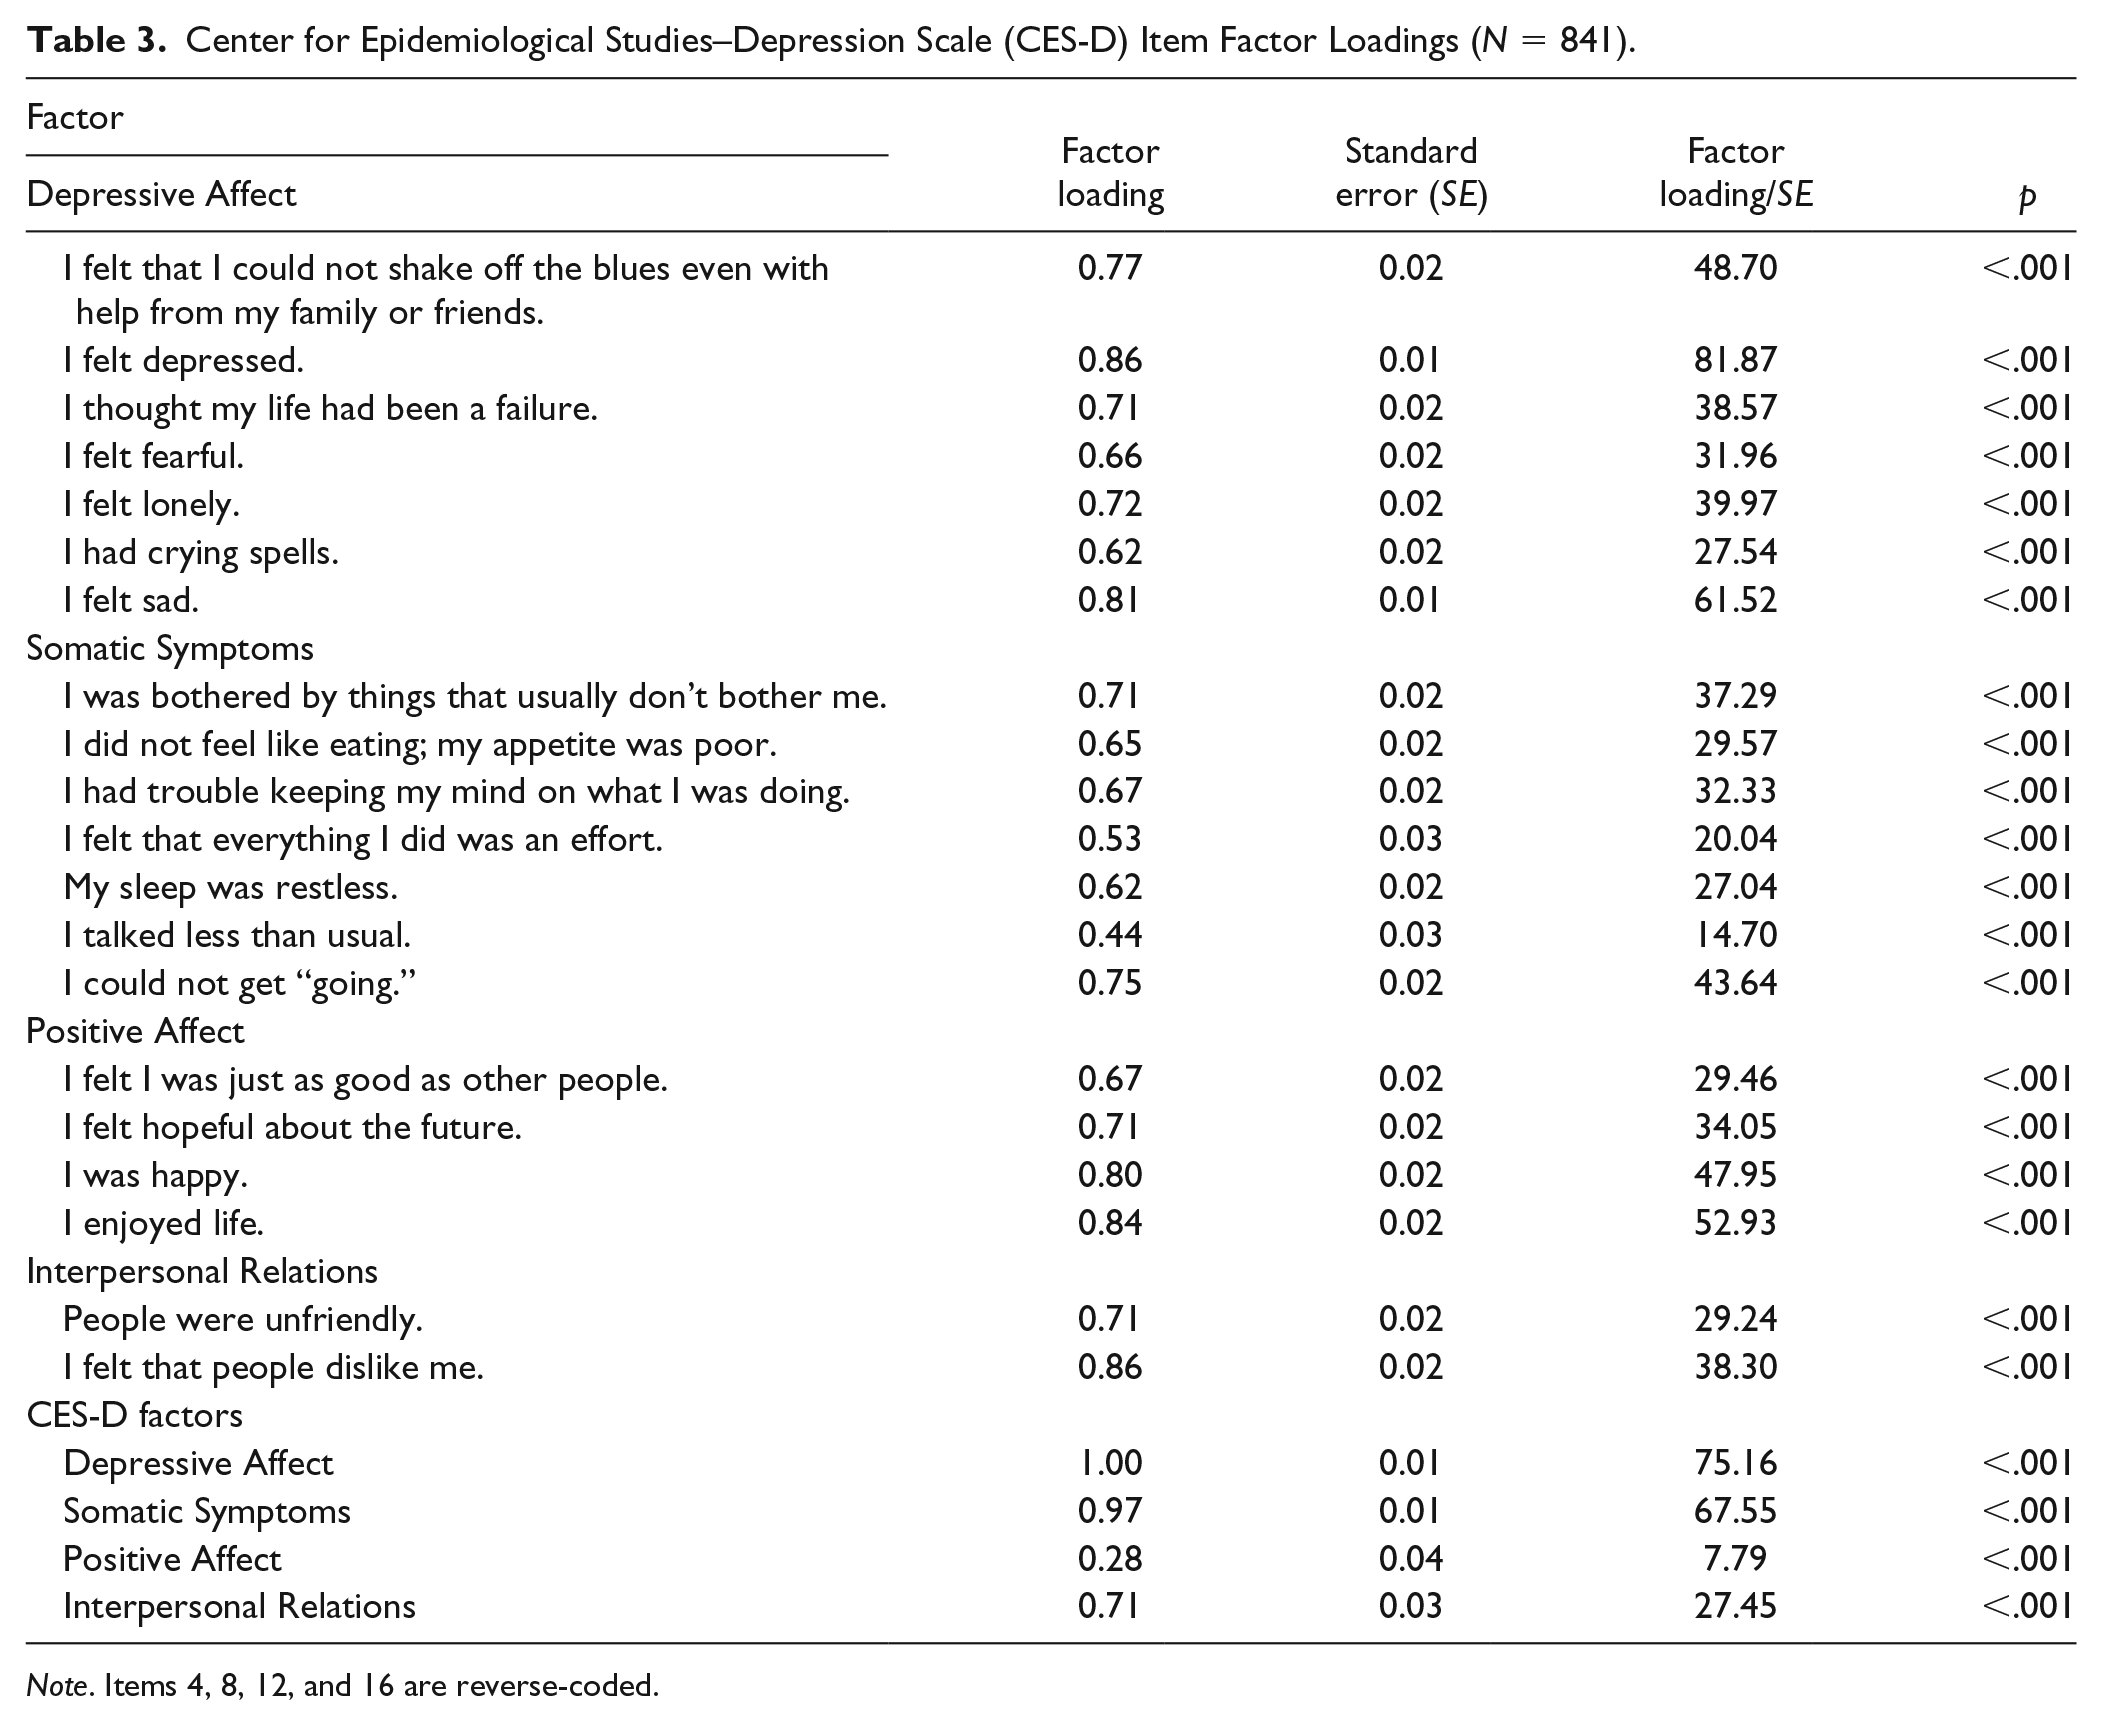
Note. Items 4, 8, 12, and 16 are reverse-coded.
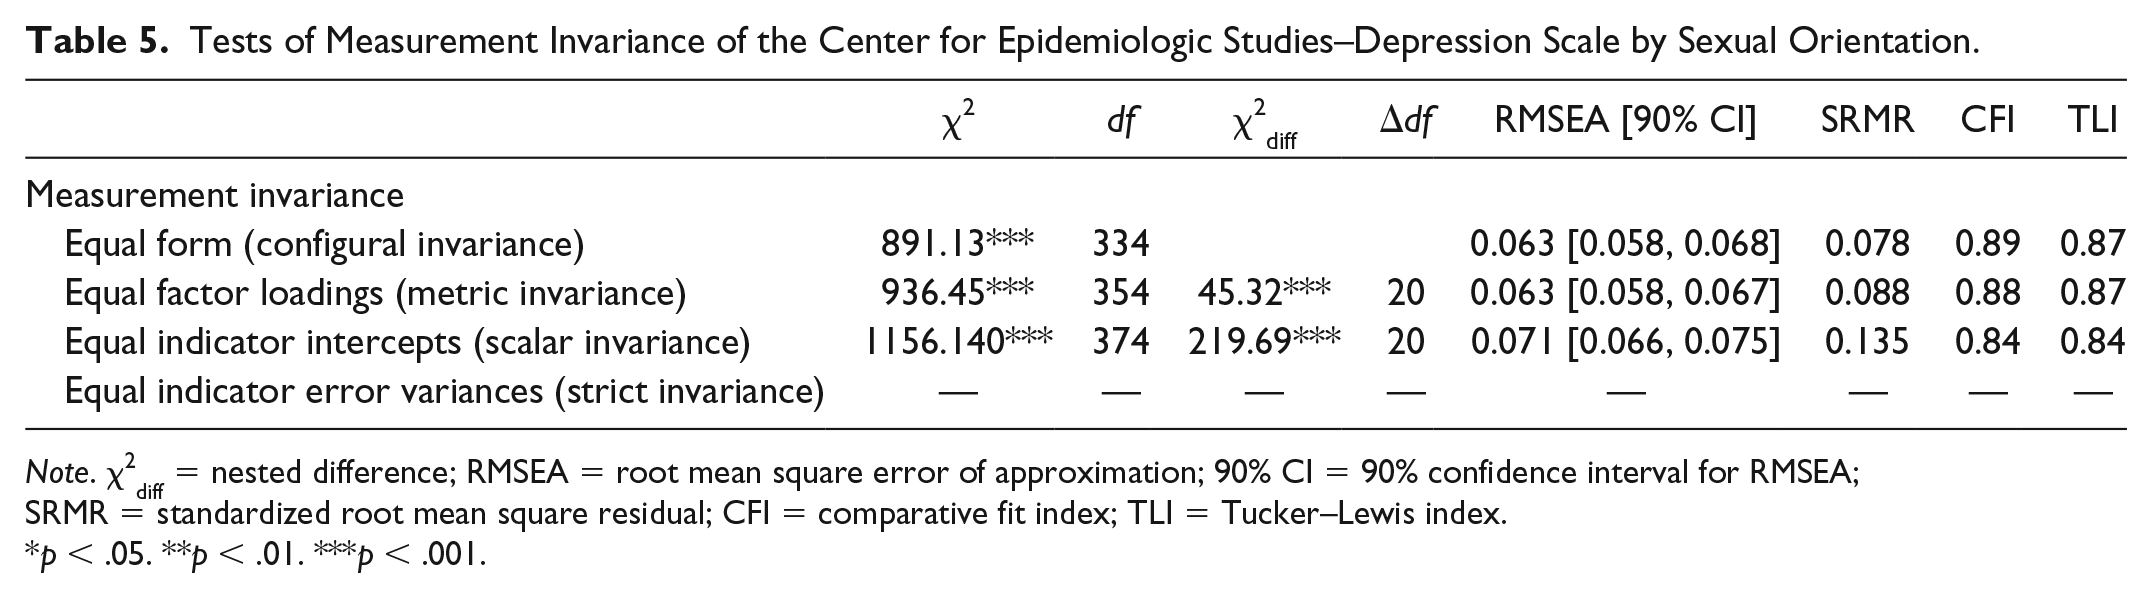
Measurement Invariance
As noted in Table 4, a hierarchical structure of the CES-D was supported in HIV-infected and HIV-uninfected participants, χ2(332) = 505.81 (p < .001), RMSEA = 0.035, SRMR = 0.40, CFI = 0.97, and TLI = 0.96. Given that configural invariance was established, metric invariance was then tested by constraining factor loadings to be equal in HIV-infected and HIV-uninfected participants. Metric invariance was supported, ΔCFI = 0.01, ΔRMSEA = −0.01, ΔSRMR = 0.01, χ2(20)diff = 39.98, p = .005. Because metric invariance was supported, scalar invariance was tested. Scalar invariance was not supported, ΔCFI = 0.02, ΔRMSEA = 0.01, ΔSRMR = 0.04, χ2(20)diff = 121.78, p < .001. Therefore, strict invariance was not tested.
Tests of Measurement Invariance of the Center for Epidemiologic Studies–Depression Scale by HIV Status.
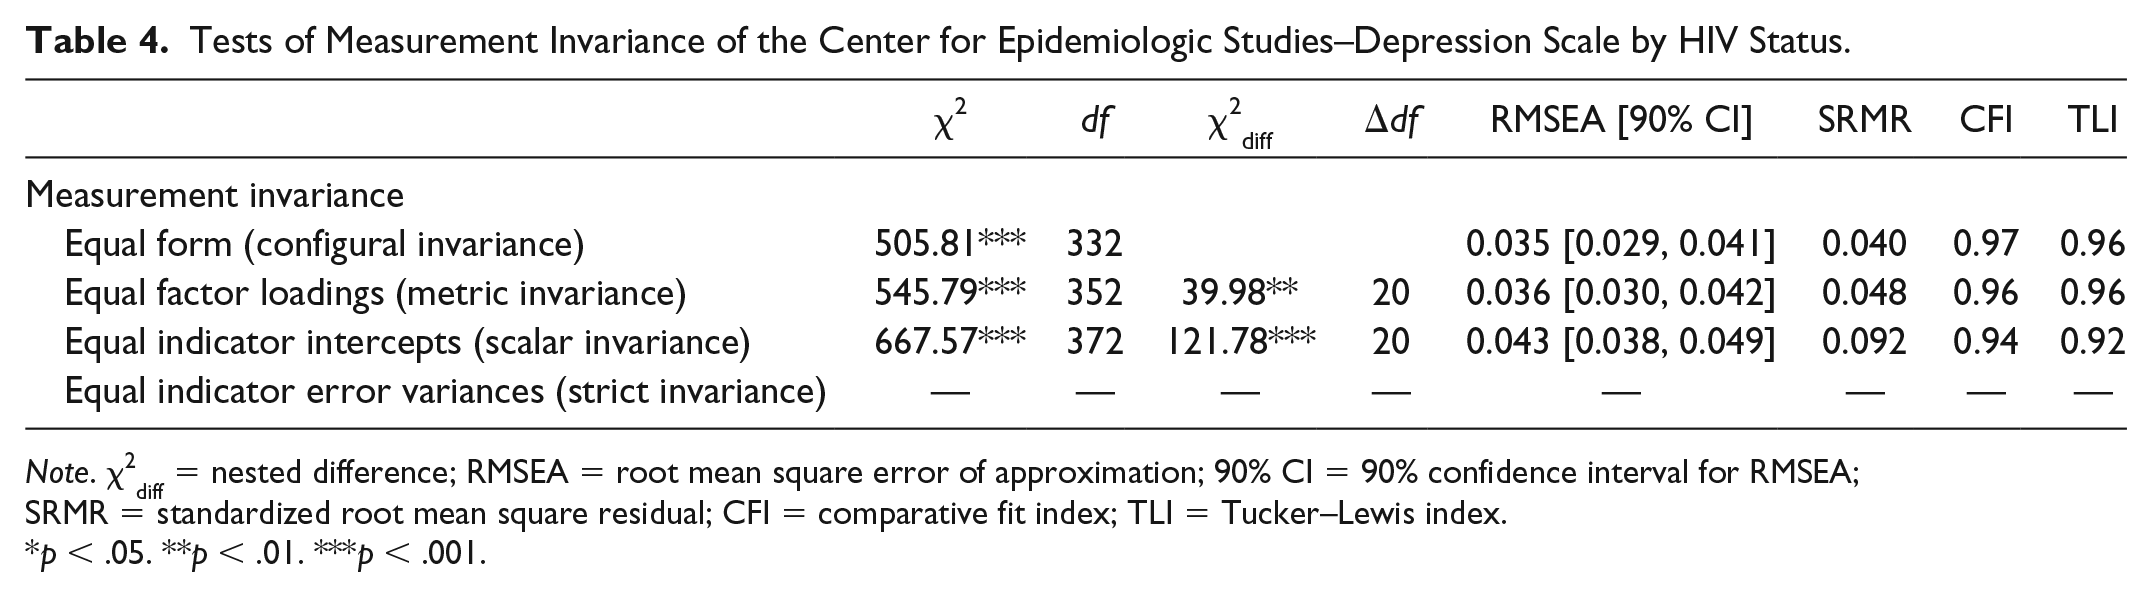
Note. χ2diff = nested difference; RMSEA = root mean square error of approximation; 90% CI = 90% confidence interval for RMSEA; SRMR = standardized root mean square residual; CFI = comparative fit index; TLI = Tucker–Lewis index.
p < .05. **p < .01. ***p < .001.
To test measurement invariance by sexual orientation, an attempt was made to similarly use a hierarchical structure. However, when testing configural invariance by sexual orientation, the model would not converge. As such, two separate hierarchical CFAs were conducted by group. The model with a hierarchical structure for heterosexual participants converged, but it did not converge for sexual minority participants. A bifactor structure also did not converge among sexual minority participants. As such, a single-factor structure of the CES-D was used to test measurement invariance by sexual orientation. As shown in Table 5, the one-factor structure of the CES-D was supported in heterosexual and sexual minority participants, χ2(334) = 891.13 (p < .001), RMSEA = 0.063, SRMR = 0.078, CFI = 0.89, and TLI = 0.87. Because configural invariance was established, metric invariance was then tested by constraining factor loadings to be equal in heterosexual and sexual minority participants. Metric invariance was supported, ΔCFI = 0.01, ΔRMSEA = 0.01, ΔSRMR = 0.01, χ2(20)diff = 45.32, p < .001. Scalar invariance was not supported, however, ΔCFI = 0.04, ΔRMSEA = 0.01, ΔSRMR = 0.05, χ2(20)diff = 219.69, p < .001. Because scalar invariance was not supported, strict invariance was not tested.
Tests of Measurement Invariance of the Center for Epidemiologic Studies–Depression Scale by Sexual Orientation.
Note. χ2diff = nested difference; RMSEA = root mean square error of approximation; 90% CI = 90% confidence interval for RMSEA; SRMR = standardized root mean square residual; CFI = comparative fit index; TLI = Tucker–Lewis index.
p < .05. **p < .01. ***p < .001.
Differential Item Functioning by HIV Status
A total of five items (4, 12, 13, 16, and 17) of the CES-D were flagged for DIF by HIV status at α = .01. Model comparisons for Models 1 versus 2, Models 1 versus 3, and Models 2 versus 3 for all 20 items are shown in Table 6. Uniform DIF in the CES-D was detected in Items 4 (“I felt I was just as good as other people”), 12 (“I was happy”), and 16 (“I enjoyed life”), p < .001 (Table 6). Nonuniform DIF, which indicated DIF in favor of one group versus the other, was detected in Items 13 (“I talked less than usual”) and 17 (“I had crying spells”). Item true score functions by HIV status for all five items are presented in Figure 1. The characteristic curves for all items and DIF items are presented in Figure 2.
Differential Item Functioning (DIF) Log-Likelihood Chi-Square Model Comparisons by HIV Status for 20 Items of the Center for Epidemiological Studies–Depression Scale.
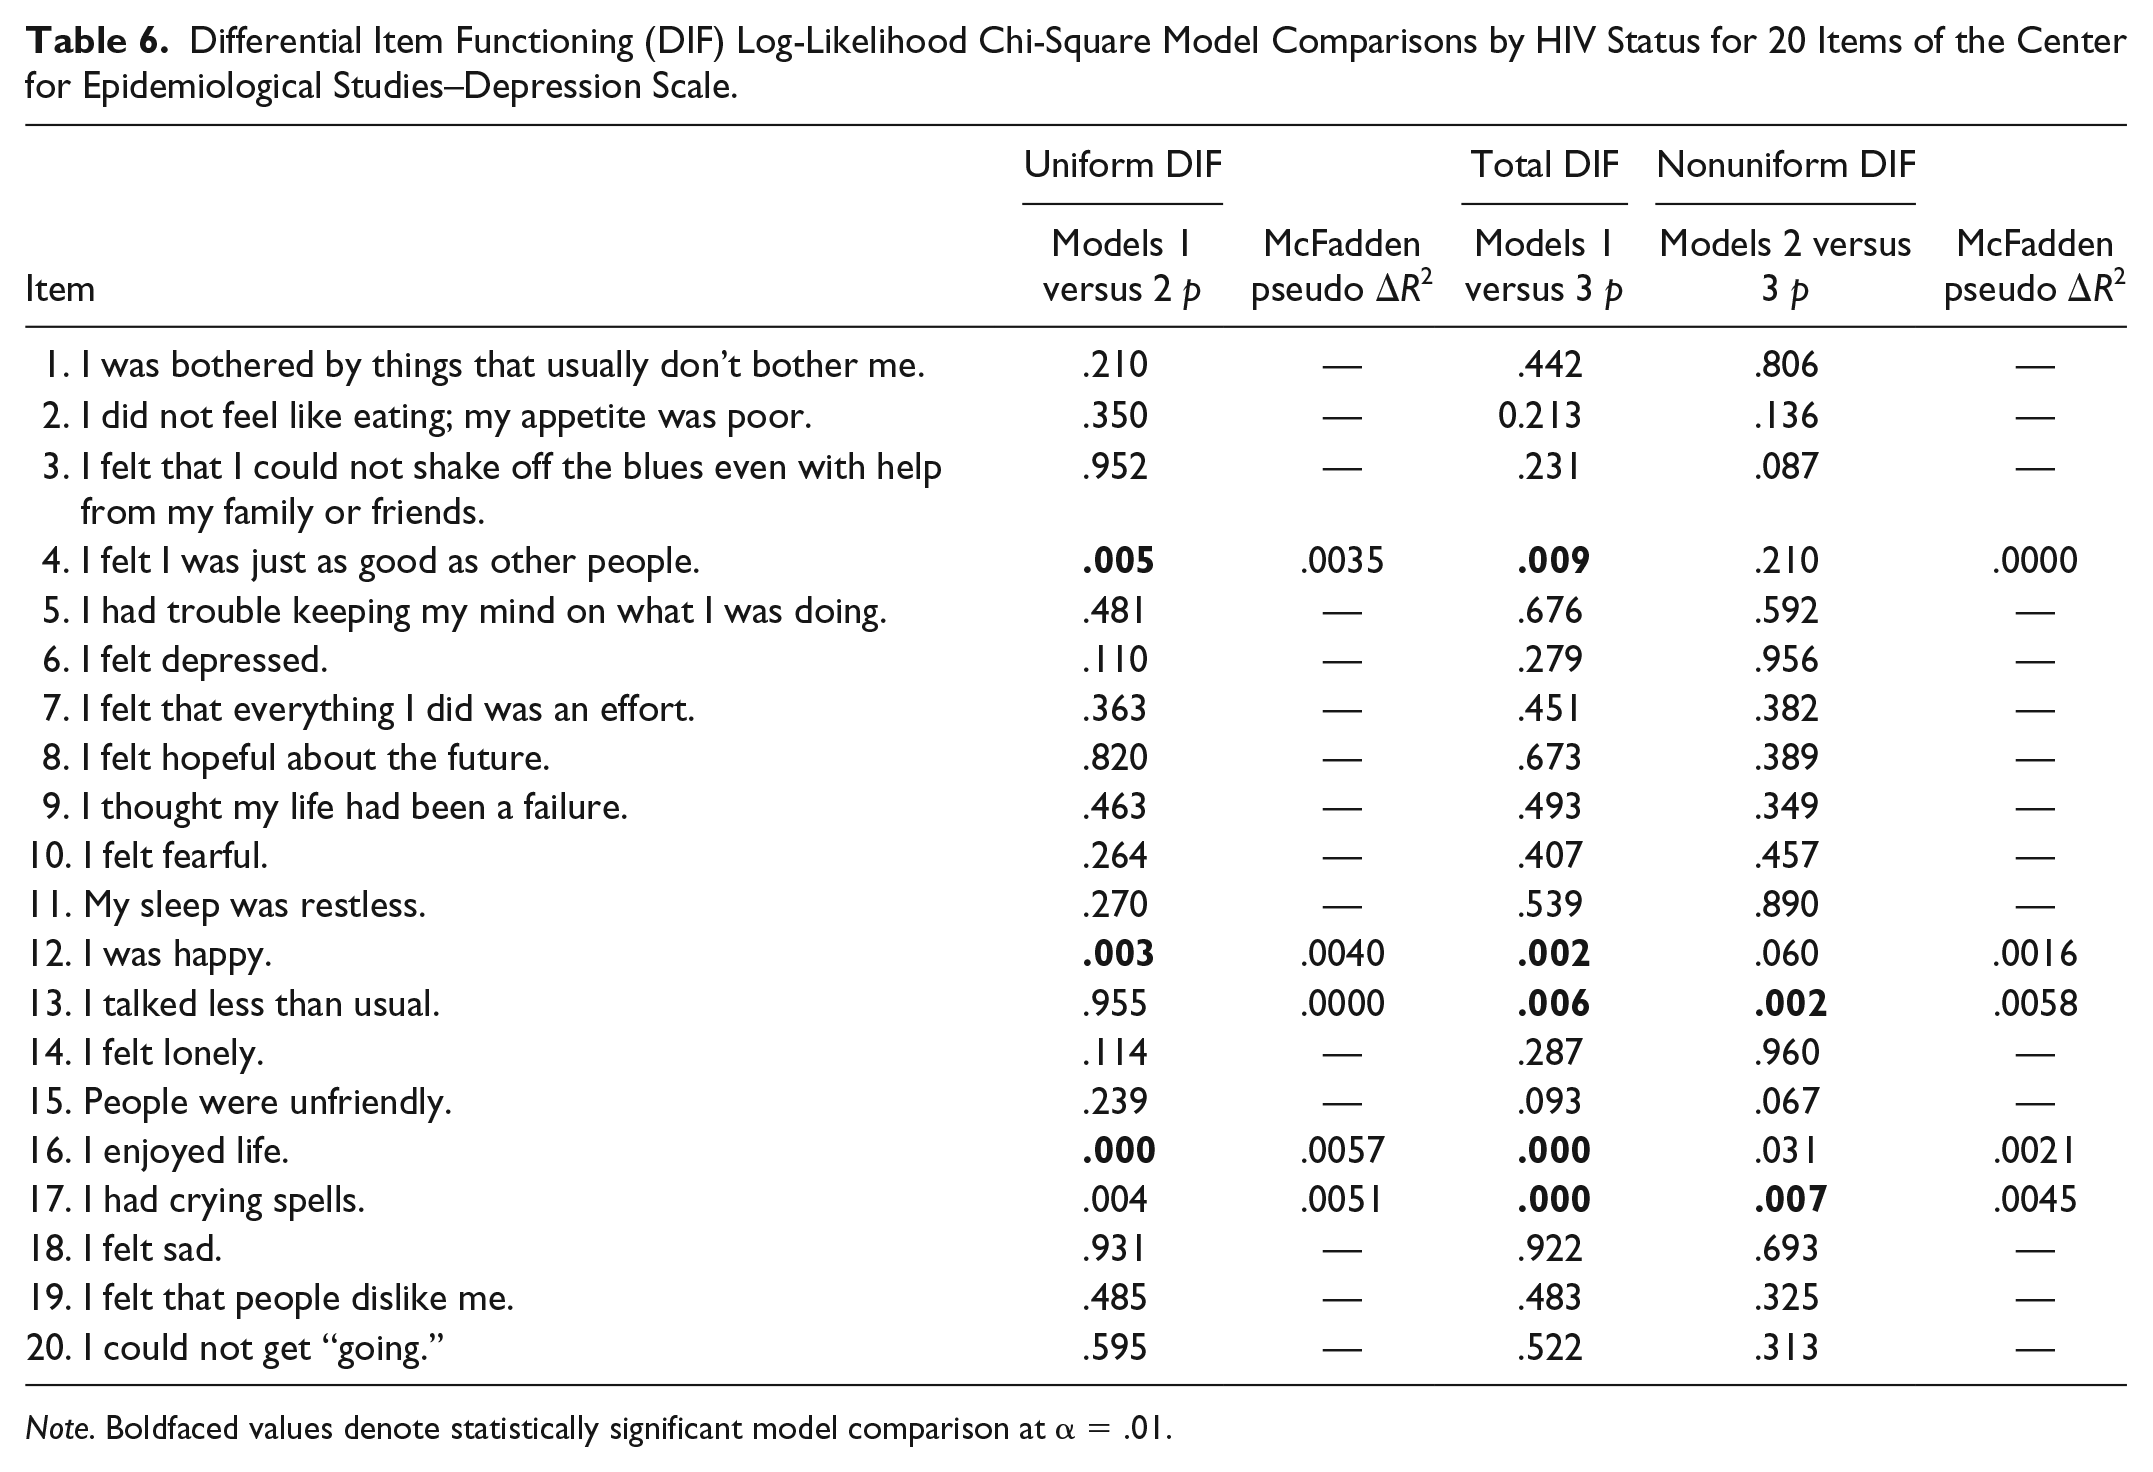
Note. Boldfaced values denote statistically significant model comparison at α = .01.
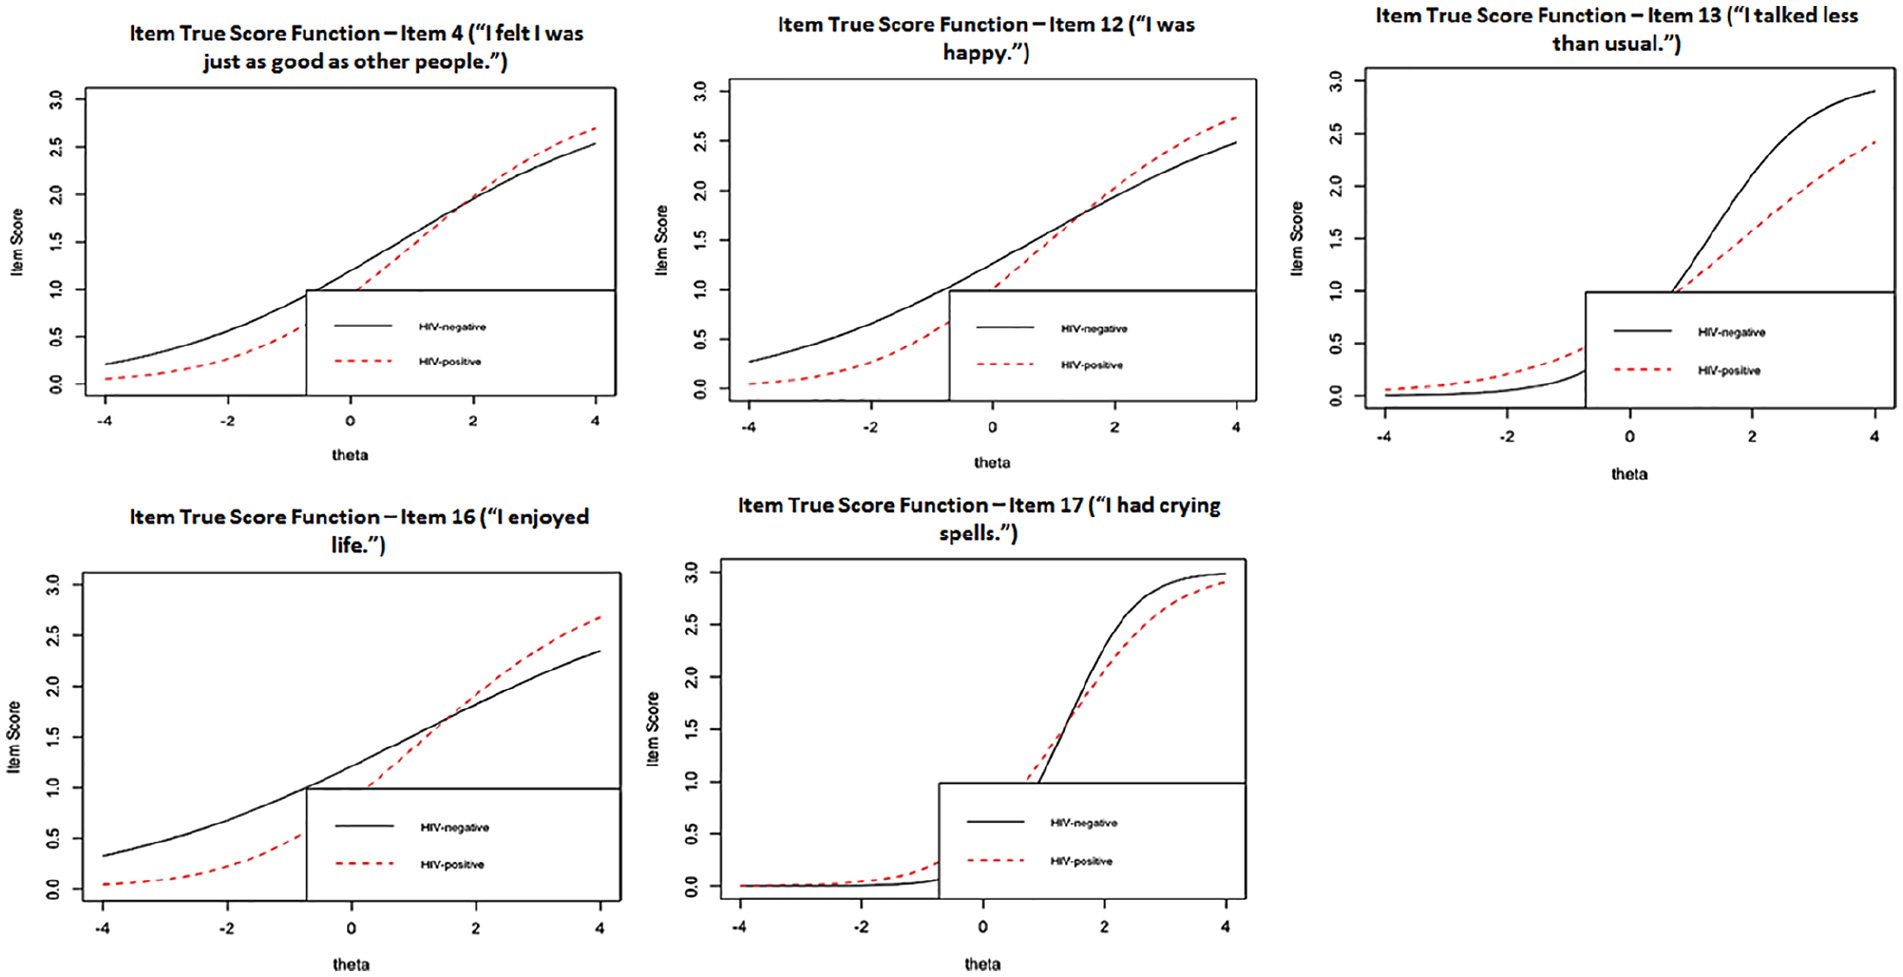
Item true score functions for items exhibiting DIF by HIV status.
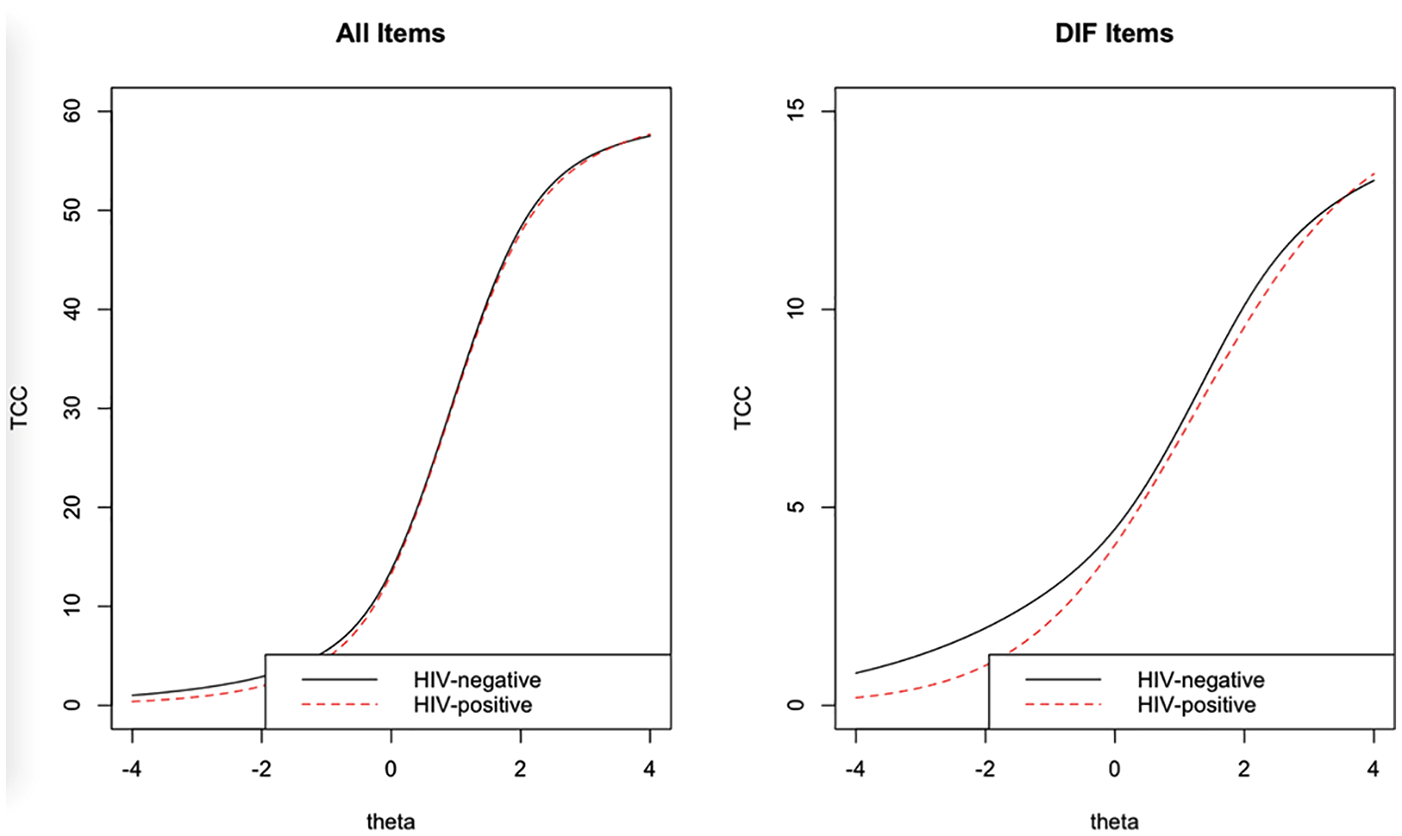
Test characteristic curves by HIV status.
The highest Monte Carlo simulation–derived empirical threshold from DIF-free samples was McFadden ΔR2 = .0048 for uniform DIF. The empirical threshold for nonuniform DIF was also McFadden ΔR2 = .0048. According to these empirical thresholds, Items 16 (ΔR2 = .0057) and 17 (ΔR2 = .0051) exhibited uniform DIF. Only Item 13 (ΔR2 = .0058) exhibited nonuniform DIF. The Monte Carlo threshold for the beta change was 0.1304. Only Item 16 (Δβ = 0.1761) met this threshold for HIV status.
Differential Item Functioning by Sexual Orientation
A total of three items (2, 15, and 19) of the CES-D were flagged for DIF by sexual orientation at α = .01 (see Table 7). Model comparisons for Models 1 versus 2, Models 1 versus 3, and Models 2 versus 3 for all 20 items are shown in Table 7. Uniform DIF in the CES-D was detected in Items 2 (“I did not feel like eating; my appetite was poor”), 15 (“People were unfriendly”), and 19 (“I felt that people dislike me”). Nonuniform DIF, which indicates that DIF is not constant across different levels of depressive symptoms, was detected in Item 2 (“I did not feel like eating; my appetite was poor”). Item true score functions by sexual orientation for the three items exhibiting DIF are presented in Figure 3. The characteristic curves for all items and DIF items are presented in Figure 4.
Differential Item Functioning (DIF) Log-Likelihood Chi-Square Model Comparisons by Sexual Orientation for 20 Items of the Center for Epidemiological Studies–Depression Scale.
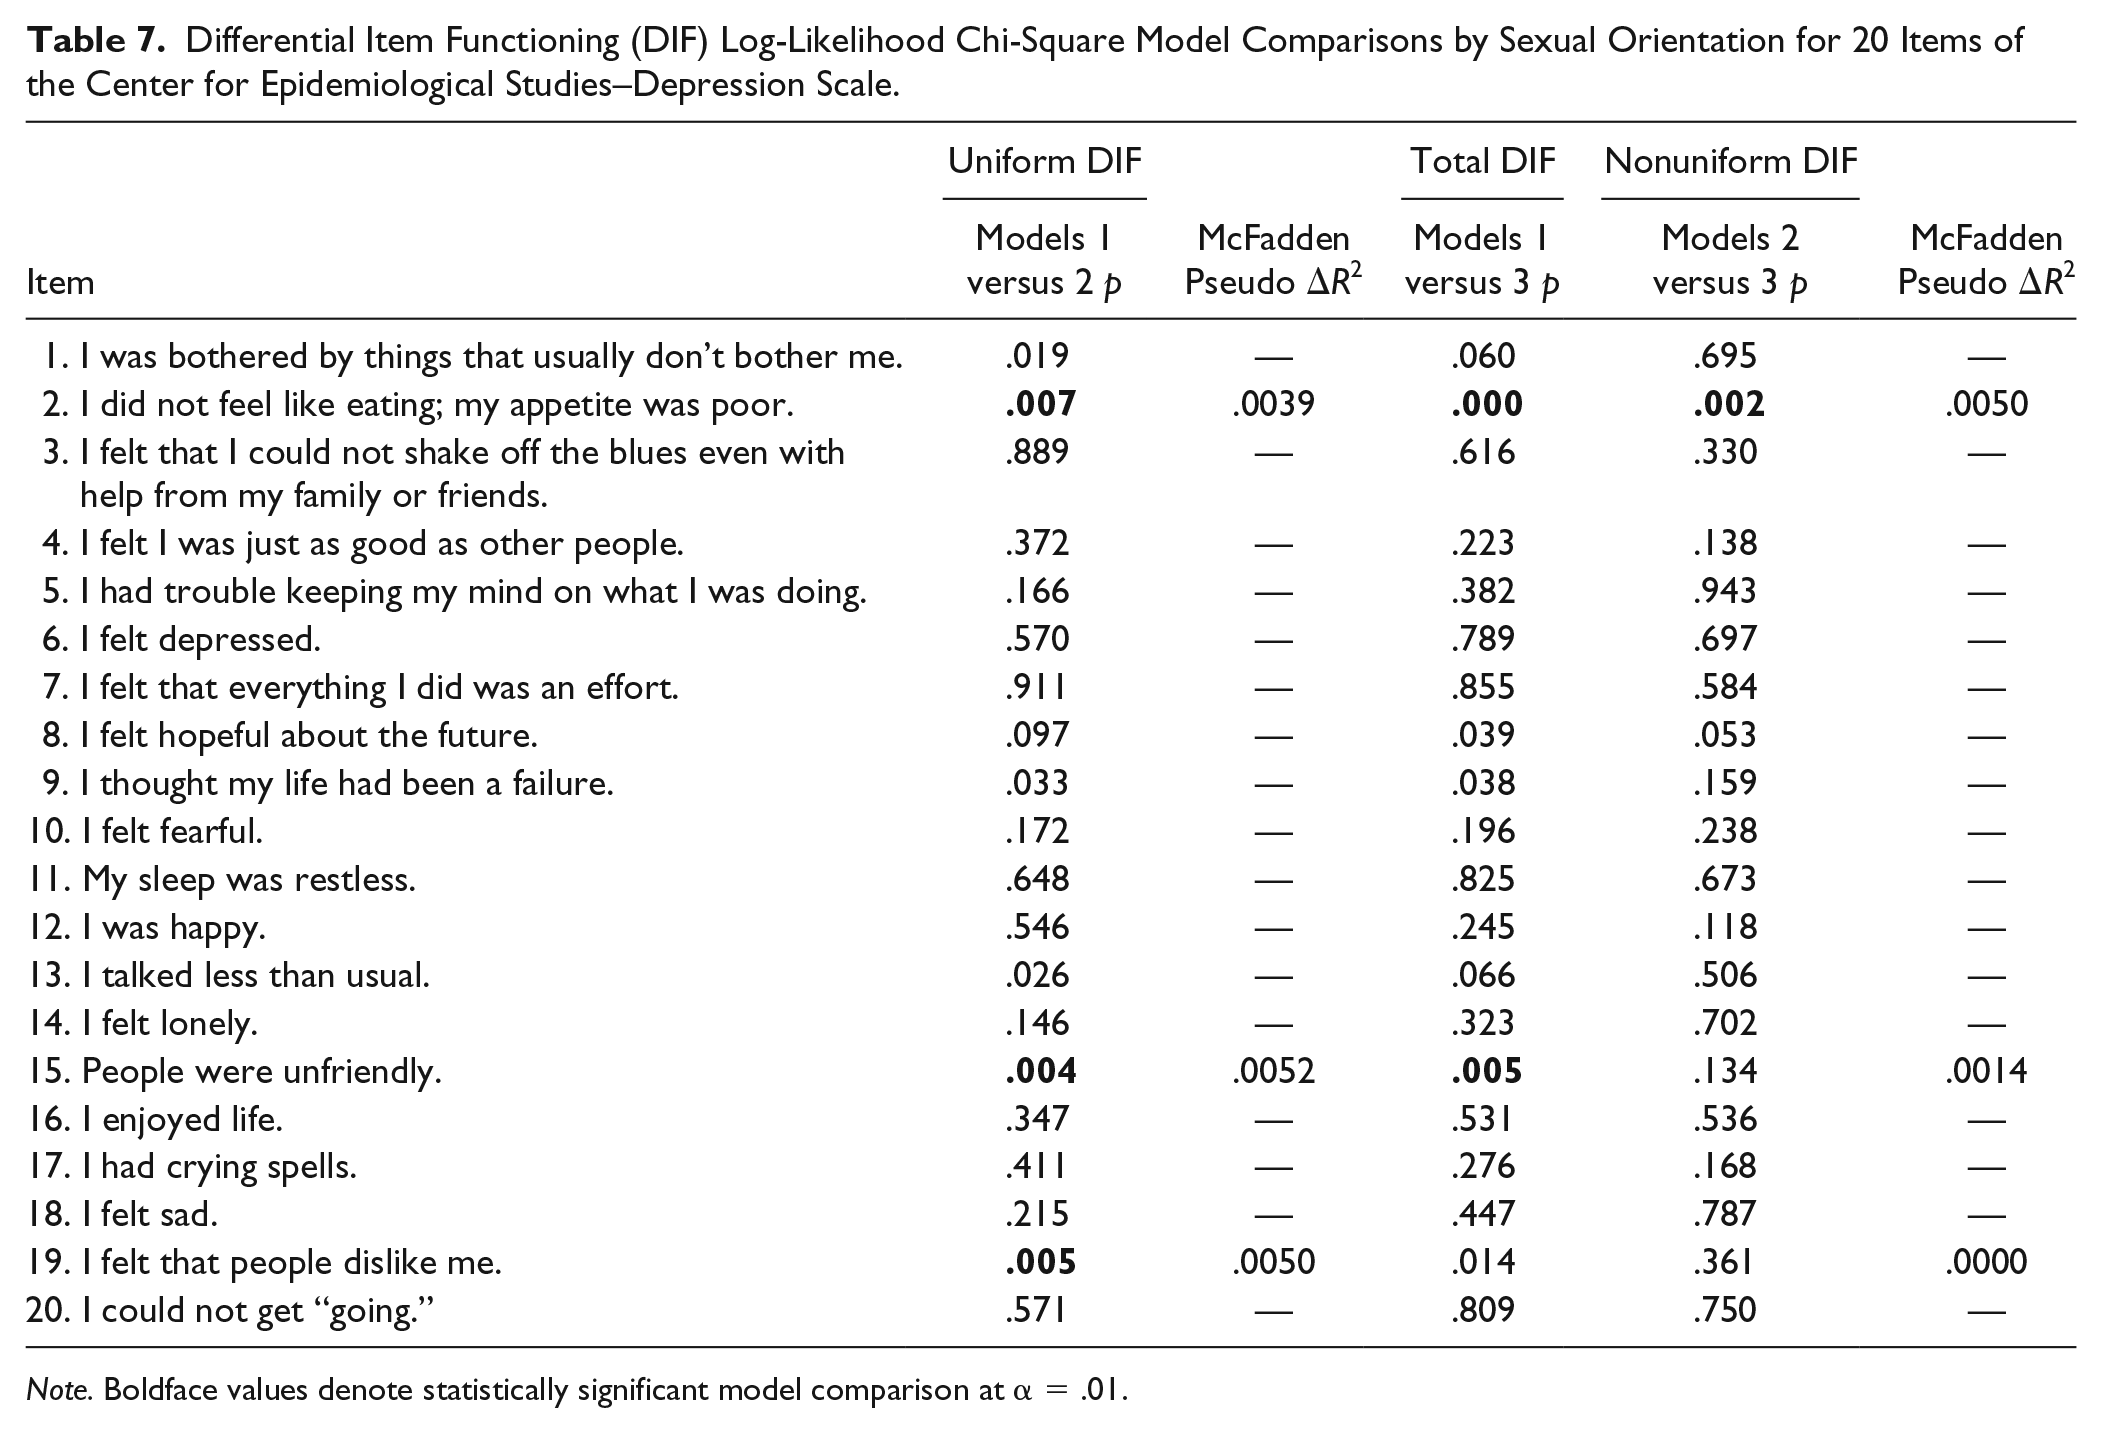
Note. Boldface values denote statistically significant model comparison at α = .01.
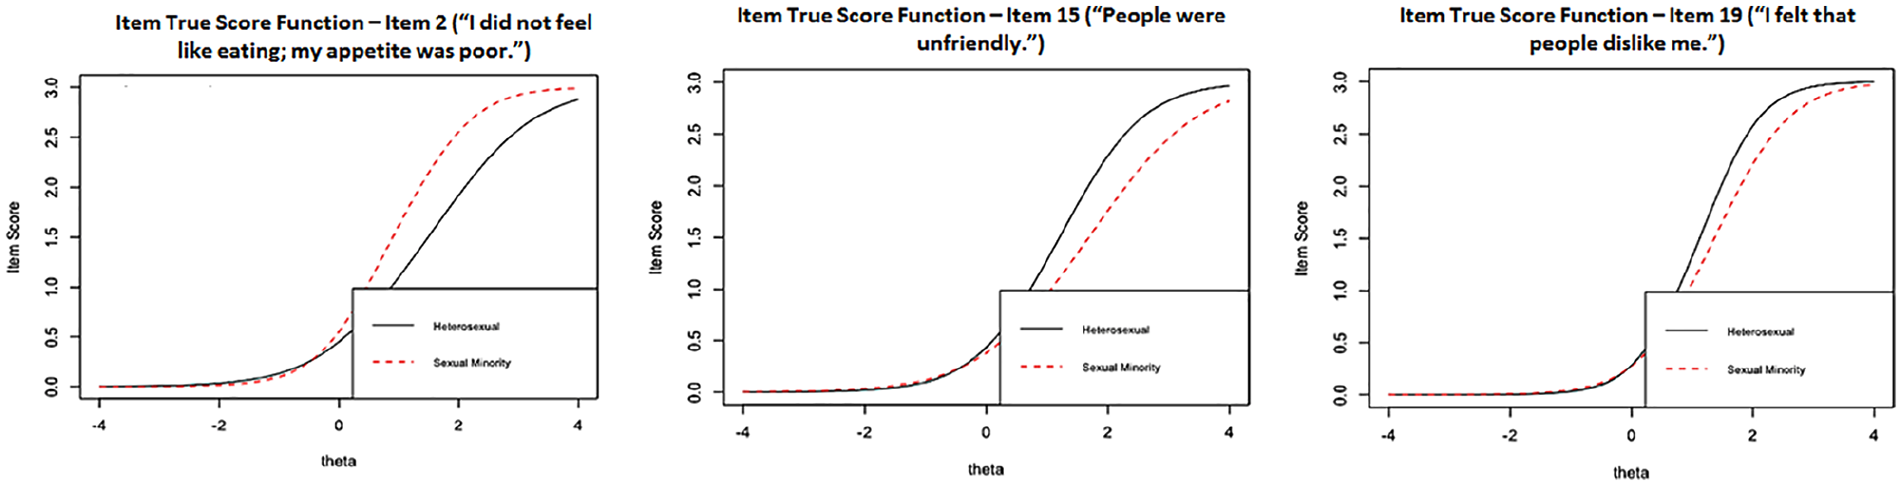
Item true score functions for items exhibiting DIF by sexual orientation.
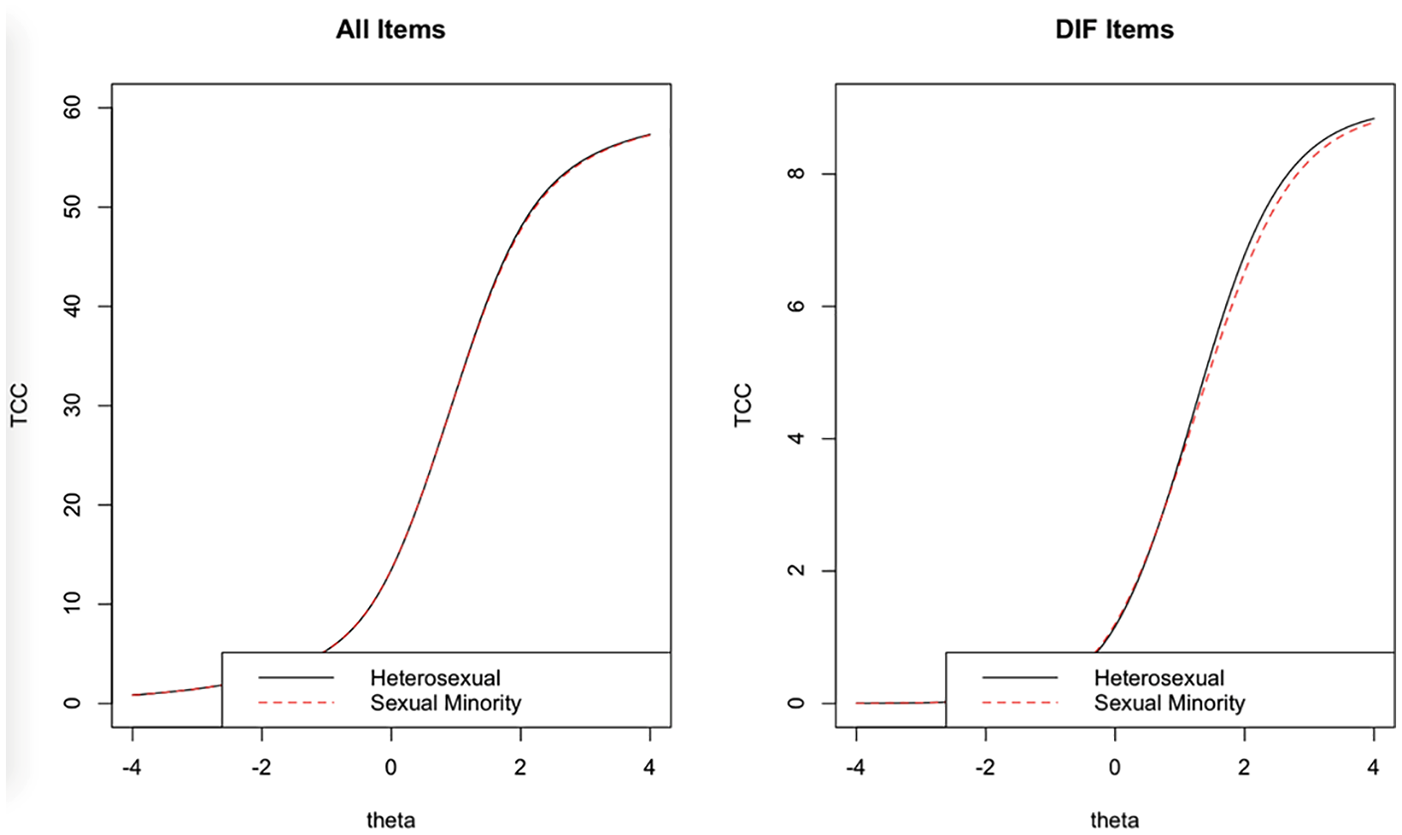
Test characteristic curves by sexual orientation.
The highest Monte Carlo simulation–derived empirical threshold from DIF-free samples was McFadden ΔR2 = .0046 for uniform DIF. The empirical threshold for nonuniform DIF was also McFadden ΔR2 = .0046. According to these empirical thresholds, Items 16 (ΔR2 = .0052) and 19 (ΔR2 = .0050) exhibited uniform DIF. Only Item 2 (ΔR2 = .0050) exhibited nonuniform DIF. The Monte Carlo threshold for the beta change was 0.1662. No items met this threshold by sexual orientation.
Discussion
This study examined DIF of the CES-D (Radloff, 1977) by HIV status and sexual orientation. Based on past research and theory (Gay et al., 2016; Meyer, 2003; Valentine & Shipherd, 2018), it was hypothesized that DIF would be present by sexual orientation and HIV status. This hypothesis was only partially supported; DIF was found for sexual orientation in the two items of the Interpersonal factor and for HIV status in three items of the Positive Affect factor, which suggests that these items may be interpreted differently by different populations, leading to bias in scores and limited meaningful comparison between groups. However, the level of DIF found is negligible in magnitude (Jodoin & Gierl, 2001). This supports the conclusion that the CES-D may be somewhat invariant given that it achieved invariance at the configural and metric levels.
As anticipated, sexual orientation was associated with uniform DIF for the two items from the Interpersonal factor, “People were unfriendly” and “I felt like people disliked me.” In contrast with previous research, sexual minorities were less likely to endorse these items than heterosexual individuals. The same effect in the Interpersonal factor has also been noted in other stigmatized populations, particularly in Black African American individuals (Gay et al., 2016; Kim, Chiriboga, & Jang, 2009), suggesting that these items may be related to other constructs, such as experiences of discrimination and rejection from others (Perreira, Deeb-Sosa, Harris, & Bollen, 2005). In the present study, most of the participants who did not belong to a sexual minority group identified as Black African American or other racial minority (59.7%), whereas more than half of the sexual minority participants were White American (58.1%). It is possible that stigma related to race and ethnicity may have influenced the probability of responding to these items in a greater and more significant way than sexual orientation, leading to a more frequent endorsement by non–sexual minority participants. However, despite exhibiting differential patterns of responding, the total level of DIF was negligible.
In this same line, it is important to note that several stigmatized attributes were present in this sample—that is, sexual orientation, HIV, race, and ethnicity. The intersection and interaction of multiple stigmas can exacerbate their negative impact (Logie et al., 2011) and increase bias in response to items related to interpersonal rejection and discrimination. Even though these results are not conclusive to this respect, they suggest the relevance of continuing to study DIF of CES-D Interpersonal items in highly stigmatized populations in order to promote a reliable use of its scores and a more accurate estimation of depressive symptoms in specific groups. It is also important to highlight that both the hierarchical and bifactor models did not converge in the sexual minority participants, suggesting different factor structures by sexual orientation. This suggests that the total score in the CES-D, rather than separate factors, may be better suited for measuring depressive symptoms among sexual minorities.
Uniform DIF was found for three of the four items of the Positive Affect factor, in the comparison by HIV status. These items (“I felt I was just as good as other people,” “I was happy,” and “I enjoyed life”) were more frequently endorsed by HIV-uninfected individuals. In line with this result, Gay et al. (2016) found DIF for one item of the Positive Affect factor, which was more easily endorsed by people with no AIDS diagnosis. Such differential response may reflect the adverse impact that an HIV diagnosis, stressful and potentially traumatic, can have on the self-concept and on the attitude toward one’s life and future (Park, 2013; Yu, Chen, Ye, Li, & Lin, 2016). However, DIF of these items may also be a result of internal characteristics of the CES-D and not simply a product of characteristics of responding individuals. Previous research has shown that items in the Positive Affect factor were poorly correlated with the rest of the scale and were not useful to discriminate depressed from nondepressed adults with HIV (Schroevers, Sanderman, van Sonderen, & Ranchor, 2000; Stansbury, Ried, & Velozo, 2006). In this sense, some evidence suggests the advantages of removing the Positive Affect items from the scale, as they may be measuring a completely different construct (Stansbury et al., 2006). Tsutsumi et al. (2009) concluded that removal of items with DIF can increase comparability between groups. However, it can also result in loss of useful information. Future research could contribute to clarify the usefulness of maintaining or removing the Positive Affect items for specific populations, such as PLWH.
The present findings have implications for the assessment of the frequency and severity of depressive symptoms in medical and mental health care settings and for research on depression among PLWH and sexual minority populations. In line with the recommendations of Gay et al. (2016), results suggest the importance of testing the clinical cutoffs of the CES-D that are currently employed across populations for diagnosis. Given the presence of DIF across groups, cutoffs established for general population may not apply equivalently for specific subgroups, leading to inaccurate estimations of the presence and severity of depressive symptoms. Therefore, practitioners should be cautious when diagnosing or arriving at conclusions regarding depression on HIV or sexual minority patients using the CES-D scores. In a similar vein, researchers should be particularly careful when comparing the CES-D scores of PLWH with those of other groups. This is particularly relevant since the CES-D is the most widely used measure of depressive symptoms in HIV research (Simoni et al., 2011) and comparisons between HIV-infected and HIV-uninfected individuals are frequent. Consequently, future studies should explore and adjust cutoffs so that they are appropriate for specific groups.
Nonetheless, as noted, it is relevant to highlight that the CES-D reached metric measurement invariance. The levels of DIF found, though significant, were low in magnitude, which support the findings of some level of invariance in this sense, as well. For this reason, this evidence also allows to conclude that as differences across these groups are minimal, the CES-D continues to be a valid measure of depressive symptoms and their severity. Though caution is recommended when comparing depression across these groups, the possibility of comparisons between them are not severely or significantly compromised.
Study limitations should be taken into consideration when interpreting these results. The sample was predominantly male, which may limit the generalizability of the present findings; however, this is generally representative of HIV-infected samples. Nevertheless, it is possible that different results may have been obtained if more women were included. Results regarding sexual minorities may also be limited by the high proportion of individuals living with HIV, which may not be representative of the sexual minority population as a whole. Despite these limitations, original contributions from the present study should be noted. Previous studies have primarily assessed DIF by AIDS diagnosis, but not HIV diagnosis (Gay et al., 2016), and these findings contribute to fill this gap in the literature. In addition, item response theory analyses were used to detect DIF, which has the advantage of being sample independent when there is sufficient heterogeneity in the sample (Hambleton et al., 1991). This ethnically and racially diverse sample contributed to that end, including a significant number of White and Black African Americans, as well as individuals of Hispanic ethnicity.
Conclusions
DIF by sexual orientation and HIV status was found for several items of the CES-D, but these levels of DIF were negligible (Jodoin & Gierl, 2001). Given that it continues to be one of the most widely used measures of the frequency and severity of depressive symptoms, it is important to continue reviewing and improving this measure, especially as depression is a critical variable in HIV, sexual minorities, and mental health research. Depressive symptoms, for instance, are related to poor adherence to treatment and more adverse clinical events, among other negative outcomes for PLWH (Brandt et al., 2015; Mayston et al., 2012). For this reason, it is fundamental that depression be reliably screened and assessed in these populations without the influence of other factors that are unrelated to its measurement.
Footnotes
Declaration of Conflicting Interests
The author(s) declared no potential conflicts of interest with respect to the research, authorship, and/or publication of this article.
Funding
The author(s) disclosed receipt of the following financial support for the research, authorship, and/or publication of this article: This study was funded by the National Institutes of Drug Abuse, National Institutes of Health (Grants Nos. R01DA034589 and R01-DA031201). A part of the article was carried out under a Ford Foundation Fellowship to Violeta J. Rodriguez.