
Abstract
When respondents use different ways to answer rating scale items, they employ so-called response styles that can bias inferences drawn from measurement. To describe the influence of such response styles on the response process, we investigated relations between extreme, acquiescent, and mid response style and response times in three studies using multilevel modeling. On the response level, agreement and midpoint, but not extreme responses were slower. On the person level, response times increased for extreme, but not for acquiescence or mid response style traits. For all three response styles, we found negative cross-level interaction effects, indicating that a response matching the response style trait is faster. The results demonstrate that response styles facilitate the choice of specific category combinations in terms of response speed across a wide range of response style trait levels.
Keywords
Rating scales are often used to measure latent variables such as beliefs, attitudes, or personality traits as they are convenient to apply and evaluate. However, the response to a rating scale item does not only reflect the trait to be measured but also the way a respondent perceives and uses the rating scale. The so-called response styles (Paulhus, 1991) can be regarded as latent traits that describe the respondents’ tendencies to prefer certain types of categories over others irrespective of item content. For example, a bias towards choosing the highest and lowest categories is called extreme response style (ERS), a tendency to generally agree with the item is called acquiescence response style (ARS), and a preference toward the middle category is called mid response style (MRS; see van Vaerenbergh & Thomas, 2013, for a review and definitions of additional response styles).
Response styles seem to be ubiquitous in rating data (e.g., Böckenholt & Meiser, 2017; Eid & Rauber, 2000; Meiser & Machunsky, 2008; Wetzel et al., 2013). Moreover, response styles have been shown to be consistent across different content traits (Weijters et al., 2010b; Wetzel et al., 2013), and to be stable personality characteristics that persist over time (Weijters et al., 2010c; Wetzel et al., 2016). Thus, rating scales do not only capture information on the latent content trait but also on response styles. Such response styles can distort measurement precision (Bolt et al., 2014; Wetzel & Carstensen, 2017), inflate relations between measured variables (Abad et al., 2018; Böckenholt & Meiser, 2017), or bias cross-group comparisons, for example, in cross-cultural research (Bolt et al., 2014; Rollock & Lui, 2016).
Attempts to explain response styles through demographic, personality, and situational variables yielded mixed results. The effects of gender and age on ERS are inconsistent across studies (e.g., Hamilton, 1968; Moors, 2008; van Vaerenbergh & Thomas, 2013; Weijters et al., 2010c), but intelligence, occupational status, and education seem to reduce ERS (e.g., Bolt & Johnson, 2009; Meisenberg & Williams, 2008). On the one hand, ERS increases with certain personality traits, such as intolerance of ambiguity, simplistic thinking, and decisiveness (Naemi et al., 2009), on the other hand, the relation of response styles and the Big Five have been found to be positive, negative, or nonexistent (e.g., Austin et al., 2006; Couch & Keniston, 1960; Grimm & Church, 1999; He & Van De Vijver, 2013; Hibbing et al., 2017; van Dijk et al., 2009; Wetzel & Carstensen, 2017). Situational variables, such as reducing the number of response categories and inducing cognitive load increases the magnitude of ERS and ARS, respectively (Cabooter, 2010; Knowles & Condon, 1999; Weijters et al., 2010a), while at the same time alternative response formats have been shown not only to reduce but also increase response styles (Böckenholt, 2017, Plieninger et al., 2019).
The inconsistent results with respect to personality and situational variables demonstrate how little is still known about response styles as a psychological process. An analysis of response times may be a means to this end: Fekken and Holden (1994) argued that the time respondents take to provide a self-report response is a behavioral representation of the underlying cognitive process. They showed that response times are meaningful indicators for the trait to be measured on a personality test. Since responses are not only indicators of the trait to be measured but also of response styles, the time accompanying the responses should also be an indicator of processes related to content as well as response styles. Knowledge about the cognitive processes that influence response category selection through response styles will help us evaluate the often made claim that response styles are a result of reduced cognitive effort (e.g., Aichholzer, 2013; Krosnick, 1999), and to evaluate the magnitude of impact that response styles have on data quality.
Response Times in Rating Scale Measures
Response times have been used to assess cognitive processes in experimental psychology (e.g., Heck & Erdfelder, 2016) and served as collateral information in item response theory models for ability testing (e.g., van der Linden et al., 2010). However, there is little research investigating response times in personality measurement and even fewer assessing the relationship of response times and response styles.
Response Times in Personality Measurement
Response times have served as an indicator of respondents’ motivation and deliberation in surveys. Fast responses have been associated with low motivation of the respondent (Callegaro et al., 2009), lower validity (Neubauer & Malle, 1997), and poor data quality (Zhang & Conrad, 2013). Furthermore, items that appear later in the survey are responded faster than earlier items and with a lower variability in the responses, which might be an indicator of decreasing motivation of respondents toward the end of the survey (Callegaro et al., 2009; Galesic & Bosnjak, 2009; Wise & DeMars, 2005, 2006; Yan & Tourangeau, 2008). Similarly, while shorter response times are associated with reports of desirable attitudes and behavior, longer response times have been linked to responses that are given more carefully, such as faked responses or the reporting of undesirable attitudes (Andersen & Mayerl, 2017; Dunn et al., 1972; McIntyre, 2011; Neubauer & Malle, 1997; van Hooft & Born, 2012).
Another view on response times links fast responses to high confidence in the rating. Fast responses have been associated with the accessibility of the trait being measured, as respondents whose attitudes were important to them responded faster (Tourangeau et al., 1991). Similarly, fast response times are associated with a high consistency in item responses since respondents take less time to decide for a response option when they are certain about it (Arndt et al., 2017; Germeroth et al., 2015; McIntyre, 2011). In line with that, slow responses are considered to indicate cognitive effort in the response process. When respondents try to find the best answer to the item, response times increase, especially for complicated or ambiguous questions (Bassili & Scott, 1996; Dunn et al., 1972; Hanley, 1965; Rogers, 1973). Similarly, item complexity such as the number of clauses, characters, or cognitive operations required for a response increases response times (Kulas & Stachowski, 2009; Lenzner et al., 2010; Sauer et al., 2011; Yan & Tourangeau, 2008).
In sum, fast responses can have two interpretations: they may indicate a spontaneous response mode, in which respondents demonstrate low motivation and deliberation, but may also indicate confidence in the rating as the optimal response is highly accessible. Slower responses are the result of a careful, effortful or deliberate cognitive process, either due to thought-out decisions or item complexity.
Response Times in Response Style Research
In this research project, we examine the relation between extreme, acquiescent, and mid responding and response times to describe cognitive processes in rating scale usage. Herein, we differentiate between specific responses (e.g., extreme, agree, or mid responses) that are given faster or slower than other responses, and respondents (with different ERS, ARS, or MRS levels) that may respond faster or slower than other respondents across items.
It is important to separate the level of item responses and the level of respondents, because the effects may be different across levels. For example, it might be the case that persons high on ERS are generally faster, but that extreme responses across all respondents are given slower compared to non-extreme responses. Such phenomena are often referred to as Simpson’s paradox or ecological fallacy (e.g., Kievit et al., 2013). For example, “the relation between coffee consumption and neuroticism is positive in each individual, but those individuals who drink more coffee are generally less neurotic” (Borsboom et al., 2009, p. 72). Thus, separating intraindividual and interindividual effects may provide new insights into the nature of response tendencies that have been so far been unobserved.
Effects of Current Responses on Response Times at the Response Level
Regarding the relation of item responses and response times, Casey and Tryon (2001) showed that a majority of participants gave faster responses in the extreme categories than in the neighboring non-extreme category. This result may suggest a negative main effect of extreme responses on response times, but the stability and magnitude of the effect remains unclear.
Agree responses might be related to task complexity and a result of cognitive burden when items are hard to interpret. Agreement to both reversed and non-reversed items occurs with complex rather than easy items and results in higher cognitive demand and longer response times (Hanley, 1965; Rogers, 1973; Swain et al., 2008). In addition, Knowles and Condon (1999) showed in an experimental investigation that under high cognitive load, respondents tended to agree with the items more often. As cognitive load has been associated with longer response times, this effect further supports the hypothesis that agree responses lead to longer response latencies.
Kulas and Stachowski (2009) found that respondents took longest to give a response in the middle category. The authors argued that it is cognitively less demanding to agree or disagree than to choose the midpoint. Especially when respondents cannot decide for a directed response, the choice of the indecisive midpoint may indicate a well evaluated, and therefore cognitively demanding judgment process that becomes visible through response times.
Effects of Response Style Traits on Response Times at the Respondent Level
In contrast to effects at the item response levels, there is little evidence pointing toward directed effects for response style trait levels on response times. Therefore, analyses on the level of the respondent are exploratory. For ERS, there are no studies suggesting any positive or negative effect of ERS trait levels on response times. On the one hand, fast respondents showed higher variability in their responses than slow respondents (Neubauer & Malle, 1997). High variability in the responses is associated with high ERS levels, as the variance in the responses increases when extreme categories are chosen more often which may be indirect evidence that high ERS trait levels reduce response times. On the other hand, Naemi et al. (2009) found no main effect of ERS levels on response times.
For ARS, Mayerl (2013) argued that measured attitudes are stronger influenced by acquiescence when respondents answered in a fast, automatic-spontaneous response mode. The descriptive response times by Knowles and Condon (1999) also indicate lower response times for respondents with high ARS levels than for respondents with low ARS levels.
To our knowledge, there is no literature to build on in order to predict effects of MRS levels on response times.
Interaction Effects Between the Current Response and Response Style Traits on Response Times
Besides main effects of item responses and respondents’ response style traits, interaction effects may occur such that respondents with higher response style traits are faster when they give responses matching their response style trait. For example, a respondent with high ERS trait levels may be faster when giving an extreme response, and slower when giving a non-extreme response.
In terms of ERS, Naemi et al. (2009) showed that the combination of ERS and specific personality traits jointly decrease response times. This pattern speaks in favor of a more complex relation between ERS and response times. In terms of ARS, Knowles and Condon (1999) found an interaction effect in such a way that respondents with high levels of ARS were faster when they agreed than when they disagreed with an item, and faster when they agreed than non-ARS respondents.
For MRS, there is no literature directly pointing toward an interaction effect for MRS and response times. However, response time for choices of the mid response option may be longer for respondents that have weighed the pros and cons of either side of the item, but that do not have a general tendency to prefer the middle category over the other response options. In contrast, respondents with a high MRS trait, using the mid response option abundantly may have faster response times when giving a mid response than respondents with low MRS trait levels (see Kulas & Stachowski, 2009).
Speed–Distance Hypothesis
An important theory that further supports the idea of an interaction effect between response style traits and item responses on response times is the speed–distance hypothesis. It predicts that response times decrease with increasing distance between the trait level of the respondent and item difficulty (Akrami et al., 2007; McIntyre, 2011). Larger distances result in a higher confidence to give a clear-cut response, while smaller distances imply high uncertainty about the item response (see also Ferrando & Lorenzo-Seva, 2007; Ranger & Ortner, 2011, for two item response theory models based on the speed–distance relationship).
Evidence for the speed–distance hypothesis is abundant. For example, Fekken and Holden (1992) show that response times for respondents with high trait levels that agree with the item respond fast, while respondents with high trait levels that disagree with the item respond slowly. Similarly, Casey and Tryon (2001) and McIntyre (2011) argued that pronounced self-schemata guide responses and decrease response times. In contrast, respondents with low trait knowledge or respondents that answer contrary to their self-schemata give slow responses (see also Dunn et al., 1972; Germeroth et al., 2015; Kuiper, 1981). The complex relationship between the trait level, the given response and response times even holds for peer ratings. Fuhrman and Funder (1995) found that high self-ratings were predictive of higher as well as quicker peer ratings; peer ratings were slower when the trait was rated high, but the current item was disagreed with. In short, the speed–distance hypothesis assumes that the more likely a response, the faster it will be given.
Based on the speed–distance hypothesis, we predict that the closer the observed response matches the response style trait, the faster the response will be. For example, a person with high ERS levels will take little time to give an extreme response. In contrast, when deviating from their ERS trait by giving a non-extreme response, the respondent will take more time. This reasoning is also in line with the evidence that, under high confidence, responses are given faster (Germeroth et al., 2015; McIntyre, 2011; Tourangeau et al., 1991) while responses involving high cognitive effort are given slower (e.g., Kulas & Stachowski, 2009; Lenzner et al., 2010; Sauer et al., 2011; Yan & Tourangeau, 2008).
Method
Collecting Response Time Data
In collaboration with three research groups (Fladerer et al., 2019; Pfister, 2018; Plieninger et al., 2019), we recorded response times for each response in three studies. The first study was conducted in the context of a Bachelor thesis (Pfister, 2018) in which we initially investigated the relation between implicit personality measures and response styles in rating scale items with five categories. Large parts of the sample consist of undergraduate university students from social science programs. The second study originated from a collaboration with Plieninger et al. (2019), wherein the authors compared different response formats using six response categories; we collected response times in the Likert condition. The sample was recruited through the nonrepresentative and noncommercial online panel SoSci Survey. The third study consists of responses to 5- and 7-point rating scales on Leadership and Team Collaboration and was conducted in collaboration with Fladerer et al. (2019). In this study, data were collected from employees of dealerships and sales branches in Germany. All three studies were conducted online in one wave and rating scale items were presented on several pages with no more than 14 items presented on a single webpage. Table 1 provides information on the sample characteristics, while Table 2 summarizes the number of items, response options, and scales used in the three studies. The online supplementary material furthermore provides information on item characteristics, such as number of words, syllables, whether the item was negated or reversed, and the items’ content type.
Sample Characteristics.
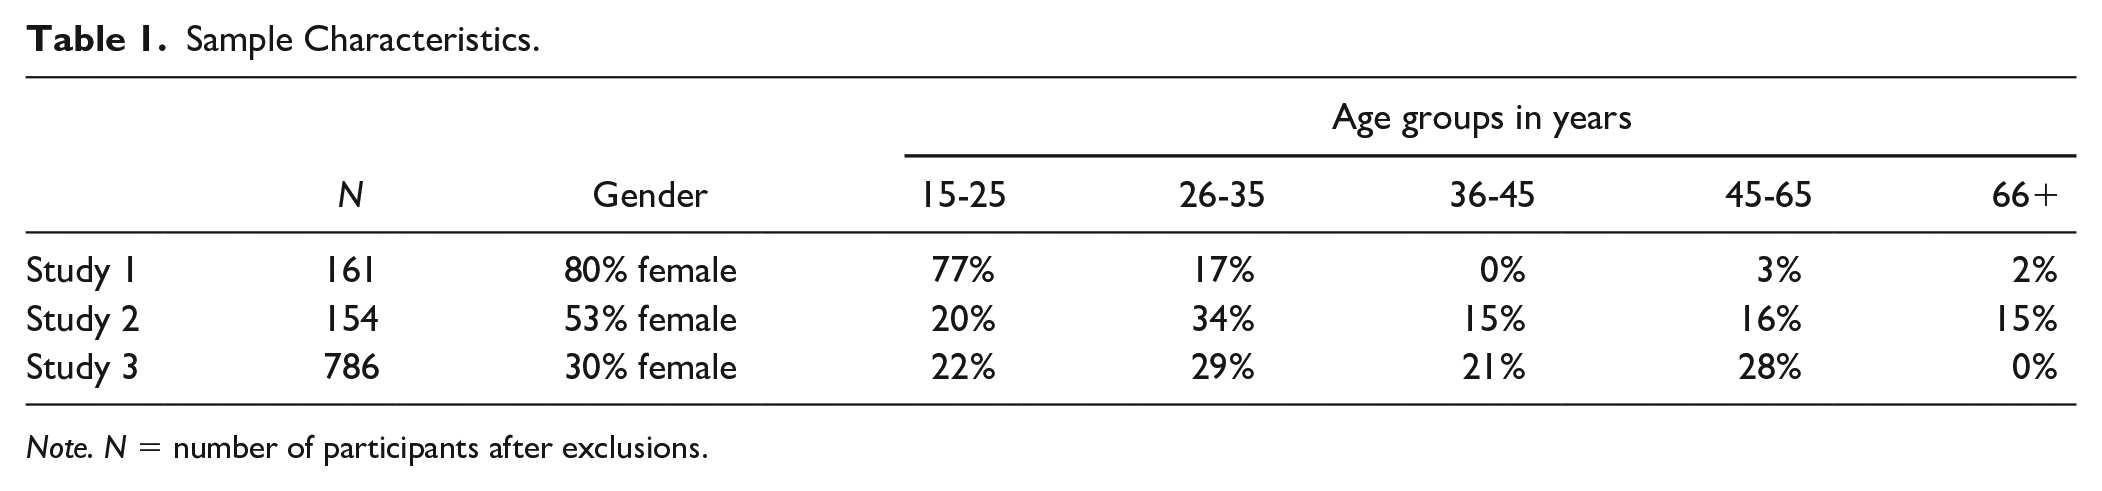
Note. N = number of participants after exclusions.
Overview of the Data Used for Analyses.
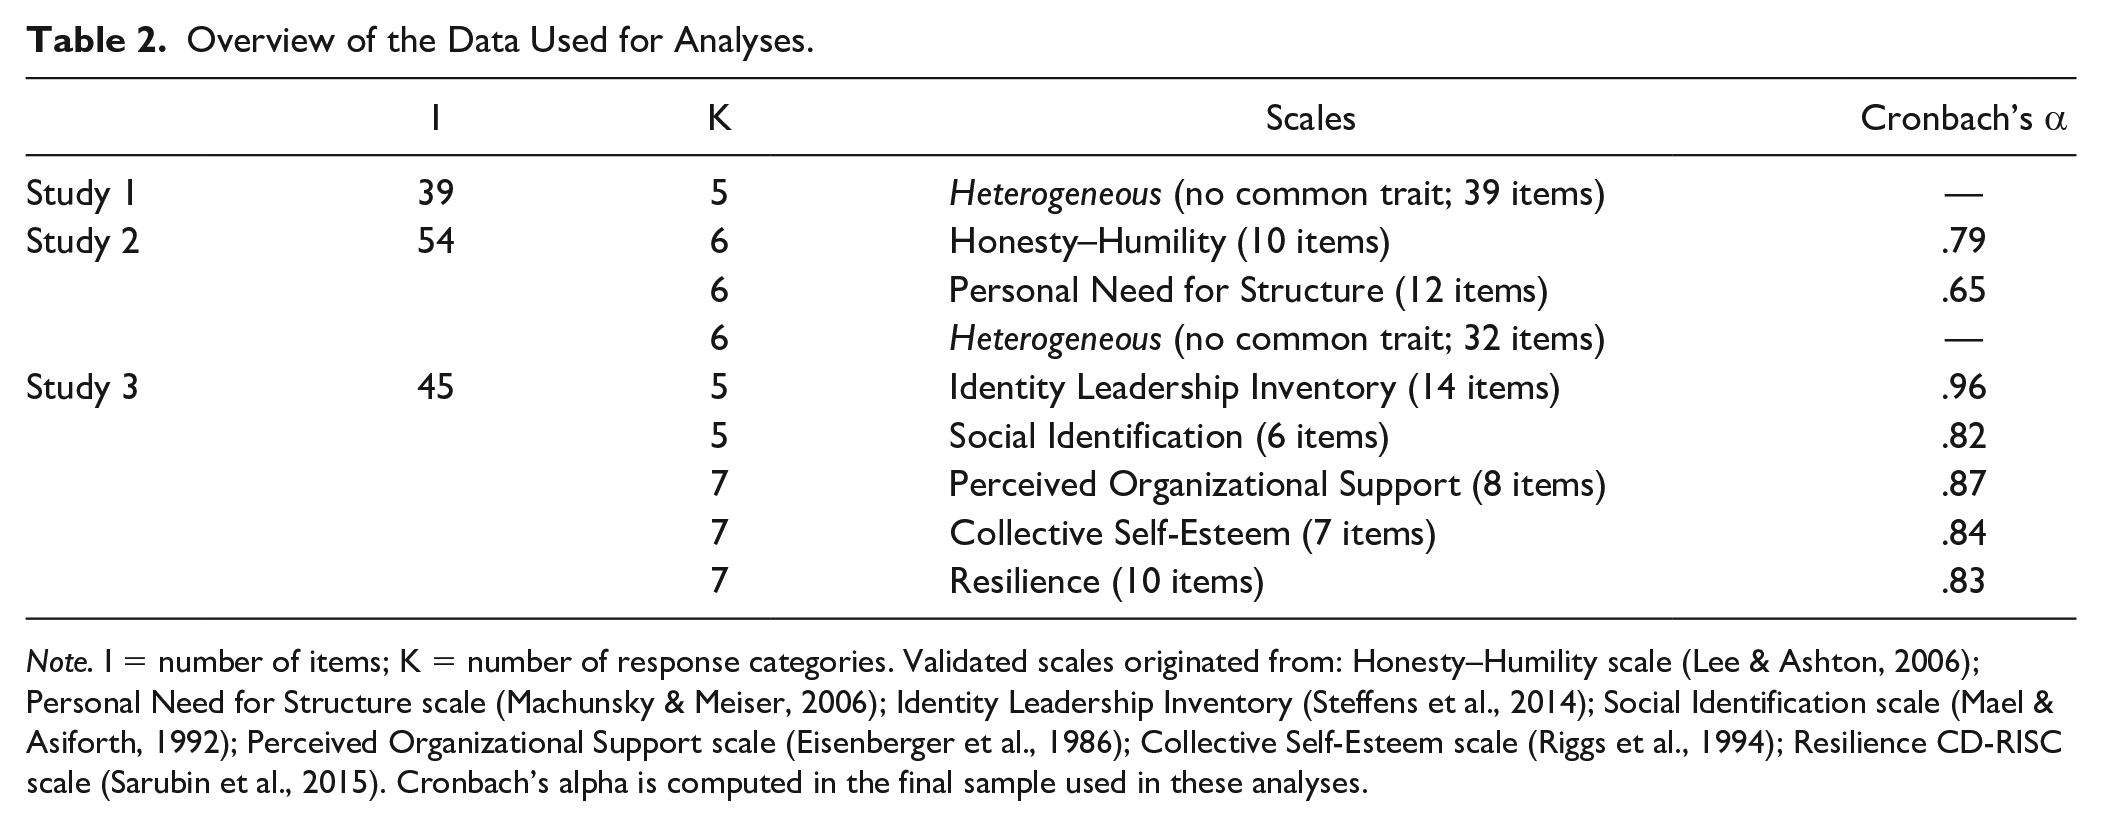
Note. I = number of items; K = number of response categories. Validated scales originated from: Honesty–Humility scale (Lee & Ashton, 2006); Personal Need for Structure scale (Machunsky & Meiser, 2006); Identity Leadership Inventory (Steffens et al., 2014); Social Identification scale (Mael & Asiforth, 1992); Perceived Organizational Support scale (Eisenberger et al., 1986); Collective Self-Esteem scale (Riggs et al., 1994); Resilience CD-RISC scale (Sarubin et al., 2015). Cronbach’s alpha is computed in the final sample used in these analyses.
When planning the three studies, we aimed at validly measuring response styles by using heterogeneous items without a common trait (see De Beuckelaer et al., 2010; Greenleaf, 1992), while at the same time making the study conditions as close to real measurement situations as possible. Thus, we designed three studies accordingly: Study 1 focused on measurement of response styles, therefore only heterogeneous items (i.e., items without a common trait) were selected from various scales (De Beuckelaer et al., 2010; Greenleaf, 1992). Study 2 served as an intermediate step employing heterogeneous items as well as two content trait scales. Study 3 used items of five different, validated scales from organizational psychology to ensure that the results obtained from Study 1 and Study 2 can be generalized to applied measurement situations.
We used JavaScript to track the response as well as the time in milliseconds associated with each mouse click. The response times for a given item was then operationalized as the time difference between the current and the preceding mouse click. For future research or applications, we made the JavaScript code to collect response times available on OSF. 1
Data Preprocessing
Since data were collected online in the three studies, careful attention was paid to retain only valid data. The first two studies contained several validity checks to ensure data quality (e.g., items wherein participants could indicate that, for example, they have been distracted during the study and one Bogus item, see also Meade & Craig, 2012). Based on the validity checks, we excluded 26 and 44 participants in Studies 1 and 2, respectively. In the third study, respondents who answered to at least 30 out of 45 items were included in the analyses.
When participants were directed back to the preceding page because they omitted one or more items, we decided to exclude responses to the initially omitted items from analyses since they may be imprecise with respect to response times when respondents have to reorientate themselves on the survey page (see also Höhne & Schlosser, 2018). 2 As we collected response times for each mouse click, we evaluated whether respondents answered to items more than once. Across all items and respondents, 9% of responses were changed in Study 1, 8% in Study 2, and 6% in Study 3. Assuming that a spontaneous response was the best indicator of the underlying response process, we used the initial response to an item in cases where participants later modified their response.
Response Times
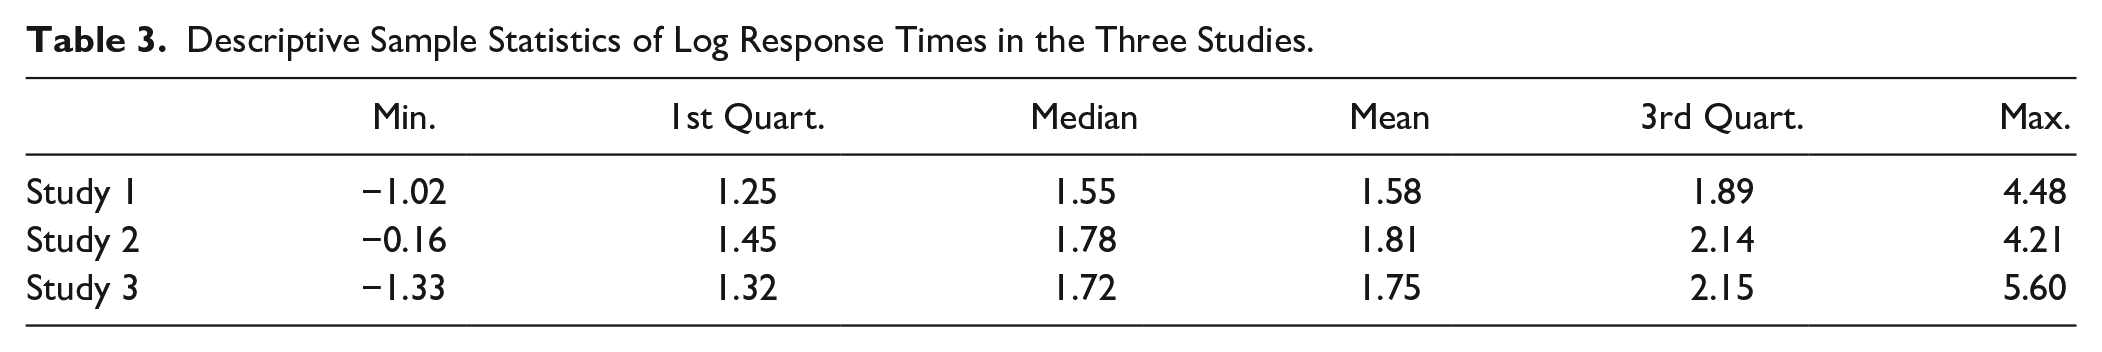
Based on a Box–Cox transformation test, we log transformed response times to obtain a normal distribution of the response time variable. Assuming that very slow and very fast responses may not be the result of a valid response process, we excluded responses that deviated ±2 standard deviation from the individual respondent’s mean response time (a common approach in response time analyses, see Bassili & Fletcher, 1991; Mayerl & Urban, 2008; Mulligan et al., 2003). Through this procedure, 302 out of 6,268 responses (4.8%) in Study; 1,358 out of 8,279 responses (4.3%) in Study 2; and 1,739 out of 34,854 responses (5.0%) in Study 3 were excluded which led to an approximately normal distribution of log response times on the sample level. Table 3 shows the descriptive sample statistics of log response times in the three data sets.
Descriptive Sample Statistics of Log Response Times in the Three Studies.
Response Style Indicators
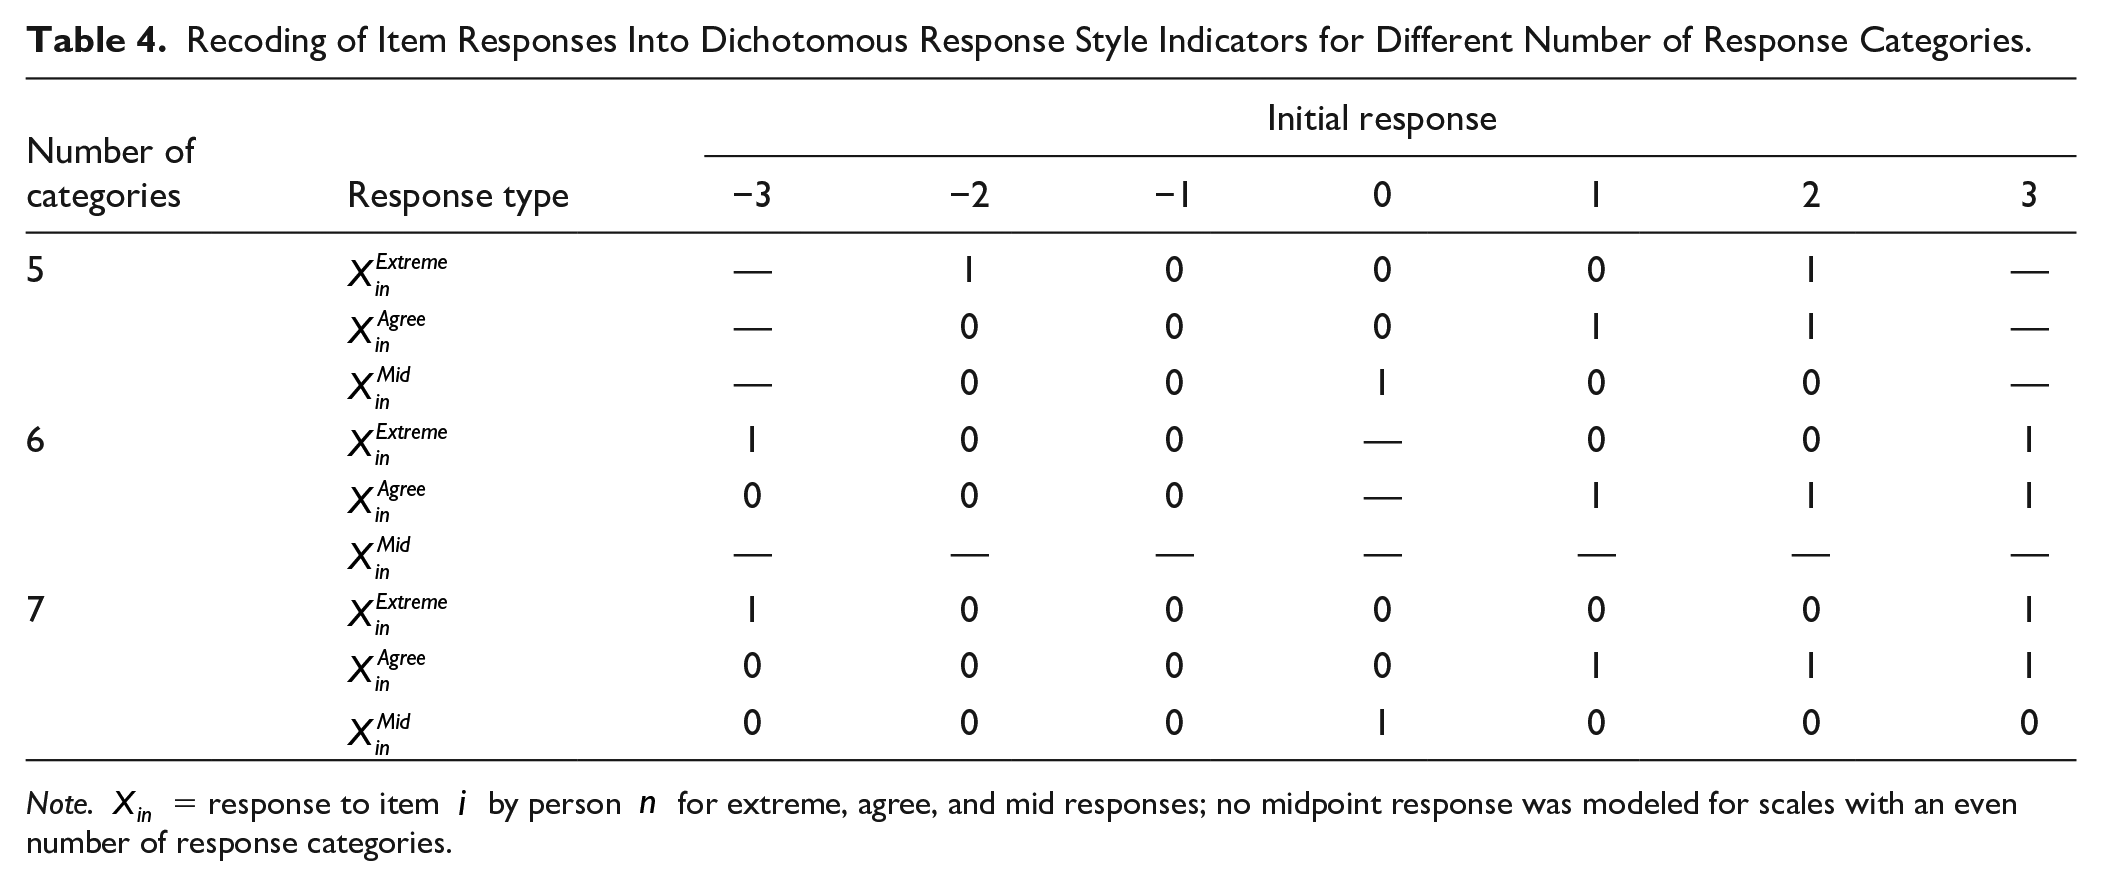
We recoded item responses to obtain dichotomous response style indicators (see De Beuckelaer et al., 2010; Greenleaf, 1992; Wetzel & Carstensen, 2017). For extreme responses, a response was coded 1 if it was in either one of the two extreme categories and 0 otherwise. For agreement responses, responses in the agreement categories (i.e., categories above the midpoint) were coded 1 and 0 otherwise. A response was coded a midpoint response with value 1, if the midpoint was chosen and 0 otherwise; midpoint responses were not defined in case of a scale with an even number of categories. Table 4 gives an overview of the scoring rules for scales with different numbers of response categories.
Recoding of Item Responses Into Dichotomous Response Style Indicators for Different Number of Response Categories.
Note.
Multilevel Modeling Approach
We used a multilevel modeling approach to predict individual log response times based on responses of respondent n to item i using item responses (Level 1), respondents’ response styles (Level 2) and their cross-level interaction as predictor variables.
On Level 1 (response level), we used three dichotomous variables (
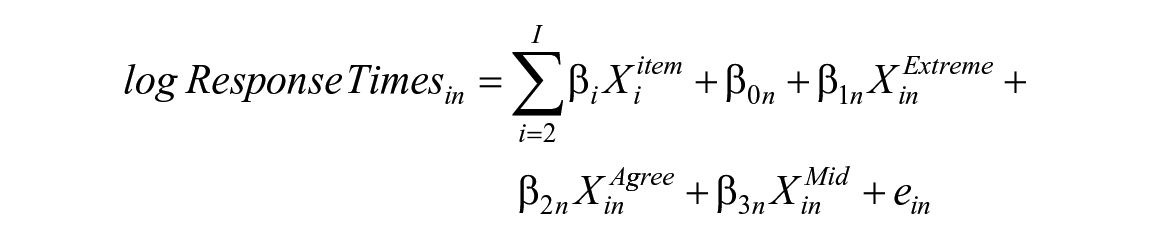
Level 2 (respondent level) variables were trait scores of response styles ERS, ARS, and MRS
On Level 2, we specified a random intercept for respondents to account for differences in response times between respondents. We defined the parameters of the random intercept as a function of the latent response style traits

Besides, we defined varying slope parameters


The resulting joint model equation is thus given by:
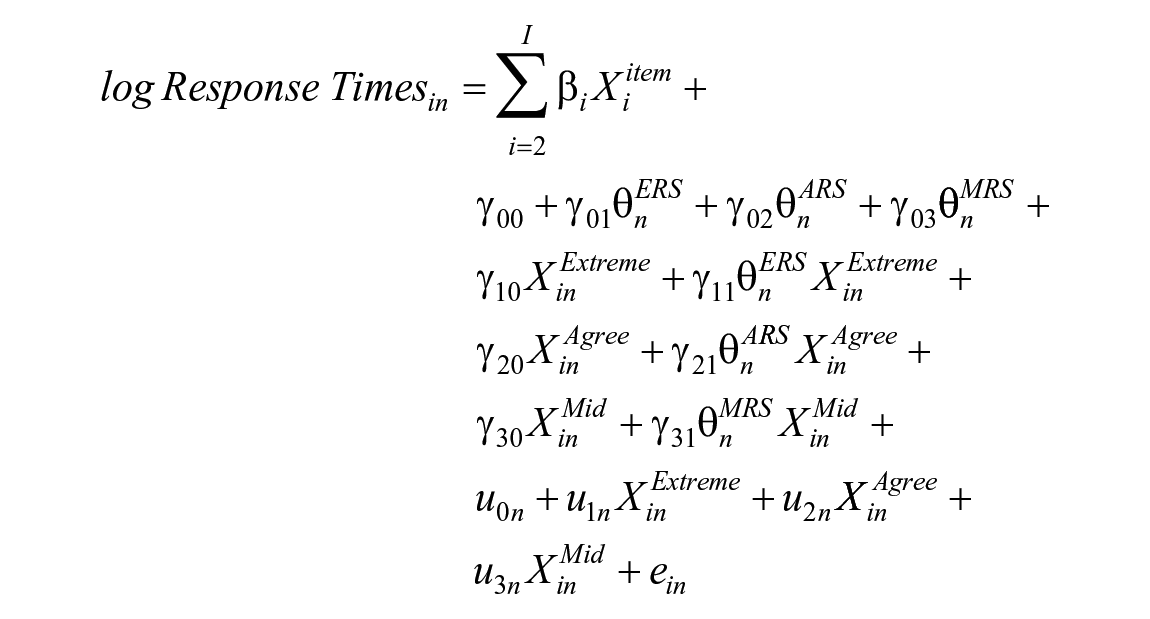
In summary, the model captures differences in response times due to simple interindividual differences (via
All analyses were conducted using R (R Core Team, 2019) with Mplus Automation (Hallquist & Wiley, 2018) using Mplus version 7.4 (Muthén & Muthén, 2012) for model fit. 4 Mplus code for model fit is provided on OSF. We set the level of significance to α = .05.
Results
Figure 1 and Table 5 provide the estimates of the multilevel analysis for the three data sets. Since response times were log-transformed, the exponential of the estimate (x) is interpreted as a proportional change (
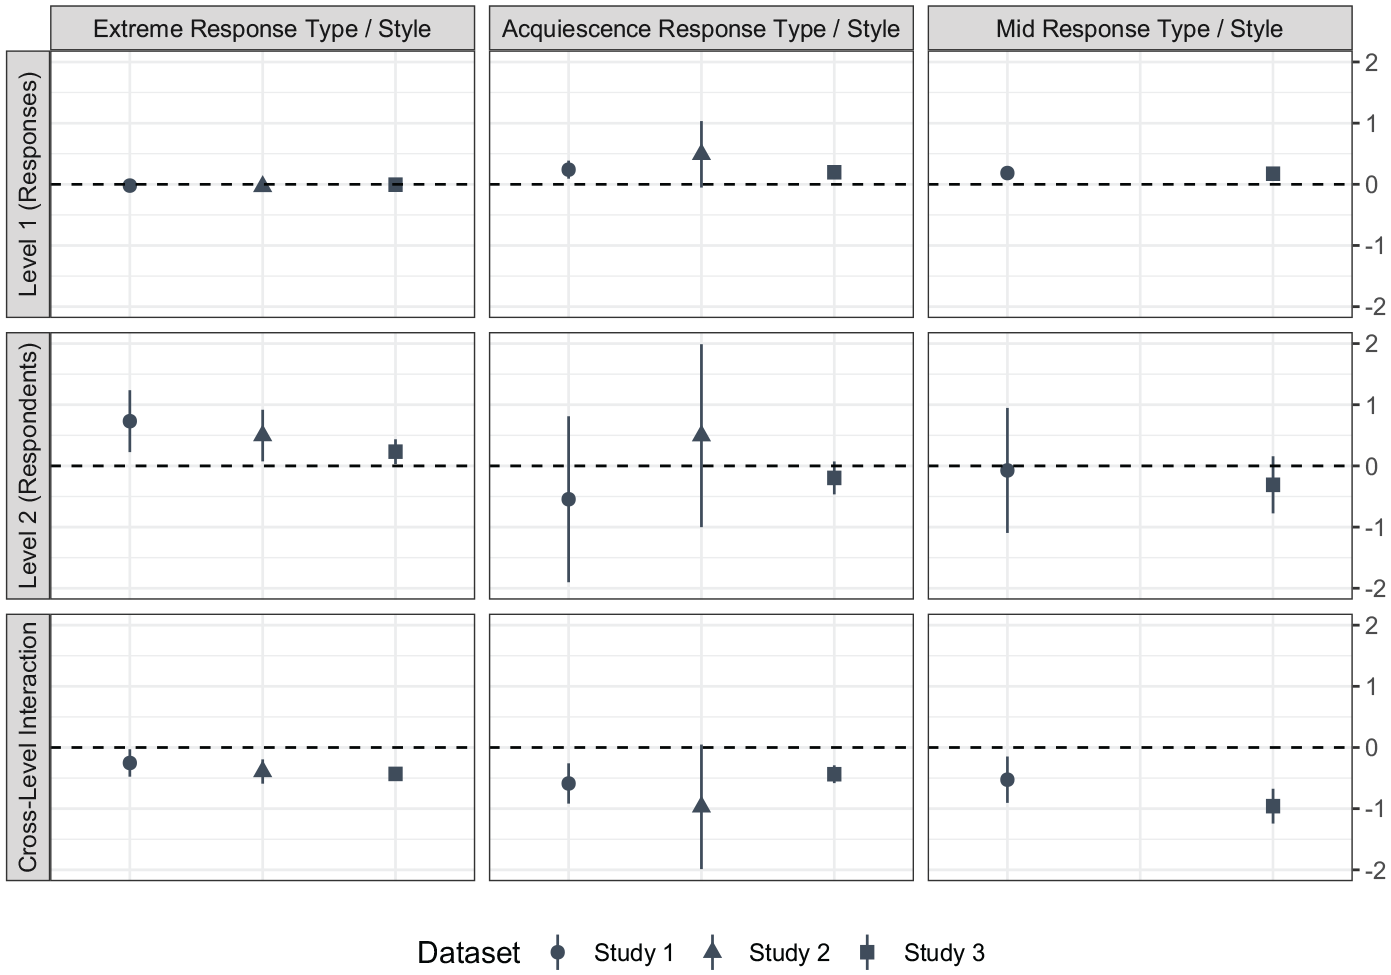
Fixed effects estimates of the multilevel analysis (error bars reflect 95% confidence intervals).
Summary of Multilevel Model Estimates Predicting Log Response Times.
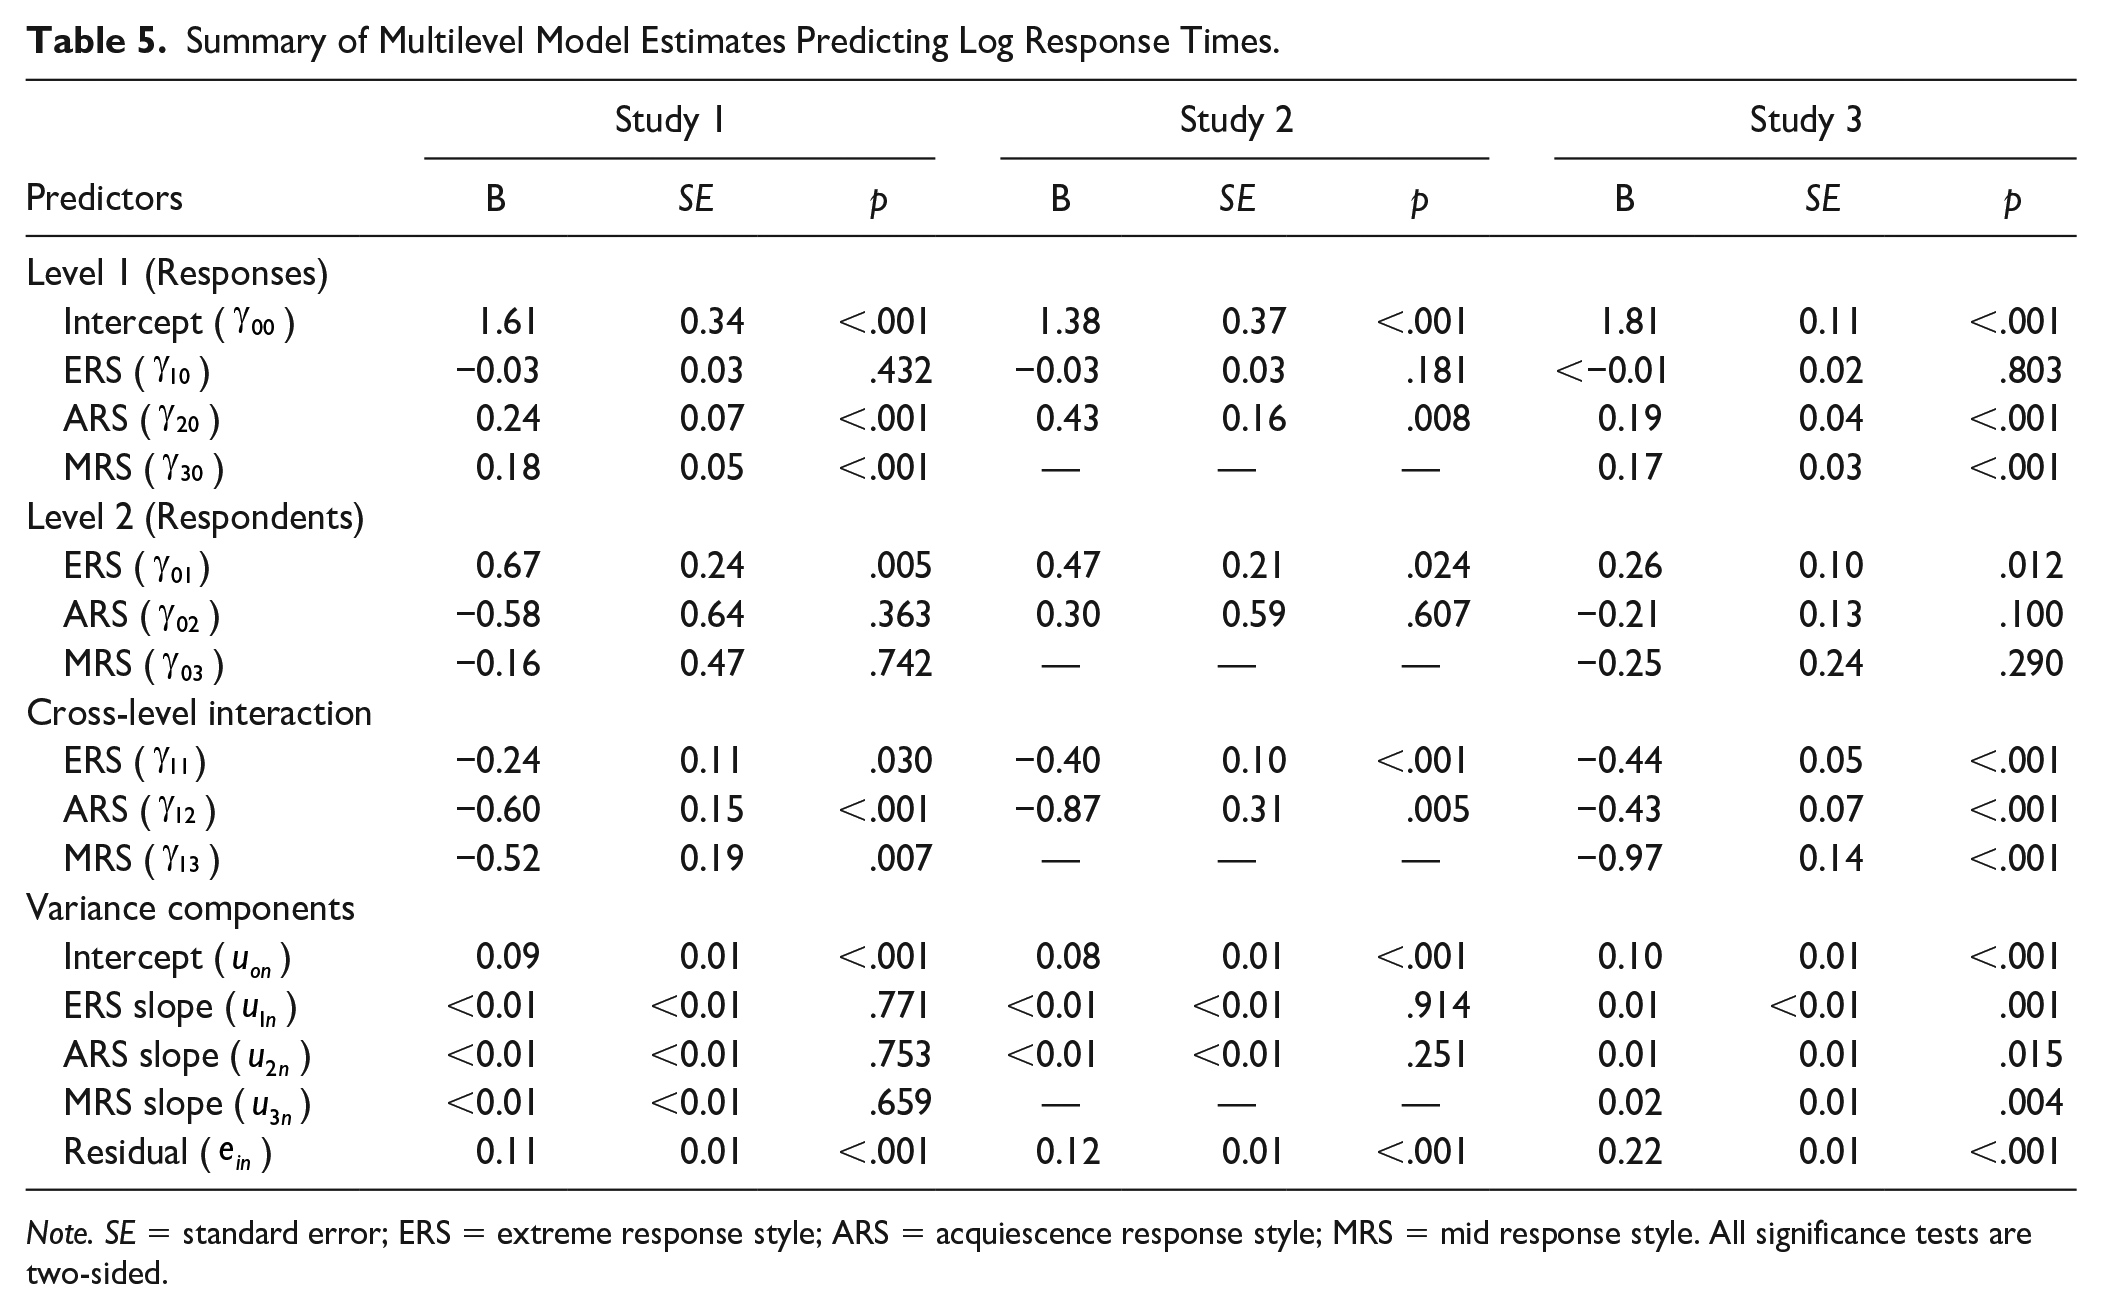
Note. SE = standard error; ERS = extreme response style; ARS = acquiescence response style; MRS = mid response style. All significance tests are two-sided.
On Level 1, agree and mid responses significantly increased response times (Hypotheses 1b and 1c), while there is a null effect for extreme responses (in contrast to Hypothesis 1a). Substantively, giving an agree response
On Level 2, there was a significant positive main effect of respondents’ ERS levels
In all three studies, there was a negative cross-level interaction effect between the type of item responses
Interpreting Interaction Effects With the Johnson–Neyman Technique
The upper rows of Figures 2, 3, and 4 show raw data scatterplots of response times in seconds (minimum inner 80% quantile) and model-based prediction lines as a function of the latent response style aggregate for extreme, agree, and midpoint responding, respectively. Please note that prediction lines are slightly bent due to reconversion of log response times (that are the basis of the linear model) into response times in seconds. In the lower row, Johnson–Neyman plots illustrate the change in the effect of an item response on response times as a function of the latent response style aggregate (see Bauer & Curran, 2005; Preacher et al., 2006, for details on this technique in multilevel models). For example, the Johnson–Neyman technique displays how the effect of giving an extreme response
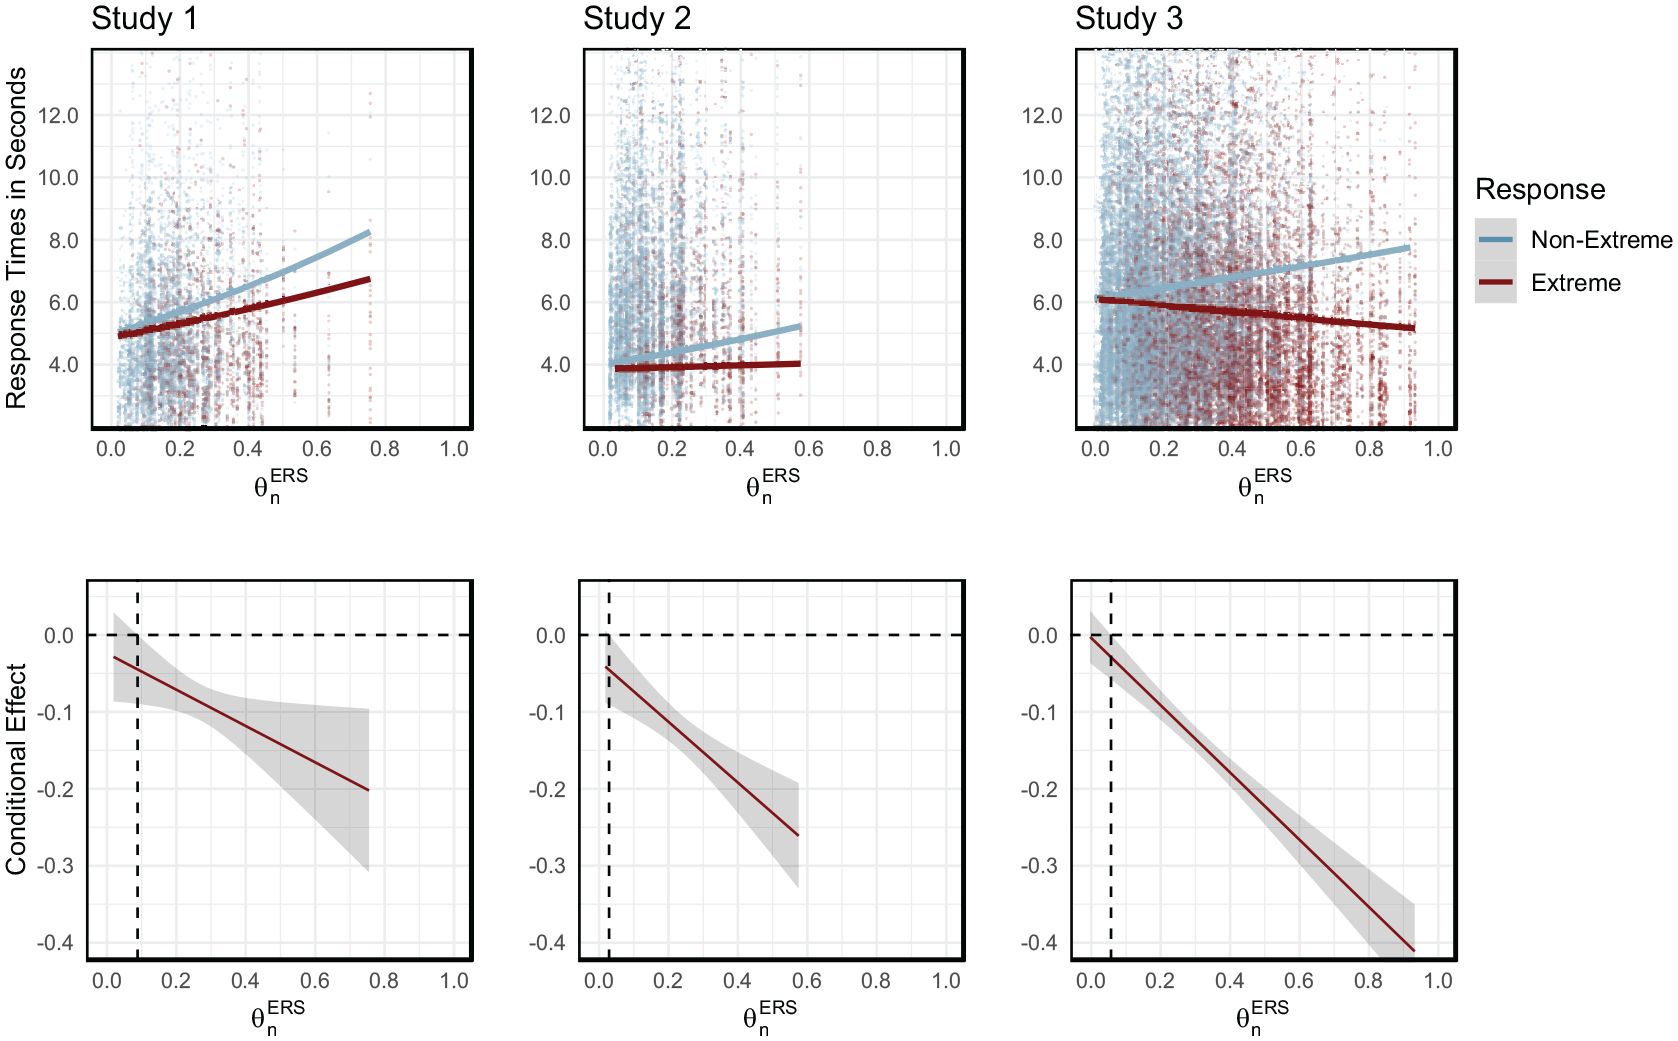
Scatterplots with model-based prediction lines (upper panel) and Johnson–Neyman plots (lower panel) to illustrate the effect of extreme response style (ERS) levels
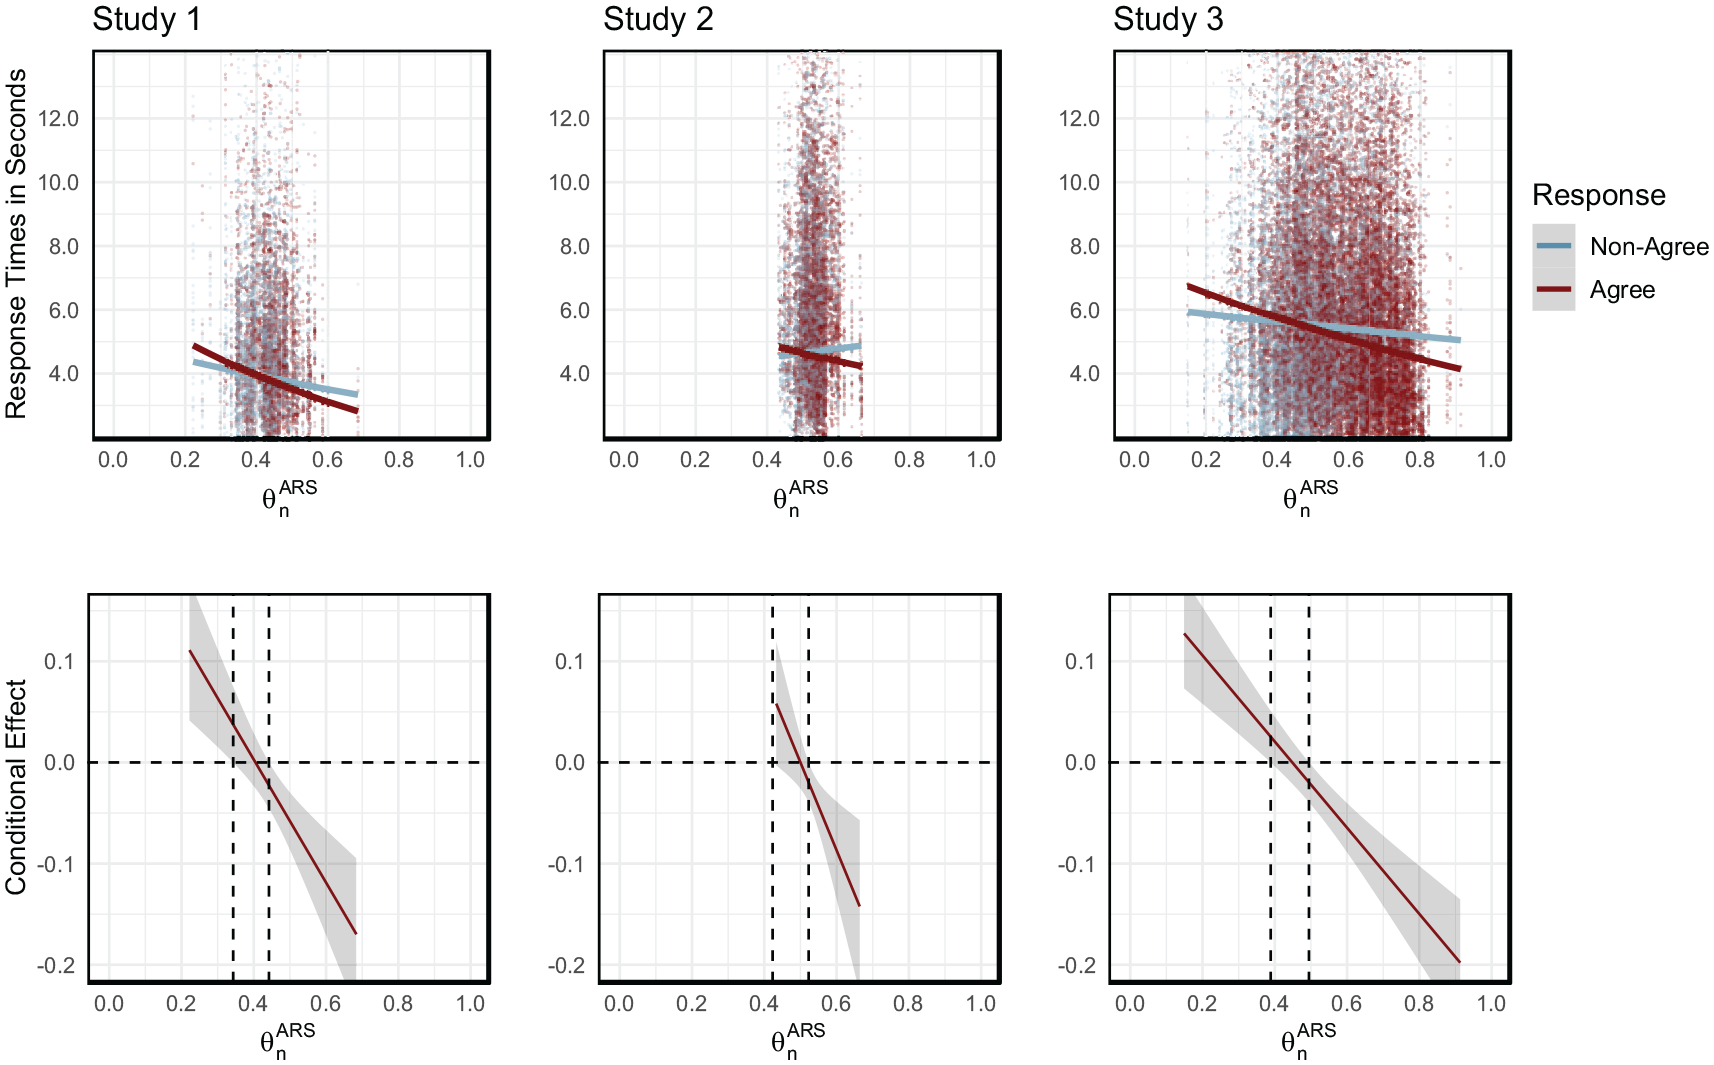
Scatterplots with model-based prediction lines (upper panel) and Johnson–Neyman plots (lower panel) to illustrate the effect of acquiescence response style (ARS) levels
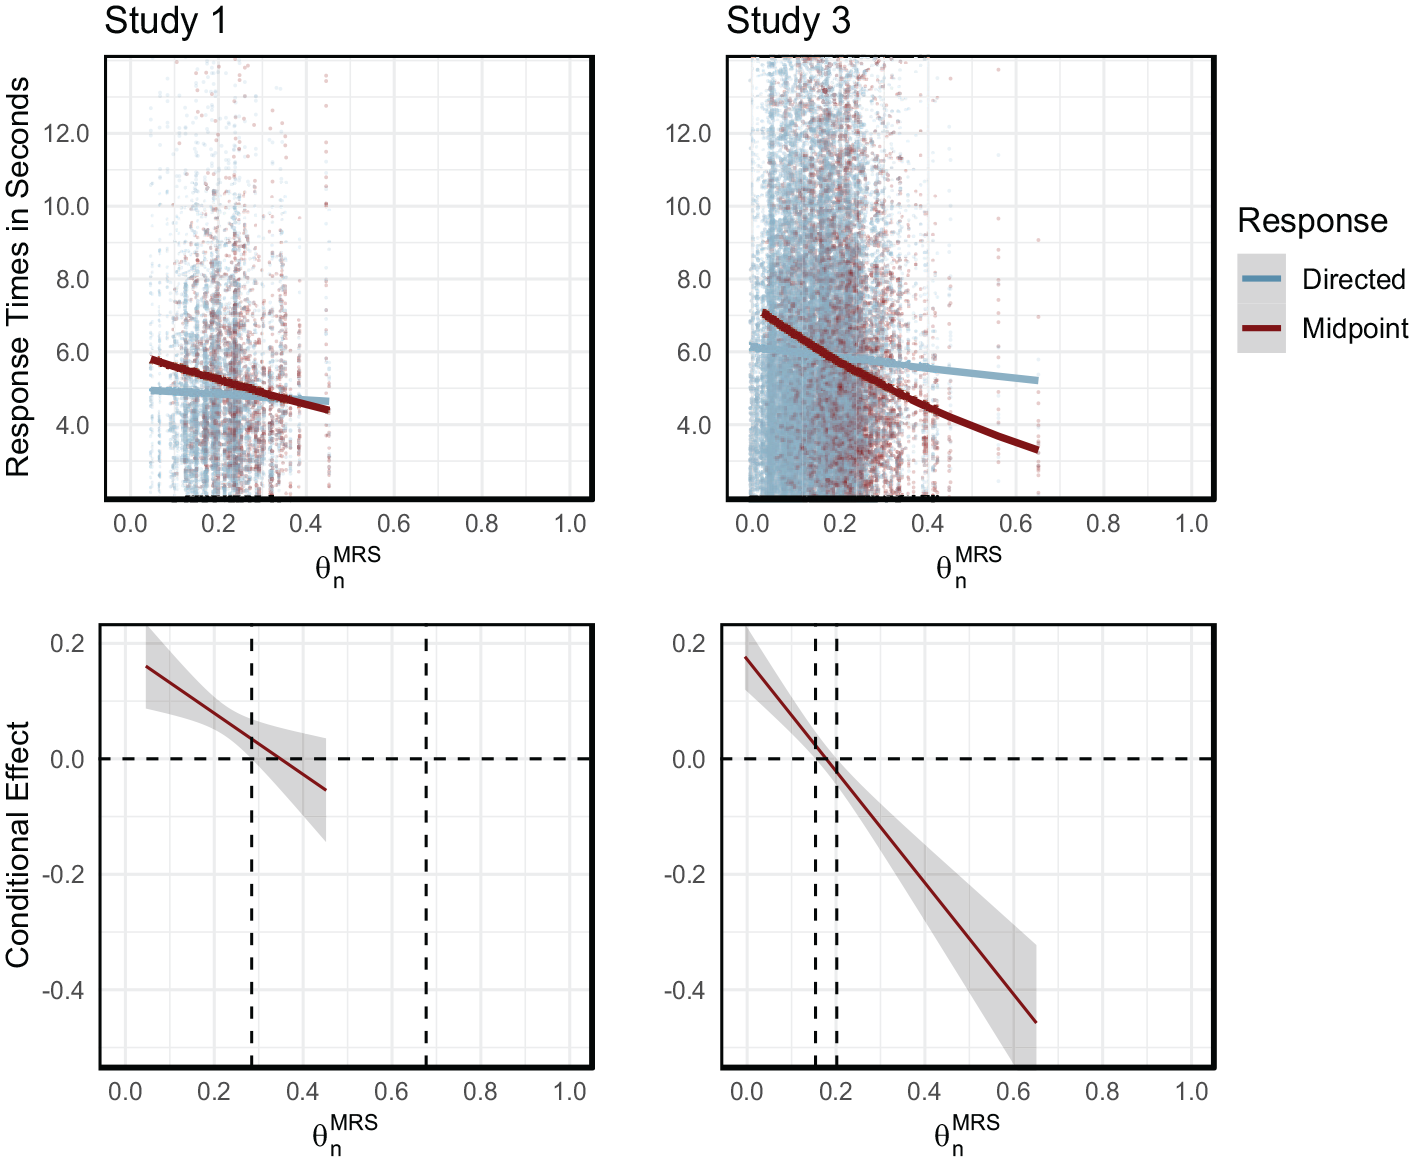
Scatterplots with model-based prediction lines (upper panel) and Johnson–Neyman plots (lower panel) to illustrate the effect of mid response style (MRS) levels
Extreme Response Style
In the upper row of Figure 2, the positive Level 2 main effect of
Acquiescence Response Style
Figure 3 illustrates the interaction effect for ARS which followed a disordinal pattern. Hence, for low ARS levels giving an agree response increased response times, while for high ARS levels giving an agree response decreased response times. Across studies, the conditional effect was significantly positive for
Mid Response Style
Figure 4 shows the interaction effect for MRS in the studies with an odd number of response categories. In Study 1, the effect of MRS responses on the effect of MRS latent aggregate on response time was significantly positive for low levels of MRS
Discussion
In this research project, we investigated the effects of extreme, agree, and mid responding on response times. Although response times are frequently used to describe cognitive processes, they have rarely been linked to personality traits or response tendencies. However, response times can provide useful insights into the cognitive processes underlying rating scale usage and the use of response styles. In three different studies, we employed a multilevel modeling approach that allowed us to separate the effect of item responses from respondents’ response styles as intraindividual and interindividual effects may differ from each other. Furthermore, the multilevel model approach allowed us to study the cross-level interaction effect of response types and response styles on response times.
On the level of individual item responses, we investigated the effect of dichotomous indicators of extreme, agree, and mid responses on response times and found consistent main effects across the three studies. In contrast to Hypothesis 1a, there was no difference in response times between extreme and non-extreme responses in any of the data sets which contradicts the results by Casey and Tryon (2001). In accordance with Hypothesis 1b, response times increased when agree responses were given. This is in line with evidence presented by Swain et al. (2008), Hanley (1965), and Rogers (1973) indicating that agree responses might be related to cognitive burden. Similarly, response times increased when a midpoint response was given which is in line with Hypothesis 1c. Hence, choosing the midpoint seems to be a deliberate process where respondent weigh the different alternatives, and choose the midpoint as a final response. The results corroborate findings by Kulas and Stachowski (2009) indicating that the midpoint was the response option with the longest response latency.
On the level of the respondent, we explored the influence of response style traits ERS, ARS, and MRS on response times (Exploratory Analyses 2a-c). In all three data sets, we found a positive main effect of the ERS trait on response times. Thus, the higher the ERS trait, the more time does the respondent take to respond. Particularly when responses are non-extreme, respondents with high ERS levels seem to take more time to respond. No main effects were found for ARS in any of the three data sets contradicting the results by Mayerl (2013) and the descriptive results by Knowles and Condon (1999). Neither did we find a main effect for MRS on the respondent level.
The multilevel analysis used here yielded original evidence for cross-level interactions, hence matching effects of response styles and item responses. As predicted in Hypotheses 3a-c, there were significant negative cross-level interaction effects of item responses and response style traits on response times across all data sets and across all response styles. Thus, giving a response that is in line with the response style trait decreases response times or, stated differently, the response style trait facilitates the choice of certain categories in terms of response speed. The illustration with the Johnson–Neyman technique (Figures 2, 3, and 4) also brought novel insights into the range of response style trait levels
Theoretical Implications
Cognitive Processes Underlying Response Style Usage
The analyses and results of the current investigation show that extreme responding is qualitatively distinct from acquiescent and mid responding and follows a different cognitive process. Based on the visualization of the Johnson–Neyman technique, respondents with moderate and high ERS trait levels take longer to give non-extreme responses (see Figure 2). Furthermore, only at very low ERS trait levels, extreme and non-extreme responses have similar response times. Since overall high ERS trait levels are accompanied by longer response times and, the negative cross-level interaction indicates that respondents with moderate to high ERS levels give non-extreme responses more deliberately, the results do not support the notion that ERS is associated with low cognitive effort of the respondent.
In contrast, acquiescent and mid responding show very similar patterns of response processes. First, on Level 1, we found positive main effects of agree and mid responses, indicating these responses go along with longer response times. Second, there were no main effects of the ARS and MRS traits, indicating that across responses, differences in respondents’ ARS and MRS levels did not explain differences in response times. Third, disordinal interactions were found for acquiescent and mid responding indicating that responses that are in line with the respective response style are faster than responses that contradict the response style.
Knowles and Condon (1999) reported that response times were faster when ARS-respondents agreed with the item and based their argumentation on a dual-process theory of acquiescence. According to this theory, people either agree with the item instantly without investing any effort, or follow a normal processing route including comprehension, reconsideration, and decision phases that require more time and effort. We were able to replicate the finding by Knowles and Condon for high ARS levels. At the same time, our data showed a similar pattern for respondents with low ARS levels who were faster when they disagreed (see Figure 3 and Figure A1 in Appendix A). This is a clear contradiction to a dual-process theory with a unipolar conceptualization of acquiescence where the absence of acquiescence means moderate responding (Knowles & Condon, 1999; see also Plieninger & Heck, 2018). The results rather suggest a bipolar acquiescence construct where respondents with low levels of acquiescence tend to disagree with the item more easily, while respondents with high levels of acquiescence tend to agree with items independent of item content. The same process seems to hold for MRS: the disordinal cross-level interaction for MRS indicates that mid responses are slower for low MRS levels, and may be faster for high MRS levels compared with directed responses. Hence, we replicated the effect that low MRS trait levels lead to higher response times when giving a midpoint response (Kulas & Stachowski, 2009) and extended this effect by differentiating between areas of significance for different MRS levels (see Figure 4 and Figure A1 in Appendix A).
Speed–Distance Hypothesis
The analyses of response styles and response times have shown that not only personality traits but also response styles follow the speed–distance hypothesis: the more likely a response is for a certain respondent, the faster he or she gives this type of response. The results suggest that the effect on response times is due to a higher confidence in the response when respondents follow their response tendency (i.e., self-schemata) which guides responses and decreases response times (Germeroth et al., 2015; McIntyre, 2011). In contrast, giving a response that is contrary to the respondent’s response style level increases difficulty and therefore leads to longer response times (Dunn et al., 1972; Kuiper, 1981).
The speed–distance hypothesis is a robust theory with precise predictions in many fields besides personality research, for example, with regard to emotion clarity (Arndt et al., 2017), in signal detection theory (Maddox et al., 1998) or value research (Bilsky et al., 2013). With the present investigation, we further extend the application of the speed–distance hypothesis and present evidence for its validity in the area of response styles.
Strengths and Limitations of the Current Analysis
The strength of this study is the comparison of three different data sets that consist of different item types, samples, and response category numbers. The fact that results are highly consistent across the three data sets is even more remarkable given the differences between the data sources. Study 1 only used heterogeneous items that refer to different content domains and therefore is ideal to measure response styles (De Beuckelaer et al., 2010; Greenleaf, 1992). However, the sample size with N = 161 respondents and I = 39 items is sufficient, but not abundant. Since Study 2 combined items of two personality scales with heterogeneous items, it is well suited to measure response styles, while at the same time being generalizable to applied settings on the basis of the two personality scales. However, as a six-category scale was used, MRS cannot be measured in this study. Study 3 contained homogeneous items assessing five different traits from organizational psychology. Since intercorrelations between items were moderate (mean absolute correlation: r = .23 in contrast to r = .11 in Studies 1 and 2), response styles can be measured across the different content scales (see also Wetzel & Carstensen, 2017, for a discussion on response style measurement across scales). Study 3 demonstrates that the results obtained in Study 1 and Study 2 are generalizable to applied measurement contexts. Besides the applied context in which the study was conducted, the main advantages of this data set is the large sample size, the high variances of response style traits, and a large power. Overall, the high consistency of effects between these different data sources underpins the results’ robustness, stability, and generalizability.
At first sight, Figures 3 and 4 indicate a restricted range of observed ARS and MRS trait levels. However, the observed variances are comparable to values reported in the literatures, where ERS variance is typically largest (see, e.g., Böckenholt, 2012; Böckenholt & Meiser, 2017; Plieninger, 2017; Plieninger & Heck, 2018). Furthermore, ARS levels close to 0 or 1 would indicate 0 or 100%, respectively, agree responses which is extremely unlikely. With respect to the response style correlations, the observed values indicate certain relationships that are comparable with other studies. In more detail, ERS and ARS had zero to moderately positive correlations (Study 1:
The positive main effect that respondents with high ERS levels take more time to respond is a result of an exploratory study and contradicts previous assumptions and findings in the literature (Aichholzer, 2013; Casey & Tryon, 2001; Krosnick, 1999). The result suggests that high ERS levels may be associated with an increased rather than decreased cognitive effort, but more studies are necessary to test and corroborate this effect.
A major challenge when analyzing response times is the noise that is inherent in the data (Fazio, 1990; Lo & Andrews, 2015; Ratcliff, 1993). With our multilevel modeling approach, we were able to separate variance components in response times that are due to specific responses (Level 1), respondents’ response style traits (Level 2) and their cross-level interactions. Before the main analyses, we made several choices to preprocess response time data, such as excluding responses to initially omitted items when respondents where redirected to the survey page, responses correcting previously given responses, and response time outliers. 5 Across all preprocessing steps, we paid careful attention to use procedures that are well embedded in the response times literature connected to rating scale responses (Bassili & Fletcher, 1991; Höhne & Schlosser, 2018; Mayerl & Urban, 2008; Mulligan et al., 2003), and applied the same procedures in all three studies.
In this analysis, response times served as indicators of response processes, for example, of spontaneous or deliberate response modes. However, response times are not pure process measures. When interpreting changes in response times, one must be aware that implications are based on assumptions on the relation of response times and cognitive processes. The relation of response times and cognitive processes are substantiated by evidence in the literature (see, e.g., Lo & Andrews, 2015), but remain presumed associations as processes themselves are always unobserved.
Directions for Future Research
This research project opens up new areas for future research. While we focused on extreme, acquiescent, and mid responding as response tendencies that occur in rating scale measurement, other response biases such as social desirable or careless responding exist (Andersen & Mayerl, 2017; Dunn et al., 1972; Ellingson et al., 2001; Meade & Craig, 2012). These may similarly be analyzed with respect to response times. Besides, other process measures, such as eye-tracking and mouse-tracking or even fMRI and EEG measures, could provide useful insights into cognitive processes in rating scale usage. Similar to response times, these process measurement methods differentiate between spontaneous and deliberate response processes, but may also provide information on the guidance of attention, such as whether respondents reread a question or encounter difficulties in the response mapping process (Franco-Watkins & Johnson, 2011; Kamoen et al., 2011; van Hooft & Born, 2012). fMRI and EEG measures may additionally provide insights into physiological correlates of response speed.
The relation of response styles and response times might inform the measurement of content traits and of response biases. So far, response times inform the measurement of personality traits and increase, for example, test information (Ferrando & Lorenzo-Seva, 2007; Ranger & Ortner, 2011). However, our results show that response times are not only indicators of the cognitive process with regard to the content trait but also with regard to response styles. Thus, response times measure several processes: response processes related to the content of the items as well as processes underlying response style usage. Future research should evaluate the potential to improve measurement of personality variables when incorporating response style as well as response time information.
While our main goal was to describe how response styles manifest themselves in the response process, the findings presented in this article may lead to further investigations providing practical guidance for applied measurement situations. With this regard, response times may be analyzed using data originating from experiments in which certain assessment characteristics are manipulated. For instance, one could vary the number of response categories or present items in random order to assess differences in response style effects on response times in different measurement settings. Furthermore, information on item characteristics (see supplementary material available online) may be used to further examine effects of item features on response times.
Furthermore, we did not only collect response times for each item but also for each mouse click that the respondent made on the survey page. Thus, collecting response times in such a way may provide useful information in test construction and item selection. Response time data of this kind allows one to evaluate whether responses to specific items were changed more often, or whether reversed-coded items are difficult to process cognitively. Furthermore, changing a given response may be an indicator of high deliberation and motivation of the respondent with regard to the survey. Hence, future research could evaluate whether such correction of responses may be negatively related to careless responding (Meade & Craig, 2012).
Conclusion
Our analyses have shown that agree and midpoint responding follow a joint cognitive process that is qualitatively different from extreme responding: respondents need more time to give agree and midpoint, but not extreme, responses and respondents with high ERS traits take more time to respond, while this is not the case for respondents with high ARS and MRS traits. However, extreme, acquiescent, and midpoint response styles accelerate response times when the given response is in line with the latent response style trait. This finding indicates that when respondents follow their response styles, their self-schemata guide and therewith accelerate item responses as proposed by the speed–distance hypothesis. Our analyses suggest that every respondent employs some type of response tendency when reacting to a rating scale and that the area of a “neutral” response is actually quite small. The joint result of our studies may furthermore guide future developments in designing testing situations to improve psychological assessment.
Supplemental Material
Supplementary_material – Supplemental material for Different Styles, Different Times: How Response Times Can Inform Our Knowledge About the Response Process in Rating Scale Measurement
Supplemental material, Supplementary_material for Different Styles, Different Times: How Response Times Can Inform Our Knowledge About the Response Process in Rating Scale Measurement by Mirka Henninger and Hansjörg Plieninger in Assessment
Supplemental Material
table_supplement – Supplemental material for Different Styles, Different Times: How Response Times Can Inform Our Knowledge About the Response Process in Rating Scale Measurement
Supplemental material, table_supplement for Different Styles, Different Times: How Response Times Can Inform Our Knowledge About the Response Process in Rating Scale Measurement by Mirka Henninger and Hansjörg Plieninger in Assessment
Footnotes
Appendix A
Acknowledgements
The authors thank Miriam Pfister, Martin Fladerer, and Louisa Misterek for their collaboration in collecting response time data and Thorsten Meiser for helpful comments on earlier versions of this manuscript.
Declaration of Conflicting Interests
The author(s) declared no potential conflicts of interest with respect to the research, authorship, and/or publication of this article.
Funding
The author(s) disclosed receipt of the following financial support for the research, authorship, and/or publication of this article: This work was supported by the University of Mannheim’s Graduate School of Economic and Social Sciences funded by the German Research Foundation (DFG).
Supplemental Material
Supplemental material for this article is available online.