
Abstract
The Tower of London (TOL) is a well-known, widely used task that captures executive function abilities. We examined the factorial structure and discriminant validity of three measures extracted from the Delis–Kaplan Executive Function System (D-KEFS) version of the TOL, namely the D-KEFS Tower Test, in 270 individuals from a publicly available release of the Enhanced Nathan Kline Institute—Rockland sample. Confirmatory factor analyses revealed a multidimensional three-factor solution of the measures extracted from the D-KEFS Tower Test; first-move-time, excess moves, and rule violations. This model was better than the unidimensional model, the two-factor model, the bifactor model and the model that included the total achievement scores. These results support the discriminant validity of the three latent factors, over their distinct relations to the total achievement score. The best fitting model was gender-invariant and age-variant. Overall, the multidimensionality of the measures extracted from the D-KEFS Tower Test reflects the need to use multiple metrics from this version of TOL to capture executive functions instead of a single score.
Keywords
The Tower of London (TOL) task was originally developed to measure planning (Shallice, 1982) and was extensively shown to assess planning and inhibition (Jurado & Rosselli, 2007; Phillips et al., 2001). Specifically, the Delis–Kaplan Executive Function System (D-KEFS) version of the TOL test, namely the D-KEFS Tower Test, is considered to tap into spatial planning, rule learning, inhibition, and working memory (Delis et al., 2001).
TOL is a visuospatial, problem-solving task in which the individual transfers disks to recreate a presented disk patent. The original form includes three vertical pegs of different heights and three disks or balls of different colors. The individual is asked to develop a plan in order to recreate the presented disk patent in the minimum number of moves. The goal configuration needs to be completed while following some rules (e.g., you cannot place a larger ball/disk over a smaller one, you can only move one ball/disk at a time, only the topmost ball/disk can be moved, the maximum number of disks on one peg is three). One should note that a number of researchers tend to apply modifications on the original task, that have to do with changes in the physical properties of the task, the type of instructions, the time limit and the availability of cues regarding the minimum number of moves (e.g., Berg & Byrd, 2002).
Different metrics are being extracted in different studies when investigating its structure and relations to other executive function tasks. These metrics may include total moves, first-move-time, execution time, total time, time violations, rule violations, total corrects, and total achievement (Latzman & Markon, 2010). Some of them are more frequently used than others, such as first-move-time and rule violations, though most studies use the total achievement score (e.g., Georgiou et al., 2017). The first-move-time shows the time spent until the participant makes the first move. The rule violations score reflects the number of rules violated by the participant while solving a tower. The total achievement score is a composite score that is calculated based on the accuracy and the total completion time of the towers. The various metrics extracted from the TOL task along with its varying implementation in each study complicate the picture of the factorial structure of the TOL and the executive functions captured by the task in general. The present study will briefly review current findings on the relationship between three measures extracted from the D-KEFS Tower Test, and will examine comparing models of their latent structure.
Regarding the theoretical underpinnings of TOL, Georgiou et al. (2017) suggested that the activity theory (i.e., Leontyev, 1978) can be used to analyze the types of planning captured by the TOL. Based on this theory, planning includes three levels of activity: (1) planning toward own goals and motives as a preplanning activity; (2) action planning, where an individual is engaged in online problem solving; and (3) operational planning, which involves tactics for working towards a solution while considering the task’s constraints and rules. These types of activity were seen to represent the metrics of first-move-time, excess moves made over the minimum number of moves needed for solution, and rule violations, respectively (Georgiou et al., 2017). Some authors differentiate among mental preplanning, as defined by the time an individual spends before doing the first move, and online planning (Ward & Allport, 1997). Others suggested that individuals can mentally plan up to seven moves ahead and that the time which is invested in “preplanning” does not result in quicker moves or fewer moves to solution, thus, considering the time spent up to the first move more as an index of inhibitory control rather than as an indicator of better overall planning ability or preplanning per se (Phillips et al., 2001). Steinberg (2010) also supported that the first-move-time metric reflects difficulties with inhibition (i.e., disinhibition), as it was found to be correlated with self-reported impulsivity. Performance on TOL (e.g., total achievement score) has been associated with visuospatial working memory, as it requires the manipulation of objects in order to develop visual spatial solutions which fit to the given disk arrangement (Gilhooly et al., 2002; Luciana et al., 2009). The aforementioned studies use different TOL implementations for example the version used by Gilhooly et al. (2002) was a five-disk version as proposed by Ward and Allport (1997) and the version used by Luciana et al. (2009) was the Stockings of Cambridge version of TOL which is provided in the Cambridge Neuropsychological Testing Automated Battery (Sahakian & Owen, 1992). It is worth noting that despite the differences between TOL versions, the theoretical underpinnings of TOL largely converge.
Karyotaki et al. (2017) theorized that the TOL test captures visuospatial control, as it addresses the cognitive processes of planning and use of strategies, scheduling and adherence to rules. Specifically, the rule violations metric was suggested to reflect deficits in impulse control and working memory (MacAllister, 2010), while others considered it to capture a general construct of inhibition and self-monitoring (Carey et al., 2008; Culbertson & Zillmer, 1998). Rule violations was the only metric extracted from TOL that was significantly correlated with the executive functions of processing speed, matrix reasoning, perceptual skills, immediate memory, and intelligence (Riccio et al., 2004). The rule violations score was also the only metric in which significant differences were detected between children with attention-deficit/hyperactivity disorder (ADHD), clinical controls, and typically developed peers. Since children with ADHD generally show inhibition deficits, the above study suggests that rule violations can be used to capture inhibition as is manifested in clinical disorders and related to a multitude of cognitive functions. The version of TOL used in the above study was the TOL–Drexel Version (Culbertson & Zillmer, 1998), which includes more difficult items than the standard one proposed by Shallice (1982) and the participant has only one attempt for each item to rearrange a set of beads in order to match the configuration of the desired goal presented by the examiner.
Other lines of research showed the relationship between the TOL metrics and scores from other tasks or psychometric instruments in order to validate the executive functions measured by the task. A study examining the first-move-time as an indication of impulsivity found links between high self-reported psychopathy and reduced time invested in preplanning, as well as reduced adherence to the rules after using an adapted version of the TOL, with four levels of difficulty (three-, four-, five-, and six-move conditions; Bagshaw et al., 2014). The study suggested that responding impulsively when starting the first move is supposed to increase the total number of moves needed to complete the task and may reflect difficulties in evaluating different options and in inhibiting actions that would result in immediate reward. However, this conceptualization has been only partially confirmed previously (Pham et al., 2003) supporting differences between individuals high and low in psychopathy in total execution time and rule violations, but not in planning time (i.e., time up to the first move). The version of TOL used by Pham et al. (2003) was a modified version of the Shallice (1982) task with three types of problems. Georgiou et al. (2017) examined how first-move-time and total achievement score from TOL could be predicted by performance in other already established measures of planning, namely the planned connections, planned codes, and matching numbers from the Cognitive Assessment System which measures operational planning (Naglieri & Das, 1997) and the crack-the-code task which measures action planning (task described in Das & Misra, 2014). The total achievement score loaded on both factors (i.e., the operational planning and the action planning) showing that this score is related to multiple aspects of planning. On the other hand, the first-move-time score is only loaded with the first-move-time of the crack-the-code task. The authors concluded that from a theoretical standpoint, the first-move-time score better discriminates among different planning types compared with the total achievement score. The task used was the TOL-Freiburg version proposed by Kaller et al. (2012) which is a standardized computerized version with four practice trials and 16 test towers that do not allow rule-incongruent moves. In a study investigating the variance of TOL explained by other measures of executive functions, using an adapted version of the standard Shallice (1982) task adding four more towers to the 12 already provided in the task, D’Antuono et al. (2017) showed that inhibition as measured by the Stroop test did not account for a significant variance in performance. Even though the performance on those two tests was negatively correlated, the variance of TOL was significantly explained only by the performance of participants in the Raven 60 (accounted for 29.8% of the TOL variance), which is a measure of visuospatial reasoning and fluid intelligence. Another study that attempted a multivariate prediction of the TOL in adolescents showed that only the digit span performance was a significant predictor of accuracy, after controlling for age and IQ supporting that working memory is needed for the accurate completion of the TOL task (Luciana et al., 2009). Overall, the findings of those studies suggest that using one single score provides limited information about the executive functions captured by TOL. More specifically it seems that using the total score as a single metric limits the ability of the task to discriminate among clinical and nonclinical groups.
Related to the above, Latzman and Markon (2010) suggested that the D-KEFS Tower Test per se does not necessarily reflect only inhibition-related executive functions. The authors showed that the D-KEFS Tower Test can yield at least four factors: disinhibition (from rule violations), impulsivity (from first-move time), visuospatial working memory (from accuracy), and deficits with online planning (from excess moves), however, without examining how discriminative those cognitive aspects are. Previously, Miyake et al. (2000) raised the point that a test can be more or less sensitive for a certain ability without necessarily discriminating a function from the others. A number of studies attempt to predict performance on different TOL versions by calculating the composite scores on TOL measurements and running separate regression analyses having each of the scores as a dependent variable (Jones & Macken, 2015; Unterrainer et al., 2019). This procedure increases the possibility for type I error and underestimates the latent structure of the TOL aspects (G. Byrne et al., 2009). Also, previous studies have used an array of different tests to examine their correlations with various TOL versions, but many of those tests also have an ambiguous factorial structure and not a single construct measured (Jones & Macken, 2015).
The gender and age invariance of the D-KEFS Tower Test and other TOL has not received as much attention in the literature; however, at least two groups attempted to study it. Latzman and Markon (2010) used an unrestricted factor analysis framework to examine invariance on the full D-KEFS battery across three age groups; 8- to 19-year-olds, 20- to 49-year-olds, and 50- to 89-year-olds. Partial invariance was supported and the factor intercorrelations did not change across the three age groups. However, when looking specifically on the D-KEFS Tower Test estimates, the metrics used from the Towers loaded on different latent executive function scores for each age group. The D-KEFS Tower Test scores loaded on an inhibition latent factor only for the 50- to 89-year-olds, whereas no significant loadings were detected for the other two age groups. In another study, Usai et al. (2014) performed invariance analysis and did not show differences in the latent structure of executive function tasks, including the TOL from Shallice (1982), between 5- and 6-year-old children. Debelak et al. (2016) examined the differential item functioning in an adapted TOL-Freiburg version based on age, gender, and educational levels consisting of 24 towers with four-, five-, six-, and seven-move problems. The findings supported that the item difficulty was stable across gender in all combinations except when the groups were formed based on the split criterion using the median age of 42 years, showing significant differences between young and old participants. Age-related item difficulty in the above study seemed to be sample-specific since the split criterion of 42 years of age does not support any specific cognitive theory or any theory regarding item difficulties.
Item difficulty in various TOL versions was suggested to be a factor affecting the construct measured and hence, the reliability estimates as well. It was recognized that larger performance variability can only be detected in towers of higher levels of difficulty that require more moves to be solved (e.g., Kaller et al., 2016; Unterrainer et al., 2019). Hence, the first four towers requiring one to four moves, respectively, are easier and are perfectly solved by almost all participants. First items may require different processes as the participant is developing a strategy to solve problems, thus, later items reflect planning ability better as the strategy used is more stable (Unterrainer et al., 2019). One should note that different versions of TOL have been mainly developed to add towers in order to overcome those problems. For example, the TOL-Freiburg version includes 24 towers requiring four moves and more, in order to compute planning using items of higher difficulty only (Kaller et al., 2016). This has not been the case in the D-KEFS Tower Test version, which only includes even less towers than the originally proposed TOL (Shallice,1982)
In order to fill the gaps left by previous literature, the main aim of the present study is to test the factorial structure of three measures extracted from the D-KEFS Tower Test and the discriminant validity of these parameters as distinct executive function indicators. Other researchers have also supported that the analysis of different metrics from TOL versions can have clinical utility as they will be able to indicate any planning deficits in clinical populations such as ADHD (e.g., Michalec et al., 2017). The use of different scores should be preferred over the use of a single score, given the existence of different versions of the TOL and their scoring systems, the differences in their ability to discriminate between different groups of patients, and the fact that different metrics tap on different executive functions.
As it was discussed in the introduction, some versions of the TOL used towers that required six moves or more to be considered appropriate for the assessment of planning and omitted the first towers that require negligible moves to be completed (e.g., Andrews et al., 2014; Hodgetts & Jones, 2006). Those previous reports will be examined by testing the factorial structure of the Tower Test when including all items and when including only the later towers of higher difficulty. Decisions for exclusion/inclusion of specific towers are based on variation statistics and fit indices. Subsequently, we will test the age and gender invariance of the factor model extracted from the three measures of the D-KEFS Tower Test, since there is limited previous research. Thus, the hypotheses of the present study include (1) the factorial structure of the three measures used will not result in a single factor, as it was shown by prior research and also due to the range of applications that the D-KEFS Tower Test seem to encompass (2) the use of three different measures from the D-KEFS Tower Test will be more informative about the executive functions of the participants compared with using the single total achievement score extracted from that version of TOL, and (3) gender invariance and age variance would be detected in accordance to previous research. Based on previous findings that showed items with higher item difficulty to reflect planning ability with stable strategy (e.g., Unterrainer et al., 2019), we expected that the first items would show low variance due to their negligible difficulty that will in turn result in low loadings. We performed analyses using all items first, in order to validate this decision and compared models using items from all towers with scores from the later towers only.
We proceed to examine the factorial structure of three measures from the D-KEFS Tower Test; rule violations, time of first move, and number of excess moves. The gender and age invariance of the best fitting model was also examined.
Method
Participants
A sample of 270 typical participants were used from the Enhanced Nathan Kline Institute–Rockland (NKI-R) sample, which is part of the Child-Mind Institute Healthy Brain Network initiative (Alexander et al., 2017; Nooner et al., 2012). All approvals regarding research on human subjects were met by the NKI-R (i.e., Nooner et al., 2012) and a detailed description is provided below in the “Procedure” subsection. The age of the participants who were included in the present study ranged from 18 to 85 years (M = 48.0 years, SD = 19.6) and 69.63% (N = 188) of the sample were males. Twenty-five individuals (9.25%) reported their ethnicity as Hispanic or Latino, three (1.11%) individuals reported being American Indian or Native Alaskan, 11 (4.07%) individuals reported being Asian, 43 (15.92%) individuals reported being Black or African American and 189 (70%) individuals reported being White.
Measures
The participants completed the Tower Test from the cognitive battery Delis–Kaplan Executive Function System (D-KEFS; Delis et al., 2001).
The D-KEFS Tower Test includes nine towers using a board with five colored disks varying in size that need to be arrayed in three vertical equal-length pegs and the minimum number of moves starts from 1 for Tower 1 and goes up to 26 for Tower 9. In this study, the participants were asked to arrange the disks on the board in a specific array that matches a stimulus picture (Delis et al., 2001). The instructions given were to move only one disk at a time and never place a larger disk over a smaller one. The first time a participant violates one of the rules, she or he is reminded of the rule, and the disk is returned to its last location. On subsequent violations of the same rule, the participant is simply told that she or he made an error, and the disk is returned to its last location. The first tower is simple to make and requires only a single move. The subsequent eight towers require 2, 3, 4, 7, 9, 13, 20, and 26 moves. Participants are given 30 to 240 seconds to complete each tower, depending on the difficulty level of the tower. The test is discontinued if the examinee is unable to complete three consecutive towers in the allocated time. During the procedure, the examiner records a number of variables, including the time to complete the first move, the time to complete the tower, the total number of moves, whether the tower was completed correctly or not, and the number of rule violations.
The internal consistency coefficients of the D-KEFS Tower Test in previous studies ranged from .43 to .84 in different age groups, and the test–retest reliability for total achievement score for all ages was shown to be moderate (r = .40; Delis et al., 2001). Also, the test was reported to have adequate convergent and discriminant validity and was discriminative of different types of clinical populations, including fetal alcohol exposure (Mattson et al., 1999), and Alzheimer’s disease (Delis et al., 2001).
Procedure
This is a secondary data analysis of a dataset provided by the Nathan Kline Institute using the NKI-Rockland data from Child Mind Institute initiative (http://fcon_1000.projects.nitrc.org/indi/enhanced/recruit.html). The Nathan Kline Institute–Rockland Sample (NKI-RS) is an open-access, community-based sample. NKI-RS accommodates a multitude of behavior-based, demographic, and neuroimaging measures taken from a wide range of individuals recruited from Rockland County in the United States. Ethnic and economic demographics of Rockland County closely resemble that of the United States (Nooner et al., 2012). Zip-code based recruitment was conducted through mail, print advertising, and electronic advertising. A range of cognitive and psychiatric assessments was performed and can be found in detail in the accompanied website (http://fcon_1000.projects.nitrc.org/indi/enhanced/assessments.html). Nearly half of recruited individuals in the total sample met criteria for at least one Diagnostic and Statistical Manual of Mental Disorders, fourth edition–text revision (DSM-IV-TR; American Psychiatric Association, 2000) diagnosis based on a semistructured clinical interview, made by a trained clinician. Recruited participants were excluded from NKI-RS if screening indicated severe psychiatric disorders, severe developmental disorders, current suicidal or homicidal ideation, severe cerebral trauma, severe neurodegenerative disorders (e.g., Parkinson’s disease, Huntington’s disease, dementia), substance dependency issues occurring in the previous 2 years, history of psychiatric hospitalization and current pregnancy. Ethical approval for all components of the NKI-RS study was appointed via the Nathan Kline Institute and Montclair State University. Written informed consent was obtained from all study participants. Written consent and assent was also obtained from minor/child participants and their legal guardian. Participants were reimbursed with a monetary reward that varied between phases of recruitment.
Data Analysis
At first, the data were screened for missing values through missing value analysis, in order to be identified if a percentage more than 5% was missing for each item. Items with zero or extremely low variance were decided to be excluded from any further analyses after examining their univariate skewness and kurtosis and after evaluating their fit indices and loadings. The variance for each of the items is presented graphically in the Supplementary Material (Plots S1-S3) available online.
The first-move-time and rule violations scores were used as derived directly from the task. The excess moves scores were computed by subtracting the minimum number of moves from the number of total moves of the participants. Due to the different metrics used for each of the TOL metrics examined (e.g., reaction time, number of violations), we used the standardized values of the scores in order to have homogeneous metrics to be used across the models under comparison and to correct for normality issues.
Analyses were conducted using AMOS (Version 23.0; Arbuckle, 2014), which is appropriate for confirmatory factor analyses (CFAs), using the Estimate means and Intercepts setting which is appropriate for handling missing data. The estimator used was maximum likelihood (ML) for normally distributed data. To test the robustness of our ML model and because we have changed the data by z-transforming them we performed additional analyses with other estimators. Generalized least squares (GLS) estimator was used to account for nonhomogeneous error variances and bootstrap with 10,000 samples was also performed to account for nonnormality as recommended (B. M. Byrne, 2009, 2013). We also applied Bayesian estimation which accounts that the confidence intervals will not be symmetric about the posterior mean to examine consistency of estimates and standard errors across estimators (B. M. Byrne, 2009, 2013). Finally, we applied robust maximum likelihood estimation (MLR) using the Mplus 7.3 software (Muthén & Muthén, 1998-2012). Model fit was evaluated with the chi-square goodness-of-fit statistic (χ2), the comparative fit index (CFI), the Tucker–Lewis index (TLI), and the root mean square error of approximation (RMSEA). We used suggested benchmarks to determine if models had adequate fit: CFI > .95, TLI > .95, and the RMSEA < .05. The values of CFI > .90, TLI > .90, and RMSEA < .08 were considered satisfactory (Hu & Bentler, 1999). We used the Akaike information criterion (AIC) as an index of parsimony and the expected cross validation index (ECVI) as an index of the ability of the model to generalize. Additionally, where the models were nested, comparison was made by inspecting change in chi square (Δχ2; Bentler & Satorra, 2010). Model parsimony was used for model comparison in cases of nonnested models, as assessed by the AIC and Bayesian information criterion BIC values. Invariance testing was performed using multigroup analysis in AMOS, comparing males with females and three age groups with approximately the same size. The age groups included adults (18-40 years, M = 25.41, SD = 6.048), late adults (41-64 years, M = 52.27, SD = 6.624), and the elderly (65-85 years, M = 72.01, SD = 5.374). Model comparison was based on chi-square change and a model was considered invariant when ΔCFI < .01, as the chi-square difference test is extremely sensitive to sample size, and even modest changes in chi-square can be statistically significant (Kline, 2015). Latent means comparison was also performed if invariance was detected up to the measurement level.
We used the R function ci.reliability from the “MBESS” package to compute reliability statistics of the individual factors and their corresponding items (Kelley, 2019; R Core Team, 2019). We report omega (ω) and its 95% confidence intervals obtained after 1,000 bootstrap samples. These indices have been pointed out numerous times to be the most optimal in examining reliability (e.g., Dunn et al., 2014; Trizano-Hermosilla & Alvarado, 2016). We also report Cronbach’s alpha (α) and its 95% confidence intervals obtained after 1,000 bootstrap samples for ease of comparisons with current and previous literature.
Results
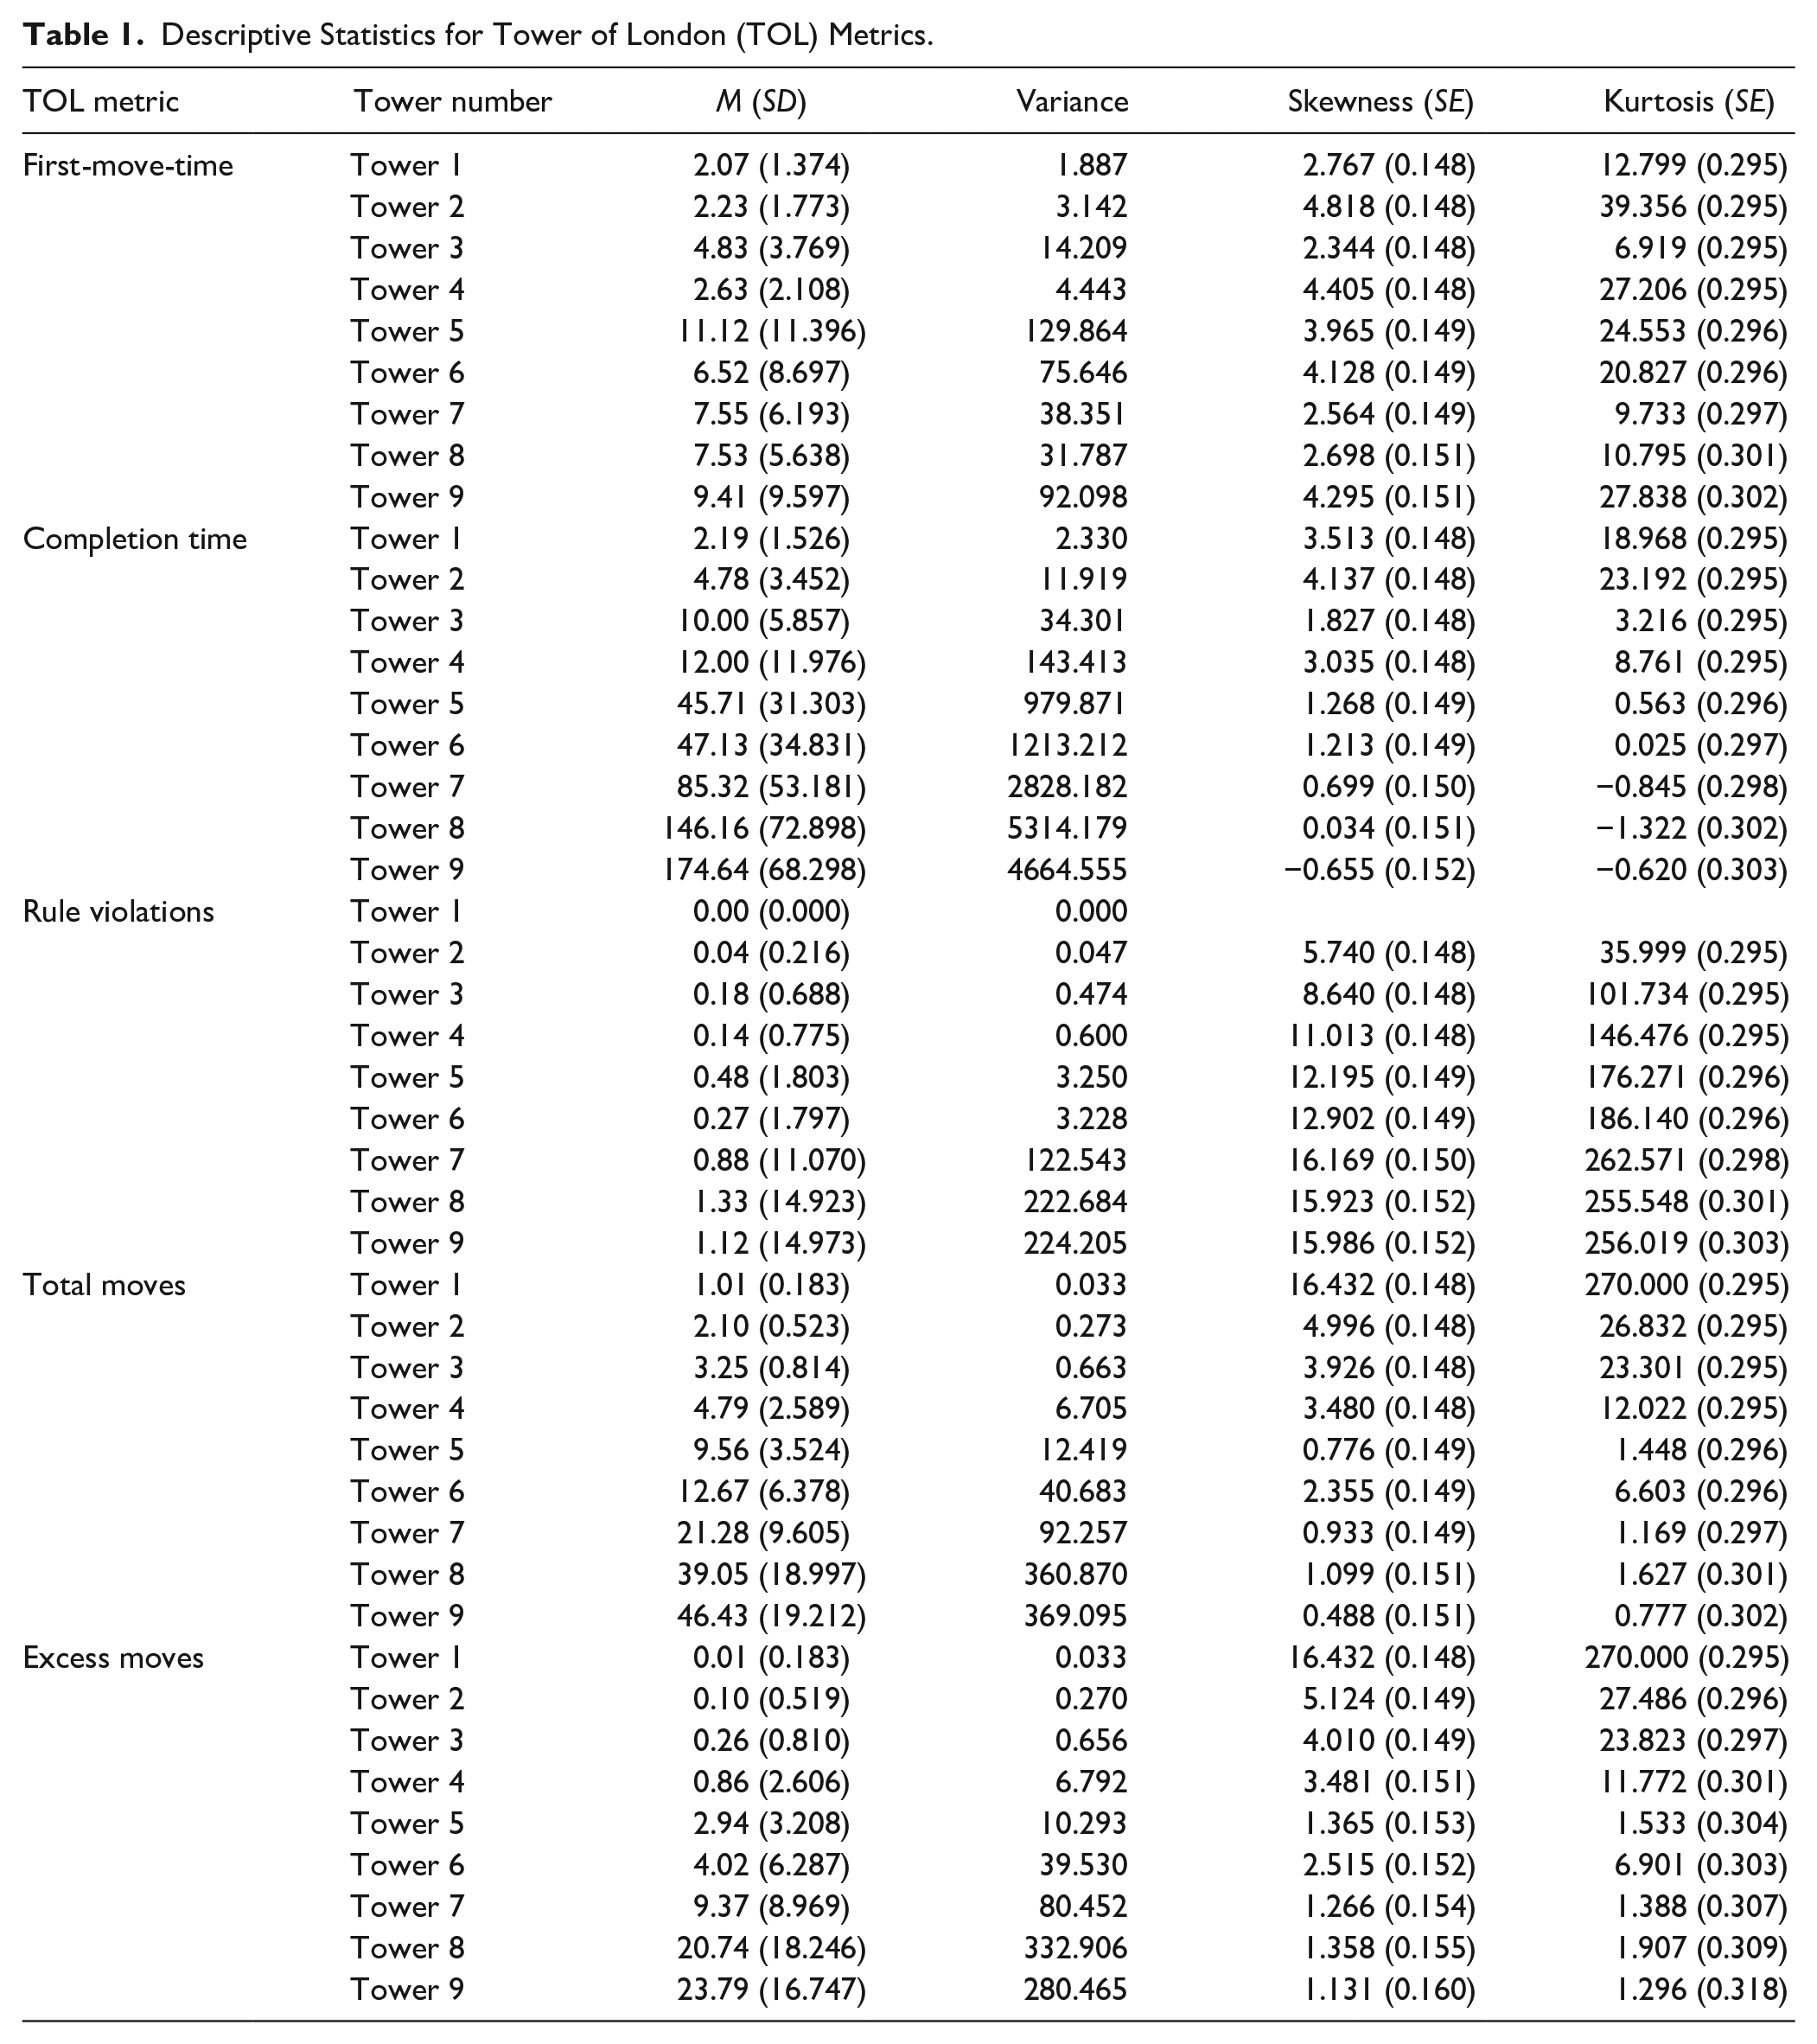
Preliminary analyses showed that the percentage missing did not exceed 2% for any of the items. Because different participants had missing values on different items and because the overall percentage was less than 5%, the missing values were not replaced and all participants were included in the analysis. Next, we tested the models using all towers and examined the ability of the models to reach convergence. The rule violations score of Tower 1 had zero variance, as no violations were made by the participants on this item, presumably since it requires one move to be completed. After excluding the rule violations of Tower 1 the model including all the remaining scores on all measures resulted in a nonacceptable fit, with χ2(296) = 988.446, CFI = .878, TLI = .856, RMSEA = .093 (90% confidence interval [CI] = [0.087, 100]), AIC = 1150.446, BIC = 1168.520. Additionally, examination of multivariate normality suggested a considerably high level of nonnormality, with Mardia’s k = 471.386 (critical ratio = 98.733). The items for rule violations scores did not load significantly on the latent factor “Rule Violations,” and among the items for the excess values only the Items 6 to 9 and Item 3 load significantly on the latent factor. All the first-move-time items loaded significantly on the corresponding latent factor, but examination of the standardized loadings supported that the loadings for the Items 1 to 4 were lower than .45 suggesting unacceptable fit for these items (B. M. Byrne, 2009; Kline, 2015), compared with the loadings for Items 5 to 9 that were much higher. Table 1 presents univariate descriptive statistics for all items used for this initial analysis. We further examined the loadings of these items on each latent factor when tested in separate confirmatory factor analyses. Those are presented in the Supplementary Material (Table S1). Due to the nonpositive definite results of those models, we decided to exclude the scores on all measures from Towers 1 to 4, since those scores had problematic variance (Plots S1-S3 in the Supplementary Material) and/or did not load significantly on the latent factors. More information about the first four towers can be found in the “Discussion” section.
Descriptive Statistics for Tower of London (TOL) Metrics.
For the main analyses, we proceeded to examine the CFA of the different metrics from the D-KEFS Tower Test using the later five towers. The model with the rule violations latent factor had five observed items (one for each of the Towers 5-9) and had acceptable fit based on the criteria of CFI and TLI but not based on the RMSEA, with χ2(5) = 75.117, p < .001, CFI = .982, TLI = .947, RMSEA = .228 (90% CI = [.184, .275]). All items loaded significantly with standardized estimates ranging from b = .902 to b = .999. The exact loadings are presented in the Supplementary Material (see Table S1). The first-move-time scores were used to create a second latent factor. The CFA showed that the model fit was acceptable when using the more relaxed model fit criteria of CFI but was not acceptable based on the TLI and the RMSEA, with χ2(5) = 25.442, p < .001, CFI = .915, TLI = .746, RMSEA = .123 (90% CI = [.078, .173]). All five items had significant estimates on the latent factor that ranged from .416 to .710. The third CFA included the excess moves in each tower as observed variables forming one latent factor. This model resulted in acceptable fit indices when using the more relaxed model fit criteria of CFI and RMSEA but was not acceptable based on the TLI, with χ2(5) = 9.419, p = .093, CFI = .913, TLI = .739, RMSEA = .057 (90% CI = [.000, .113]). All items had significant standardized estimates ranging from b = .169 to b = .577. Examination of the lowest standardized estimates showed that the excess moves observed score of Item 5 did not load significantly on the latent factor. Elimination of this item resulted in a model with acceptable fit based on the CFI and the RMSEA but the fit was still not acceptable based on the TLI, with χ2(2) = 5.164, p = .076, CFI = .934, TLI = .670, RMSEA = .077 (90% CI = [.000, .161]). The standardized estimates ranged from b = .340 to b = .630, supporting that the elimination of the excess moves score of Item 5 resulted in a more reasonable model. However, the difference in chi-square was not significant, with Δχ2(3) = 4.255, p > .05, therefore, the elimination of Item 5 was not retained. Afterward, we examined the factorial structure of the total achievement scores, which is a composite score based on the accuracy and the total completion time of the towers. The model with the observed total achievement scores of the Towers 5 to 9 loading on a latent factor resulted in a model with nonacceptable fit, with χ2(5) = 41.590, p < .001, CFI = .891, TLI = .674, RMSEA = .165 (90% CI = [.121, .213]). Examination of the estimates showed that none of the items had significant estimates on the latent factor of the total achievement. Therefore, the use of the total achievement score was not considered to be valid as a D-KEFS Tower Test measure. The reliability indices of the first-move-time, the excess moves, the rule violations and the total achievement scores are presented in Table 2.
Reliability Analysis of Tower of London Latent Factors Including Later Items.
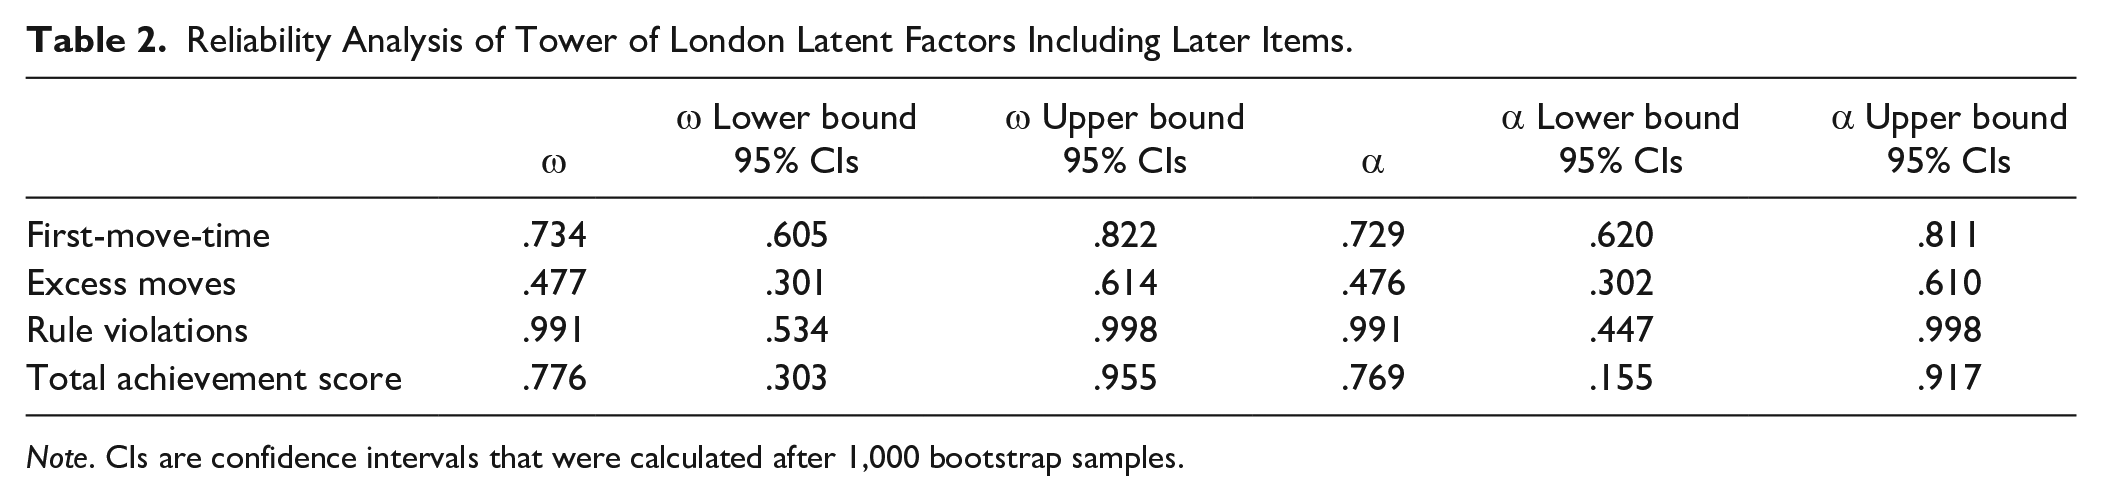
Note. CIs are confidence intervals that were calculated after 1,000 bootstrap samples.
We put the three latent factors stemming from the D-KEFS Tower Test on a single CFA. We examined a three-intercorrelated factors solution at first, which resulted in an acceptable fit, with χ2(87) = 222.060, p < .001, CFI = .969, TLI = .957, RMSEA = .076 (90% CI = [.064, .088]). All item scores had significant estimates loading on the three latent factors. Examination of the correlations between the latent factors showed that the excess moves latent factor was negatively related to first-move-time (r = −.498, p = .031), that is, an early first move was related to a higher number of excess moves. The latent factor of the rule violations was positively related to the first-move-time latent factor (r = .785, p < .001) supporting that a participant who used to begin the first move later was more prone to rule violations. The latent factor for excess moves was not significantly related to rule violations, providing further support that the two measures capture distinct functions. Based on the correlations among the three latent factors, testing a hierarchical second-order model could not be justified, as the correlations among the factors were less than .80 (B. M. Byrne, 2009).
We also examined if the item scores used from the D-KEFS Tower Test could reflect only one factor (all item scores loaded on a single latent factor, see Supplementary Material, Figure S1). The model resulted in a bad fit. It is important to note, that none of the items had significant standardized loading on the single latent factor. The unidimensional model had significantly worse fit compared with the three-correlated factor solution, with Δχ2(3) = 310.72, p < .001. We examined one more model with two latent factors (see Supplementary Material, Figure S2), based on the findings of the high correlation between the latent factors of rule violations and first-move-time (r = .785, p < .001). Therefore, the 10 observed scores were loading on a single latent factor, and the five observed scores of the excess moves were loading on a second factor. The model fit was significantly worse compared with the three-factor solution, with Δχ2(2) = 255.992, p < .001. Additionally, we examined one model that included the latent factor of the total achievement scores, in order to validate the decision taken earlier to exclude the total achievement from the multidimensional solution. The model included four correlated latent factors, stemming from the rule violations, excess moves, first-move times and achievement scores (see Supplementary Material, Figure S3). The model had a nonacceptable fit, further supporting the three-factor solution. Examination of the correlations between the total achievement latent factor and the other three latent factors supported that total achievement had a negative significant correlation with first-move-time (r = −.574, p = .032). That is, higher achievement score was related to beginning to solve the towers early. However, this correlation may reflect an artifact, as total achievement is calculated using the total time spent to solve the item, thus, some component of time is embedded in total achievement. Total achievement did not correlate significantly with excess moves, further supporting the discriminant validity of excess moves. The latent factor of rule violations was strongly correlated with total achievement score with a positive correlation (r = .757, p = .028). The previous findings about the limited significance of considering Towers 1 to 4 as part of the D-KEFS Tower Test measures due to the low difficulty level of these towers, supported the need to consider the impact of the difficulty level of each tower in the model. Therefore, one more model was tested to capture the method effects reflected in the increased difficulty of the towers. A bifactor model was examined, including the multidimensional three-correlated factor model supported as the best fitting model and five method factors capturing each of the five towers (see Supplementary Material, Figure S4). This solution resulted in a good-fitting model, with χ2(62) = 95.613, p < .001, CFI = .992, TLI = .985, RMSEA = .045 (90% CI = [.026, .062]). Conclusions about the best fitting model could not be drawn based on the chi-square and the rest of the fit indices, as the three-correlated factor solution and the bifactor solution were not nested. Therefore, the parsimony indices and the standardized estimates were examined. The parsimony indices provided supported the bifactor solution, as AIC = 241.613, ECVI = .898. However, examination of the estimates supported that none of the items of Towers 6 to 9 could load significantly on the method factors of the bifactor solution. This finding limited the confidence toward the bifactor solution, as the method factors failed to be validated across all towers. Therefore, the multidimensional three-correlated factor solution was kept as the final model (Figure 1). The fit indices of the comparing models are presented in Table 3. As multivariate normality was high even for this model (k = 303.053, critical ratio = 99.294), we also run a Bayesian model (Supplementary Material, Table S2) and tested the consistency of estimates and standard errors using 10,000 bootstrap samples with bias-corrected confidence intervals (Supplementary Material, Table S3). Assessment of model fit using the GLS, which is considered appropriate for handling nonnormal data, supported good fit with χ2(33) = 139.440, GFI = .915, AIC = 205.440, BIC = 317.279. The estimates were found to be consistent among the different estimators and validity of the three formed latent factors was confirmed. Examination of the correlations between the three latent factors using the GLS estimator and ML bootstrap showed that the rule violations and excess moves had now a significant positive correlation, as expected (Supplementary Material, Table S3). This result was significantly different from the final model resulting from the ML estimator, which supported a nonsignificant correlation between the two (see Figure 1). Assessment of the model using the MLR estimator (Supplementary Material, Table S3) showed that the model fit was not acceptable according to the criteria of CFI and TLI but was acceptable based on the RMSEA, with χ2(87) = 159.309, p < .001, CFI = .698, TLI = .636, RMSEA = .063 (90% CI = [.048, .079]). Examination of the SRMR (standardized root mean residual), provided by the Mplus also supported that this criterion was acceptable, with SRMR = .065. Most of the loadings using MLR were consistent with the other estimators with regard to their significance and direction of relationship, though the magnitude was smaller across all loadings when using the MLR estimator. Perhaps this deviance of the fit indices after using the MLR estimator is because it is not recommended for sample sizes with less than 300 participants (Lai, 2018) and generally other estimators are recommended such as the asymptotic distribution free estimator (Narayanan, 2012).

Three-factor structure of Delis–Kaplan Executive Function System Tower of London (D-KEFS TOL).
Fit Indices of the Comparing Models.
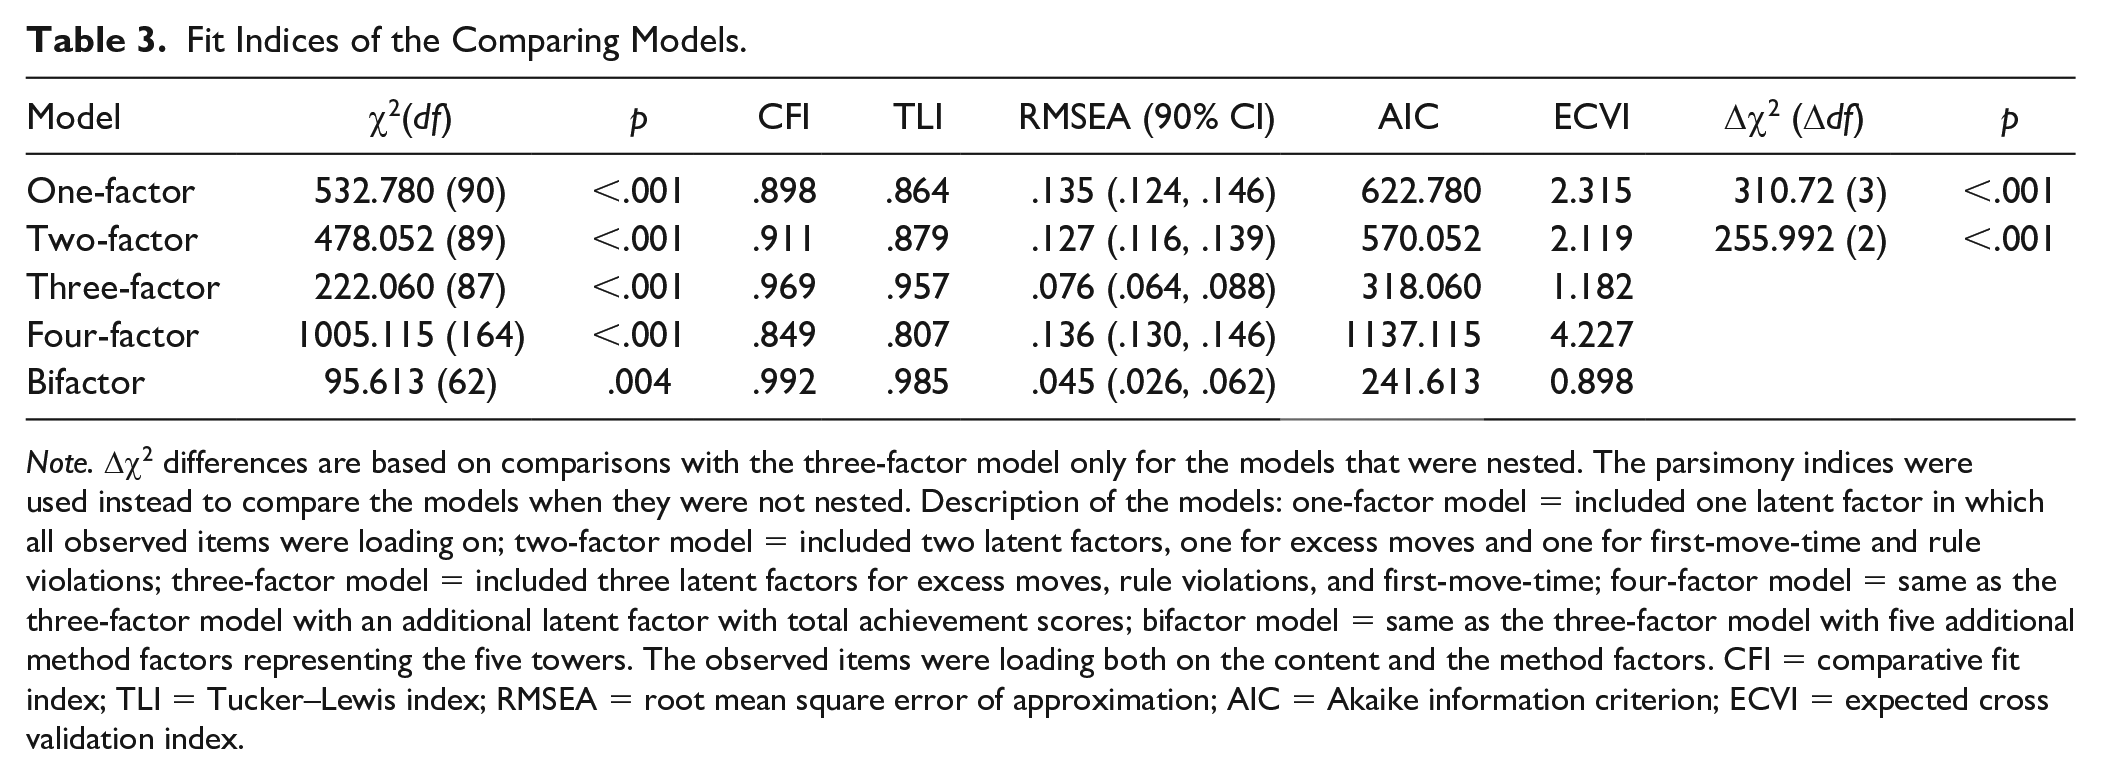
Note. Δχ2 differences are based on comparisons with the three-factor model only for the models that were nested. The parsimony indices were used instead to compare the models when they were not nested. Description of the models: one-factor model = included one latent factor in which all observed items were loading on; two-factor model = included two latent factors, one for excess moves and one for first-move-time and rule violations; three-factor model = included three latent factors for excess moves, rule violations, and first-move-time; four-factor model = same as the three-factor model with an additional latent factor with total achievement scores; bifactor model = same as the three-factor model with five additional method factors representing the five towers. The observed items were loading both on the content and the method factors. CFI = comparative fit index; TLI = Tucker–Lewis index; RMSEA = root mean square error of approximation; AIC = Akaike information criterion; ECVI = expected cross validation index.
Multigroup analyses were performed on the best-fitting three-factor solution in order to examine gender and age invariance. The model was found to be gender invariant, as there was not a significant deterioration of the model fit up to the measurement level model for gender. This allowed a latent means comparison, which supported that males did not have significantly different latent factor scores than females on first-move-time (b = .075, p = .363), on excess moves (b = .026, p = .604) and on rule violations (b = .094, p = .244). The invariance model based on the age groups supported that the model was not invariant for the adult sample (n = 97), the late adult sample (n = 100), and the elderly (n = 73). Further examination of the unconstrained models showed that the estimates on excess moves were significant only for the late adult sample, which was also the subsample with the highest standardized estimates across all the latent factors. The latent means comparison that followed showed that no significant differences on latent scores existed between the late-adulthood group and the rest. When the groups with adults and the elderly were compared, significant differences were noted only on the first-move-time latent scores. The latent mean for the elderly was significantly higher compared with the adult sample (b = .275, p < .001). The latent means were not significantly different for excess moves (b = −.076, p = .121) or for rule violations (b = .003, p = .982). The results of invariance analyses are presented in Table 4.
Multigroup Analyses for the Examination of Invariance Testing and Presentation of the Fit Indices.
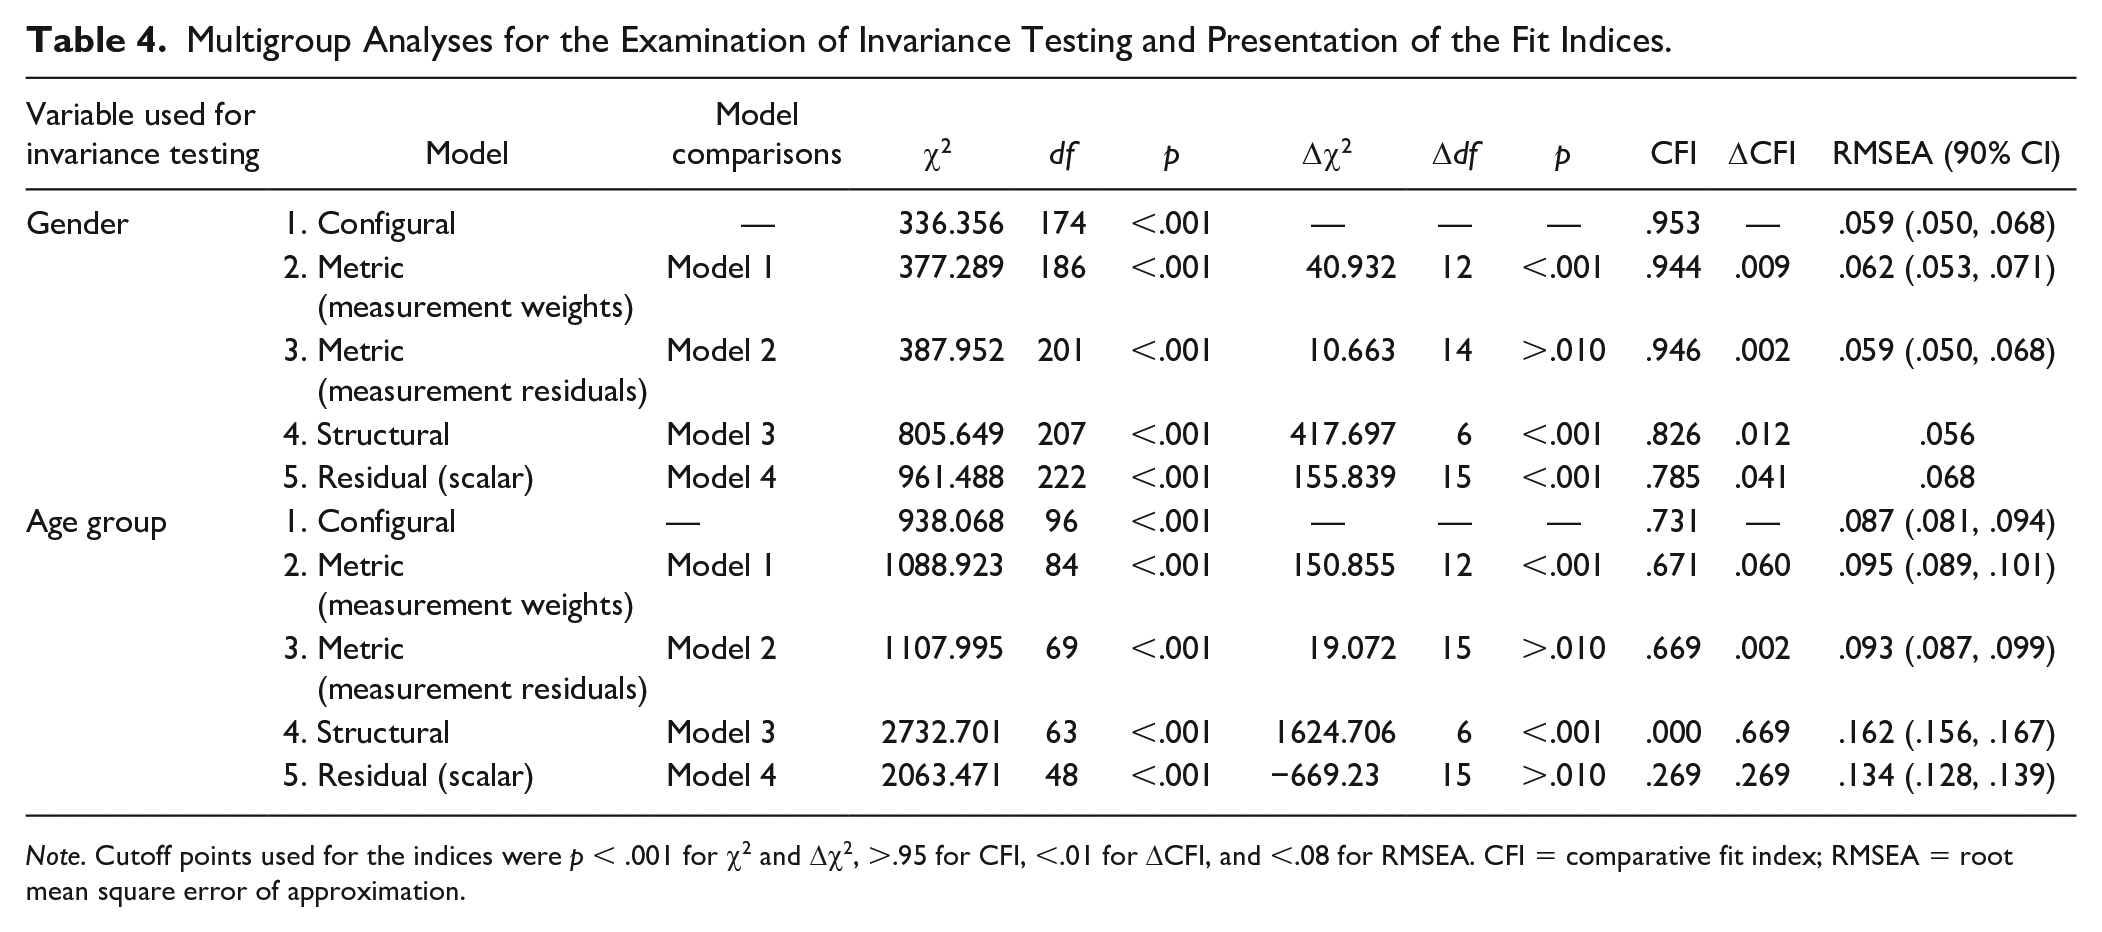
Note. Cutoff points used for the indices were p < .001 for χ2 and Δχ2, >.95 for CFI, <.01 for ΔCFI, and <.08 for RMSEA. CFI = comparative fit index; RMSEA = root mean square error of approximation.
Discussion
The present study aimed to examine the factorial structure of the D-KEFS Tower Test scores, by including the measures of rule violations, excess moves, first-move-time, and total achievement scores. The findings of the study supported the multidimensionality of the D-KEFS Tower Test, as the final best-fitting model consisted of three correlated latent factors. Based on the related literature, we can hypothesize that the factors derived capture impulsivity (first-move-time scores), disorganization or difficulty with online planning (excess moves scores), and behavior disinhibition (rule violations scores). The total achievement scores did not load on any of the preexisting factors and could not form a separate latent factor. The three-factor solution was the best fitting model, when compared with the unidimensional one-factor solution, the two-factor model, the four-factor model, and the bifactor model. Also, the selected model was supported by the magnitude of the correlations among the three extracted factors over a hierarchical second-order model, suggesting the distinct constructs captured by these D-KEFS Tower Test scores.
TOL has been used excessively over the last couple of decades for neuropsychological assessments and in training programs with the usage of both uni- and bidimensional latent constructs aiding the inferences drawn from this task. The findings of the present study suggest a somewhat different picture, specifically that D-KEFS Tower Test scores are better captured in a multidimensional, rather than a unidimensional form. The use of a single D-KEFS Tower Test score should be avoided, as it minimizes the information that can be extracted by the different D-KEFS Tower Test measures and ignores the distinct aspects of executive functions captured apart from planning, that could be informative for assessment and intervention purposes. This was also confirmed by the wide confidence intervals of the reliability estimates of this metric, compared with the reliability estimates of the other D-KEFS Tower Test scores supported by the best-fitting model (Table 2). The first-move-time scores of the participants were considered a measure of poor inhibitory control, rather than an indication of good preplanning ability, agreeing with earlier views on the utility of this measure retrieved from different versions of the TOL (Bagshaw et al., 2014; Steinberg, 2010). Also, given the limited ability of the total achievement scores to form a stable latent factor over the rest of the scores, our findings agree with Georgiou et al. (2017), which supported the first-move-time scores as better indicators of planning ability compared with the accuracy scores. However, one should note that there are additional possible explanations for what the first-move-time scores reflect. For example, a recent study supported that higher first-move-time may be presented by a participant who is overcareful or inefficient (Pires et al., 2019). The explanation that those participants might have been overcareful could explain the negative correlation found between the latent factors of first-move-time and excess moves, and the explanation that those participants might have been inefficient could also explain the positive correlation found between the latent factors of first-move-time and rule violations.
We considered the latent factor stemming from the first-move-time scores to reflect impulsivity rather than preplanning ability (which would be related to higher total achievement scores), due to the significant positive correlation with rule violations. Based on the direction of the correlations between the three latent factors, we considered the latent factor formed by the excess moves to reflect disorganization or difficulties with online planning, as it had a negative correlation with first-move time. The positive relationship between impulsivity and disorganization was as expected, as lower first-move-time, that is, faster and more impulsive beginnings, were related to more excess moves. Given the high positive correlation between rule violations and first-move-time scores we compared a model with those factors combined. However, the model fit was worse, supporting the meaningfulness of keeping those latent factors separated. It might be that impulsivity and disinhibition in the context of an executive function task have different forms compared with their characteristics in the context of behavior. That is, starting to solve the towers impulsively increases the chances, but does not necessarily mean that participants will have more rule violations. Importantly, the ability to remember the rules while solving the tower requires working memory in addition to the need for inhibitory control. This seems to be in line with previous evidence that performance in different versions of the TOL is related to working memory (D’Antuono et al., 2017). It is not clear why the direction of the correlation between the rule violations and total achievement latent scores was found to be positive. It might be that the more rule violations in early items, the more accurate participants were in later items and this affected the total achievement score. At the same time, this finding further supports the vulnerability of the total achievement score and the limited information conveyed when used as a single metric from the D-KEFS Tower Test.
The findings of the present study suggest that the best fitting model could be generalized across genders, as it was invariant for males and females. Also, nonsignificant differences were detected on the latent means of males and females on the three factors of “impulsivity,” “disorganization,” and “disinhibition.” This is consistent with previous findings that supported invariance across genders (Debelak et al., 2016). The multigroup analysis based on age groups supported noninvariance, showing that the structure of the planning and inhibition construct differs based on age, something that was found in at least two more studies (Debelak et al., 2016; Latzman & Markon, 2010). We also show that the three latent factors extracted have standardized estimates of higher magnitude and there is better discrimination of the disorganization latent factor (as reflected through the excess moves scores) in participants aged 41 to 65 years. Future studies should emphasize on age group differences while including other executive function tasks that could shed light into the specific skills captured by the D-KEFS Tower Test metrics in different age groups.
The findings of the present study point toward using the first four trials as practice trials, supporting previous research (e.g., Kaller et al., 2016; Unterrainer et al., 2019). Only the scores from Towers 5 to 9 were included in the final models for the TOL measures in the present study. This was considered mandatory due to the low variance and/or the nonsignificant loadings of the first four towers on the latent factors, leading to worse model fit overall. It might be that those towers had very low difficulty level (see also Andrews et al., 2014). The moves needed for the first four towers were less than four and the vast majority of the participants did not violate any rules and did not perform a considerable number of excess moves. This may be related to the findings that individuals can plan and memorize up to seven moves (e.g., Phillips et al., 2001), and may indicate that increased number of rule violations and use of excess moves are only evident after this point. As the D-KEFS Tower Test does not include any trial/practice phase, it might be more appropriate to treat the first four trials as practice trials, due to the easiness of their solutions. Based on the findings of the present study we suggest that Towers 1 to 4 should not be included in the calculation of the D-KEFS Tower Test measures of impulsivity, disorganization, and disinhibition, as they could not serve the assessment purposes. That is, the D-KEFS Tower Test scores for Towers 5 to 9 seem to be more consistent and informative, and should be considered a more reliable way to evaluate the performance of participants on the D-KEFS Tower Test measures. Importantly, this is in line with previous studies discussing the use of other TOL versions apart from the D-KEFS Tower Test which include more towers to account for the variability in item difficulty (e.g., Kaller et al., 2016; Unterrainer et al., 2019).
Another related observation is the relatively higher loadings of the last towers on the latent factors. It might be that these trials (Towers 8 and 9) demand higher cognitive load, as the participants have to memorize a move sequence in their working memory and make a plan before they start solving the tower. It remains to be investigated whether the increase of towers could be more beneficial and informative for the executive functions that TOL aims to capture. This has been also supported by versions of TOL that added more towers in order to be able to exclude the early ones during analysis, since in the early towers individuals are thought to try to stabilize the strategy used to solve the towers (e.g., the TOL-Freiburg edition; Kaller et al., 2016). Importantly, the findings of the present study gave limited support that the number of towers should be used as a method factor. Even though differences in the difficulty level were noted after Tower 4, the bifactor model which included method factors for the rest five towers showed that the measures did not load significantly on those latent factors. Instead, the latent factors capturing the executive functions measured were the ones with consistently significant standardized loadings. Those latent factors capturing impulsivity, disinhibition, and disorganization were validated through the correlations between each other, and also their discriminative relationships with the total achievement score. This finding shows how misleading it could potentially be to only consider one score, instead of the separate D-KEFS Tower Test measures that can be formed.
Limitations of the study include the use of the more relaxed model fit criteria for some of the examined models. It has been previously discussed that the model fit indices are rather arbitrary and that the different indices used might be inconsistent as they illustrate different perspectives of fit (e.g., Lai & Green, 2016). Even though multivariate normality was not met, we followed recommendations to use other estimators, such as Bayesian estimation and GLS estimation to account for nonhomogeneous variances and performed bootstrap and MLR in order to overcome nonnormality. The asymptotic distribution free estimator could be another option to handle nonnormality but was not recommended as this estimator needs very large sample sizes to provide reliable results, thus, was not performed in the present study (B. M. Byrne, 2013; Narayanan, 2012). There is not enough evidence to suggest that the findings of the present study could be generalized for other TOL versions. A study that compared the TOL (DX version) with the D-KEFS Tower Test found that the participants’ scores were similar but with some exceptions (Larochette et al., 2009). For example, the comparison between the total move score and the D-KEFS total achievement score, revealed only moderate correlation, supporting that the two tests only shared 22% of their variance (Larochette et al., 2009). Other limitations are the small sample size and the overrepresentation of males. However, the multigroup analysis revealed that the final best-fitting model was invariant across gender and the latent means comparison between males and females supported nonsignificant differences on their latent scores. The findings of the study are limited by the nature of the secondary data analyses, which renders the performance of power analysis to determine sample size and the inclusion of more executive function tasks to examine the convergent and discriminant validity of the factors extracted by the D-KEFS Tower Test scores used. Related to the above, the years of education for each participant were not available in this data set to be considered as a covariate and potentially included in a multigroup analysis. Importantly, the decision made earlier to exclude the first four towers may not meet general agreement. We based this decision on descriptive statistics and fit of these items in our sample, and cited related research discussing the potentially different cognitive processes captured by the earlier items due to lower item difficulty.
In summary, we report findings from a publicly available data set, aiming to examine the factorial structure of three measures from the D-KEFS Tower Test. Our results suggest that the D-KEFS Tower Test is more informative when considered to have a multidimensional structure including measures of impulsivity, disorganization, and disinhibition. The use of a single score can be largely misleading, with respective implications for assessment purposes. We also recommend the use of the last five towers for assessment purposes due to their informative nature and the fact that they seem to load on executive functions relevant to the D-KEFS Tower Test.
Supplemental Material
Supplementary_material – Supplemental material for The Factorial Structure of the Tower Test From the Delis–Kaplan Executive Function System: A Confirmatory Factor Analysis Study
Supplemental material, Supplementary_material for The Factorial Structure of the Tower Test From the Delis–Kaplan Executive Function System: A Confirmatory Factor Analysis Study by Stavros Trakoshis, Myria Ioannou and Kostas Fanti in Assessment
Footnotes
Declaration of Conflicting Interests
The authors declared no potential conflicts of interest with respect to the research, authorship, and/or publication of this article.
Funding
The authors received no financial support for the research, authorship, and/or publication of this article.
Supplemental Material
Supplemental material for this article is available online.
References
Supplementary Material
Please find the following supplemental material available below.
For Open Access articles published under a Creative Commons License, all supplemental material carries the same license as the article it is associated with.
For non-Open Access articles published, all supplemental material carries a non-exclusive license, and permission requests for re-use of supplemental material or any part of supplemental material shall be sent directly to the copyright owner as specified in the copyright notice associated with the article.