
Abstract
Background:
Repetitive negative thinking is conceptualized to be a transdiagnostic process linked to the development and maintenance of psychopathology. Prior research distinguishes between disorder-specific exemplars (worry, rumination) and transdiagnostic measures of repetitive negative thinking with differences across disorders reported. However, establishing the measurement invariance of these measures is necessary to support meaningful comparisons across clinical groups.
Method:
Bayesian structural equation modelling was used to assess the approximate invariance of the Ruminative Response Scale, Penn State Worry Questionnaire, and the Repetitive Thinking Questionnaire across individuals with a principal diagnosis of either depressive disorder, social anxiety disorder, or generalized anxiety disorder.
Results:
All scales demonstrated approximate measurement invariance across the three disorder groups. The depressive disorder group reported a higher level of rumination than the generalized anxiety disorder group (Δµ = 0.25, 95% Credibility Interval [0.06, 0.45]), with no difference between the generalized anxiety disorder and social anxiety disorder groups. The depressive disorder and generalized anxiety disorder groups did not differ in their levels of trait repetitive negative thinking, but the social anxiety disorder group was markedly lower than the generalized anxiety disorder group (Δµ = −0.21 [−0.37, −0.05]). Similarly, levels of worry did not differ between the generalized anxiety disorder and depressive disorder group but were lower in the social anxiety disorder group than the generalized anxiety disorder group (Δµ = −0.23 [−0.41, −0.06]).
Conclusions:
The Ruminative Response Scale, Penn State Worry Questionnaire, and Repetitive Thinking Questionnaire are measuring trait repetitive negative thinking in a consistent manner across individuals with a principal diagnosis of depressive disorder, social anxiety disorder, or generalized anxiety disorder. This supports their use in transdiagnostic contexts and indicates that it is appropriate to directly compare the scores on these measures between diagnostic groups.
Keywords
Psychological disorders are prevalent and represent a global and individual burden, with anxiety disorders and depression being the leading contributors to the nonfatal burden of disease (Whiteford et al., 2013). There are high rates of comorbidity between psychological disorders and research suggests that individuals are more likely to have co-occurring disorders rather than a single diagnosis (Brown et al., 2001). Identifying shared processes across disorders may help improve our understanding of why disorders co-occur and how to most effectively and efficiently treat both principal and comorbid disorders (Norton & Paulus, 2017).
Repetitive thinking about oneself and one’s world in a perseverative, attentive, and frequent manner is a process common to many psychological disorders (Harvey et al., 2004). Research suggests that repetitive negative thinking is implicated in the development and maintenance of a range of anxiety and related disorders (e.g., generalized anxiety disorder, social anxiety disorder, obsessive compulsive disorder), mood disorders, and eating disorders (Aldao et al., 2010; Ehring & Watkins, 2008; McEvoy et al., 2019). Furthermore, repetitive negative thinking is linked to heightened vulnerability to experiencing multiple emotional disorders and elevated levels of comorbidity (Brown et al., 2001; McEvoy et al., 2013; Ruscio et al., 2011), and is therefore conceptualized as a transdiagnostic risk factor (Ehring & Watkins, 2008; Harvey et al., 2004; Nolen-Hoeksema & Watkins, 2011).
Excessive worry and rumination are common exemplars of disorder-specific repetitive negative thinking for anxiety disorders and depression, respectively (Aldao et al., 2010). Worry refers to a relatively uncontrollable chain of negative emotionally salient thoughts and images and centers on the anticipation of future negative outcomes (Borkovec et al., 1983; Harvey et al., 2004), and is conceptualized as a key mechanism in generalized anxiety disorder (Dugas et al., 2004). In contrast, rumination refers to dysfunctional and repetitive styles of thinking and the tendency to focus attention on depressive symptoms as well as the causes and consequences of such symptoms (Harvey et al., 2004; Nolen-Hoeksema, 1991). Research suggests that brooding, a form of depressive rumination that involves negative self-reflection and passive comparison between a present situation and an unachievable standard, is a particularly pernicious process in depression (Nolen-Hoeksema, 2000; Sarin et al., 2005; Treynor et al., 2003). Worry and rumination differ in terms of their thought content and temporal orientation, such that rumination tends to be more past-oriented whereas worry tends to be more future-oriented; however, the temporal orientation can be interchangeable (i.e., rumination can be future-oriented and worry can be past-oriented; Watkins, 2008). Moreover, research suggests that both forms of repetitive negative thinking reflect similar processes such that they are both centered on negative content, repetitive, relatively abstract, and uncontrollable (Ehring & Watkins, 2008).
The broad role of repetitive thought in psychopathology underscores the importance of valid measures. Much of the literature on depression and worry has used the Ruminative Response Scale (RRS; Nolen-Hoeksema & Morrow, 1991) and the Penn State Worry Questionnaire (PSWQ; Meyer et al., 1990), respectively. The RRS and PSWQ demonstrate acceptable psychometric properties and have been validated across clinical and nonclinical samples (Brown et al., 1992; Whisman et al., 2018); however, no studies to date have investigated whether these measures of repetitive thinking are invariant across different diagnostic groups. This is important because the RRS was developed within the depression literature and therefore has depression-specific instructions: People think and do many different things when they feel sad, blue, or depressed. Please read each of the items below and indicate whether you almost never, sometimes, often, or almost always think or do each one when you feel down, sad, or depressed.
On the other hand, the PSWQ includes the cardinal diagnostic feature of GAD in all items (i.e., “worry”). These disorder-specific elements might lead to differential response styles across disorders. Research indicates that the majority of variance across measures of worry and rumination is shared and therefore reflects a common underlying repetitive negative thinking construct (McEvoy et al., 2010; McEvoy & Brans, 2013; Segerstrom et al., 2003). However, this research assumes that individuals with different principal disorders interpret and respond to the measures in the same manner (i.e., measurement invariance), otherwise direct comparisons between disorders may not be valid.
Given the transdiagnostic nature of repetitive thinking, it is important to identify whether the measurement of repetitive negative thinking can also be transdiagnostic, or if that measurement needs to be tailored to each disorder. Although disorder-specific measures of repetitive thought are useful to examine associations related to the target disorder, the majority of clinical patients present to treatment with multiple psychological disorders (Brown et al., 2001). Administering a number of disorder-specific measures suited to each symptom cluster during treatment could be burdensome for the patient and clinician (McEvoy et al., 2017; Samtani & Moulds, 2017). Furthermore, disorder-specific measures may be confounded by diagnosis-specific items and inflate the associations between the measure used and the target disorder, which in turn may hinder insight into the role of repetitive negative thinking in maintaining symptoms across the multiple disorders (McEvoy et al., 2017). In line with the shift toward identifying transdiagnostic processes, research has distinguished between disorder-specific and transdiagnostic scales of repetitive negative thinking (Samtani & Moulds, 2017).
Transdiagnostic scales of repetitive thinking have been designed to be used across disorders and reflect different types of repetitive thought. One such measure is the Repetitive Thinking Questionnaire–10 (RTQ-10; McEvoy et al., 2010). The RTQ-10 was developed to combine different types of repetitive thought including worry and depressive rumination as well as post-event processing, and as such, to be used across diagnostic groups (McEvoy et al., 2010). Research indicates that the RTQ-10 is linked to symptoms of a range of emotional disorders across nonclinical and clinical populations (Mahoney et al., 2012; McEvoy et al., 2010). Moreover, the RTQ-10 has been found to be sensitive to change during treatment (McEvoy et al., 2015). Evidence has provided support for the RTQ-10 in adolescent samples as well as for measurement invariance across gender and age (McEvoy et al., 2019). Together, research supports the reliability and validity of the RTQ-10 and suggests that it can be used to evaluate treatments designed to target repetitive negative thinking (Mahoney et al., 2012; McEvoy et al., 2015; McEvoy et al., 2019). Samtani and Moulds (2017) posit that transdiagnostic scales of repetitive thought can inform the advancement of theory and treatment and can provide information into the nature of repetitive negative thinking regardless of the patient’s principal disorder and presence of comorbidity. However, it is currently unknown if the psychometric properties of the RTQ-10 are invariant across different principal disorders (McEvoy et al., 2019).
Prior research has compared levels of repetitive negative thinking across different emotional disorders, and there have been some conflicting findings. McEvoy et al. (2013) found that measures of worry and rumination (brooding) did not significantly differ between individuals with generalized anxiety disorder, social anxiety disorder, panic disorder, and depression before and after controlling for comorbidity, thereby lending support to the transdiagnostic credentials of repetitive negative thinking. In contrast, other research has found that measures of worry (PSWQ) distinguishes between diagnostic groups (i.e., generalized anxiety disorder, social anxiety disorder, and depression; Fresco et al., 2002). However, to make valid and meaningful comparisons across groups it is necessary to demonstrate that the measure is invariant and assesses the same underlying construct in the same manner (i.e., structure and meaning) between different groups (Cheung & Rensvold, 2002).
Measurement invariance is the test of whether measurement model parameters (factor loadings and thresholds in the present study) are consistent between groups and/or over time (van de Schoot et al., 2015). Factor loadings can be viewed as the strength of influence that a latent variable has on the observed rating of a given behavior (Svetina et al., 2020). If these factor loadings are not consistent between groups, then individuals can have the same level of the latent variable (such as repetitive negative thinking) but not rate as highly on a given scale item. Item thresholds arise from the Likert nature of the data. As part of the analysis, the observed ratings are conceptualized as the discretization of an unobserved, continuous, latent variable. The item thresholds represent the values of this latent variable at which the individual transitions to a higher rating category on the observed item (Svetina et al., 2020). If the item thresholds are not consistent between groups, individuals could have the same level of severity on a given item but rate themselves in different categories.
Traditional (or “strict”) approaches to measurement invariance testing assume that parameter values (loadings and thresholds/intercepts) need to be exactly equal between groups for latent factor (or scale mean) comparisons to be valid (van De Schoot et al., 2015). However, it has since been argued that this is not likely to accurately represent reality (van De Schoot et al., 2015). It is more likely that two (or more) groups, even if equivalent, will have slight differences in their parameter values. Under the traditional approach to invariance testing, these slight differences may cause the groups to be declared noninvariant, when this is not the case (Muthén & Asparouhov, 2013). As such, the more relevant question is to whether these between-group differences in parameter values are large enough to compromise between-group comparisons of latent factor means or scale values (Muthén & Asparouhov, 2017), which is the assessment of approximate measurement invariance (AMI). AMI has seen increasing use across multiple disciplines and topics due to its flexibility and ease of use with many groups (Cieciuch et al., 2017; Davidov et al., 2018; Jang et al., 2017; Sideridis et al., 2019).
Rather than comparing the fit of increasingly constrained models, AMI instead attempts to minimize the differences between groups. If these differences cannot be sufficiently minimized, then the groups are declared noninvariant. The criteria for this differ depending on the method used to assess AMI. There are two main approaches to AMI testing: alignment optimization and Bayesian structural equation modelling (BSEM; Muthén & Asparouhov, 2017; van De Schoot et al., 2013). Alignment optimization estimates the latent factor means/variances that best minimize the differences in model parameters between groups (Muthén & Asparouhov, 2014). Individual parameters are then tested for equality with the average parameter value across all groups, with p values adjusted for multiple comparisons. If fewer than 25% of parameters fail this invariance test, then scale/factor mean comparisons are still valid (Muthén & Asparouhov, 2014). However, the alignment method is limited in the models it can be applied to, which is where the added flexibility of the BSEM approach is recommended.
A full treatment of Bayesian statistics is beyond the scope of this article, but as a brief introduction, parameters are estimated in a Bayesian context using both the observed likelihood (as would be returned from a traditional Frequentist analysis) and some prior information (van de Schoot et al., 2014). Here, the prior can be effectively viewed as “weighting” the observed likelihood. Model priors are generally described in terms of their “informativeness,” which refers to the extent of influence that they have on the resulting estimate, above that of the observed likelihood (van de Schoot et al., 2014). Strongly informative priors will attempt to regularize the estimate toward to a particular value. However, given that this process is effectively a “weighting,” if the observed likelihood strongly favors a different estimate it will override the prior (Muthén & Asparouhov, 2012). This is the foundational approach behind BSEM. The differences between parameters are given strongly informative priors that they should be zero (i.e., equal), but if the observed data do not represent this, it will override the influence of the prior and the estimated differences between parameters will be non-zero (Muthén & Asparouhov, 2012). If the credibility intervals of the difference in parameter values between groups do not contain zero, then the parameter is declared noninvariant (Muthén & Asparouhov, 2012). Like the alignment method, this allows the analysis to both minimize the parameter differences between groups and assess whether these differences are large enough to be meaningful. A key difference, however, is that the BSEM approach can be applied to a wider class of models, particularly those with approximate-zero residual covariances.
Residual covariances refer to the covariances between the items after accounting for the influence of latent factors. Under the traditional approaches to confirmatory factor analysis, these residual covariances are assumed to be zero (van De Schoot et al., 2013). In other words, all relationships between the scale items should be fully explained by the presence of latent factors. Similar to arguments against strict MI, this assumption is unlikely to be fully representative of reality. Some scale items may show covariances due to similar wording or the assessment of similar behaviors. These weak covariances may cause a given model to be rejected for poor fit, even though the model is correctly specified (Muthén & Asparouhov, 2012). However, this requires either a-priori specification of residual-covariances or iteratively freeing covariances based on modification indices, which is problematic. An alternative is to use strongly informative priors that these residual covariances should be zero (Muthén & Asparouhov, 2012). This allows the prior to regularize the estimates toward zero, allowing the model to be identified, but if the observed covariances differ from zero then they can override this. Together with strongly informative priors on the differences between groups, this allows the BSEM approach to assess the invariance of a given model in a manner that best represents reality.
Given the increasing interest in repetitive negative thinking as a risk factor for psychopathology, the nature and measurement of repetitive thinking has received considerable research and clinical attention. Evaluating the approximate measurement invariance of scales of repetitive negative thinking across diagnostic groups would lend further support to the transdiagnostic conceptualization of the construct. Furthermore, if the disorder-specific and transdiagnostic repetitive thinking scales were found to be approximately invariant across disorders then this would have important implications for use in research and clinical contexts. If invariance is supported, then it would suggest that the scale items do not need to be adapted for individuals with different disorders and that means of repetitive negative thinking could be compared across groups (McEvoy et al., 2019). To summarize, it is important to determine whether or not measures of repetitive negative thinking originally developed within the depression (RRS) and generalized anxiety disorder (PSWQ) literatures are invariant across disorders, because even though rumination and worry have been shown to be elevated across these disorders, it might be that disorder-specific instructions (RRS) or item content (PSWQ) lead to differences in item interpretation or response styles across principal disorders and thus preclude meaningful direct comparisons. Furthermore, it is important to demonstrate that measures purporting to be transdiagnostic (RTQ-10) are invariant across principal disorders. The RTQ-10 was originally developed from items assessing repetitive negative thinking across depression, generalized anxiety disorder, and social anxiety disorder, and as such, individuals with these principal disorders were included in the present study.
The aim of the current study was to examine the approximate measurement invariance of disorder-specific and transdiagnostic measures of repetitive negative thinking across three groups with a principal disorder of generalized anxiety disorder, social anxiety disorder, or depressive disorder. The disorder-specific measures included measures of worry (PSWQ) and rumination (RRS brooding subscale), and the transdiagnostic measure included a measure of trait repetitive thinking (RTQ-10). It was hypothesized that the PSWQ, RRS (brooding subscale), and the RTQ-10 would demonstrate approximate measurement invariance across the principal disorder groups. If the measures demonstrated approximate measurement invariance and latent mean differences were examined, it was hypothesized that (1) patients with a principal depressive disorder would have significantly higher rumination (RRS) than patients with a principal generalized anxiety disorder or social anxiety disorder, (2) patients with a principal generalized anxiety disorder would have significantly higher worry (PSWQ) than patients with a principal social anxiety disorder or depressive disorder, and (3) there would be no significant difference between trait repetitive negative thinking (RTQ-10) between patients with a principal generalized anxiety disorder, social anxiety disorder, and depressive disorder.
Method
Participants
Participants were 1,106 patients referred to a specialist service for the treatment of anxiety and/or depressive disorders. Patients were aged between 17 and 81 years (Mage = 34.16 years; SD = 12.97; 66% female). Inclusion criteria for the current study was a principal disorder of generalized anxiety disorder, social anxiety disorder, or depressive disorder (i.e., major depressive current or persistent depressive disorder). Principal diagnoses are defined by the Diagnostic and Statistical Manual of Mental Disorders–Fifth edition (DSM-5; American Psychiatric Association, 2013, p. 22) as “the reason for [the] visit [which] is also the main focus of attention or treatment,” and thus these were collaboratively assigned by the clinician and patient as the most debilitating disorder in need of clinical attention. Patients were assessed for a DSM-IV or DSM-5 diagnosis (American Psychiatric Association, 1994, 2013). The total proportion of patients meeting DSM-IV or DSM-5 criteria for each principal disorder were as follows; generalized anxiety disorder (n = 253), social anxiety disorder (n = 389), and depressive disorder (n = 464). A total of 24% (n = 270) of the sample met criteria for having one disorder and 76% (n = 836) met criteria for having more than one disorder. The rates of principal and comorbid generalized anxiety disorder, social anxiety disorder, and depressive disorder are presented in Table 1.
Rates of Principal and Comorbid Diagnoses for Each Disorder Group.
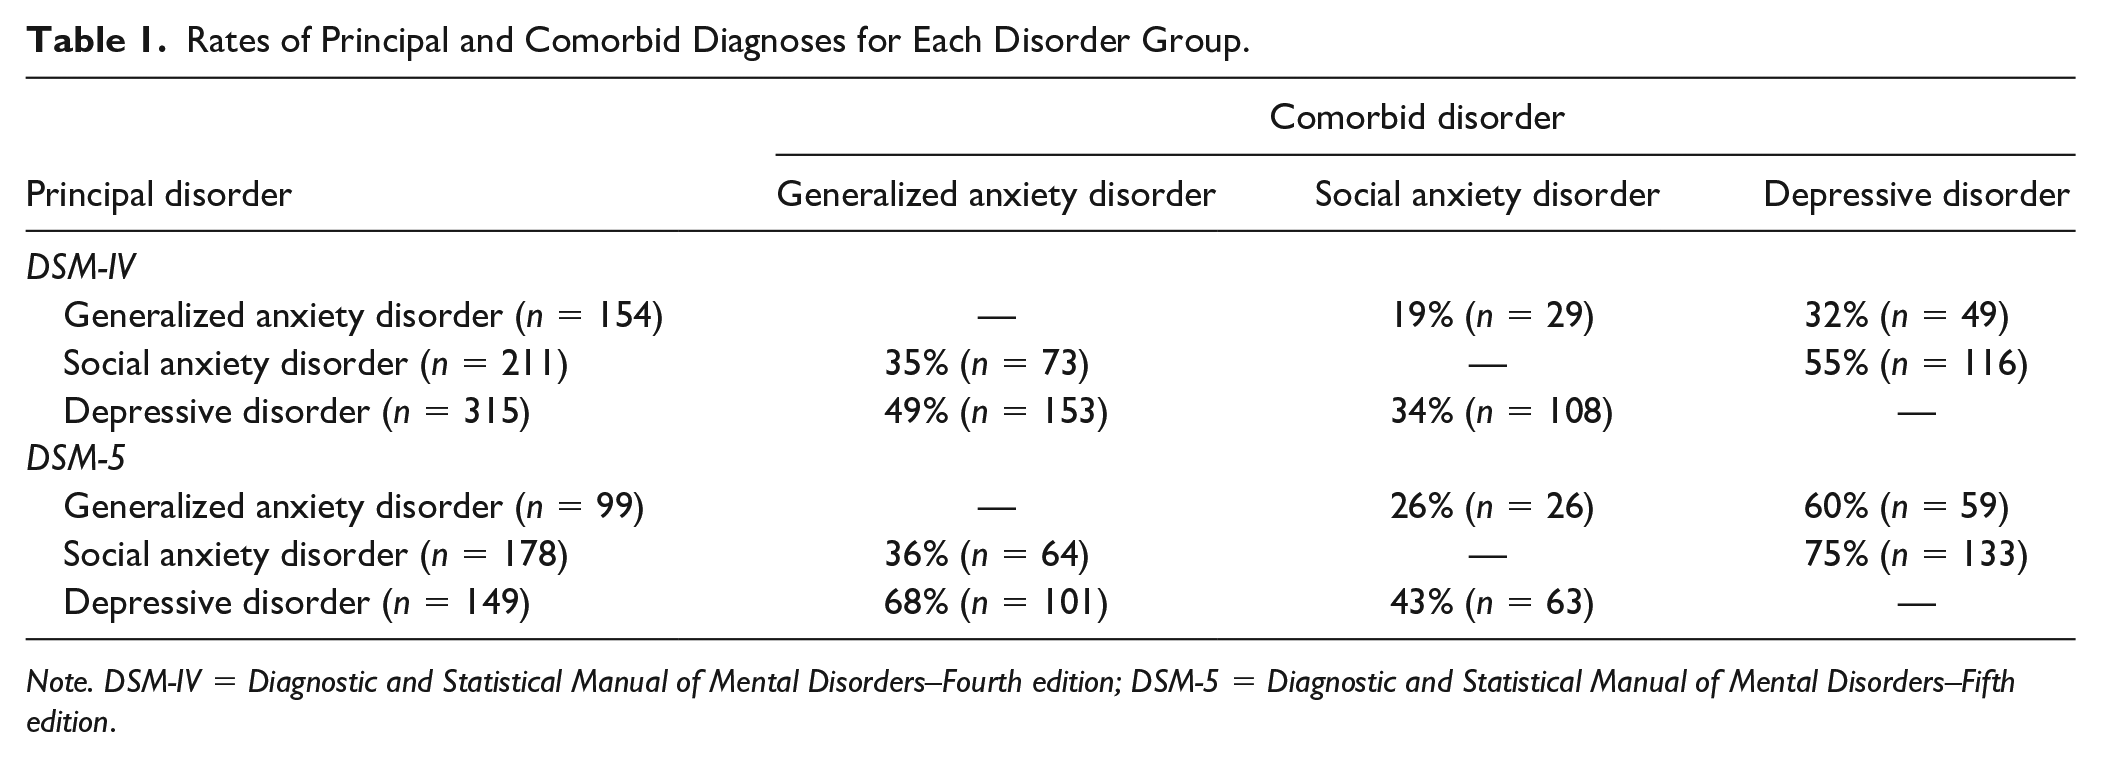
Note. DSM-IV = Diagnostic and Statistical Manual of Mental Disorders–Fourth edition; DSM-5 = Diagnostic and Statistical Manual of Mental Disorders–Fifth edition.
Measures
Ruminative Response Scale (Treynor et al., 2003)
The 22-item RRS was adapted from the original lengthier Response Styles Questionnaire and was adapted further to remove items assessing depression symptoms resulting in the 10-item RRS that measures brooding and reflection. The five-item brooding subscale was used in the current study and was designed to measure passive and repetitive thinking about negative mood and the associated implications of distress. Respondents are asked to indicate the extent to which they tend to do when feeling down, sad, or depressed along a 4-point Likert-type scale ranging from almost never (1) to almost always (4). The RRS has demonstrated acceptable internal consistency, test–retest reliability, and convergent validity (Treynor et al., 2003).
Penn State Worry Questionnaire (Meyer et al., 1990)
The 16-item PSWQ was developed to assess the excessiveness and uncontrollable nature of trait worry. Respondents respond to each item along a 5-point Likert-type scale ranging from not typical at all (1) to very typical (5). The PSWQ has been found to have excellent internal consistency (Meyer et al., 1990), test–retest reliability, and good construct validity across nonclinical and clinical samples (Brown et al., 1992; Dear et al., 2011; Meyer et al., 1990).
Repetitive Thinking Questionnaire-10 (RTQ-10; McEvoy et al., 2010)
The 10-item RTQ-10 was designed to assess trait repetitive negative thinking. Respondents are asked to indicate the extent to which the statements reflect their experiences when feeling distressed or upset along a 5-point Likert-type scale ranging from not true at all (1) to very true (5). Psychometric evidence supports the internal consistency and convergent validity of the RTQ-10 across nonclinical and clinical samples (McEvoy et al., 2010; Mahoney et al., 2012).
Procedure
Prior to the initial assessment session, a standard questionnaire battery was posted to patients that was completed and brought to the assessment session. Patients were diagnosed via a structured diagnostic interview (Mini International Diagnostic Interview; Sheehan et al., 1998, for DSM-IV diagnoses, or Structured Clinical Interview for DSM, for DSM-5 diagnoses) administered by a masters- or doctorate-level clinical psychologist at the initial assessment. The clinicians received weekly supervision by senior staff and the assessments were discussed at clinical review meetings to confirm service inclusion criteria and diagnoses. Ethics approval was received from the Area Health Service’s and University’s Research Ethics Committee.
Statistical Analysis
To test whether repetitive negative thinking was being measured consistently across different diagnostic groups, a test of approximate measurement invariance was conducted. This is a two-step procedure. First, the configural model for a given scale was tested. This model freely estimates the factor loadings and thresholds in each group, and only assumes that the same number of latent factors are present (not that the structure of those factors are the same). If the configural model showed poor fit, then near-zero residual covariances (with strongly informative priors) were introduced. Second, following the determination of the configural model, the approximate invariance model was estimated with strongly informative priors for the differences in factor loadings and thresholds.
Model Priors
Factor loadings, thresholds, and latent mean differences were given weakly informative priors of N (0, 5). The “weakly informative” classification denotes that these priors do not give any strong weighting to a particular value but instead provides little to no support for “impossible” values. This provides increased stability in the estimation process and reduces bias in the estimates (McNeish, 2016). The N (0, 5) prior implies that 99% of parameter values should fall in the range [−15, 15]. As these data are analyzed using a probit model to account for their ordinal nature, these boundaries are highly extreme. Note that these are also the default priors used in popular SEM software Mplus.
Residual correlations were given a Lewandowski, Kurowicka, and Joe prior with a shape parameter of 50, representing very strong prior information that the correlations should be zero. Latent factor variances (in the BSEM analyses) were given a weakly informative half-Cauchy prior with a shape parameter of 5.
The factor loading and threshold differences were given strongly informative priors of N (0, 0.1). This prior implies that 99% of the sample should have factor loadings and thresholds within 0.3 of the corresponding parameter in the reference group. This is the recommended prior specification for BSEM invariance analyses (Muthén & Asparouhov, 2013; van de Schoot et al., 2013). A more detailed summary of these priors is also provided in the supplementary materials.
Model fit
Fit of the configural models was assessed using posterior predictive checking (PPC). Under PPC, data are generated according to the model and those generated data are then compared with the observed data. If the model is a good representation of the observed responses, then the data generated by the model should not markedly differ from the observed responses (Asparouhov & Muthén, 2010). The PPC statistic represents the proportion of iterations where the observed data showed better fit than the model-implied data. A PPC statistic smaller than 0.05 or greater than 0.95 indicates a poorly fitting model, with PPC values closer to 0.5 indicating good fit. The methodology for comparing the fit of the observed and model-implied data at each iteration is provided in the supplementary materials.
To assess changes in model fit, the Watanabe-Akaike Information Criteria and Leave-One-Out Estimated Log-Posterior Density (LOO ELPD) difference testing was used. Watanabe-Akaike Information Criteria can be interpreted in the same manner as the Akaike Information Criteria, where smaller values indicate a better-fitting model (Vehtari et al., 2017). The LOO ELPD statistic is used to assess the ability of the model to predict new observations (i.e., out-of-sample predictive accuracy), like the Akaike Information Criteria statistic (Vehtari et al., 2017). A fuller introduction and practical tutorial is provided in Vehtari et al. (2017). The LOO ELPD can be interpreted in the same way as the log-likelihood from a frequentist analysis, with a larger value indicating a better-fitting model (Vehtari et al., 2017).
Confidence intervals for the differences between LOO ELPD values can be used to statistically assess meaningful changes in model fit. The developers of the statistic recommend that the confidence intervals for the differences be constructed ±5 × standard error [SE], where SE is the standard error of the difference in LOO ELPD values (Vehtari, 2017). This is because the estimated SEs for the LOO ELPD difference will be negatively biased, and so falsely conclude a meaningful difference in model fit (Vehtari, 2017). If the confidence intervals for the LOO-ELPD difference between models contains zero, then there is not sufficient evidence of a difference in model fit.
Analyses were conducted using the cmdstanR (Gabry & Cesnovar, 2020) package with Stan 2.26.1 in R version 4.0.4. Each model was run for 10000 iterations using four MCMC chains. The Stan syntax for each model and the R code for calculating the PPC values are provided in the supplementary materials. Factor loadings and residual covariances (if relevant) for each of the scales are also provided in the supplementary materials. The analysis was not preregistered.
Results
Descriptive Statistics
Descriptive statistics for each measure in each disorder group, correlations between the repetitive negative thinking measures, and Cronbach’s alphas are presented in Table 2.
Descriptive Statistics, Cronbach’s Alpha, and Bivariate Correlations Between Repetitive Negative Thinking Measures for Each Disorder Group.
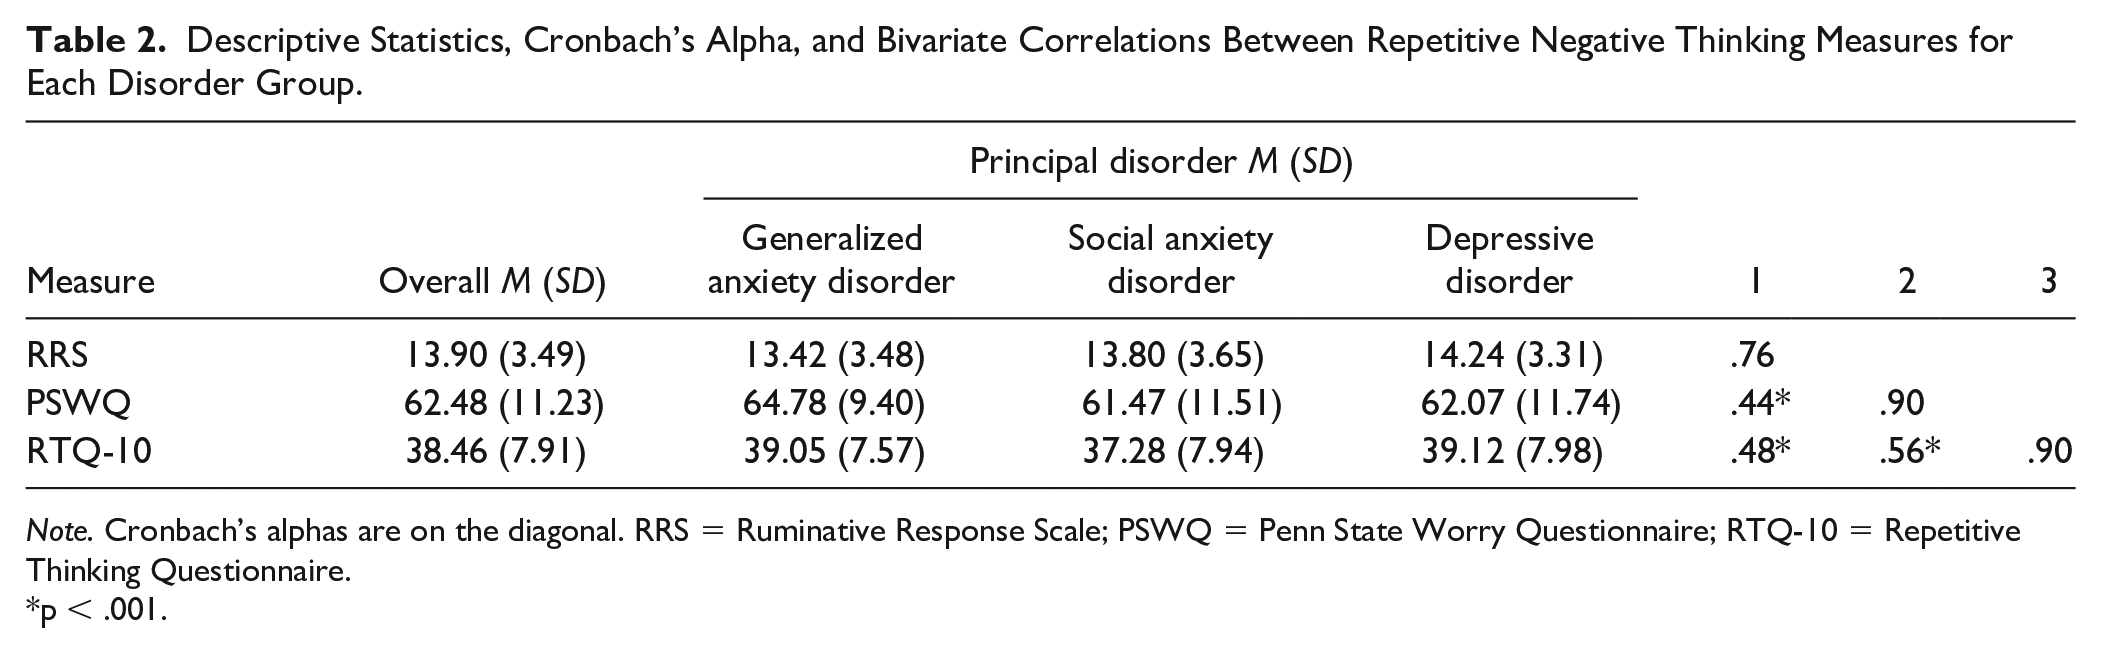
Note. Cronbach’s alphas are on the diagonal. RRS = Ruminative Response Scale; PSWQ = Penn State Worry Questionnaire; RTQ-10 = Repetitive Thinking Questionnaire.
p < .001.
Ruminative Response Scale
The RRS configural model showed good fit (PPC = .751), and so no residual covariances were introduced. The RRS BSEM using strongly informative priors for the differences in factor loadings and item thresholds showed no marked change in model fit according to the LOO ELPD difference (see Table 3).
RRS Model Fit Statistics.
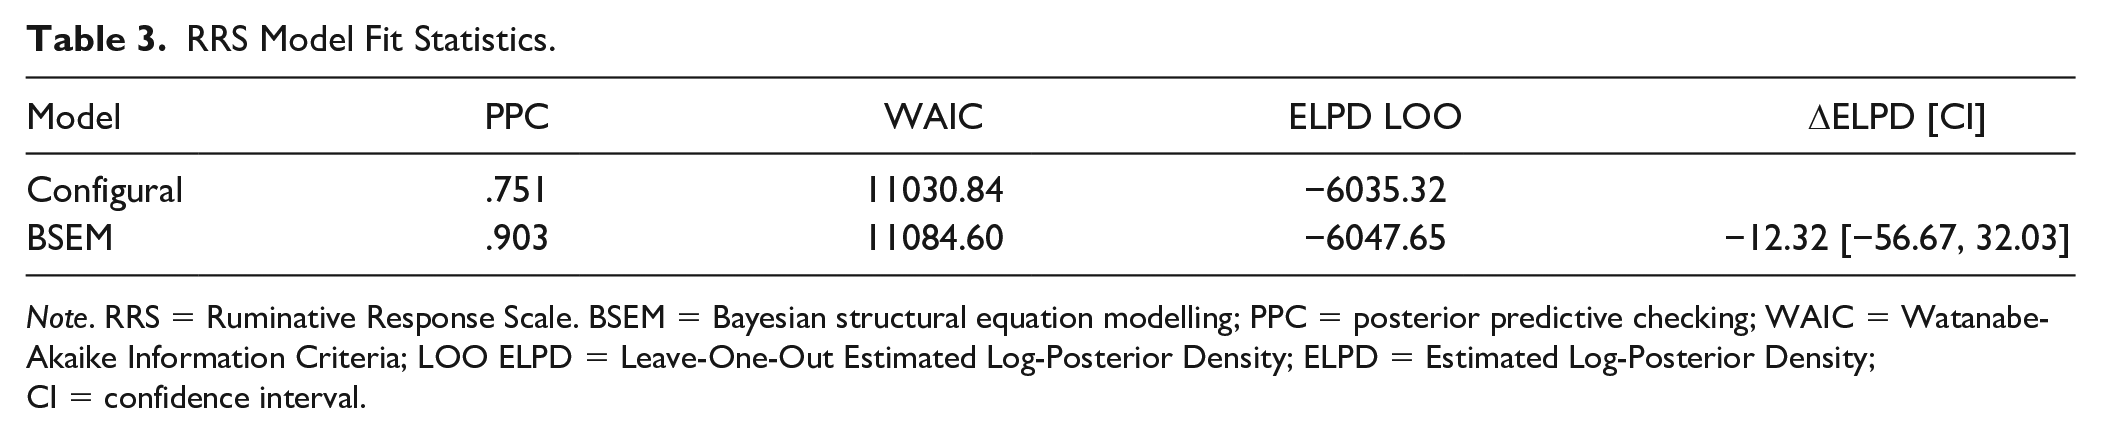
Note. RRS = Ruminative Response Scale. BSEM = Bayesian structural equation modelling; PPC = posterior predictive checking; WAIC = Watanabe-Akaike Information Criteria; LOO ELPD = Leave-One-Out Estimated Log-Posterior Density; ELPD = Estimated Log-Posterior Density; CI = confidence interval.
The 95% credibility intervals for the differences in factor loadings and thresholds between the groups all contained 0, indicating that the factor structure was approximately the same between all groups. When comparing the latent means of the three groups, the social anxiety disorder and generalized anxiety disorder groups did not differ (Δµ = 0.13 [−0.06, 0.33]). However, the mean level of rumination in the depressive disorder group was higher than the generalized anxiety disorder group (Δµ = 0.25 [0.06, 0.45]). This indicates that all groups responded to the RRS in the same way, and that the depressive disorder group had a higher level of rumination than the social anxiety disorder and generalized anxiety disorder individuals.
Penn State Worry Questionnaire
The PSWQ configural model showed poor fit to the data (PPC = .998), and so residual covariances with strongly informative priors were added. Model fit markedly improved (ΔELPD confidence intervals did not contain zero), and so this model was used for the BSEM invariance analysis. Several residual covariances appeared to be present between the reverse-scored items, suggesting some method variance unique to these indicators. The PSWQ BSEM using strongly informative priors for the differences in factor loadings and item thresholds showed no marked change in model fit according to the LOO ELPD difference (see Table 4).
PSWQ Model Fit Statistics.
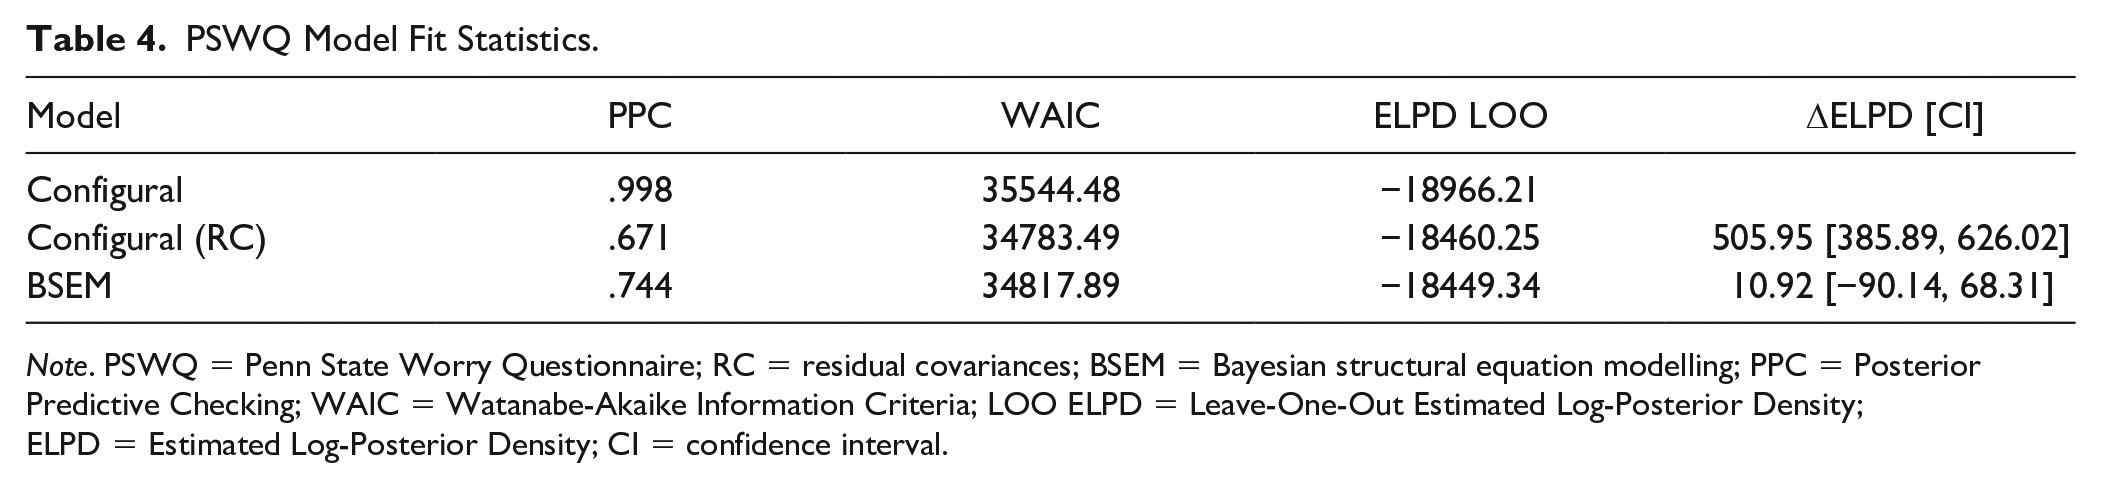
Note. PSWQ = Penn State Worry Questionnaire; RC = residual covariances; BSEM = Bayesian structural equation modelling; PPC = Posterior Predictive Checking; WAIC = Watanabe-Akaike Information Criteria; LOO ELPD = Leave-One-Out Estimated Log-Posterior Density; ELPD = Estimated Log-Posterior Density; CI = confidence interval.
The 95% credibility intervals for the differences in factor loadings and thresholds between groups all contained zero, indicating that the same approximate factor structure was present. When comparing the latent means of the three groups, the social anxiety disorder group had a mean that was markedly lower than the generalized anxiety disorder group (Δµ = −0.23 [−0.41, −0.06]), but the depressive disorder group did not differ from the generalized anxiety disorder group (Δµ = −0.12 [−0.29, 0.05]). This indicates that all groups responded to the PSWQ in the same way, and the social anxiety disorder group had the lowest level of worry.
Repetitive Thinking Questionnaire-10
The RTQ-10 configural model showed poor fit to the data (PPC = .999), and so residual covariances with strongly informative priors were added. Model fit markedly improved (ΔELPD confidence intervals did not contain zero), and so this model was used for the BSEM invariance analysis. The RTQ-10 BSEM using strongly informative priors for the differences in factor loadings and item thresholds showed no marked change in model fit according to the LOO ELPD difference (see Table 5).
RTQ-10 Model Fit Statistics.
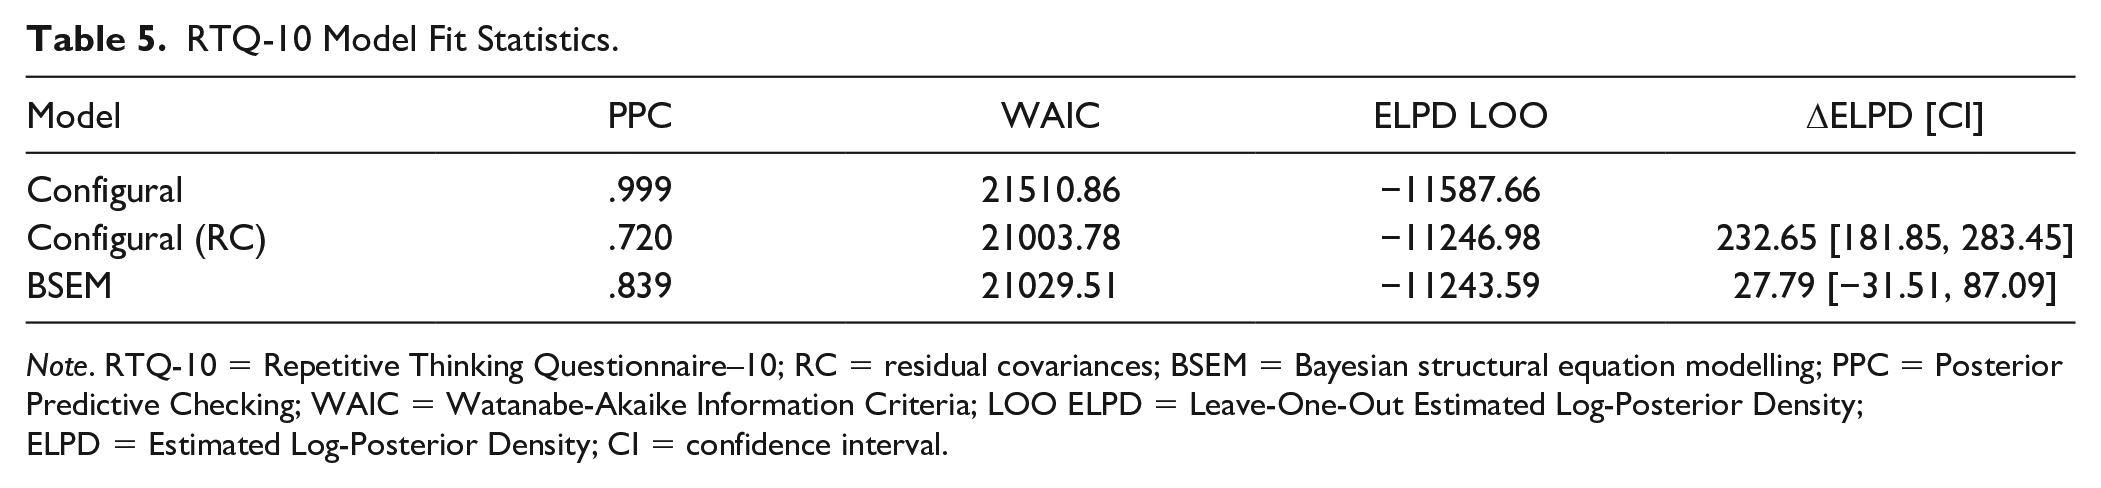
Note. RTQ-10 = Repetitive Thinking Questionnaire–10; RC = residual covariances; BSEM = Bayesian structural equation modelling; PPC = Posterior Predictive Checking; WAIC = Watanabe-Akaike Information Criteria; LOO ELPD = Leave-One-Out Estimated Log-Posterior Density; ELPD = Estimated Log-Posterior Density; CI = confidence interval.
The 95% credibility intervals for the differences in factor loadings and thresholds between groups all contained zero, indicating that the same approximate factor structure was present. When comparing the latent means of the three groups, the social anxiety disorder group had a mean that was markedly lower than the generalized anxiety disorder group (Δµ = −0.21 [−0.37, −0.05]), but the depressive disorder group did not differ from the generalized anxiety disorder group (Δµ = 0.03 [−0.13, 0.19]). This indicates that all groups responded to the RTQ-10 in the same way, and the social anxiety disorder group had the lowest level of repetitive negative thinking.
Discussion
The aim of this study was to examine the measurement invariance of the RTQ-10, PSWQ, and the RRS (brooding subscale) across a sample of patients with a principal disorder of generalized anxiety disorder, social anxiety disorder, or depressive disorder. All measures were found to perform consistently regardless of principal diagnosis, indicating their suitability for use in transdiagnostic contexts. As would be expected, individuals with a principal depressive disorder diagnosis reported markedly higher levels of rumination (brooding) than individuals with social anxiety disorder or generalized anxiety disorder. Individuals with a principal diagnosis of social anxiety disorder reported markedly lower levels of repetitive negative thinking and worry than those with depressive disorder and generalized anxiety disorder. These findings indicate that patients with different principal disorders interpret and respond to the RRS, PSWQ, and RTQ-10 items in a consistent manner, supporting their use in transdiagnostic contexts.
In comparing the latent factor means, the severity of rumination was significantly higher in the depressive disorder group than in the social anxiety disorder and generalized anxiety disorder groups. This is consistent with prior theory and research demonstrating that rumination is a risk and perpetuating factor of depression (Nolen-Hoeksema & Watkins, 2011; Watkins, 2008). It is noteworthy that the RRS instructions ask specifically for individuals to respond with respect to when they feel “sad, blue, or depressed.” This contrasts with the PSWQ (i.e., “ . . . how typical or characteristic each item is of you.”) and RTQ-10 (i.e., “ . . . when you are distressed or upset.”) instructions, which are not specific to particular emotions. The RRS instructions may therefore explain the higher latent mean RRS in depressed samples, but this does not appear to alter response styles to the items. Individuals with social anxiety disorder reported levels of trait repetitive negative thinking that were lower than both the depressive disorder and generalized anxiety disorder groups. These results are somewhat consistent with the transdiagnostic conceptualization of trait repetitive thinking, which has found comparable associations between repetitive thinking and symptoms of anxiety and depression (Mahoney et al., 2012; McEvoy et al., 2010).
Individuals with a principal diagnosis of generalized anxiety disorder and depressive disorder both demonstrated similar levels of worry, with those in the social anxiety disorder group reporting levels of worry lower than both. Although worry is a core feature of generalized anxiety disorder, this somewhat aligns with the conceptualization of worry as a transdiagnostic process common to anxiety disorders and depression (McEvoy et al., 2013; Raes, 2010). These findings are consistent with the results of previous studies that found that patients with a “pure” generalized anxiety disorder reported higher worry levels relative to patients with other anxiety disorders such as social anxiety disorder, specific phobia, and panic disorder, posttraumatic stress disorder (Chelminski & Zimmerman, 2003). In contrast to the results of this study, prior studies have found that worry severity did not differ between principal diagnostic groups (i.e., patients with generalized anxiety disorder, social anxiety disorder, panic disorder, and depressive disorder; McEvoy et al., 2013; Starcevic, 1995). This discrepancy might be attributable to the current study comparing latent means whereas McEvoy et al. (2013) and Starcevic (1995) compared observed means that include measurement error.
The approximate invariance of the RRS, PSWQ, and RTQ-10 supports the use of pooled data approaches and integrated samples with diagnostic heterogeneity. Pooling data from multiple principal disorders together allows researchers and clinicians to focus on the transdiagnostic, dimensional constructs involved in psychopathology (Kozak & Cuthbert, 2016). This is consistent with the Research Domain Criteria initiative (National Institute of Mental Health, 2016), which aims to shift from categorical classifications of disorders to identifying the underlying dimensional constructs involved in mental disorders across multiple units of analysis (e.g., self-report, neural circuitry, genes; Kozak & Cuthbert, 2016).
Evidence of approximate invariance of the disorder-specific and transdiagnostic measures of repetitive negative thinking in the current study suggests that researchers and clinicians can be more confident when making comparisons of severity across different clinical disorder groups. Furthermore, the findings of approximate measurement invariance indicates that each measure (RRS, PSWQ, and RTQ-10) can be used in the same way, without the need for modification, across clinical groups with different disorders. The RTQ-10, RRS, or PSWQ could potentially be used to identify higher levels of repetitive negative thinking as a risk and maintaining factor for multiple disorders. Researchers and clinicians should be guided by their theoretical perspective rather than concerns about measurement invariance when selecting one of these measures. If the primary aim is to assess transdiagnostic repetitive negative thinking then the RTQ-10 might be most appropriate, whereas the RRS or PSWQ could be selected if the primary aim is to assess depressive rumination or worry, respectively. The results also suggest that each of these measures of repetitive thinking may be useful in clinical contexts to guide case formulations and treatment planning for patients presenting with principal generalized anxiety disorder, social anxiety disorder, or depressive disorder.
Finally, how would these findings have differed under a “traditional” approach to assessing measurement invariance? Supplementary materials, available online, present the results from multiple-groups CFA models using weighted least squares (WLSMV) estimation to test for measurement invariance. The RRS would have demonstrated metric invariance, and the PSWQ and RTQ-10 would have demonstrated scalar invariance. However, the fit of the configural models for all measures were quite borderline, with none showing a Tucker–Lewis-index > 0.95 or root mean square error of approximation < 0.07. As such, under the traditional approach to measurement invariance assessment, many would have stopped at the configural stage, or begun iteratively adding residual covariances according to modification indices. The improved fit of the configural models under Bayesian estimation was likely due to both the modelling of weak residual covariances, as well as the implicit handling of missing data (where WLSMV uses pairwise deletion). In summary, the Bayesian AMI approach allowed for a more powerful and flexible assessment of measurement invariance that was not available under traditional paradigms.
This study has limitations that must be considered. Only three principal disorder groups were included (i.e., generalized anxiety disorder, social anxiety disorder, and depressive disorder), and therefore the generalizability of the invariance findings may be limited to these disorders. It is noteworthy, however, that a recent study also found evidence of measurement invariance for the RTQ-10 and RRS between individuals with and without a history of nonsuicidal self-injury (Tonta et al., 2020). To maintain sufficient observations within each item category to avoid bias, the invariance analyses pooled patients with and without comorbid disorders, and therefore the generalizability of the findings to “pure” disorders without comorbidity is uncertain. However, it is important to note that the results are likely to have higher ecological validity given that patients were treatment-seeking, and this population is more likely to have co-occurring disorders rather than a single disorder (Brown et al., 2001). Future research should aim to examine whether these disorder-specific and transdiagnostic measures of repetitive negative thinking are approximately invariant across other principal internalizing and externalizing disorders (e.g., posttraumatic stress disorder, obsessive compulsive disorder, eating disorders), as well as across different disorders while taking into account comorbidity. Future research could also examine the longitudinal measurement invariance of repetitive negative thinking measures and, if supported, these measures could be used to monitor treatment changes and outcomes in repetitive thinking as well as vulnerability to emotional disorders (McEvoy et al., 2019).
Notwithstanding these limitations, the current study makes an important contribution to the literature by examining the measurement equivalence of disorder-specific and trait measures of repetitive negative thinking across different clinical groups. The results provide support for the approximate measurement invariance of disorder-specific (RRS—brooding, PSWQ) and transdiagnostic (RTQ-10) measures of repetitive negative thinking across patients with a principal anxiety disorder (generalized anxiety disorder, social anxiety disorder) and depressive disorder. These findings add to the growing body of research demonstrating the transdiagnostic conceptualization of repetitive negative thinking.
Supplemental Material
sj-docx-1-asm-10.1177_10731911211028657 – Supplemental material for Measurement Invariance of Disorder-Specific and Transdiagnostic Measures of Repetitive Negative Thinking
Supplemental material, sj-docx-1-asm-10.1177_10731911211028657 for Measurement Invariance of Disorder-Specific and Transdiagnostic Measures of Repetitive Negative Thinking by Sarah Shihata, Andrew R. Johnson, David M. Erceg-Hurn and Peter M. McEvoy in Assessment
Footnotes
Declaration of Conflicting Interests
The author(s) declared no potential conflicts of interest with respect to the research, authorship, and/or publication of this article.
Funding
The author(s) received no financial support for the research, authorship, and/or publication of this article.
Supplemental Material
Supplemental material for this article is available online.