
Abstract
This article describes the development and validation of a shortened form of SELweb EE, a web-based assessment for social–emotional skills in the early elementary grades. Using a Rasch approach, in the first study, we used data from two archival data sets to reduce the number of items in three subtests to create short forms that maintained item fit, item difficulty, item discrimination, and test information function range. In the second study, we created and administered a short form of SELweb EE to a demographically diverse cross-validation sample of 22,683 students. We evaluated the shortened assessment subtests’ score reliability, fit to a hypothesized factor structure, and association with age and other variables to evaluate criterion-related validity. Findings from this study suggest that score reliabilities, factor structure, and criterion-related validity for the short form are similar to corresponding properties of the long form. In addition, using a confirmatory factor analysis framework, the short form of SELweb EE demonstrated evidence of configural, metric, and scalar invariance across sex, ethnicity, and language. Shortening SELweb EE reduced the mean administration duration from 36 to 24 minutes. This reduction substantially increases its usability and feasibility while maintaining its psychometric merit.
Keywords
Social and emotional competence includes skills, attitudes, and dispositions that are consistently associated with children’s ability to interact positively with others, participate constructively in school and community, and achieve success in school and life (Banerjee & Watling, 2005; McKown et al., 2009; Nowicki & Duke, 1994). Specific social and emotional skills such as children’s ability to understand others’ emotions, manage their own emotions, and effectively solve social problems are associated with a wide range of concurrent and longitudinal life outcomes (Blair & Razza, 2007; Crick & Dodge, 1994; Izard et al., 2001; McKown, Russo-Ponsaran, Johnson, et al., 2016). Furthermore, social and emotional skills can be taught, as reflected by the large number of evidence-based social and emotional learning (SEL) programs designed to do just that (Weissberg et al., 2013).
In recognition of the critical importance of social and emotional competence to children’s success in and out of school, a growing number of American states have adopted standards that specify the social and emotional skills children should know and be able to demonstrate at different grade levels (Dusenbury et al., 2018). In this policy context, many American school districts have prioritized and integrated such programs into daily practice. A national survey found that 70% of educators believe social and emotional competence is teachable and should be a priority in school systems, and more than half of respondents reported that their school had implemented an evidence-based program designed to teach students social and emotional competence (Atwell & Bridgeland, 2019). Echoing these findings, a second national survey of educators found that more than 70% of principals designated social and emotional competence a top priority (Hamilton et al., 2020). Both surveys found that 60% to 70% of educators believe social and emotional competence can and should be assessed. In addition, more than 70% of educators reported that they use some system to measure student social and emotional competence.
Most educators in these surveys reported using behavioral administrative records or student or teacher perception surveys to assess social and emotional competence. Furthermore, Atwell and Bridgeland (2019) reported that educators expressed a desire for better assessments. Other recent reports argued that social and emotional competence assessments should be able to guide decision-making about what to teach to whom, and to monitor acquisition of skills, much in the way that high-quality reading and math assessment data can both inform instruction and measure learning of the subject (Assessment Work Group, 2019; McKown, 2019; McKown & Herman, 2020). Administrative records and surveys of student and teacher perceptions may be limited in their ability to achieve these instructional goals.
This places educators at a disadvantage—they are increasingly expected to teach social and emotional competence, yet they have no efficient way to know what competencies to teach to what students and when. In addition, it is difficult to ascertain the extent to which students are developing the competencies educators intend to teach. Most educators would find it difficult to teach math and reading effectively without good assessment data. Social and emotional competence should be no different; nevertheless, assessing student social and emotional competence school-wide is not easily accomplished with many existing measures, and direct assessments are in short supply.
To address the gap, we created SELweb Early Elementary (“SELweb EE”), a web-based system for directly assessing social and emotional competence in kindergarten through third grades (McKown, Russo-Ponsaran, Johnson, et al., 2016; Russo et al., 2018). SELweb EE presents items and response options pictorially with audio narration and few written words. Instructions and all items are audio narrated. Once the assessment is launched, children interact independently with the subtests, generally wearing headphones to reduce disruption to other children. Because it is essentially self-administering, SELweb EE is well-suited for group administration.
SELweb EE can be completed in English or Spanish and includes five subtests that assess four important components of social and emotional competence—emotion recognition, social perspective taking, social problem solving, and self-control. The emotion recognition subtest presents pictures of child faces and asks respondents to select one of four possible emotions (happy, angry, sad, and scared) or “just ok” to indicate what the face is showing. The social perspective-taking subtest presents illustrated and narrated vignettes. For each vignette, children answer a question about a story character’s words, actions, or intentions—to get each question correct requires respondents to correctly infer the characters’ mental states. The social problem-solving subtest presents illustrated and narrated vignettes about hypothetical problematic peer entry and ambiguous provocation situations. Children are asked to measure different dimensions of their social problem solving, including the degree to which they attribute hostile intent to a provocateur’s, what goals they gravitate toward (prosocial or retribution oriented), and their preferred solution. Using game-like formats, two self-control subtests assess how well children can delay gratification and tolerate frustration. The delay of gratification subtest asks children to tolerate boredom in the service of maximizing the accumulation of points over the course of 10 trials. The frustration tolerance subtest measures children’s ability to perform a simple discrimination task while the response buttons periodically appear to be nonresponsive. Because the child needs to get as many items correct within a 90-second window, this glitch induces mild frustration.
Prior studies established that SELweb EE (a) factor scores demonstrated reliability at or above .80; (b) subtests adhered to a theoretically coherent factor structure; (c) factor scores demonstrated convergent and discriminant validity; (d) performance was associated with teacher-reported social behavior, academic achievement, and peer nominations; and (e) scores demonstrated measurement equivalence across sex, ethnicity, and separate administrations (McKown, 2018; McKown, Russo-Ponsaran, Johnson, et al., 2016).
One limitation of SELweb EE is the time it takes students to complete. In a large-scale implementation of SELweb during 2017-2018, educators reported total assessment durations of approximately 45 minutes. We analyzed meta-data from that implementation and found that SELweb EE requires an average of 36.2 minutes for students to complete, with 90% of students completing the assessment in 54.9 minutes or less. Although this is a relatively brief assessment, some students, particularly kindergarteners and first graders, require two sittings to complete the assessment. Thus, the assessment may not always fit neatly within the scheduling constraints of research studies, clinical visits, or school schedules. One of the lasting legacies of the No Child Left Behind period is an enduring wariness about spending time on testing that does not directly benefit teachers and students (Brown et al., 2016). SELweb EE users regularly indicated that it can be challenging to find the blocks of time necessary to administer SELweb EE. From a usability perspective, therefore, it would be beneficial to shorten the duration of SELweb EE. The goal of this article is to discuss the development and validation of a short form of SELweb EE.
The limitations associated with shortening assessments are well-known. A reduction in items generally reduces reliability, increases measurement error, and risks inadequate construct coverage, undermining validity. Thus, we aspired to strike a balance between brevity and psychometric rigor when creating the short form of SELweb EE. Of the five SELweb EE subtests, the three longest were the emotion recognition subtest, the social perspective-taking subtest, and the social problem-solving subtest. The two self-control subtests were already brief and did not lend themselves well to reduction. We therefore focused on reducing the number of items in the emotion recognition, social perspective-taking, and social problem-solving subtests to reduce total test duration. We used a combination of conceptual and empirical approaches, as described in the Methods section, to reduce the number of items and overall length.
Goals in Relation to Prior Work
Our prior work established that SELweb EE filled a gap in the availability of social and emotional competence assessments for the early elementary grades. Based on feedback from users, this work surfaced a new challenge—to produce a technically sound assessment in less time to increase its feasibility for educational use. Accordingly, we sought to modify SELweb EE so that it can be completed in no more than 30 minutes.
Study 1
In Study 1, we first used archival SELweb EE data from two large and demographically diverse data sets to test reducing the number of assessment items while maintaining comparable technical quality. To do so, we reduced items using procedures described in the Methods section. We then compared the Rasch item fit, item discrimination, and item difficulties of the long and short forms, and compared test information functions (TIFs). We evaluated the psychometric properties of the three revised SELweb EE subtests (emotion recognition, social perspective taking, and social problem solving) through evaluations of score reliabilities, factor structure, convergent and discriminant validity, and criterion-related validity.
It is important to note that the Rasch analyses of the emotion recognition and social perspective-taking subtests reported in Study 1 largely mirror analyses previously reported in Aksu, McKown, and Smith (2018, 2020). The application of the results from the analyses in this article, however, are new—whereas Aksu et al. (2018, 2020) were establishing the use of Rasch to evaluate the psychometric properties of each subtest and to test for differential item functioning, in this article, we use a Rasch approach to evaluate the extent to which item and test characteristics from the long and short form of SELweb EE are comparable.
Methods
Sample and Recruitment
Data from two field trials (Field Trial 1, n = 3,223 children; Field Trial 2, n = 4,419 children) were analyzed. Field Trial 1 included 17 schools from six urban and suburban school districts in two states tested during 2013-2014. Field Trial 2 included 20 schools from three urban and six suburban school districts in five states who were tested during 2014-2015. Sample characteristics are summarized in Table 1.
Sample Characteristics.
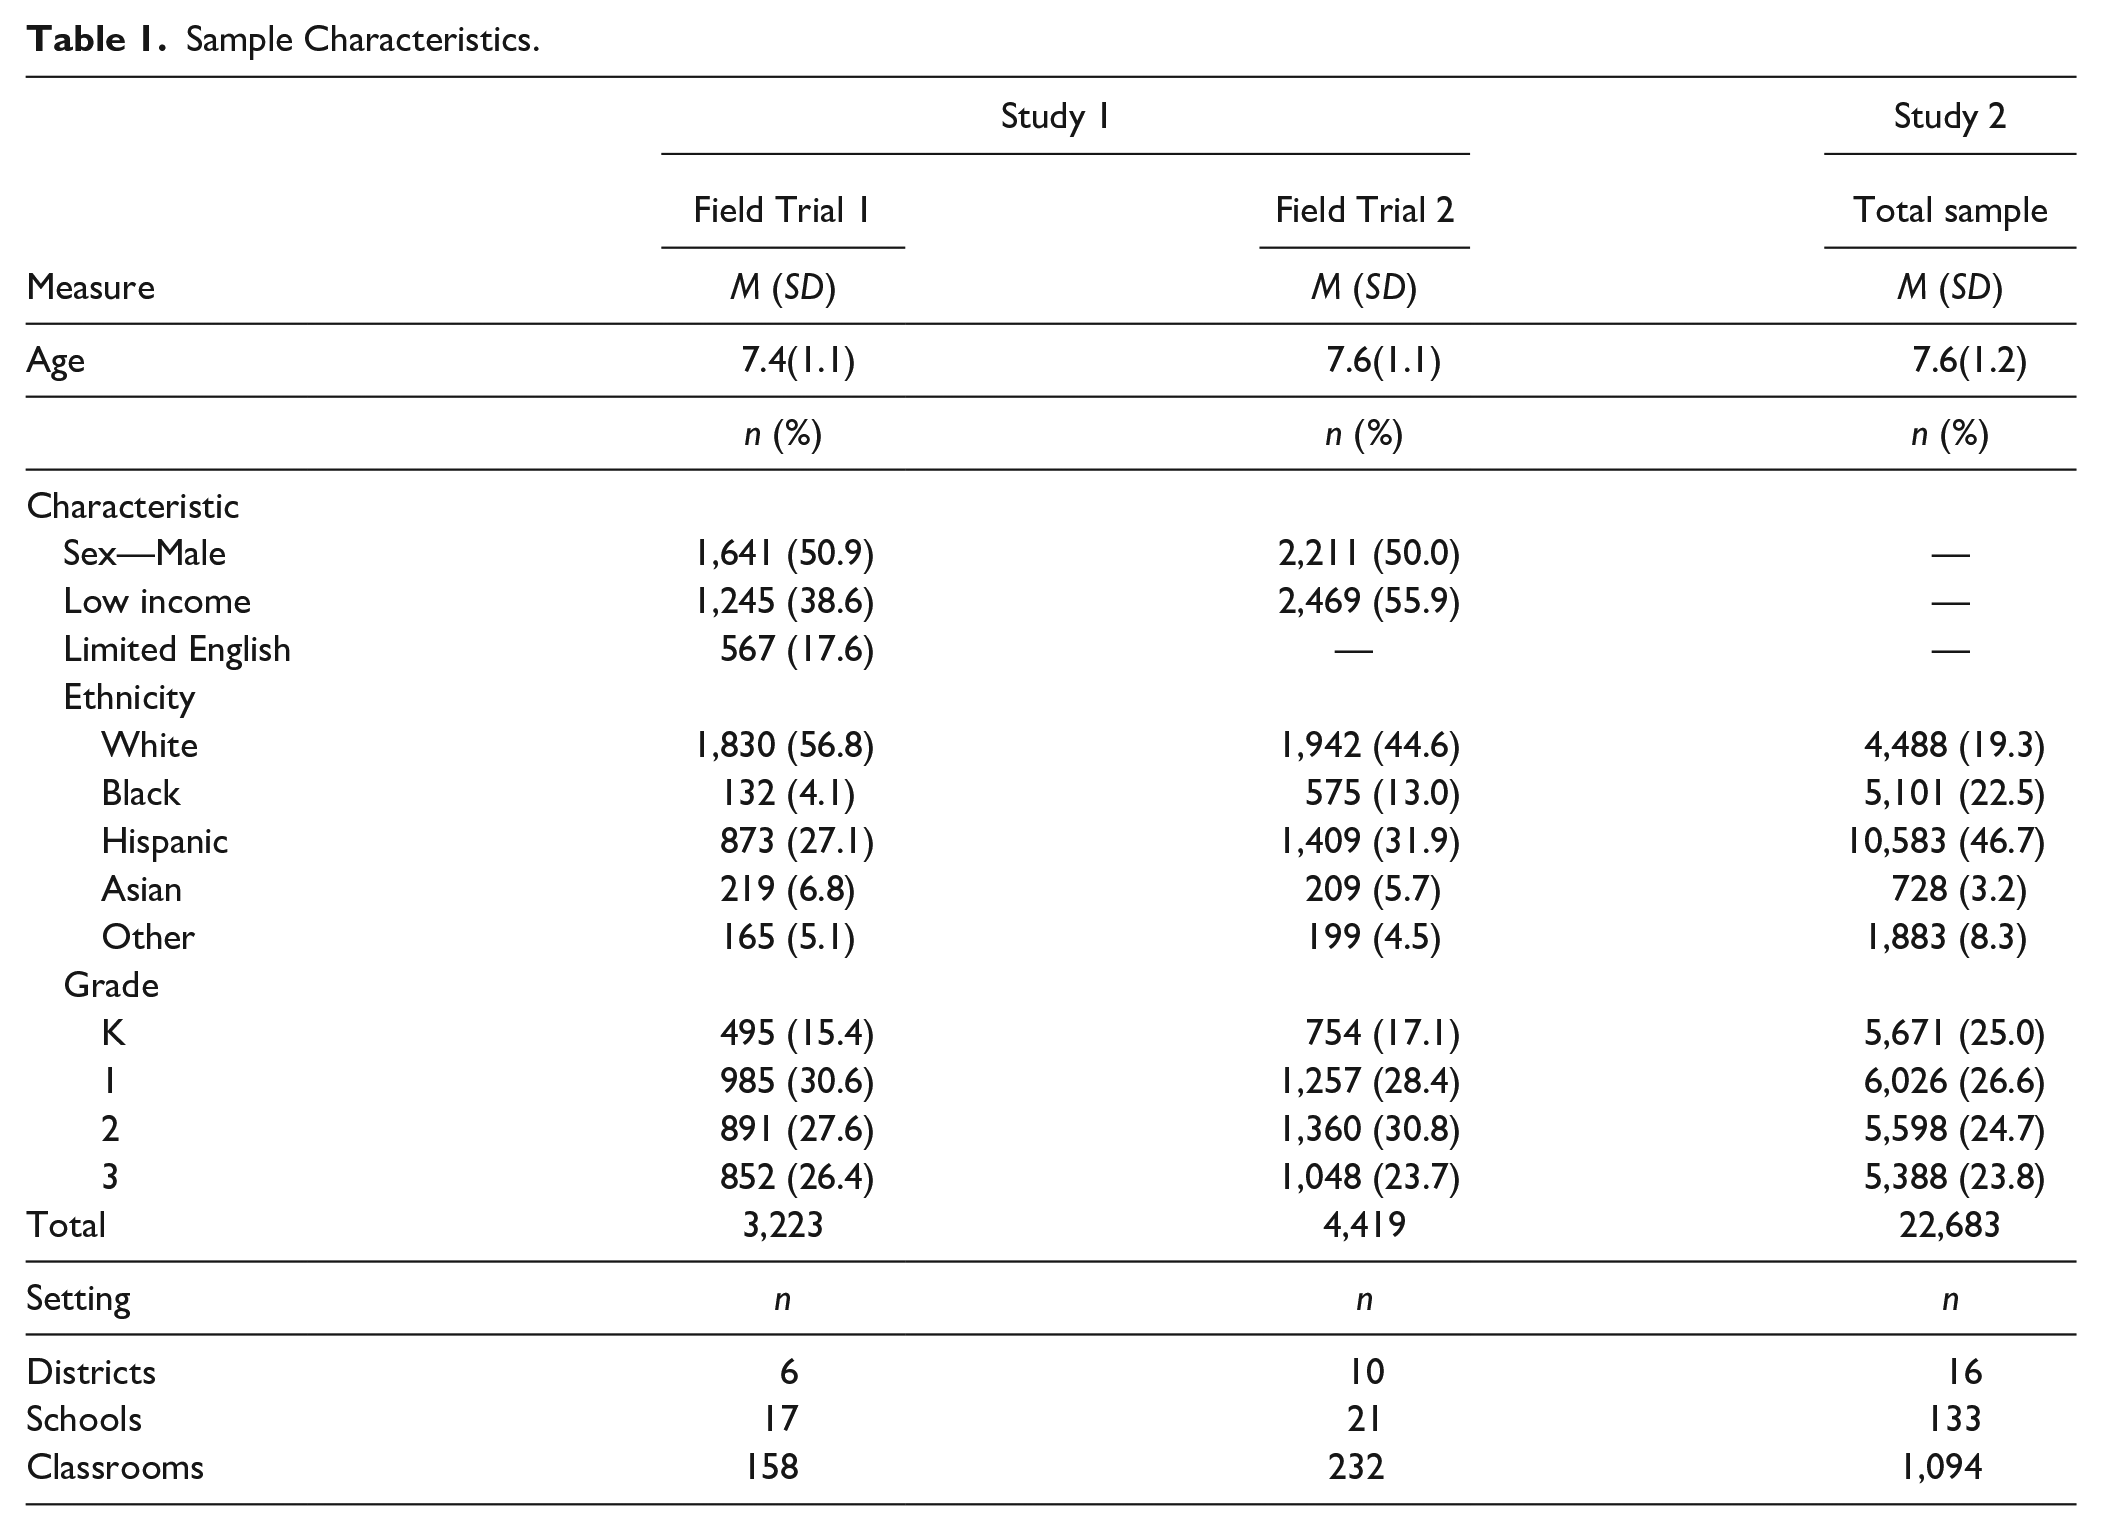
A single district from Field Trial 1 participated in an add-on validation study that included (a) teacher rating scales and alternative SEL assessments and (b) repeat administration of SELweb EE to estimate 6 months temporal stability (Mtime difference = 175 days, range = 171-186) in a subset of schools. The add-on study participants included 220 children in kindergarten through third grades. Add-on study participants did not differ from the rest of the sample in terms of age or sex. Participants were significantly more likely to be Hispanic in the add-on cohort (63.6%) than in the remainder of the sample (27.1%) and less likely to be White (28.6% vs. 56.8%), Black (0.9% vs. 4.1%), or Asian (5.0% vs. 6.8%).
Participating school districts in Field Trial 2 administered SELweb EE in the fall and in the spring, permitting a temporal stability estimate over approximately six months (Mtime difference = 177 days).
Procedures
School personnel administered SELweb EE in one or two group sessions. Children completed SELweb EE on an internet-connected device with a web browser. Because SELweb EE is narrated, children wore headphones while they completed the assessment. Instructions are embedded as part of the assessment and thus did not differ across groups or administrations. Audio narration for instructions and response buttons were included so that children who could not read could still interact meaningfully with the assessment. To prepare for testing, research staff trained school personnel to ensure a smooth administration process, including “dry runs,” reviewing how students log into the system, and testing whether bandwidth was sufficient. School administrators then selected the time of day and setting in which to assess their students. Students typically completed SELweb EE in their classroom, in the school library, or in a media lab. A teacher or other school staff (e.g., social worker, psychologist, or librarian) proctored the assessment, ensuring student compliance. Those school staff were told how to respond to student questions and were directed to provide minimal assistance outside of technical troubleshooting. For add-on study participants, research staff collected validation data, described below, from children whose parents consented to their participation.
Measures: SELweb EE Subtests for Reduction
SELweb EE subtests measure emotion recognition, social perspective taking, social problem solving, and self-control. We operationalized emotion recognition as the ability to recognize others’ emotions from facial expressions, social perspective taking as the ability to infer another’s mental state, and social problem solving as the ability to constructively interpret the meaning of, develop prosocial goals toward, and constructively resolve socially challenging situations. Finally, we operationalized self-control as the ability to delay gratification and stay on task when frustrated. Description of stimuli, response options, and scoring for all subtests are included in Table 2.
Description of SELweb EE Subtests, Questions, and Item Scoring.
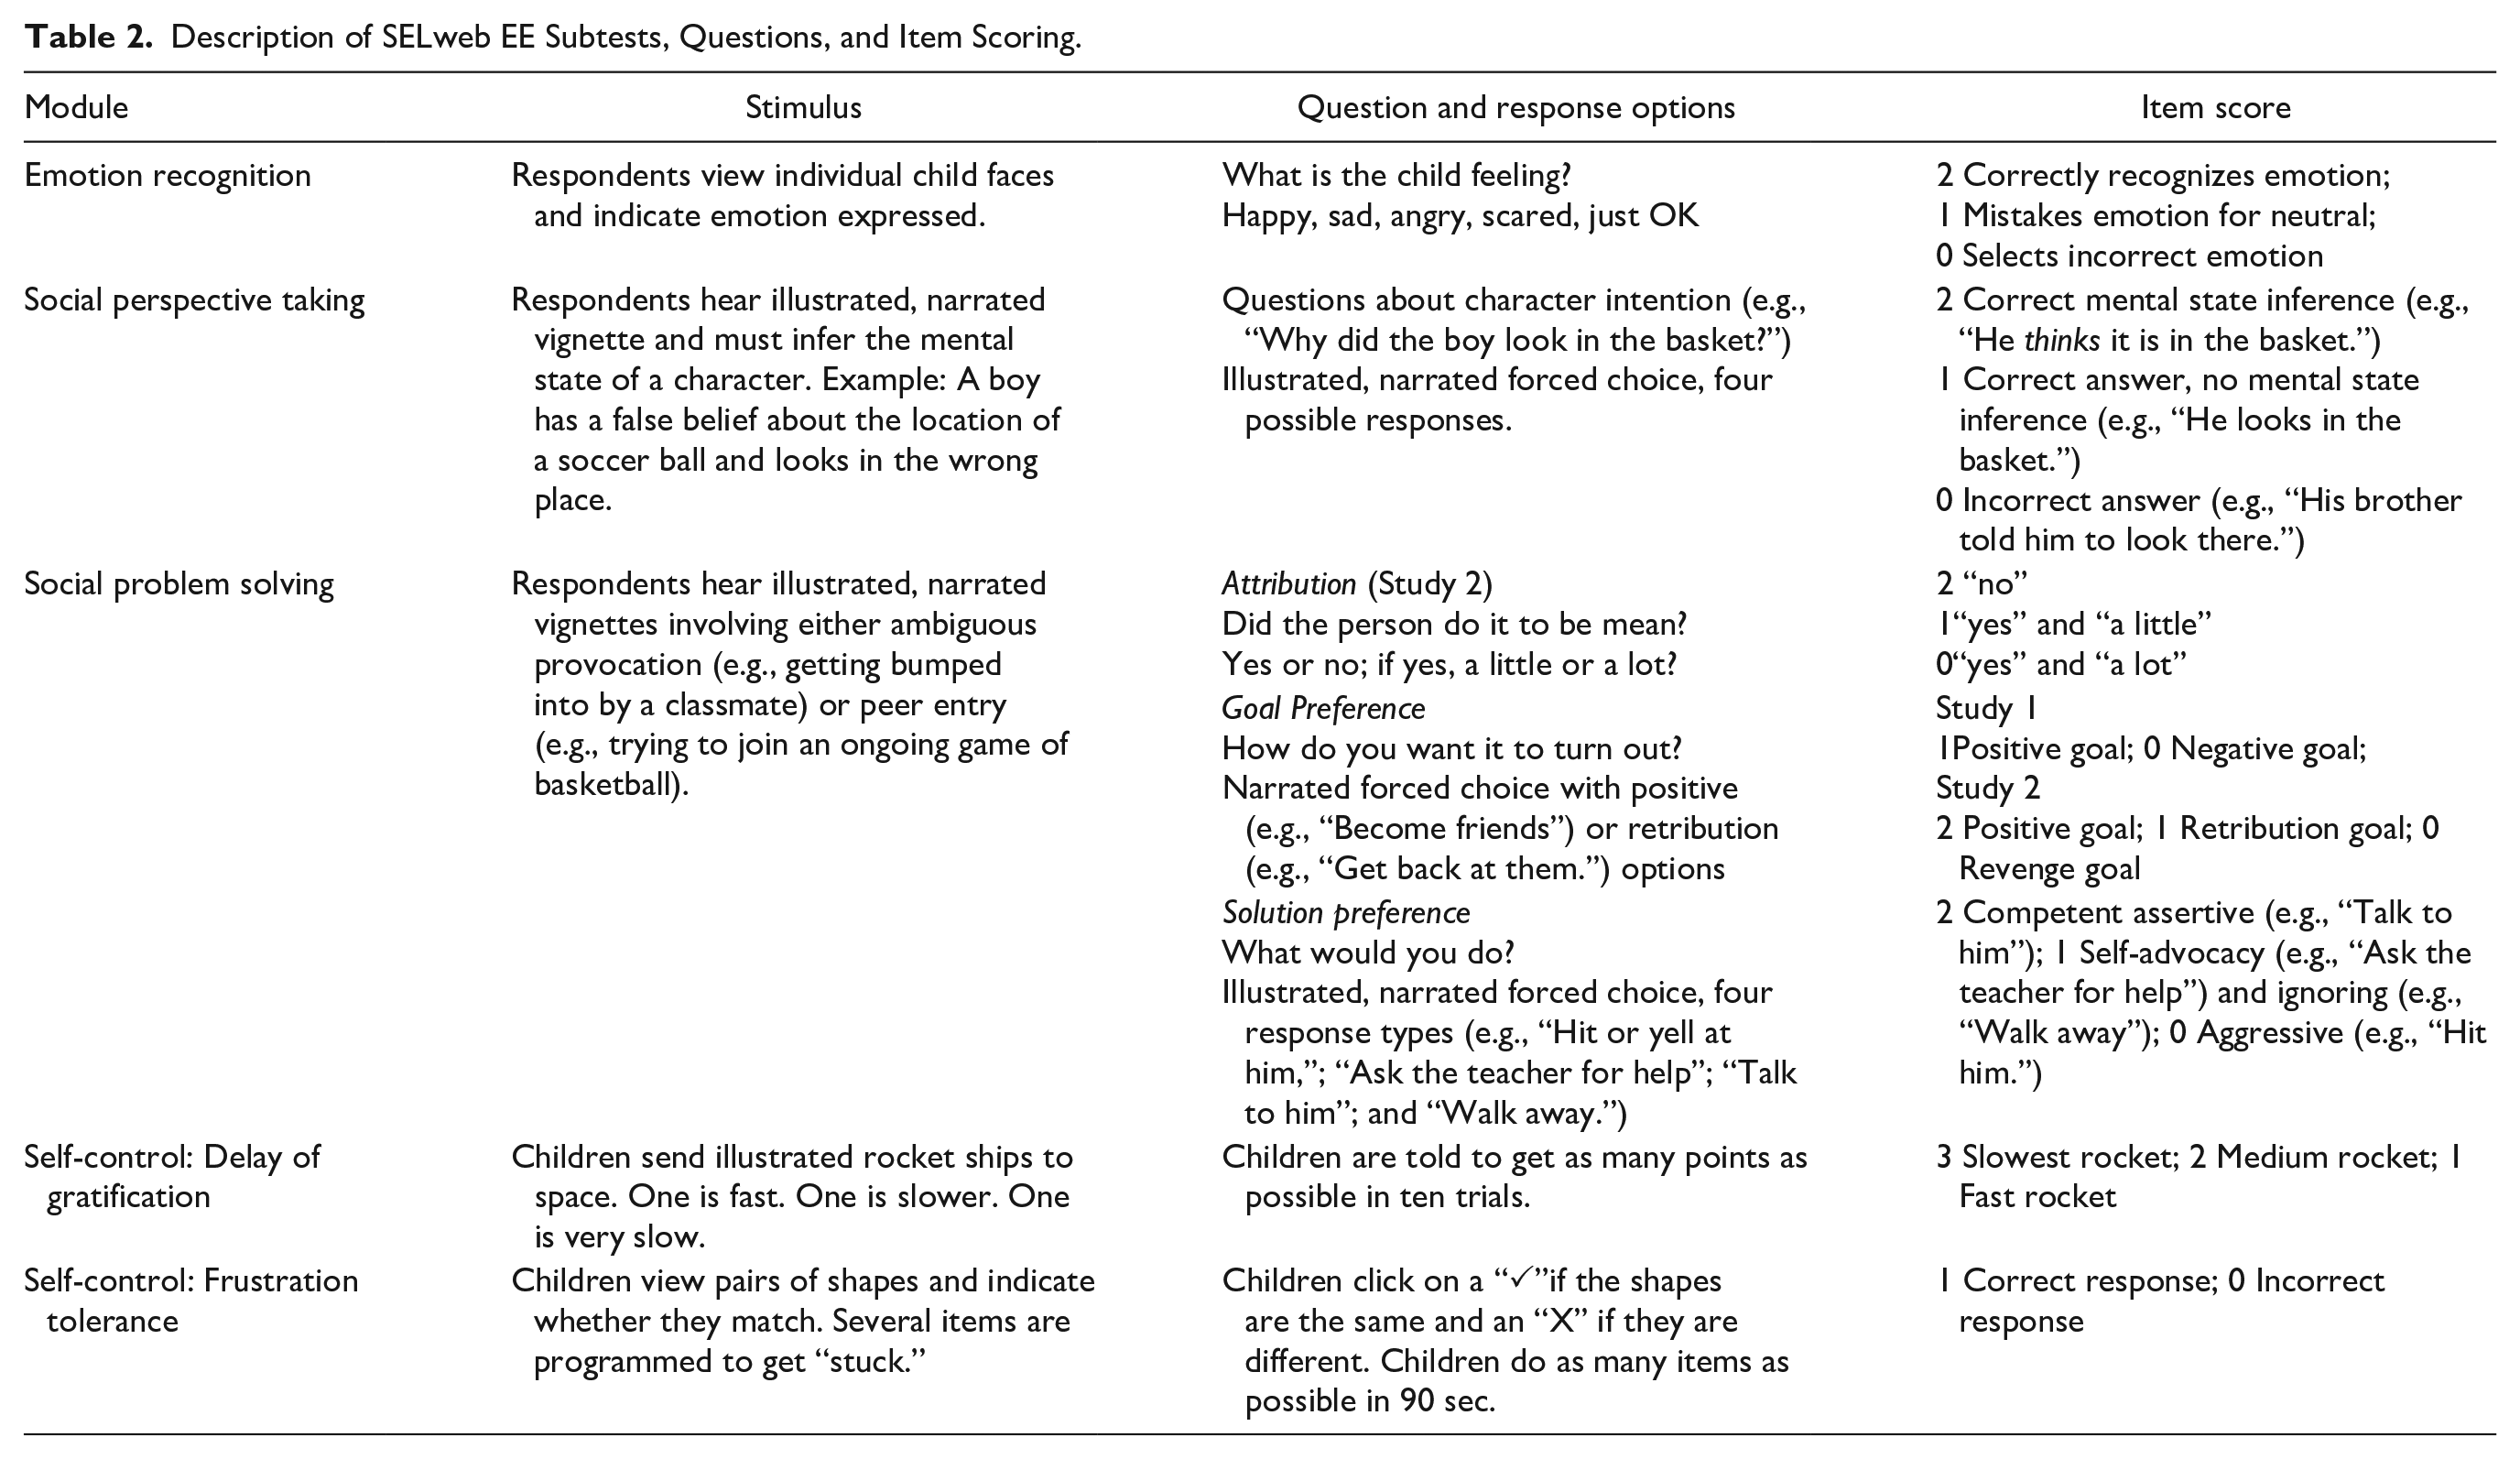
Emotion recognition
As described in McKown, Russo-Ponsaran, Johnson, et al. (2016), the emotion recognition subtest included digitized photographs of children’s faces that were altered into displays of happy, sad, angry, and frightened that varied in the intensity of the emotion display. The subtest included five alternate forms, each with 44 or 45 items. Each alternate form included a balance of emotions, intensities, and child faces. However, 16 to 20 items on each alternate form were included on more than one form, allowing forms to be linked in Rasch analyses. During this subtest, a face was presented and then the child clicked to indicate whether the face reflected being happy, sad, angry, scared, or just okay. After the child selected an emotion, their selection was narrated to them, and they would either change their answer or click an arrow button to advance to the next item. The system randomly assigns one of the alternate forms to each child.
Social perspective taking
The social perspective-taking subtest, based on the theory of mind and social perspective-taking literatures (Happé, 1994; Selman, 1980; Wellman & Liu, 2004), included 12 illustrated and narrated vignettes. During this subtest, images were presented on the screen as the story was narrated. Then, the child answered a question about a story character’s actions, words, or intentions. The correct response required the child to infer the story character’s mental state. Some of the items evaluate respondents’ understanding that a character holds a false belief. For example, in one story, a character mistakenly believes a toy box contains toys, when in fact it contains books. The respondent has been made aware of the contents of the box. Correctly inferring the story character’s false belief requires the respondent to understand that the character has a different belief than the respondent—we refer to these as “false belief” items. Other items evaluate children’s ability to distinguish between a character’s real emotions and their apparent emotions—we refer to these as “real-apparent emotion” items. For example, in one story, a character is disappointed about a birthday gift but pretends to like it to spare the gift-giver’s feelings. To correctly infer why the character said one thing when she meant something different, the respondent is required to understand the story character’s intention. This subtest existed in a single form, resulting in all children completing all 12 vignettes.
Social problem solving
The social problem-solving subtest included illustrated and narrated vignettes involving ambiguous provocation peer entry. Children were asked to imagine they were in the situation and were asked as follows: (a) whether a story character was being intentionally mean, and if so, how much (assessing hostile attribution); (b) how they would want the situation to turn out (assessing goal preference); and (c) what they would do (assessing solution preference). This subtest comprised four alternate forms with six vignettes each. Each alternate form included three ambiguous provocation vignettes and three peer entry vignettes. Each vignette was included on three alternate forms to create a linking design.
SELweb EE Subtests Not Reduced
Self-control
Self-control was assessed with two subtests. One subtest was a delay of gratification task (Kuntsi et al., 2001). For this subtest, children were given 10 opportunities to choose between three animated rocket ships that launched and an animated planet on the screen. One rocket ship was fast and worth one point. A second was slower and worth two points. A third was very slow and worth three points. Children were instructed to get as many points as possible across 10 trials. We also developed a frustration-tolerance task (Bitsakou et al., 2006). For this task, children completed a 90-second shape-matching task. At several points in the subtest, the task was programmed to pause, simulating a computer glitch. Because of the timed component, this pause induced mild frustration. The self-control subtests each existed as a single form, and their design was such that they were not shortened. Because of this, analyses of the self-control subtests were not included in Study 1.
Add-On Study Validation Measures
In both data sets, we coadministered validation measures to a subset of students who completed SELweb EE.
Emotion recognition
As an alternate measure of emotion recognition, we used the U.C. Davis Set of Emotion Expressions (Tracy & Robins, 2004). Children viewed 18 randomly presented photographs of people and indicated whether the emotion expressed in each photograph matched a target emotion (happiness, sadness, anger, or fear). Children received 1 point for correctly responding. Internal consistency (Cronbach’s α) reliabilities for four emotion scores ranged from .68 to .91 in our sample.
Social perspective taking
As an alternate measure of social perspective taking, children completed six vignettes from the Strange Stories (Happé, 1994). In each vignette, a character states one thing but intends something else. Children were asked why the character said what they said. Children received 1 point for correctly inferring the speaker’s intention. Final score on Strange Stories was the summed item scores. Cronbach’s α was .71 in our sample.
Social problem solving
As an alternate measure of social problem solving, children completed a custom-made assessment using four vignettes from the Social Information Processing Application (SIP-AP; Kupersmidt et al., 2011), a video-based measure of social problem solving. Following each vignette, children answered questions drafted by the study team assessing hostile attribution, goal preference, and solution preference. Scores were keyed such that a higher score reflected more positive attribution. Total score for each question was the sum of scores across vignettes. Cronbach’s α for three SIP-AP scores ranged from .50 to .82.
Behavior
Teachers completed the Devereux Student Strengths Assessment–mini (DESSA-mini; Naglieri et al., 2014), an eight-item questionnaire in which teachers rate the frequency of behaviors reflecting social and emotional competence. Cronbach’s α for the DESSA-mini was .92 in our sample.
Peer nominations
SELweb EE includes an optional peer nomination subtest that was administered in four Field Trial 1 districts. For this subtest, children viewed photos or classmate’s names. A synthesized voice reads each child’s name as it appeared. Respondents clicked on as many classmates who they liked or who they liked to spend time with. Each child’s score was represented by a within-class standardized number of nominations.
Subtest Shortening Procedures
We aimed to reduce the number of items and subtest lengths of the emotion recognition, social perspective-taking, and social problem-solving subtests while maintaining item coverage and item technical quality. We first describe how we reduced the number of items on each subtest, and then describe how we evaluated the technical properties of the long and short forms of each subtest.
Subtest shortening
For the emotion recognition subtest, within each of the four emotion categories (happy, sad, angry, and scared) on each alternate form, we eliminated five items varying in item difficulty and ethnicity of the child depicted, resulting in four 20-item alternate forms (50% reduction). For the social perspective-taking subtest, we replicated findings from Aksu et al. (2018) who used a Rasch approach to examine item functioning in this subtest and applied those findings to a novel purpose—creating a shorter assessment. Consistent with findings from Aksu et al. (2018), we identified four items whose difficulty was similar to another and excluded it based on redundancy. The resulting subtest included eight distinct items (33% reduction). The resulting short form contained three items from the Real-Apparent category and five items from the False Belief category. For the social problem-solving subtest, we eliminated two vignettes from each of the alternate forms—one ambiguous provocation vignette and one peer entry vignette—leaving two of each kind of vignette in each alternate form (33% reduction).
Rasch analyses
Our goal was for items on the short form of SELweb EE to adhere to conventionally acceptable Rasch item fit, item discrimination, and item difficulty, and to display TIF curves and score reliabilities comparable to the original assessment. Using the Rasch framework (Rasch, 1960), each item’s technical quality can be assessed via fit indices. Outfit mean square indicates the degree to which variation in item responses can be explained by the measurement model (Linacre, 2008, 2021). Higher outfit mean square values indicate greater unmodeled variation, or noise, in response to each item. Outfit mean square indices have an expected value of 1.00; values that are greater than 2.00 reflect items that distort the measurement system and inferences made from scores (Smith et al., 1998). Per Smith et al. (1998), items with an Outfit mean-squared statistics value above 2.00 were flagged as misfitting.
In addition, we analyzed item discriminations, or the ability of an item to differentiate individuals with different ability levels. An assumption of the Rasch model is that all items exhibit the same item discrimination, which is 1.0. Empirically, however, item discriminations differ. Therefore, the amount of departure of discrimination from the expected value of 1.0 serves as an indication of item misfit. An item discrimination value greater than 1.0 means that the item discriminates between high and low performers more than expected for an item of this difficulty (overdiscrimination). A value less than 1.0 indicates that the item discriminates between high and low performers less than expected for an item of this difficulty (underdiscrimination).
Last, we reported the TIF of each score, assessing how well it measures a latent variable (θ). While interpreting TIF, attention is given to the peak and the width of the curve along the continuum (Boone & Staver, 2020). The peak represents the point where the test maximizes the information on the ability scale. The width indicates the effective range of the measurement for the scale (Linacre, 2021).
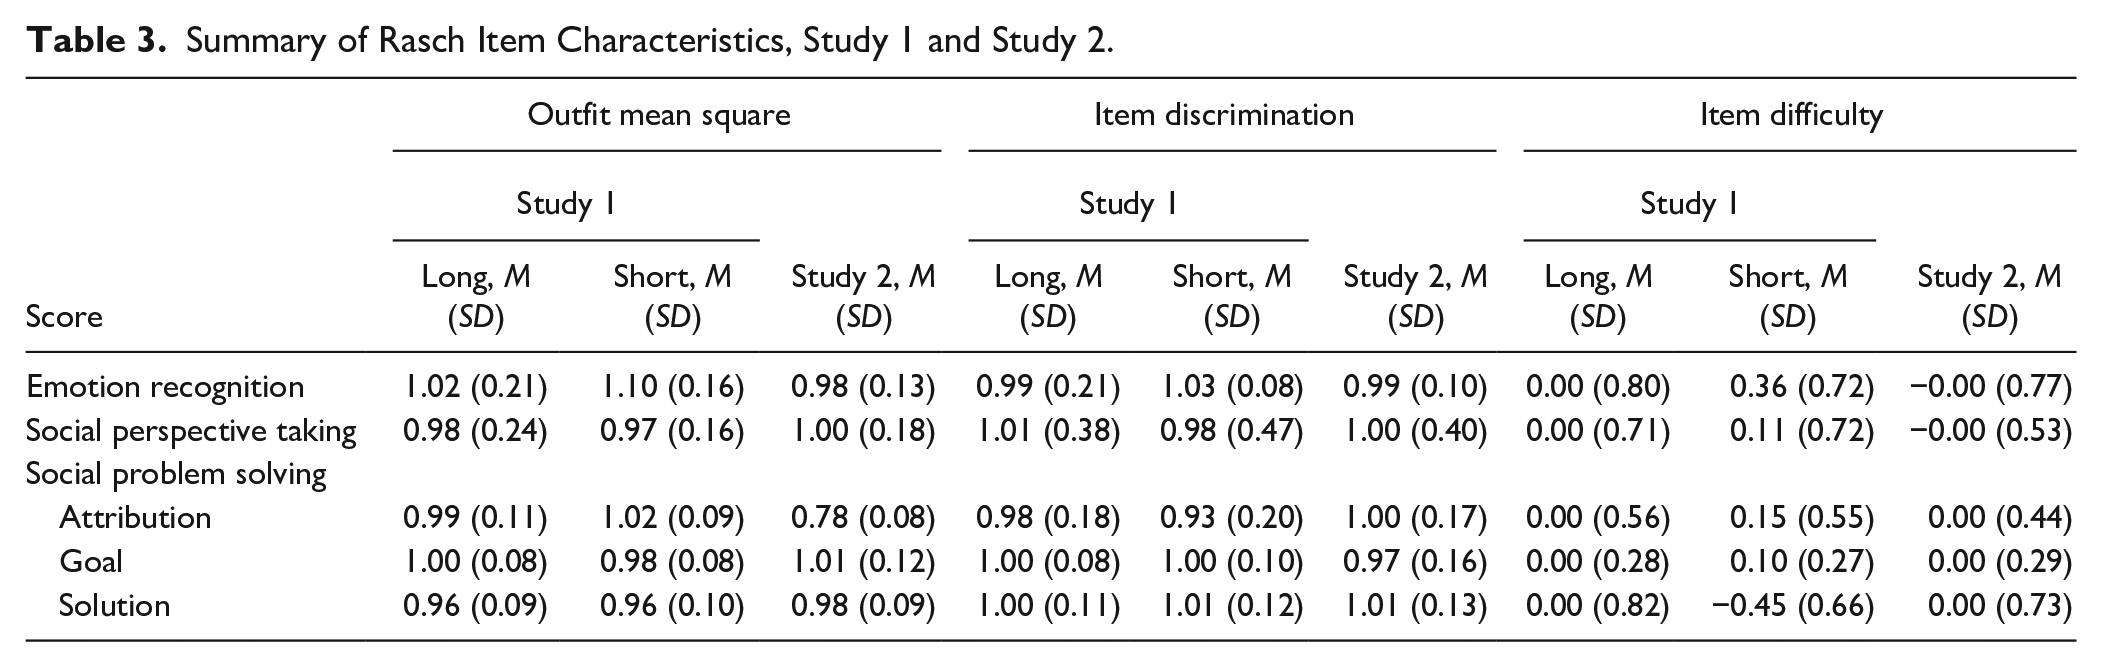
We used Winsteps version 3.92.1 (Linacre, 2021) to compute Outfit mean square, item discrimination, item difficulties and TIFs for the long-form and short-form versions of the assessment. Item characteristics can be found in Table 3. In all cases, average item Outfit mean square and item discrimination statistics reflected good item fit as described above, and no individual item fell outside of the parameters for good fit—indeed, variability in fit was quite low, reflecting consistency in item outfit mean square and item discrimination across the range of items within each subtest. Independent samples t tests found that none of the outfit mean squares, item discrimination, or item difficulty statistics were significantly different between the long and short forms. TIFs are shown in Figure 1. Peaks and widths of the TIFs are nearly identical in all cases, suggesting that scores from the long and short forms of SELweb EE provide similar information about children’s ability.
Summary of Rasch Item Characteristics, Study 1 and Study 2.
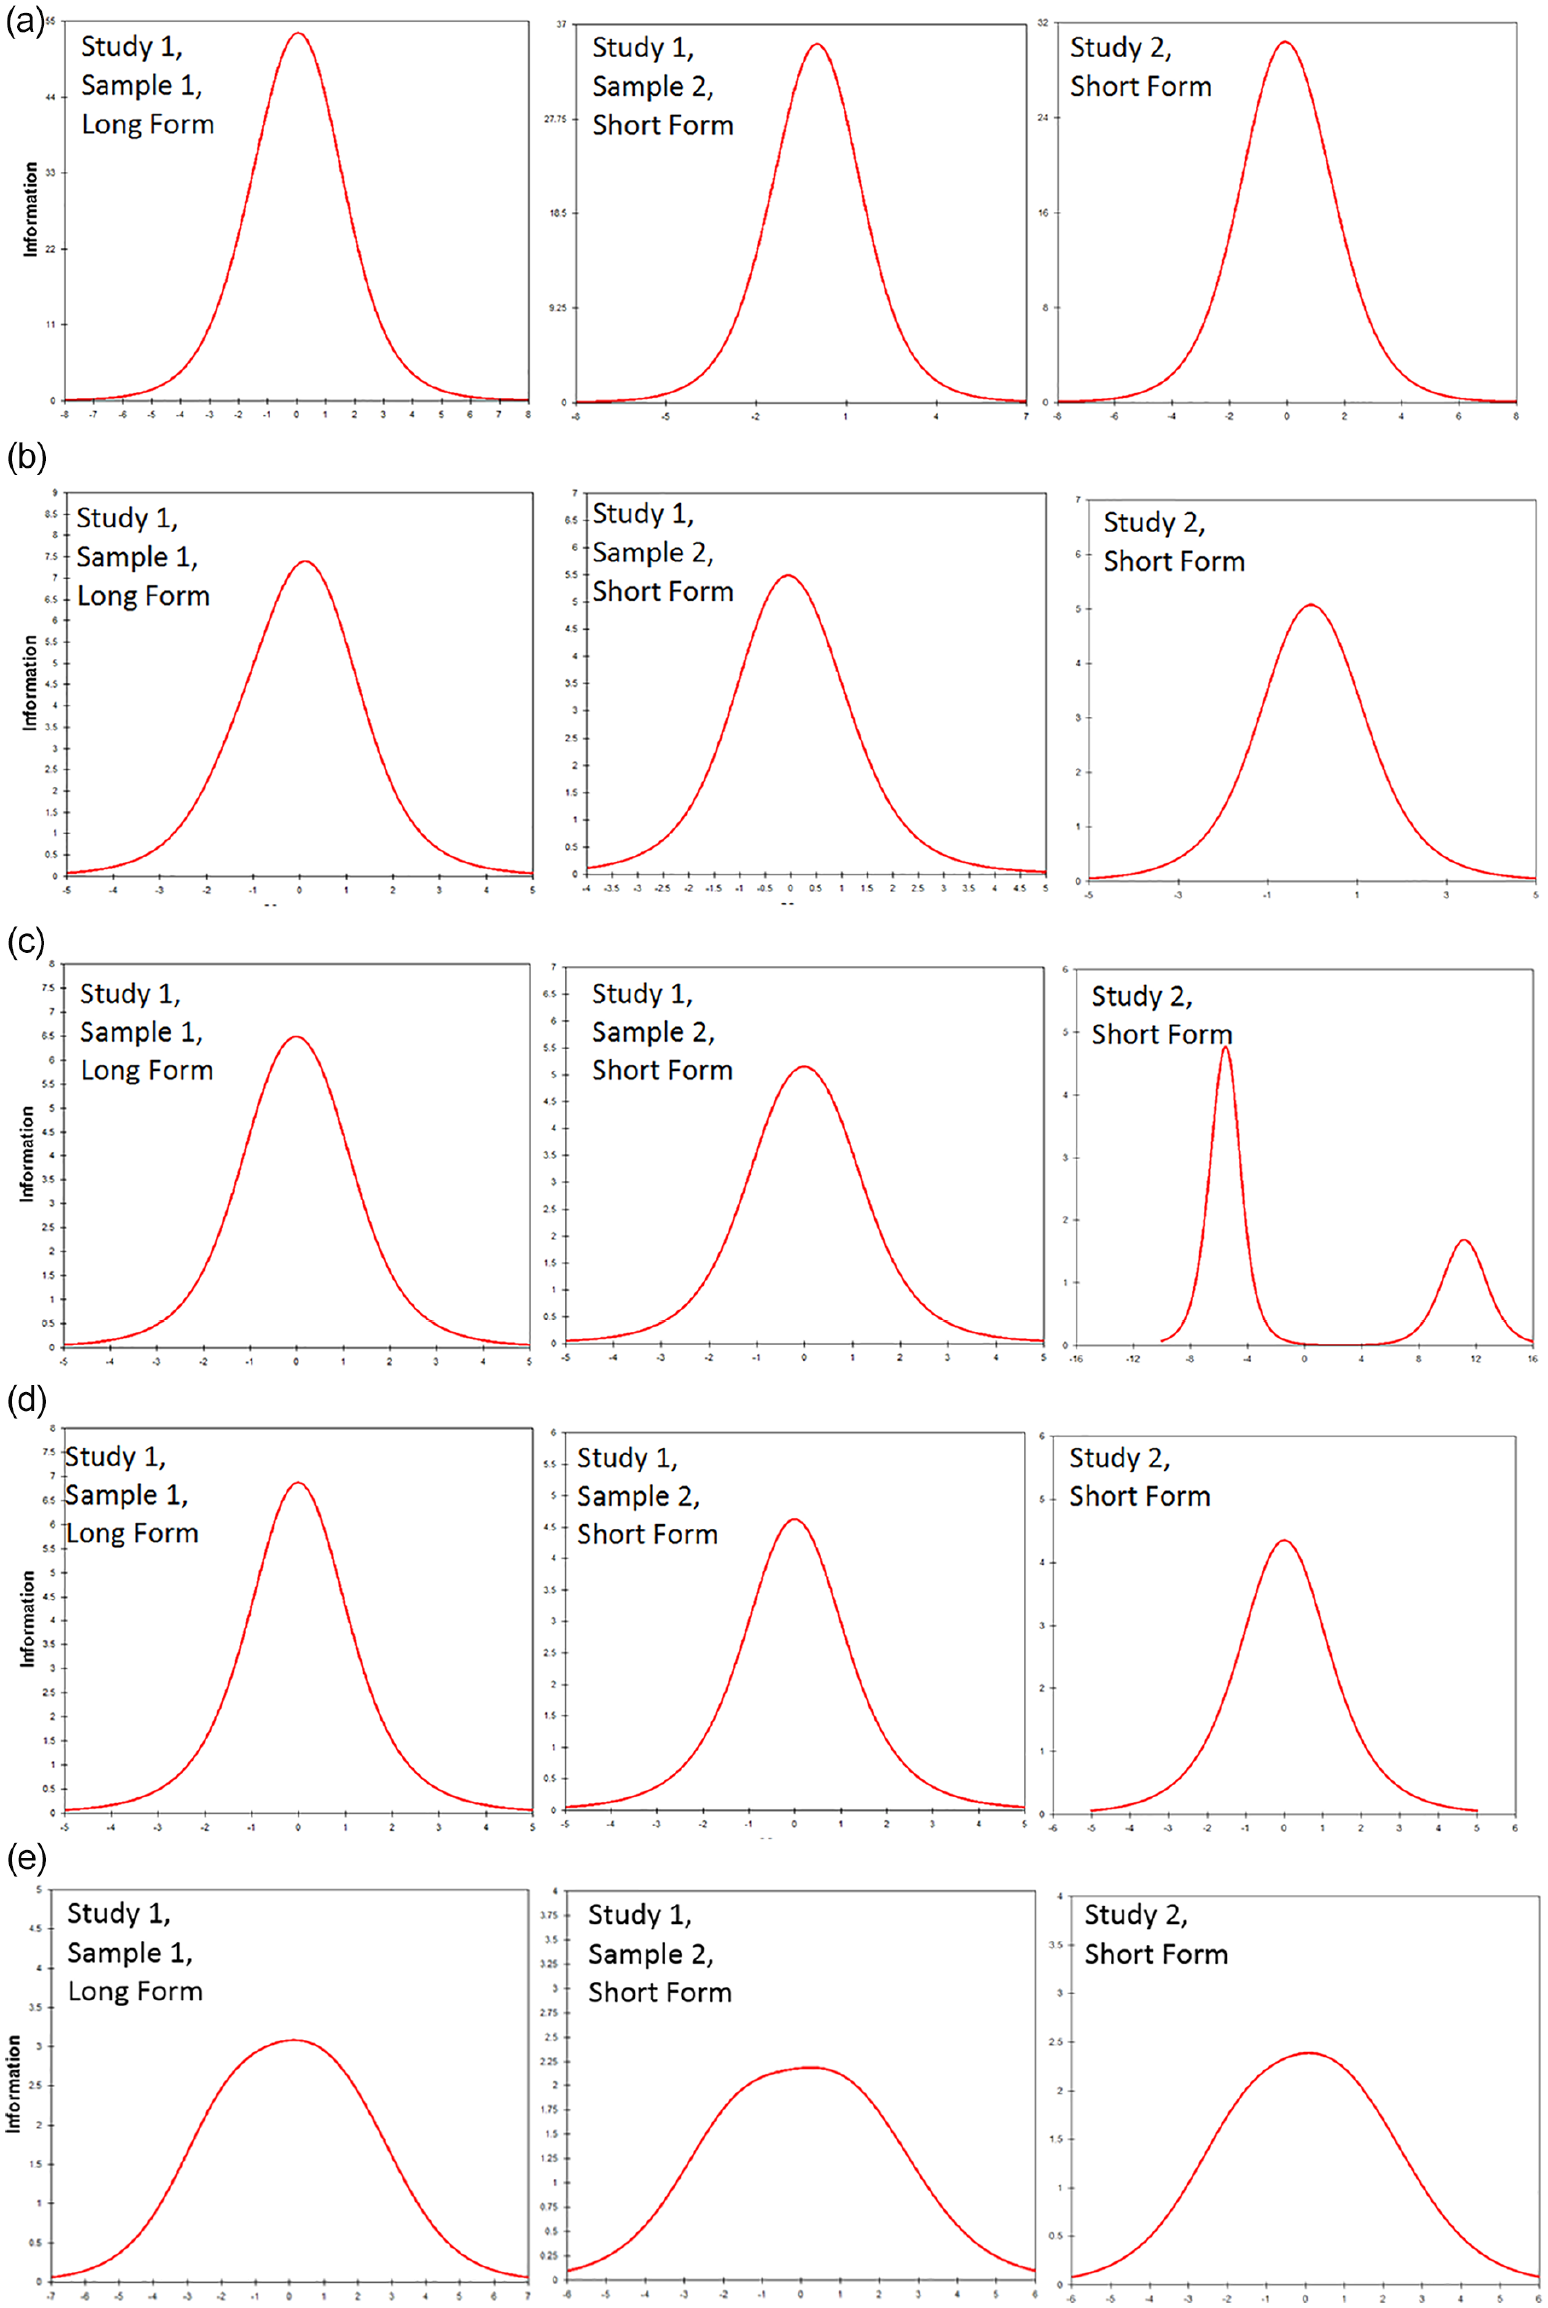
Test information function by observed score and form, Study 1 Samples 1 and 2, and Study 2.
We also computed correlations between Rasch person measures (reflecting performance on each assessment) from the long and short forms within each subtest. For emotion recognition, the correlation between Rasch person measure scores from long and short forms was r = .91. For social perspective taking, the correlation was r = .94. For social problem solving—attribution, the correlation was r = .98; for social problem solving—goal preference, the correlation was r = .95; for social problem solving—solution preference, the correlation was r = .95. These correlations further support the conclusion that the long and short forms of SELweb EE contain very similar information about student ability.
Results
Missing Data
For Field Trial 1, of 3,223 children who participated, 3,049 (94.6%) completed all SELweb EE subtests. Compared with students who completed SELweb EE, students who did not complete SELweb EE were significantly younger, 6.2 years vs. 7.7 years old, F(1, 3213) = 325.6 p < .05; achieved lower average raw scores on emotion recognition, z = −.18 vs. z = .01, F(1, 3213) = 5.5, p < .05; and social perspective taking, z = −.32 vs. z = .02, F(1, 3205) = 17.9, p < .05. There were no statistically significant differences in performance on social problem solving or either of the self-control subtests between those who did and did not complete SELweb EE. There were no statistically significant differences in child ethnicity between children who did and who did not complete all subtests of SELweb EE. Boys were overrepresented in children with missing data—61.7% of children with missing data were boys compared with 50.3% of children without missing data, χ2(1) = 5.2, p < .05. Of the six participating school districts, five achieved completion rates between 93.3% and 99.9%; the remaining district with 725 students had a completion rate of 78.6%. This latter district had a scheduling conflict that prevented the completion of data collection. For field Trial 2, fewer than 1% of children were missing any data. For both field trials because the proportion of children missing data was small and the sample was large, we opted to omit children missing any data from analyses (Widaman, 2006).
Score Reliability
We calculated the internal consistency and 6-month temporal stability of scores for the short form of SELweb EE. Emotion recognition, social perspective taking, and social problem solving were all derived from multiple alternate forms and scores. Internal consistency coefficients for each score were calculated and averaged across alternate forms. For the confirmatory factor analyses (CFAs), emotion recognition and social perspective taking were modeled with four and two item parcels, respectively. However, we conceptualized each score as the sum of item scores. As a result, for the emotion recognition and social perspective-taking subtests, we computed Cronbach’s α across the items within each subtest. In contrast, we conceptualized the social problem-solving score as a composite made up of three scores derived from the subtest. For social problem solving, we therefore first estimated internal consistency using procedures described by Nunnally and Bernstein (1994, p. 271), which yields a score approximately equivalent to Cronbach’s α. Those internal consistency reliabilities are summarized in Table 4. For social problem solving, we also computed McDonald’s omega for each study. Social problem solving ωs in both Study 1 samples were .76 and .74 for the long and short forms, respectively. Reliability statistics for SELweb are in Table 4.
Score Reliabilities.
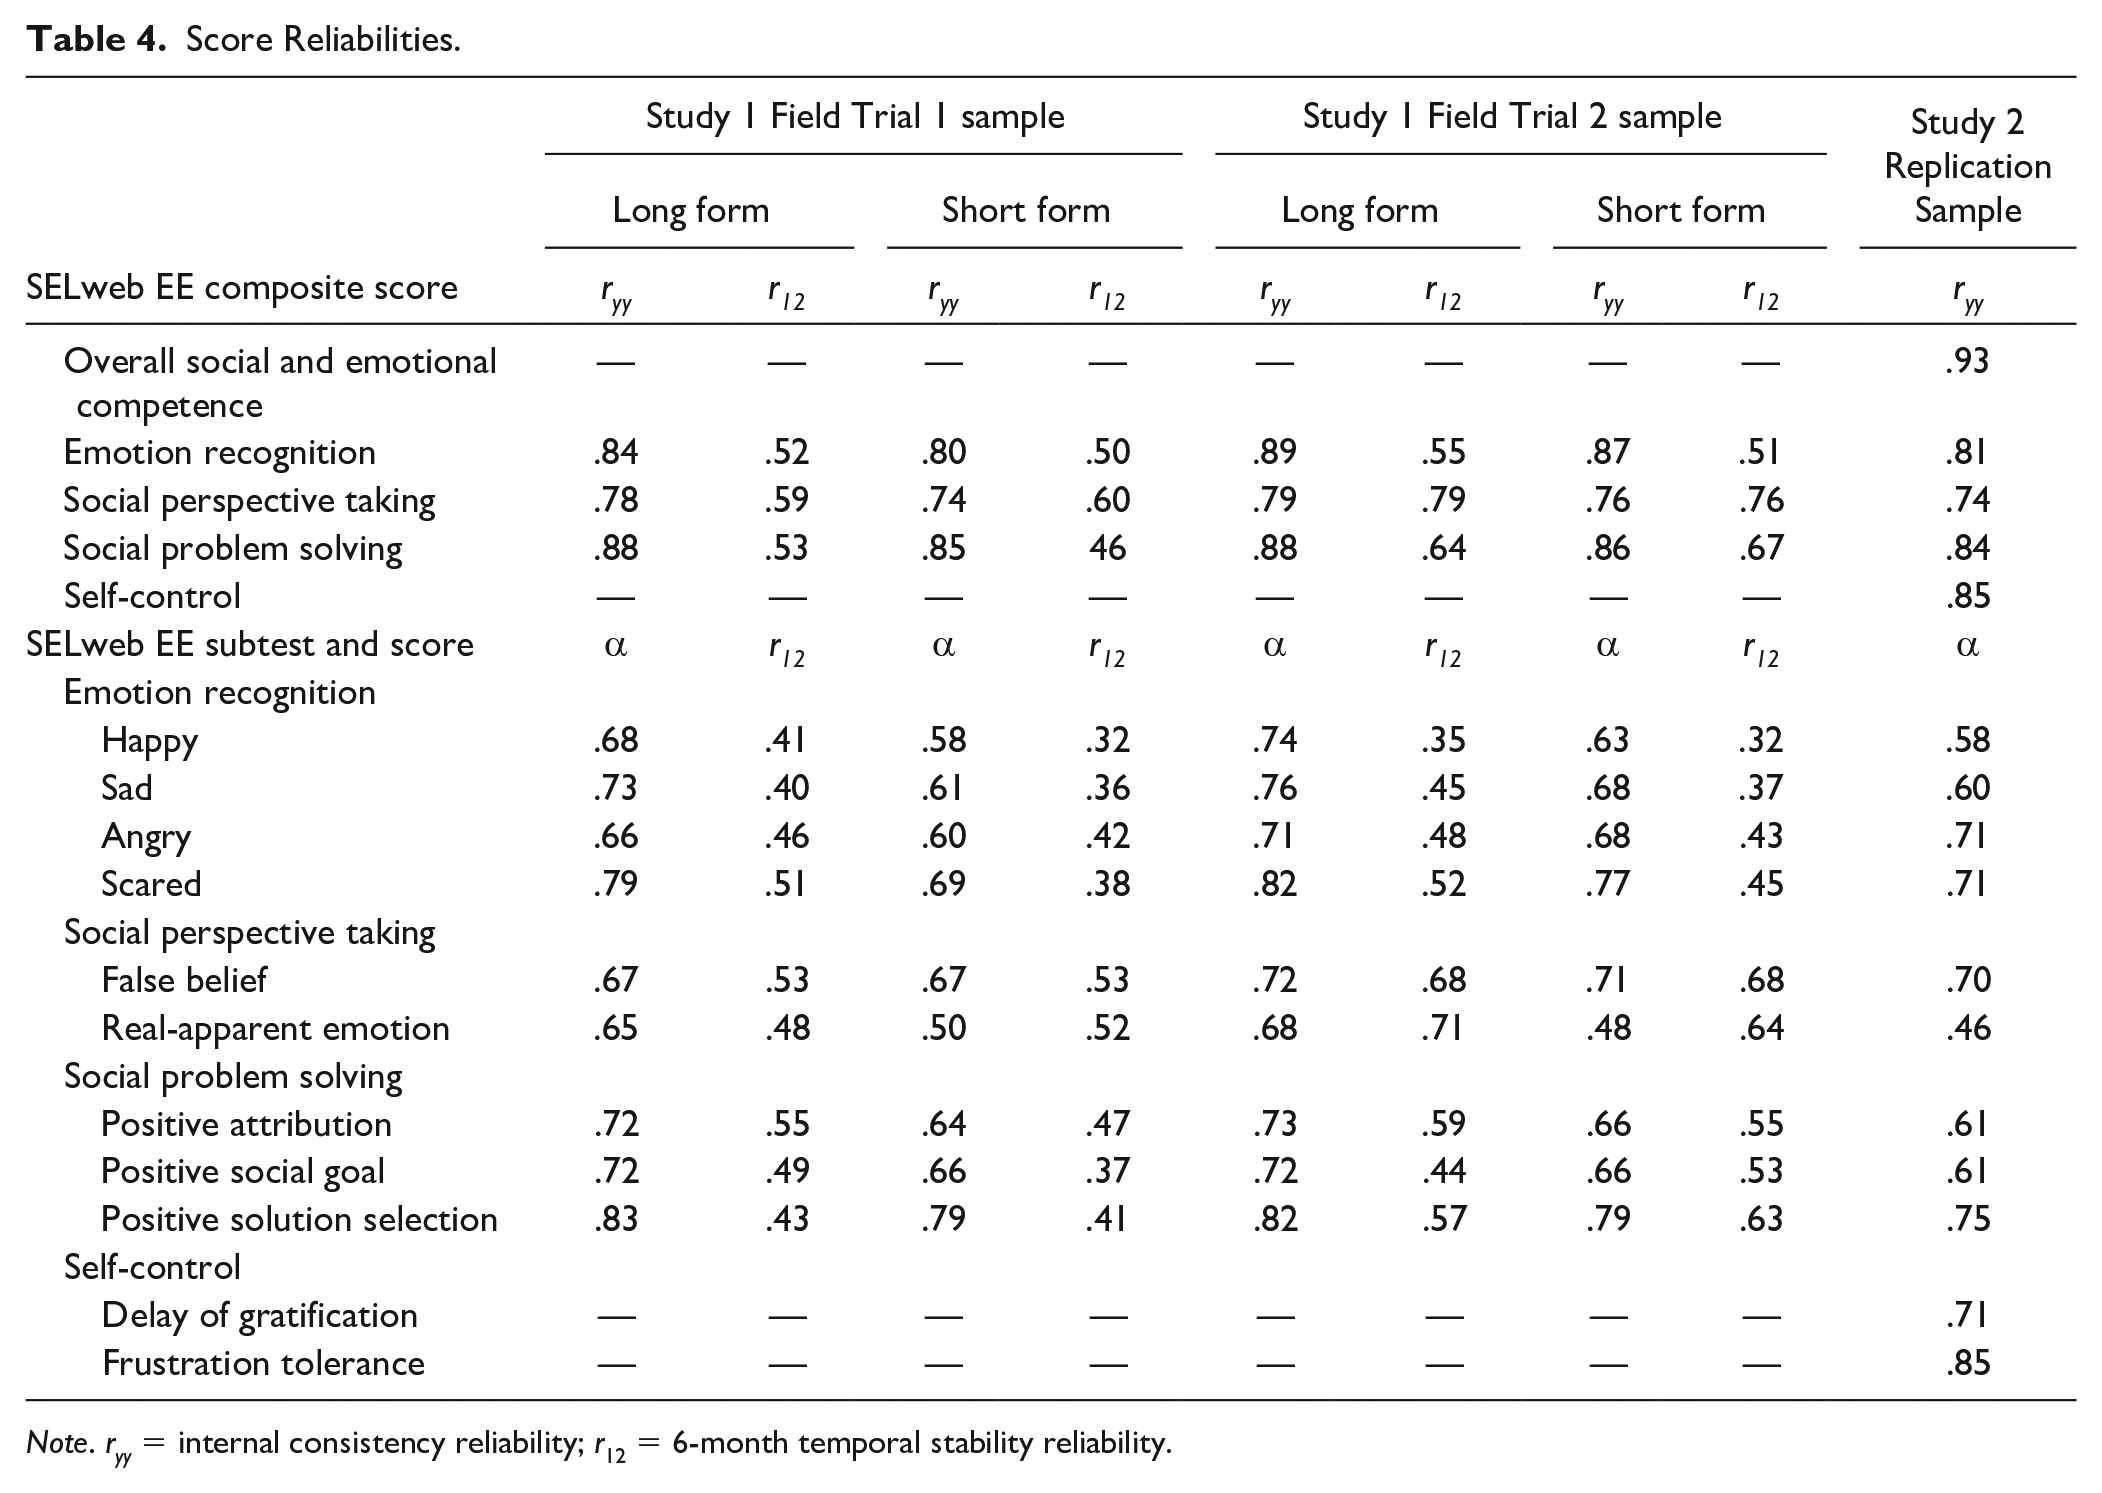
Note. ryy = internal consistency reliability; r12 = 6-month temporal stability reliability.
Factor Structure
Using Amos (24.0.0, Arbuckle, 2008) to run CFAs, we tested the fit of short form SELweb EE scores to a three-factor model of social and emotional competence in which emotion recognition, social perspective taking, and social problem solving reflect correlated latent variables. This factor structure is consistent with prior studies focused on SELweb EE (McKown, Russo-Ponsaran, Johnson, et al., 2016), but it omits the self-control subtests, which were not shortened. Consistent with Hu and Bentler (1999), the data were a good fit to the model if the comparative fit index (CFI) was ≥ .95 and the root mean square error of approximation (RMSEA) was ≤.06.
We conceptualized the emotion recognition and social perspective-taking scores as the sum of the item scores. For the purposes of CFA modeling, to reduce the number of observed scores in the model, we created item parcels for each subtest. Indicators for the “emotion recognition” factor include four scores—reflecting the sums of happiness, sadness, fear, and anger items. We included two item parcels for “social perspective taking.” One score reflected children’s performance on false belief items, and another reflected children’s performance on real-apparent emotion items. Indicators for the “social problem solving” factor included three scores from a vignette-based assessment in which children were asked to imagine themselves in socially challenging situations. One score reflected their understanding of the intentions of other children (the degree of hostile intent). A second score reflected their goal preference (prosocial, retribution, or revenge). A third score reflected their solution preference (prosocial–assertive, passive, or aggressive).
We first tested plausible one- and two-factor alternatives to a three-factor model. These models exhibited fit below criteria set by Hu and Bentler (1999; CFI ≤ .85, RMSEA ≥ .10). We next tested a three-factor model, in which emotion recognition scores loaded on one factor, social perspective taking scores loaded on a second factor, and social problem-solving scores loaded on a third factor. The fit of that model met the Hu and Bentler (1999) cutoff for good fit for both short and long forms of SELweb EE in Field Trial 1 (CFI = .96, RMSEA = .056, 90% confidence interval [CI: .050, .062] for long form; CFI = .94, RMSEA = .065, 90% CI [.059, .071] for short form) and Field Trial 2 (CFI = .98, RMSEA = .049, 90% CI [.044, .054] for long form; CFI = .98, RMSEA = .042, 90% CI [.037, .047] for short form). That model, depicted in Figure 2, was a significantly better fit to the data than the alternatives for both the short and the long forms of SELweb EE (all comparisons with the four-factor model, Δχ2/df > 20, p < .05).
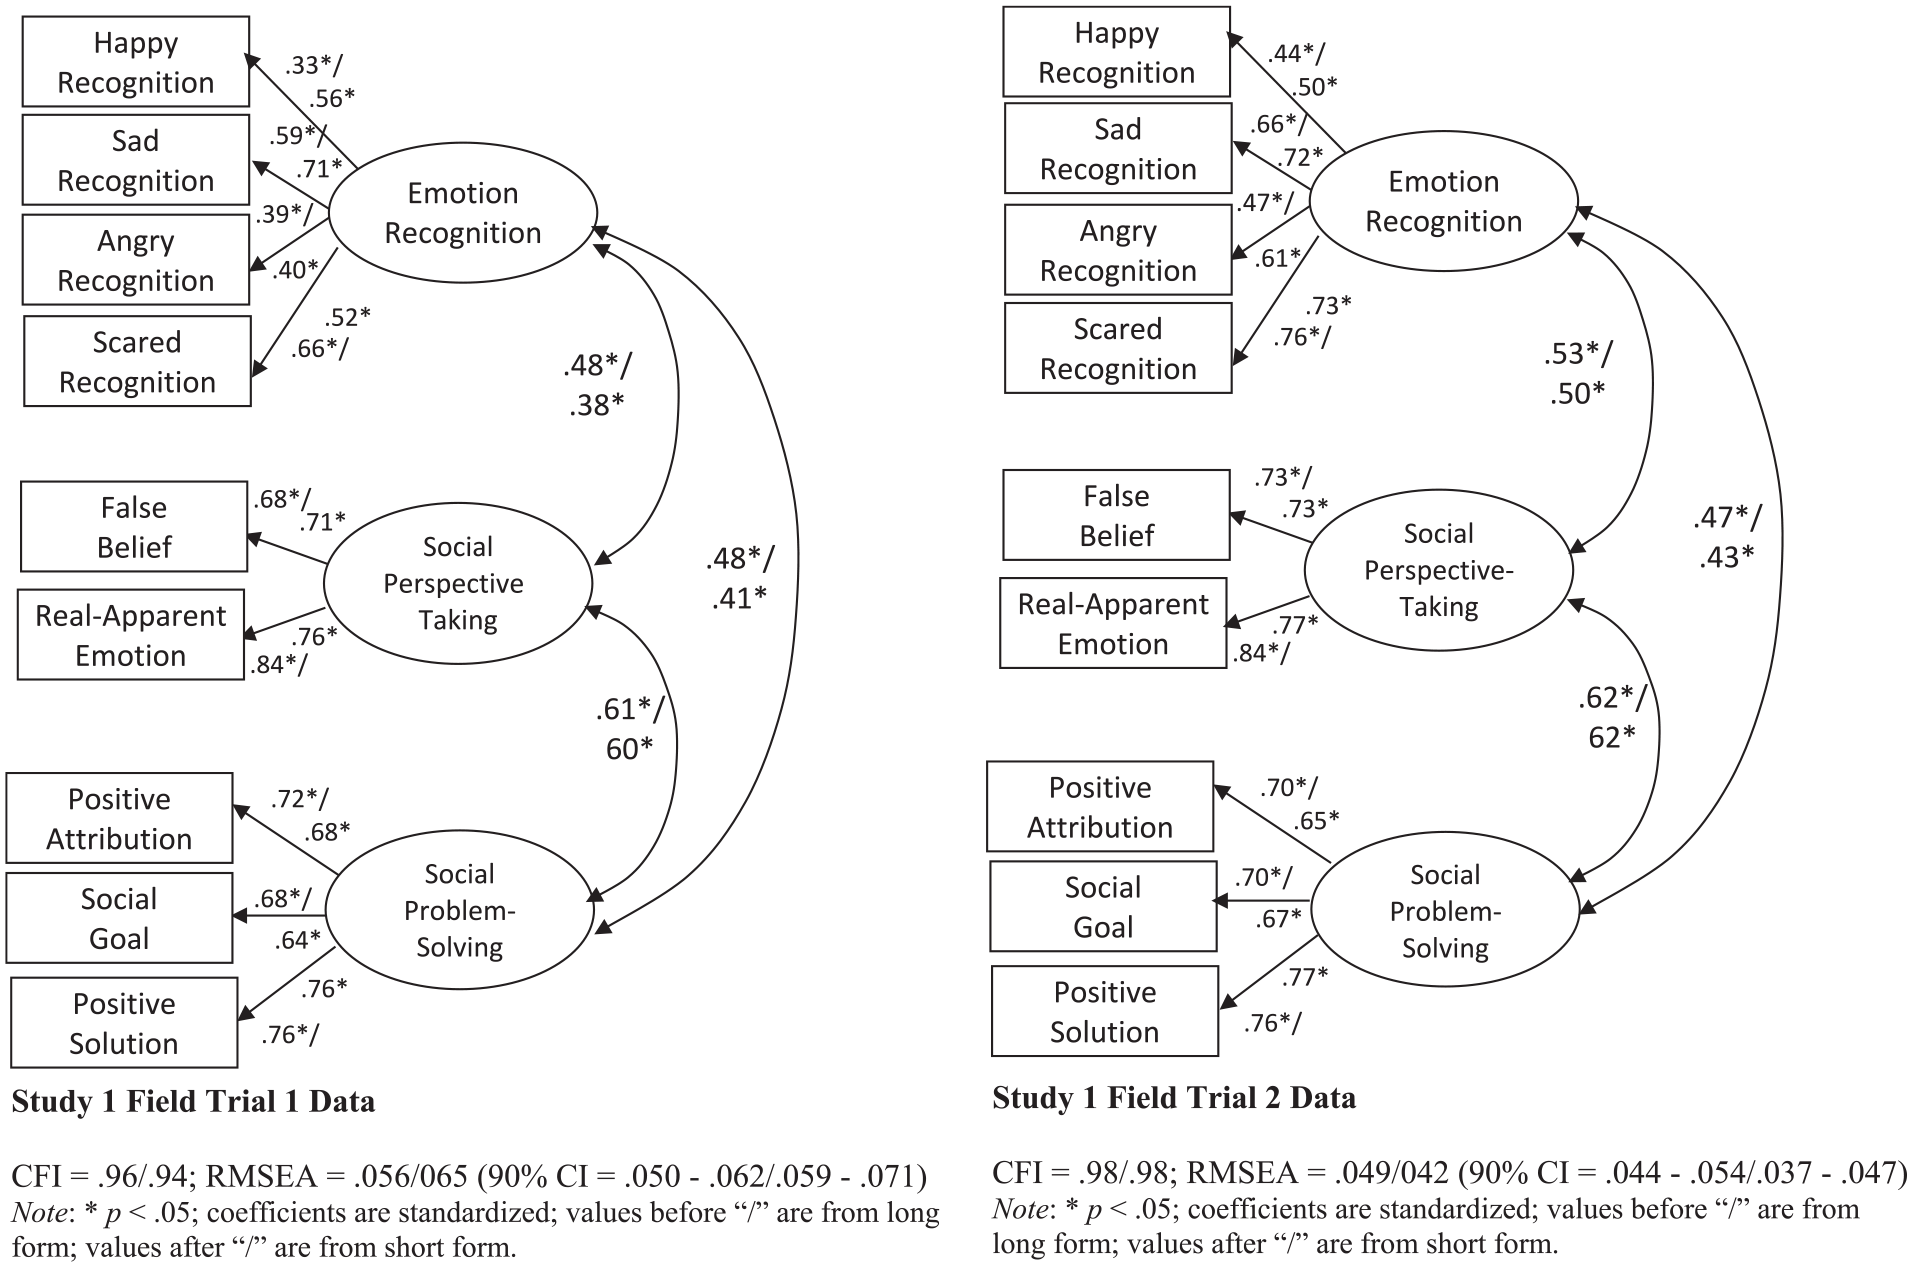
Confirmatory factor analysis using long-form and short-form scores.
Criterion-Related Validity
We used linear regression to evaluate the relationship between SELweb EE scores and criterion measures in both the short and long forms, with emotion recognition, social perspective-taking, and social problem-solving scores as predictors and teacher report of behavior and peer nominations as outcome variables, controlling for student age and sex. Findings are summarized in Table 5. Entered simultaneously as predictors, social perspective taking and social problem solving were both significantly associated with teacher-reported behavior and peer nominations when computed with both long-form items and short-form items. Emotion recognition was significantly associated with peer nominations. All but one significant regression coefficient were identical in magnitude using long-form and short-form scores. The exception was social problem solving, which, when predicting the teacher-report of behavior, yielded a standardized regression coefficient of .17 with the long-form score and .14 with the short-form score.
Criterion-related Validity of Social and Emotional Competence, Study 1 Field Trial 1 Sample.
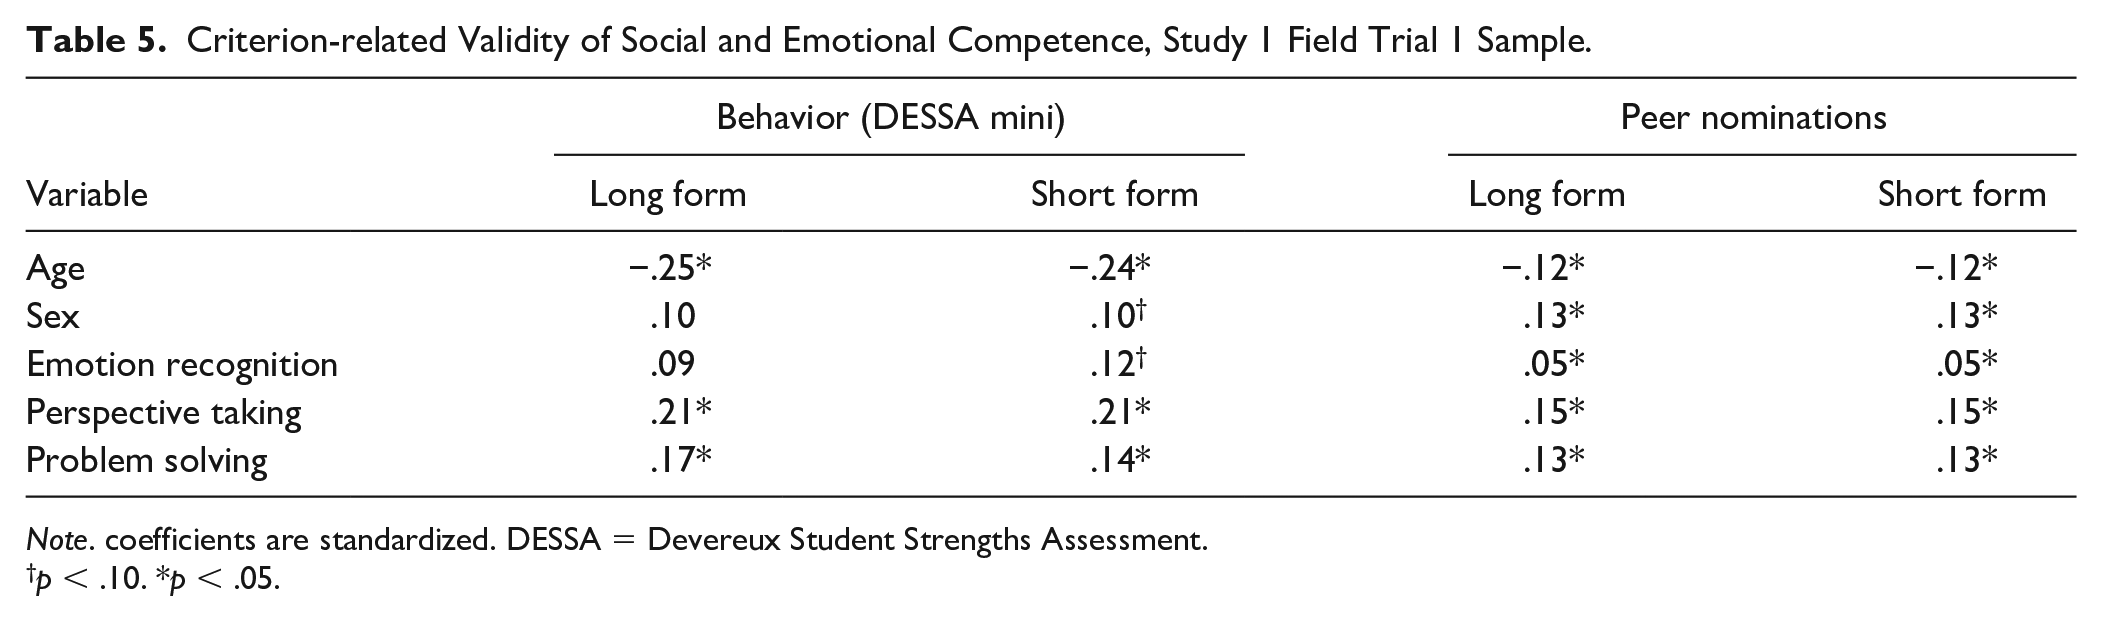
Note. coefficients are standardized. DESSA = Devereux Student Strengths Assessment.
p < .10. *p < .05.
Convergent and Discriminant Validity
We next evaluated the extent to which latent variables from the three-factor model tested above were each more related to parallel latent variables (created with alternate assessments) than they were related to other latent variables (also created with alternate assessments) using Amos (24.0.0, Arbuckle, 2008).
Convergent and discriminant validity were tested in a series of models. We constructed a model in which the three latent factors created from short form SELweb EE indicators were modeled as predictors of three parallel factors created from alternative indicators reflecting emotion recognition, social perspective taking, and social problem solving. We refer to paths between factors representing the same construct with different indicators as “convergent” paths, and paths between factors representing different constructs as “discriminant” paths.
The base model for all tests was an unconstrained model in which convergent and discriminant paths were modeled as free parameters. Fit statistics met Hu and Bentler (1999) criteria in both the long and short forms (CFI = .96, RMSEA = .03, 90% CI [.028, .033] for long form; CFI = 95, RMSEA = .032, 90% CI [.029, 035] for short form). Inspection of the standardized convergent and discriminant path coefficients revealed that the convergent paths were all statistically significant and in the expected direction and were larger in magnitude than the discriminant paths.
Next, convergent and discriminant validity were formally evaluated by comparing the base model with a series of nested models with parameters constrained. To evaluate convergent validity, we compared the base model with three models, one for each of the dimensions of social and emotional competence. In each model, one convergent path was constrained to zero. If the change in χ2 for each one degree of freedom change in the model was significant and indicated a worsening of model fit, we interpreted this as evidence of the convergent validity of the latent variable being tested. As shown in Table 6, for both the long and short forms, removing the convergent paths for social perspective taking and social problem solving each led to a significant decline in model fit.
Model Fit for Tests of Convergent and Discriminant Validity, Study 1 Field Trial 1 Sample.
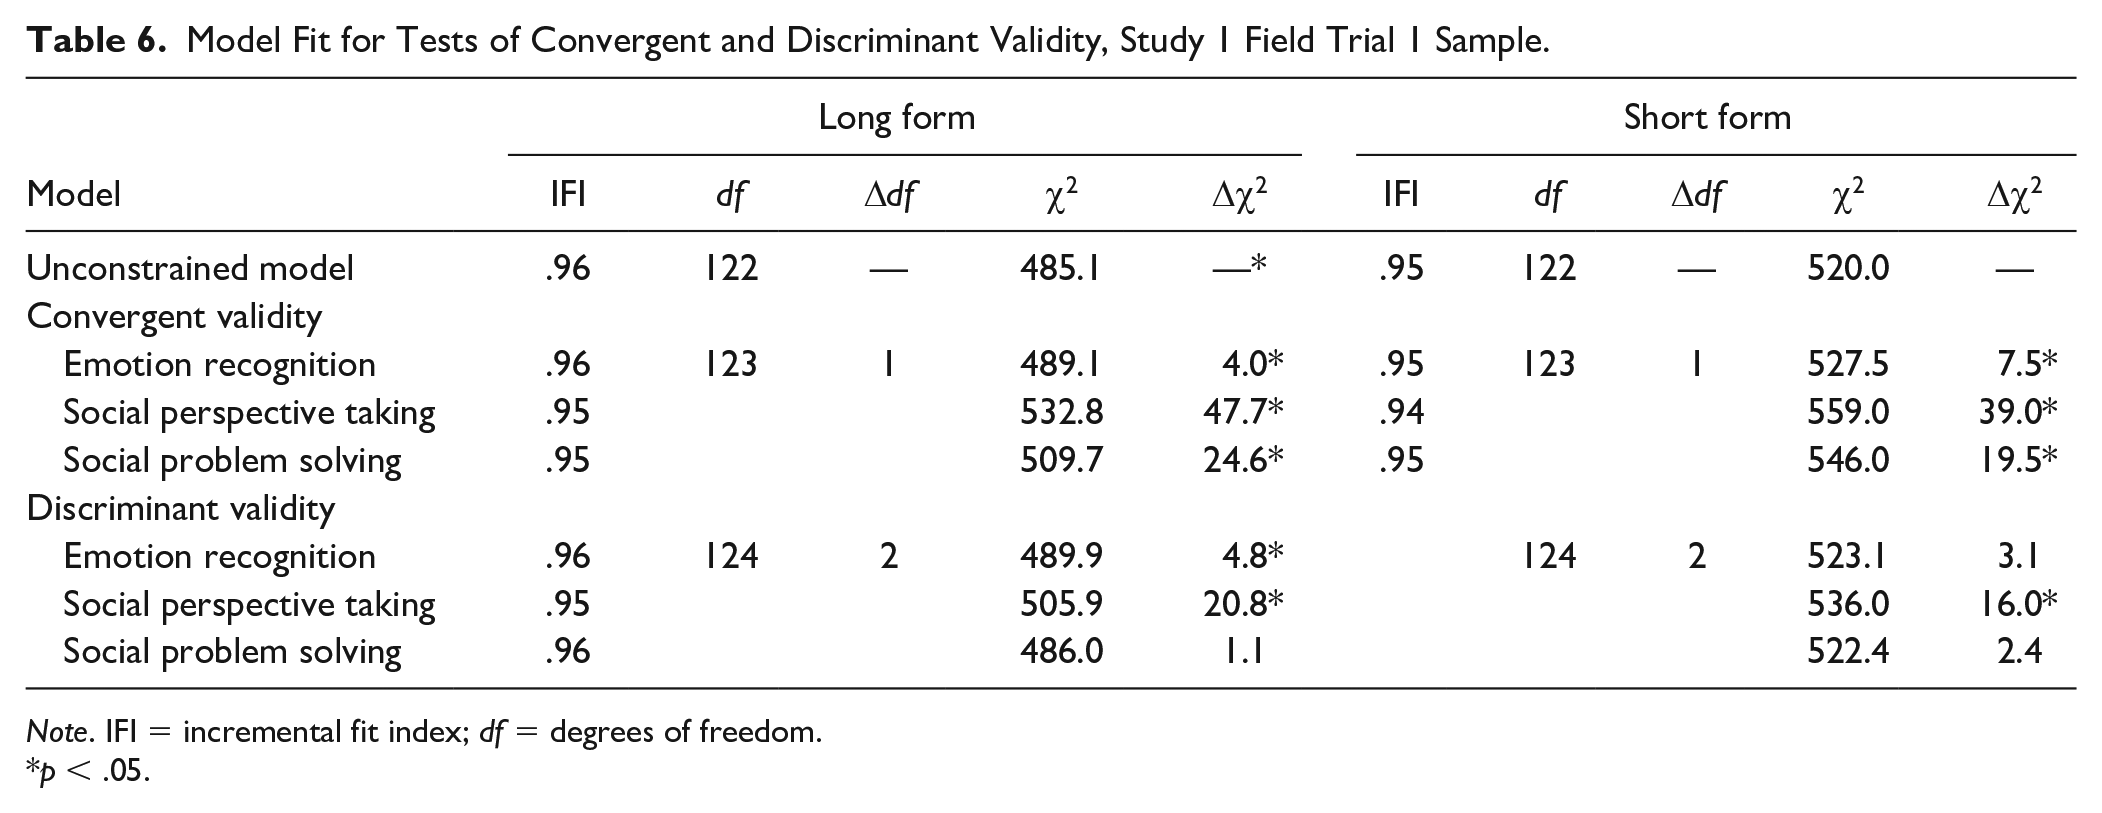
Note. IFI = incremental fit index; df = degrees of freedom.
p < .05.
To evaluate discriminant validity, we compared the base model with three models, one for each dimension of social and emotional competence. In each model, we constrained two discriminant paths to zero. If the change in χ2 for each three degree of freedom change in the model was not significant, indicating no change in model fit, we interpreted this as evidence of discriminant validity. As summarized in Table 6, with both long- and short-form data, for emotion recognition and social problem solving, constraining the discriminant paths to zero did not lead to a significant change in model fit. With both long- and short-form data, for social perspective taking, constraining discriminant paths to zero led to a significant reduction in model fit, although the magnitude of the reduction in model fit was smaller than the reduction in model fit resulting from eliminating the convergent path associated with social perspective taking. The final model is presented in Figure 3.
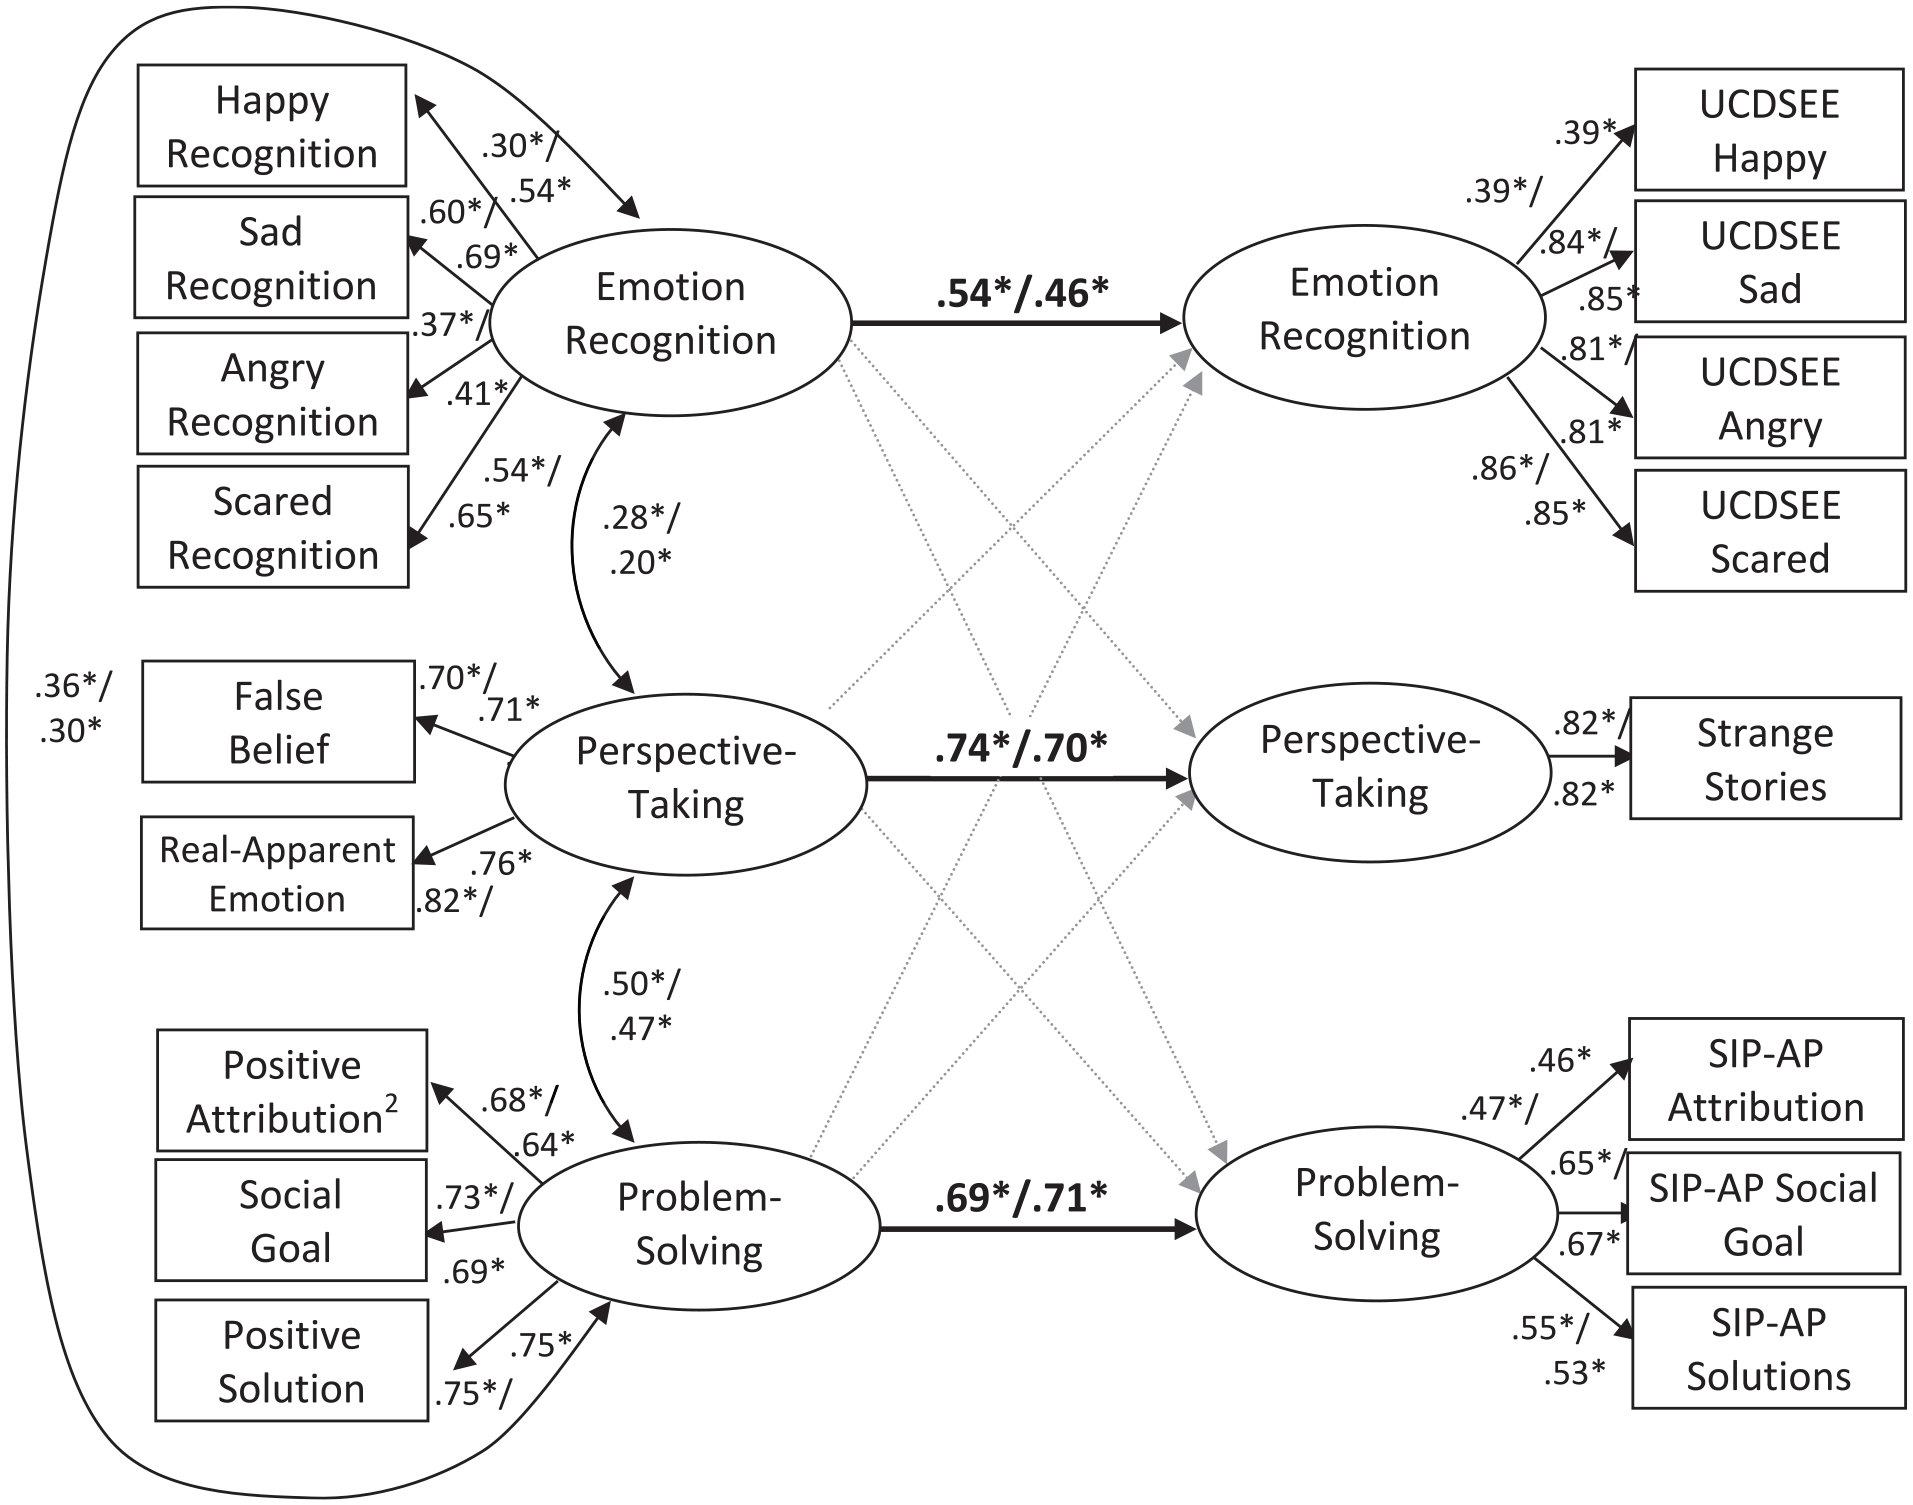
Convergent and discriminant validity, Study 1 Field Trial 1 data.
Discussion
Shortening three SELweb EE subtests resulted in a slight reduction in score reliability, without meaningful reductions in convergent, discriminant, and criterion-related validity. Based on the duration of the long form of SELweb EE (36.2 minutes) and the number of items removed to create the short form (a 23% reduction, across all five subtests), we estimate the short form, including the self-control subtests, will take an average of 27.9 minutes). Based on the results from Study 1, we created a short-form version of SELweb EE, eliminating items as described above.
It is important to note that some scores from our custom questions used in conjunction with SIP-AP videos exhibited low internal consistency reliability, as low as .50. Low-score reliability generally attenuates power to detect associations between scores. As a result, the lower reliabilities most likely reduced power to detect significant associations between SELweb EE scores and these scores. That we did find associations in the predicted directions suggests that the associations found were quite robust.
Finally, children who did not complete SELweb EE were, on average, younger than children who did, which may suggest that the youngest children in the sample were near the lower limit of the effective age range for this assessment.
Study 2
In Study 2, we cross-validated the short form of SELweb EE by administering it to a third large and demographically diverse student cohort. We evaluated duration, factor structure, score reliability, and measurement equivalence across sex, ethnicity, and language form. For this study, we administered all SELweb EE subtests, including the three reduced subtests and two unchanged self-control subtests.
Methods
Sample
The Study 2 sample, characterized in Table 2, included 22,683 students who completed the short form of SELweb EE during the 2018-2019 school year, of whom 19,036 completed the assessment in English.
Different demographic characteristics were available for different subsets of the cohort. Analyses of score reliabilities and CFAs (including ethnicity measurement equivalence analyses) included 18,492 of the 19,036 (97.1%) students who completed SELweb EE in English and for whom ethnicity information was available. Sex measurement equivalence analyses focused on a subset of 4,906 English-speaking students whose data included information about student sex—in this subsample, 52.4% of participants were male. Language measurement equivalence analyses included all 22,683 students who completed SELweb EE in English or Spanish. Children could be included in more than one set of measurement equivalence analyses.
Missing Data
Compared with children who did not have information about sex, children who did have information about sex were slightly younger, 7.4 years vs. 7.6 years, F(1, 22681) = 279.7, p < .05; and scored higher on SELweb EE overall, z score of 0.20 vs. −0.06, F(1, 22681 = 279.9, p < .05; and on emotion recognition, z score of 0.05 vs. −0.02, F(1, 22681) = 20.2, p < .05; social perspective taking, z score of 0.17 vs. −0.05, F(1, 22681) = 183.5, p < .05; social problem solving, z score of 0.14 vs. −0.04, F(1, 22681) = 138.9, p < .05; and self-control, z score of 0.17 vs. −0.05, F(1, 22681) = 199.2, p < .05. In addition, children who had information about sex were more likely to be White (30.2% vs. 19.9%) and Asian (5.4% vs. 3.3%) and less likely to be Hispanic (32.8% vs. 39.4%), χ2(5) = 424.7, p < .05.
In addition, 3,713 kindergarten through third graders from 99 elementary schools in 14 school districts completed the Spanish language version of SELweb EE. Compared with children who completed the English language version of SELweb EE, children who completed the Spanish language version of SELweb EE were younger, 7.5 years vs. 7.6 years, F(1, 22681 = 36.0, p < .05; and scored lower on SELweb EE overall, z score of −0.15 vs. 0.03, F(1, 22681 = 103.0, p < .05; social perspective taking, z score of −0.10 vs. 0.02, F(1, 22681) = 40.9, p < .05; social problem solving, z score of −0.11 vs. 0.02, F(1, 22681) = 48.6, p < .05; and self-control, z score of −0.20 vs. 0.04, F(1, 22681) = 175.8, p < .05. In addition, students who completed the Spanish language version of SELweb EE were significantly more likely than students who completed the English language version to be Hispanic (93.5% vs. 37.7%) and less likely than the English-speaking students to be from any of the other ethnic groups.
Confirmatory Factor Analysis Plan
The first analysis tested the fit of the data to a confirmatory four-factor model of social and emotional competence tested in prior studies (McKown, 2018; McKown, Russo-Ponsaran, Johnson, et al., 2016). This model includes latent variables reflecting four correlated competencies: emotion recognition, social perspective taking, social problem solving, and self-control. Indicators for the “emotion recognition,” “social perspective taking,” and “social problem solving” factors were the same as in Study 1. Indicators for the additional “self-control” factor reflected their scores on tasks assessing delay of gratification and frustration tolerance. Latent variable internal consistency reliabilities for English and Spanish language versions of SELweb EE are shown in Table 4.
Measurement Equivalence Analysis Plan
Measurement equivalence was tested by comparing nested CFAs with varying degrees of equality constraints (Dmitrov, 2010; Millsap, 2011). These analyses are based on the four-factor model described previously. The most basic question that measurement equivalence addresses is whether the factor structure is the same across groups (configural invariance). Assuming configural invariance assumptions are met, a second important question is whether factor loadings are equivalent for different groups (metric invariance). Metric invariance means that a one-unit change in the latent construct is reflected by the same change in the observed variables for all groups. Metric invariance is tested by comparing the configural model with a model in which equality constraints across groups are imposed on the factor loadings. If imposing these constraints does not lead to a degradation in model fit, this suggests factor loadings are equivalent across groups. Assuming metric invariance requirements are met, a third question is whether latent intercepts are equivalent for different groups (scalar invariance). Scalar invariance means that, at a given level of the latent variable, people from different groups achieve the same observed score. Scalar invariance is tested by comparing the metric invariance model to a model in which equality constraints across groups are imposed on the model intercepts. If imposing these constraints does not meaningfully reduce model fit, as described next, this suggests that the intercepts are equivalent for different groups.
In this and all models tested below, the chi-square tests of overall model fit and differences between the fit of nested models were tested. The chi-square test of model fit is sensitive to sample size. Because of this, when samples are large, the chi-square test can indicate that the data do not fit the model even when the fit of the data to the model is excellent (Brannick, 1995; Ullman, 2006). Model fit was also evaluated with CFI and RMSEA, both of which are less sensitive to sample size. The configural model was judged to be a good fit to the data when CFI ≥ .95 and RMSEA ≤ .06 (Dmitrov, 2010). Metric invariance models for each grouping were compared with the configural model, and scalar invariance models were compared with the metric invariance model. Per the recommendations of Chen (2007), metric and scalar invariance were supported if the change in model fit from the less restrictive model to the more restrictive model was CFI < .01 and RMSEA < .015.
Results
Durations
Removing items from the emotion recognition, social perspective-taking, and social problem-solving subtests of SELweb EE resulted in an expected decrease in duration. The average duration for a single SELweb EE session was now 23.8 minutes, with 90% of students completing SELweb EE in 28.3 minutes.
Item and Test Characteristics
We computed Rasch item outfit mean square, item discrimination, and item difficulty for all five SELweb EE observed scores from the shortened subtests, and a summary of those results can be found in Table 3. As was the case in Study 1, average fit statistics conformed to Rasch assumptions, and no single item violated those assumptions. In addition, independent sample t tests demonstrated that none of the mean fit statistics from Study 2 were significantly different from long- or short-form fit statistics from Study 1. Finally, we plotted TIF curves for all items and include them in Figure 1. With one exception, TIF curves from the Study 2 sample had similar ranges and peaks to the Study 1 TIF short form curves. That exception was for the attribution question, which displayed an unusual bimodal TIF curve.
Score Reliability
Internal consistencies of factor scores, summarized in Table 4, were computed as described in Study 1. Those values averaged .81, and the internal consistency of a second-order social and emotional competence composite was .93. For Study 2, which included only the short form, the social problem solving ω was .74.
Confirmatory Factor Analysis
Among children who completed the English language version of SELweb EE, the overall fit of the data to the four-factor model was excellent (Figure 4; IFI = .96; CFI = .96; RMSEA = .050, 90% CI [.048, .052]). Note that model fit and parameter estimates were very similar when this same model was run with students who completed both the English and Spanish language versions of SELweb EE.
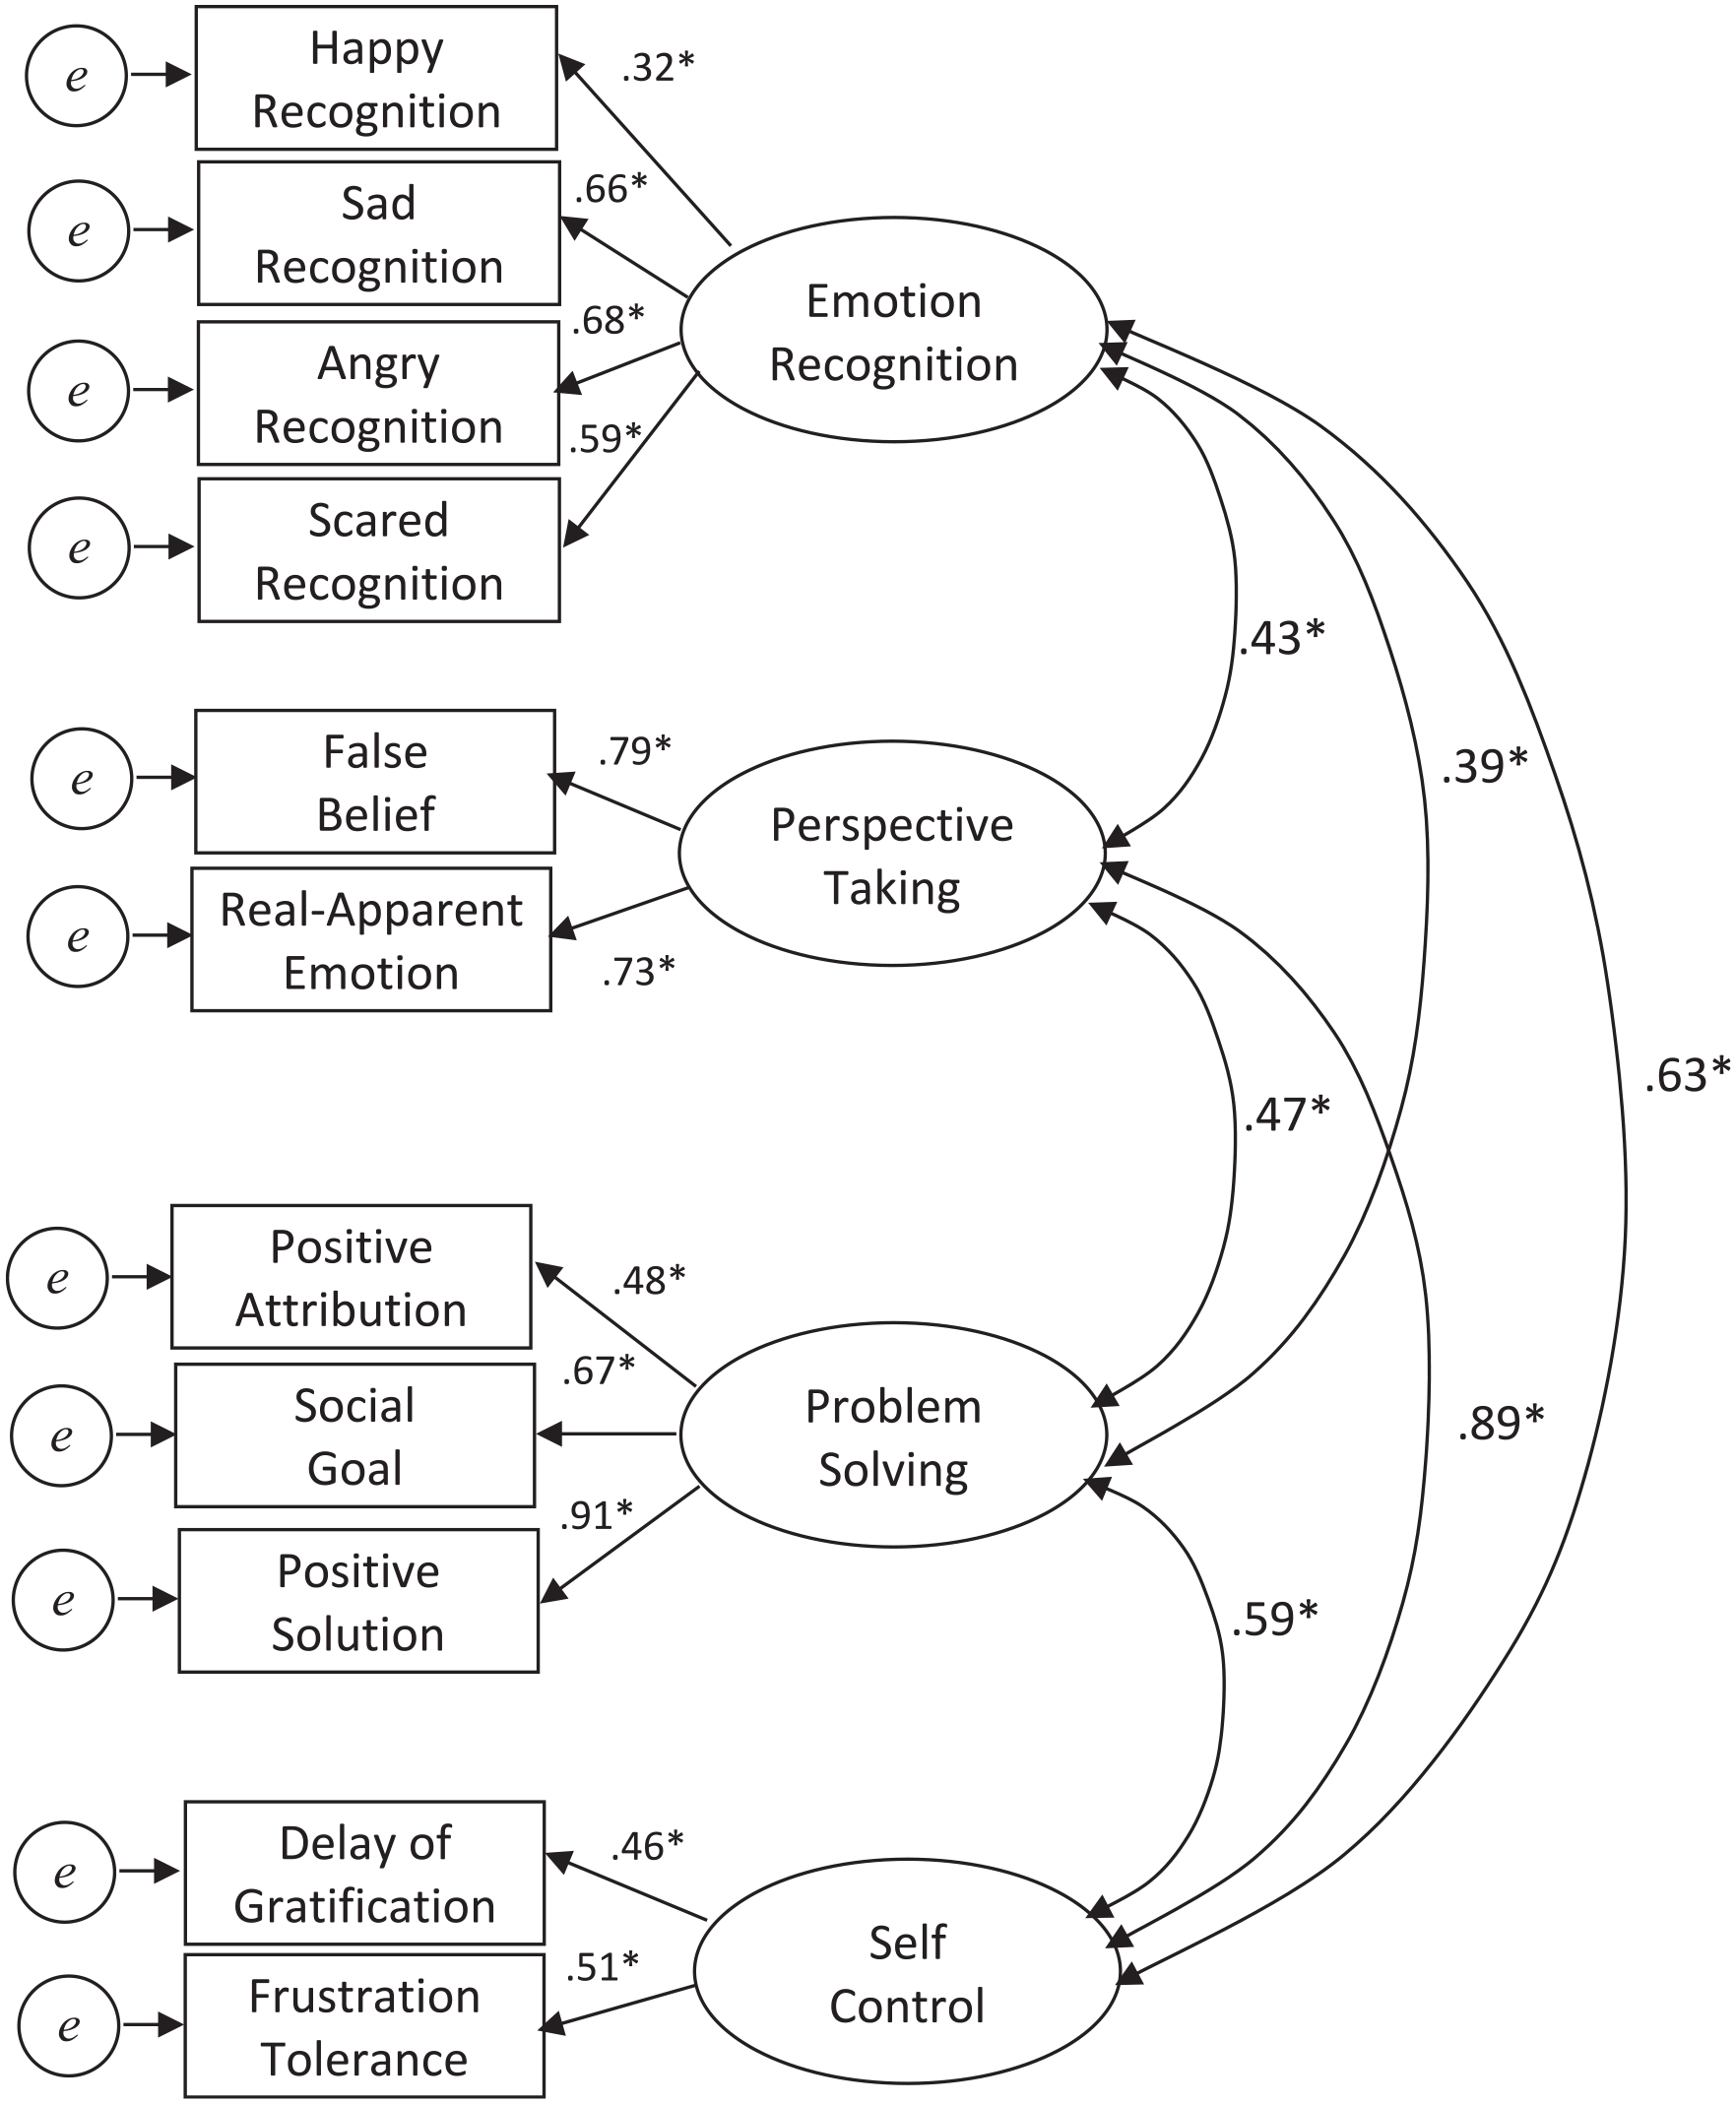
Confirmatory factor analysis, Study 2 data.
Measurement Equivalence
Findings from measurement equivalence analyses are summarized in Table 7. Covarying child age, ethnicity, sex, and language fit configural invariance models. Ethnicity and sex fit metric and strict scalar models. For language, the metric model met one of the criteria for equivalence (ΔRMSEA = .005) but not another (ΔCFA = .012). Inspection of modification indices suggested that the factor loading for the emotion recognition score reflecting children’s understanding of happy faces was different for children who completed the English and Spanish language versions of SELweb EE. Specifically, the relationship between recognizing happy facial expressions and the emotion recognition latent variable was stronger for children who completed the Spanish language version than for children who completed the English language version. Freeing the language equality constraint for this factor loading reduced the change in CFI to .007. Compared with the modified metric invariance model, language version met criteria for scalar invariance as described above.
Measurement Invariance Fit Statistics for the Four-Factor Model, Study 2 Replication Sample.
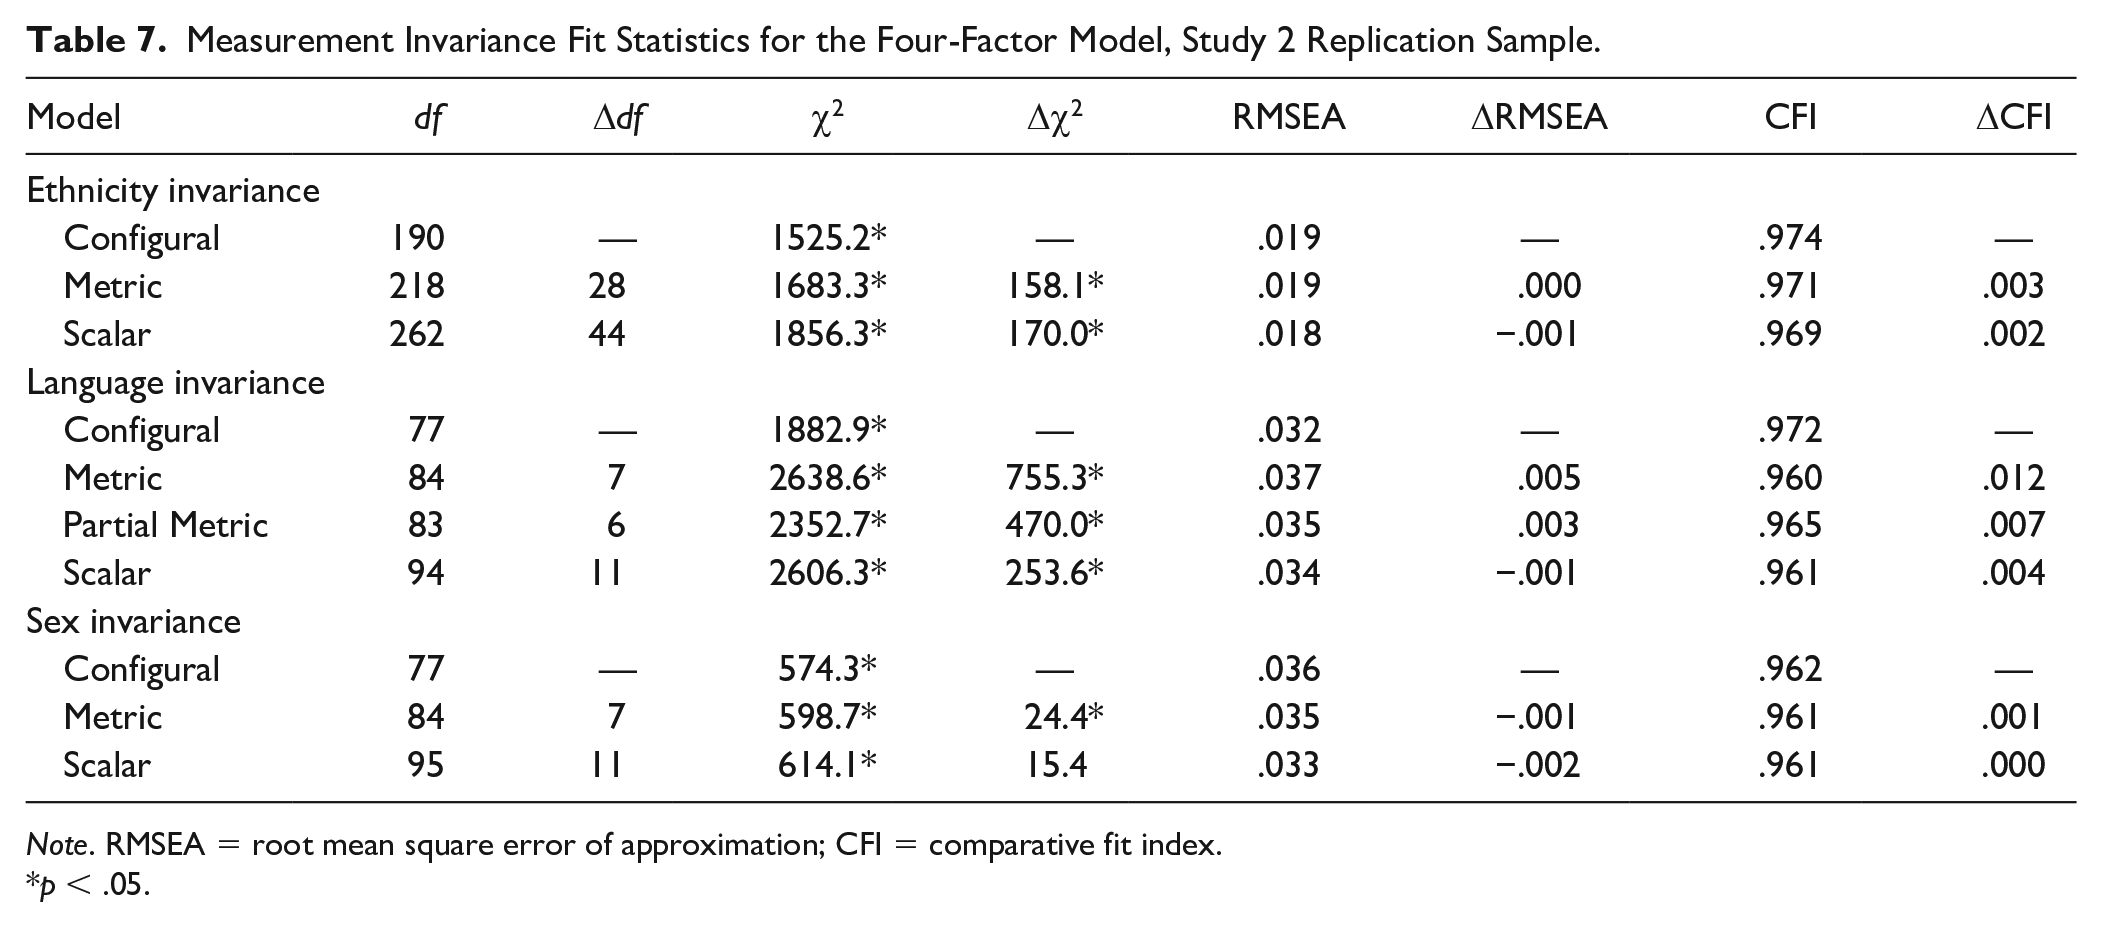
Note. RMSEA = root mean square error of approximation; CFI = comparative fit index.
p < .05.
Discussion
These analyses support the configural, metric, and scalar invariance of SELweb EE for children from different ethnic groups and for boys versus girls. Analyses support configural, partial metric, and scalar invariance for students who completed the English and Spanish language versions of SELweb EE. This means that for children from different groups: (a) SELweb EE measures the same underlying competencies, (b) the unit differences in observed scores reflect the same unit differences in the underlying competence, and (c) observed scores reflect the same level of competence. In general terms, SELweb EE scores mean the same thing for children from different groups.
One noteworthy finding is that for children who completed either the English or Spanish language version of SELweb EE, the factor loading between the happiness recognition score and the emotion recognition latent variable was different. Specifically, for children who completed the English language version of SELweb EE, the relationship between happiness recognition and emotion recognition overall was weaker than for children who completed the Spanish version. As a result, the differences in observed happiness recognition scores and overall emotion recognition are different for children who complete the English and Spanish language version of SELweb EE. One interpretation of these findings is that emotion recognition reflects a more unitary competence when assessed in Spanish, whereas recognizing different emotions may reflect distinct competencies when assessed in English. Further research should examine the nature of emotion recognition across cultural and linguistic groups.
The results indicated a very small departure from metric equivalence for language, reflected in a change in CFI that was.002 greater than the Dmitrov’s (2010) recommended cutoff for measurement equivalence. A second indicator of model equivalence—change in RMSEA from the configural to the metric model—was very small (.005) and was consistent with a conclusion of measurement equivalence. As a result, it is likely that this violation of metric equivalence assumptions does not lead to meaningfully biased scores.
General Discussion
Social and emotional competence is related to concurrent and subsequent social and emotional well-being and academic functioning (McKown, Russo-Ponsaran, Allen, et al., 2016; McKown, McKown, Russo-Ponsaran, Johnson, et al., 2016). SELweb EE was designed to be a developmentally sensitive method of assessing critical components of social and emotional competence of young school-aged children. With growing demands on classroom instruction time and required recurrent assessments, the duration of any test of social and emotional competence will influence its feasibility and acceptability to educators. Thus, we aimed to reduce the duration of SELweb EE to make it more acceptable. The results of those efforts, the short form of SELweb EE, consists of half of the items on the emotion recognition subtest and two-thirds of the items on each of the social perspective taking and social problem solving subtests. Results of this study suggest that the short form of SELweb EE balances efficiency with psychometric rigor.
The SELweb EE short form maintained many of the long form’s strengths. Internal consistency reliabilities were comparable to the long version and averaged more than .80. Scores from long and short forms had comparable factor structures and fit of the model to the data with similar factor loadings and covariances. Consistent with prior research, age was positively associated with performance on all the SELweb EE subtests. Scores from the long and short forms had nearly identical associations with teacher-reported behavior and peer nominations. In addition, the scores from the long and short forms displayed very similar evidence of convergent and discriminant validity. These analyses focused on the overall subtest scores, supporting the use of those scores for understanding student social and emotional competence level.
The benefit of reducing the number of items was a practically meaningful reduction in the estimated time required to complete SELweb EE. For the average student, total average testing time was reduced by 12.4 minutes (36.2 minutes for the long form vs. 23.8 minutes for the short form). The reduction in items means that 90% of students were able to complete the short SELweb EE in 28.3 minutes, which is almost half the time it took 90% of students to complete the long form (54.9 minutes). The reduced administration time provides for more feasible use by practitioners who have limited time available for assessment, as now most of the students can finish it in under 30 minutes.
As expected, reducing the number of items resulted in reduced score reliability. Each subtest yielded two to four indicator narrow-band scores and an overall score. Narrow-band scores reflected one dimension of the overall competence—for example, a “happiness recognition” score reflects children’s performance in accurately labeling happy faces and is one component of the overall “emotion recognition” score. Reductions in reliability were more pronounced with the narrow-band scores—average α was reduced by .08 and .07 in Field Trial 1 and 2 samples, respectively. In addition, the short-form α for those narrow-band scores were marginal. The reduction in reliability of the overall subtest scores was less pronounced, averaging .02. In addition, reliability scores for the short form’s overall scores averaged .81. Importantly, where αs fell below a standard of .70, including for some of our SIP-AP-based activity scores, the fact that significant associations in predicted directions were found is notable: Generally, such conditions would yield reduced power to detect significant associations; that we did find significant associations suggests that the associations found were quite robust.
Limitations and Future Directions
For both the long and short form of SELweb EE, 6-month stability estimates were variable. This may reflect low to moderate test–retest reliability or the malleability of the skills (Durlak et al., 2011; Nunnally & Bernstein, 1994). It is important to note that a 6-month interval is longer than is typical for assessing test–retest reliability, which typically involves measures taken at 2-week intervals. Our rationale for this longer interval was that it fit the needs of school districts using SELweb EE, who typically find little value in test results spaced by 2 weeks, but who do find value in comparing test results from early in the school year to test results from later in the school year. The longer the interval between measurements, the more intervening events occur, the lower the correlation between scores is likely to be. A 6-month interval is therefore likely to yield a conservative, low-end estimate of test–retest reliability. Future research should examine temporal stability over a shorter interval.
Analyses supported the convergent validity of all three subtests and the discriminant validity of emotion recognition and social problem solving. Inspection of the path coefficients in the base models suggests that social perspective taking was significantly associated with the alternative measure of emotion recognition and eliminating this discriminant path therefore reduced model fit. Emotion recognition and social perspective taking subtests do appear to measure distinct constructs—in our CFA analyses, a two factor model in which emotion recognition and social perspective taking scores loaded on a single factor did not fit the data well; conversely, a model in which emotion recognition scores loaded on one factor and social perspective taking scores loaded on a second factor did fit the data well. Future research should examine the exact relationship between emotion recognition and social perspective taking.
Conclusion
Taken together, the strengths and limitations of the long and short forms of SELweb EE appear to be very similar. Because time is a precious resource in elementary schools, the short form of SELweb EE reflects a meaningful improvement in usability, feasibility, and scalability, which is key to its adoption and ultimately, its potential benefit to teaching, learning, and student outcomes.
Footnotes
Authors’ Note
The opinions expressed are those of the authors and do not represent views of the Institute or the U.S. Department of Education.
Declaration of Conflicting Interests
The author(s) declared the following potential conflicts of interest with respect to the research, authorship, and/or publication of this article: Clark McKown, Maria Kharitonova, and Nicole Russo-Ponsaran have financial interests in xSEL Labs, which could potentially benefit from the outcomes of this research.
Funding
The author(s) disclosed receipt of the following financial support for the research, authorship, and/or publication of this article: Research reported here was supported by Institute of Education Sciences through Grant R305A110143 to Rush University Medical Center.