
Abstract
We examined hierarchical structural models of psychopathology in samples of (a) adults recruited online and screened based on psychopathology history (N = 429) and (b) undergraduates (N = 529) to inform classification of neurodevelopmental disorder (NDD)- and hypomania-relevant dimensions within the Hierarchical Taxonomy of Psychopathology (HiTOP). Results differed across samples in some ways, but converged to indicate that some NDD- and hypomania-relevant dimensions aligned closely with different HiTOP spectra. For example, some hypomania-relevant dimensions (e.g., affective lability) overlapped strongly with the internalizing spectrum, whereas others (e.g., self-perceived charisma) were reverse-indicators of detachment. Examination of cross-sectional and prospective correlates for emergent factors also was informative in some ways. This included NDD-relevant and disinhibited externalizing dimensions associating robustly with treatment seeking history and recent experiences of distress. These results provide initial insights into classifying NDD- and hypomania-relevant dimensions within the HiTOP and indicate a need for future research in this area.
Keywords
The Hierarchical Taxonomy of Psychopathology (HiTOP; Kotov et al., 2017) is an empirically driven, dimensional classification system with the potential to address limitations of the Diagnostic and Statistical Manual of Mental Disorders (5th ed.; DSM-5; American Psychiatric Association [APA], 2013). Although a substantial literature has guided the classification of many symptom dimensions within broad domains such as internalizing and externalizing from a HiTOP perspective, classification of other symptom dimensions, including those associated with Diagnostic and Statistical Manual of Mental Disorders (DSM) neurodevelopmental disorders (NDD) such as attention-deficit/hyperactivity disorder (ADHD) and autism spectrum disorder (ASD), remains unclear (Kotov et al., 2017; Zimmerman et al., 2021). The classification of other dimensions related to widely studied disorders such as bipolar spectrum disorders/hypomania also remains uncertain, representing another critical gap that limits the HiTOP’s applicability for informing measure development efforts and clinical assessment (Kotov et al., 2020; Watson et al., 2021).
Extant Dimensional Research on Neurodevelopmental Disorder Classification
Research examining the dimensional NDD classification, for autism-relevant dimensions in particular, is limited in scope. Notably, recent calls for reforming ASD diagnosis argue against conceptualizing ASD and other NDDs dimensionally, based in part on concerns that use of dimensional frameworks complicates categorical determinations of the presence or absence of ASD in research and practice, among other reasons (e.g., hindering research on mechanisms; Mottron, 2021). Acknowledging these perspectives, several recent studies indicate that some NDD-relevant features such as communication difficulties may be distinct from well-established HiTOP spectra (e.g., internalizing, detachment; Michelini et al., 2019; Stanton et al., 2021). However, other features described as characteristic of ASD (e.g., social withdrawal) overlap closely with existing HiTOP spectra such as detachment (Michelini et al., 2019; Zimmerman et al., 2021). Furthermore, some structural models classify ADHD dimensions, which have been studied somewhat more widely than ASD in dimensional classification research, within externalizing rather than within a separate NDD spectrum (Andrews et al., 2009).
In addition to recent studies formally examining placement of NDD features within dimensional models, accounting for findings from other overlapping literatures is useful for informing hypotheses regarding classification of NDD-relevant dimensions within the HiTOP. For example, measures such as the Broad Autism Phenotype Questionnaire (BAPQ; Hurley et al., 2007) increasingly are used to assess dimensions (e.g., rigidity) relevant to ASD, and measures such as the Child Behavior Checklist (Achenbach, 1991) have long been used to assess NDD-relevant dimensions such as attention and social difficulties. Growing research examining ADHD-ASD comorbidity across development also indicates that emotion dysregulation and social difficulties are shared ADHD and ASD features, with these transdiagnostic dimensions potentially being useful targets for improving upon traditional, disorder-specific diagnostic and treatment approaches (England-Mason, 2020; Gadow & Garman, 2020; Mikami et al., 2019).
Other related research examining personality–psychopathology associations has informed the classification of many other forms of psychopathology (e.g., internalizing disorders, personality pathology) and offers insights into NDD classification as well. Two recent meta-analyses indicate that autism is positively associated with traits such as neuroticism/negative emotionality, but negatively associated with openness, extraversion/surgency, agreeableness, conscientiousness, and associated traits such as effortful control (Chetcuti et al., 2021; Lodi-Smith et al., 2019; Stanton & Watson, 2016). Regarding ADHD meta-analytic research, both ADHD inattentive and hyperactive/impulsive symptoms associate positively with negative emotionality, with inattentiveness and hyperactivity/impulsivity also showing notable negative associations with conscientiousness and agreeableness, respectively (Gomez & Corr, 2014; Jacobsson et al., 2021).
Although these studies are informative in many ways, they still are at a more nascent stage than studies examining the personality and transdiagnostic correlates of other forms of psychopathology (Jacobsson et al., 2021), and most of this research has focused on child and adolescent samples (England-Mason, 2020; Michelini et al., 2019). For example, Lodi-Smith et al. (2019) identified only 14 relevant studies examining autism-personality associations in their meta-analysis, and Chetcuti et al. (2021) identified 64 such studies. By comparison, meta-analytic research on internalizing-personality associations from over a decade ago was based on nearly 200 studies from adult samples alone (Kotov et al., 2010). In addition, though there have been exceptions (e.g., studies examining distinct personality profiles for ADHD inattentiveness versus hyperactivity), much of this research reviewed focused primarily on composite global, NDD ratings in analyses. An exclusive focus on composite ratings may obscure distinct associations for different components of broader NDD domains (e.g., behavioral rigidity versus social difficulties associated with ASD) with personality and related constructs that would inform dimensional classification in more precise ways. Compounding this issue, although identifying shared associations with transdiagnostic dimensions such as negative emotionality is helpful to account for diagnostic comorbidity, elevated experiences of negative emotions and difficulties regulating them are linked to nearly every form of psychopathology to varying degrees (Clark & Watson, 2019; Stanton et al., 2020). As a result, direct examinations of the placement of specific NDD dimensions within large-scale structural psychopathology models would build significantly upon prior research informing classification.
Extant Research on Hypomania Classification from Dimensional Perspectives
Similar issues regarding classification continue to persist for hypomanic/manic symptom dimensions, which, compared to disorders such as ASD, have been incorporated more extensively into psychopathology structure research (Kotov et al., 2017, 2020). Based on the evidence to date, hypomania is classified provisionally within the thought disorder spectrum (Kotov et al., 2020). However, a focus on general composite ratings of hypomania in prior research greatly limits understanding of classification (Forbes et al., 2021). The DSM-5 hypomania criteria are particularly heterogeneous, as they include description of dimensions that may align most closely with several different HiTOP spectra (e.g., irritability with internalizing; distractibility and risk taking with disinhibited externalizing; grandiose delusions with thought disorder; APA, 2013).
Similar to research on NDD classification, research examining the personality correlates of hypomania-relevant dimensions provides insights into classifying distinct aspects of hypomania. First, some hypomania symptom and trait-relevant dimensions (e.g., tendencies toward experiencing mood swings and irritability assessed with measures such as the Hypomanic Personality Scale [HPS]; Eckblad & Chapman, 1986) appear to reflect specific aspects of negative emotionality. Other hypomania dimensions such as grandiosity and increased energy show distinctive positive associations with extraversion and reward seeking that are shared by only a few other forms of psychopathology (e.g., grandiose narcissistic traits; Kotov et al., 2020; Stanton et al., 2019; Watson et al., 2021). Even though hypomania is provisionally classified within thought disorder, these specific associations with extraversion and related constructs are not shared by other thought disorder dimensions (e.g., unusual beliefs, unusual experiences; Kotov et al., 2020). Consequently, some specific hypomania dimensions such as increased energy may be differentiable from the thought disorder spectrum in some ways.
Current Study Goals and Contributions
Informing Classification of Neurodevelopmental Disorder- and Mania-Relevant Dimensions
Our primary aim was to address gaps in the HiTOP framework by informing classification of trait dimensions relevant to DSM diagnoses such as ASD, ADHD, and bipolar spectrum disorders. Our study included data from both samples of (a) adults recruited online who self-identified as having a current or past history of mental health issues and (b) undergraduates not screened based on any criteria. We refer to the sample of community adults as the “online community sample” going forward, and data from this sample were collected at two timepoints approximately 2 weeks apart. Given issues with examinations of psychopathology structures using composite disorder ratings (Forbes et al., 2021), we focused on assessing distinct trait dimensions using an array of self-report scales to assess NDDs, hypomania, and other psychopathology. With the use of this self-report assessment approach, we refer to measures used here as indicators of traits relevant to hypomania and NDDs (e.g., “NDD-relevant”) rather than indicators of current symptoms exceeding traditionally-defined DSM disorder cutoffs. We are aware of little research jointly examining the factor structure of dimensions relevant to hypomania, ASD, ADHD, and other forms of psychopathology, such that this research represents an initial step toward informing classification of these dimensions in adulthood.
We sought to inform classification of NDD- and hypomania-relevant dimensions within the HiTOP at both broad (e.g., two-factor structures) and narrower levels of abstraction (e.g., specific factors reflecting different aspects of externalizing). Therefore, we examined hierarchical structural models, beginning by examining single factor models and proceeding to examine models with an increasing number of factors. Timestamped, preregistered predictions for select aspects of these analyses are provided on the Open Science Framework page (https://osf.io/hz7au/). These predictions were made after completing data collection but before beginning analyses. Furthermore, timestamped predictions were made only for models ranging from five to seven factors, though we also provide predictions for models with fewer factors subsequently. The latter set of predictions were not preregistered because our initial manuscript submission focused on reviewing the results of models with the largest number of psychologically-meaningful factors (see Online Figure S1). However, upon considering reviewer feedback, we deemed this revised, more comprehensive approach of presenting the full results of hierarchical models more useful for informing hierarchical classification. Predictions described next apply to both samples, though these predictions were tentative given the lack of research examining the joint classification of NDD- and hypomania-relevant dimensions.
Structural Model Predictions
First, we predicted that most measures would load moderately to strongly onto a common factor when examining single-factor models. Second, we predicted that some hypomania-relevant dimensions such as affective lability would align with an internalizing factor in multifactor models. In contrast, other hypomania dimensions (e.g., excessive energy, confidence) were expected to load weakly onto internalizing given their positive associations with extraversion. Instead, we predicted that these dimensions would load strongly along with entitlement/grandiosity measures onto a broad externalizing factor that would be identified in models with two or more factors (see Online Figure S1 for predictions regarding the nature of externalizing trait dimensions in more nuanced models).
Progressing through predictions across hierarchy levels, an additional thought disorder factor was predicted to emerge in models with three or more factors based on existing research (Kotov et al., 2017, 2020). Hypomania-relevant dimensions such as self-perceived creativity (e.g., “intense periods of insight”) were hypothesized to overlap meaningfully with both thought disorder and externalizing. Next, we predicted that a fourth detachment factor would emerge when extracting an additional factor. Measures of some ASD dimensions include content (e.g., “do not enjoy being around others”) very similar to that of detachment measures, leading to the prediction that these autism-relevant measures would load strongly onto detachment across models with four or more factors. Other NDD-relevant, ADHD dimensions were expected to align closely with externalizing indicators across levels of analysis (Andrews et al., 2009). We also anticipated that some NDD dimensions (e.g., inattentiveness, rigidity) would overlap with internalizing given strong NDD-negative emotionality associations (e.g., Gomez & Corr, 2014).
Finally, Online Figure S1 provides detailed predictions for all primary measure factor loadings across five- to seven-factor structures as noted. As shown in this figure, we predicted being able to identify at least five well-defined factors reflecting internalizing, thought disorder, detachment, disinhibited externalizing, and antagonistic externalizing. When extracting six factors, we tentatively predicted that some NDD-relevant indicators (e.g., communication difficulties, hyperactivity) would load strongly onto a distinct, NDD-relevant factor based on prior research (e.g., Michelini et al., 2019). Finally, should a seven-factor model be tenable, hypomania-relevant dimensions reflecting tendencies toward being energetic and charismatic were predicted to emerge as indicators of a distinct seventh-factor due to showing distinctive extraversion associations in prior research.
Examining the Clinical and Symptom Associations for Different Spectra Dimensions
A second study aim was to explicate patterns of associations for emergent dimensions with self-report measures of (a) clinical ratings relevant to treatment planning (e.g., past hospitalizations for mental health concerns) and (b) internalizing and hypomanic symptoms. We could not examine associations for factors from all levels of our hierarchies and therefore focused on examining associations for factors from models with the largest number of interpretable dimensions (anticipated to be a model with up to seven factors). This approach enabled us to determine the extent to which more specific, homogeneous dimensions (versus broader dimensions from models with fewer factors) showed distinctive patterns of correlates.
Predictions for Factor Associations
Acknowledging that resulting factor structures may not align with our predictions, Online Table S1 (cross-sectional correlates) and Online Table S2 (online community sample prospective correlates) provide full sets of expected associations for dimensions from the seven-factor model. Although we cannot review every predicted association in detail here, we review general patterns of predictions and provide illustrative examples of anticipated associations. First, all factors were expected to show robust clinical correlates in many cases; thus, we were most interested in determining the extent to which some factors showed stronger overall patterns of associations than others. For example, we predicted that factors reflecting thought disorder and internalizing would display stronger associations than other factors with current functional impairment, quality of life, and treatment seeking history. In contrast, antagonistic externalizing was expected to show relatively weak associations with these variables. However, antagonistic and disinhibited externalizing were expected to show stronger associations than other factors with (a) histories of externalizing behaviors (e.g., lifetime arrests) and (b) ratings corresponding with these domains from the online community sample follow-up assessment (e.g., past week substance use; missed appointments).
Method
Study Samples and Procedure
The first sample of participants (N = 429) were adults (age 18+) recruited through the Prolific crowdsourcing platform. Prolific includes screening filters, and only participants from the US who endorsed being currently or previously diagnosed with a mental health disorder were eligible to participate. Past and/or current diagnoses were based on participants’ self-identification in the Prolific system rather than through verification from a professional, but we still anticipated that participants would report relatively extensive histories of psychopathology and treatment seeking. Consistent with this, over half of the sample reported currently taking psychiatric medication, with roughly 1/3 of the sample receiving current psychotherapy. Most participants (N = 377; 87.8%) also completed the second assessment (M completion interval = 13.7 days, SD = 1.3). Second, undergraduate participants (N = 529) were recruited through the Psychology Department subject pool at a large Southern university. Undergraduates were not screened by mental health history or any other criteria. See Table 1 for demographic information for both samples. From here on, we refer to the initial assessment from both samples as “Time 1” and the follow-up assessment in the online community sample as “Time 2.”
Demographic Characteristics of Both Samples.
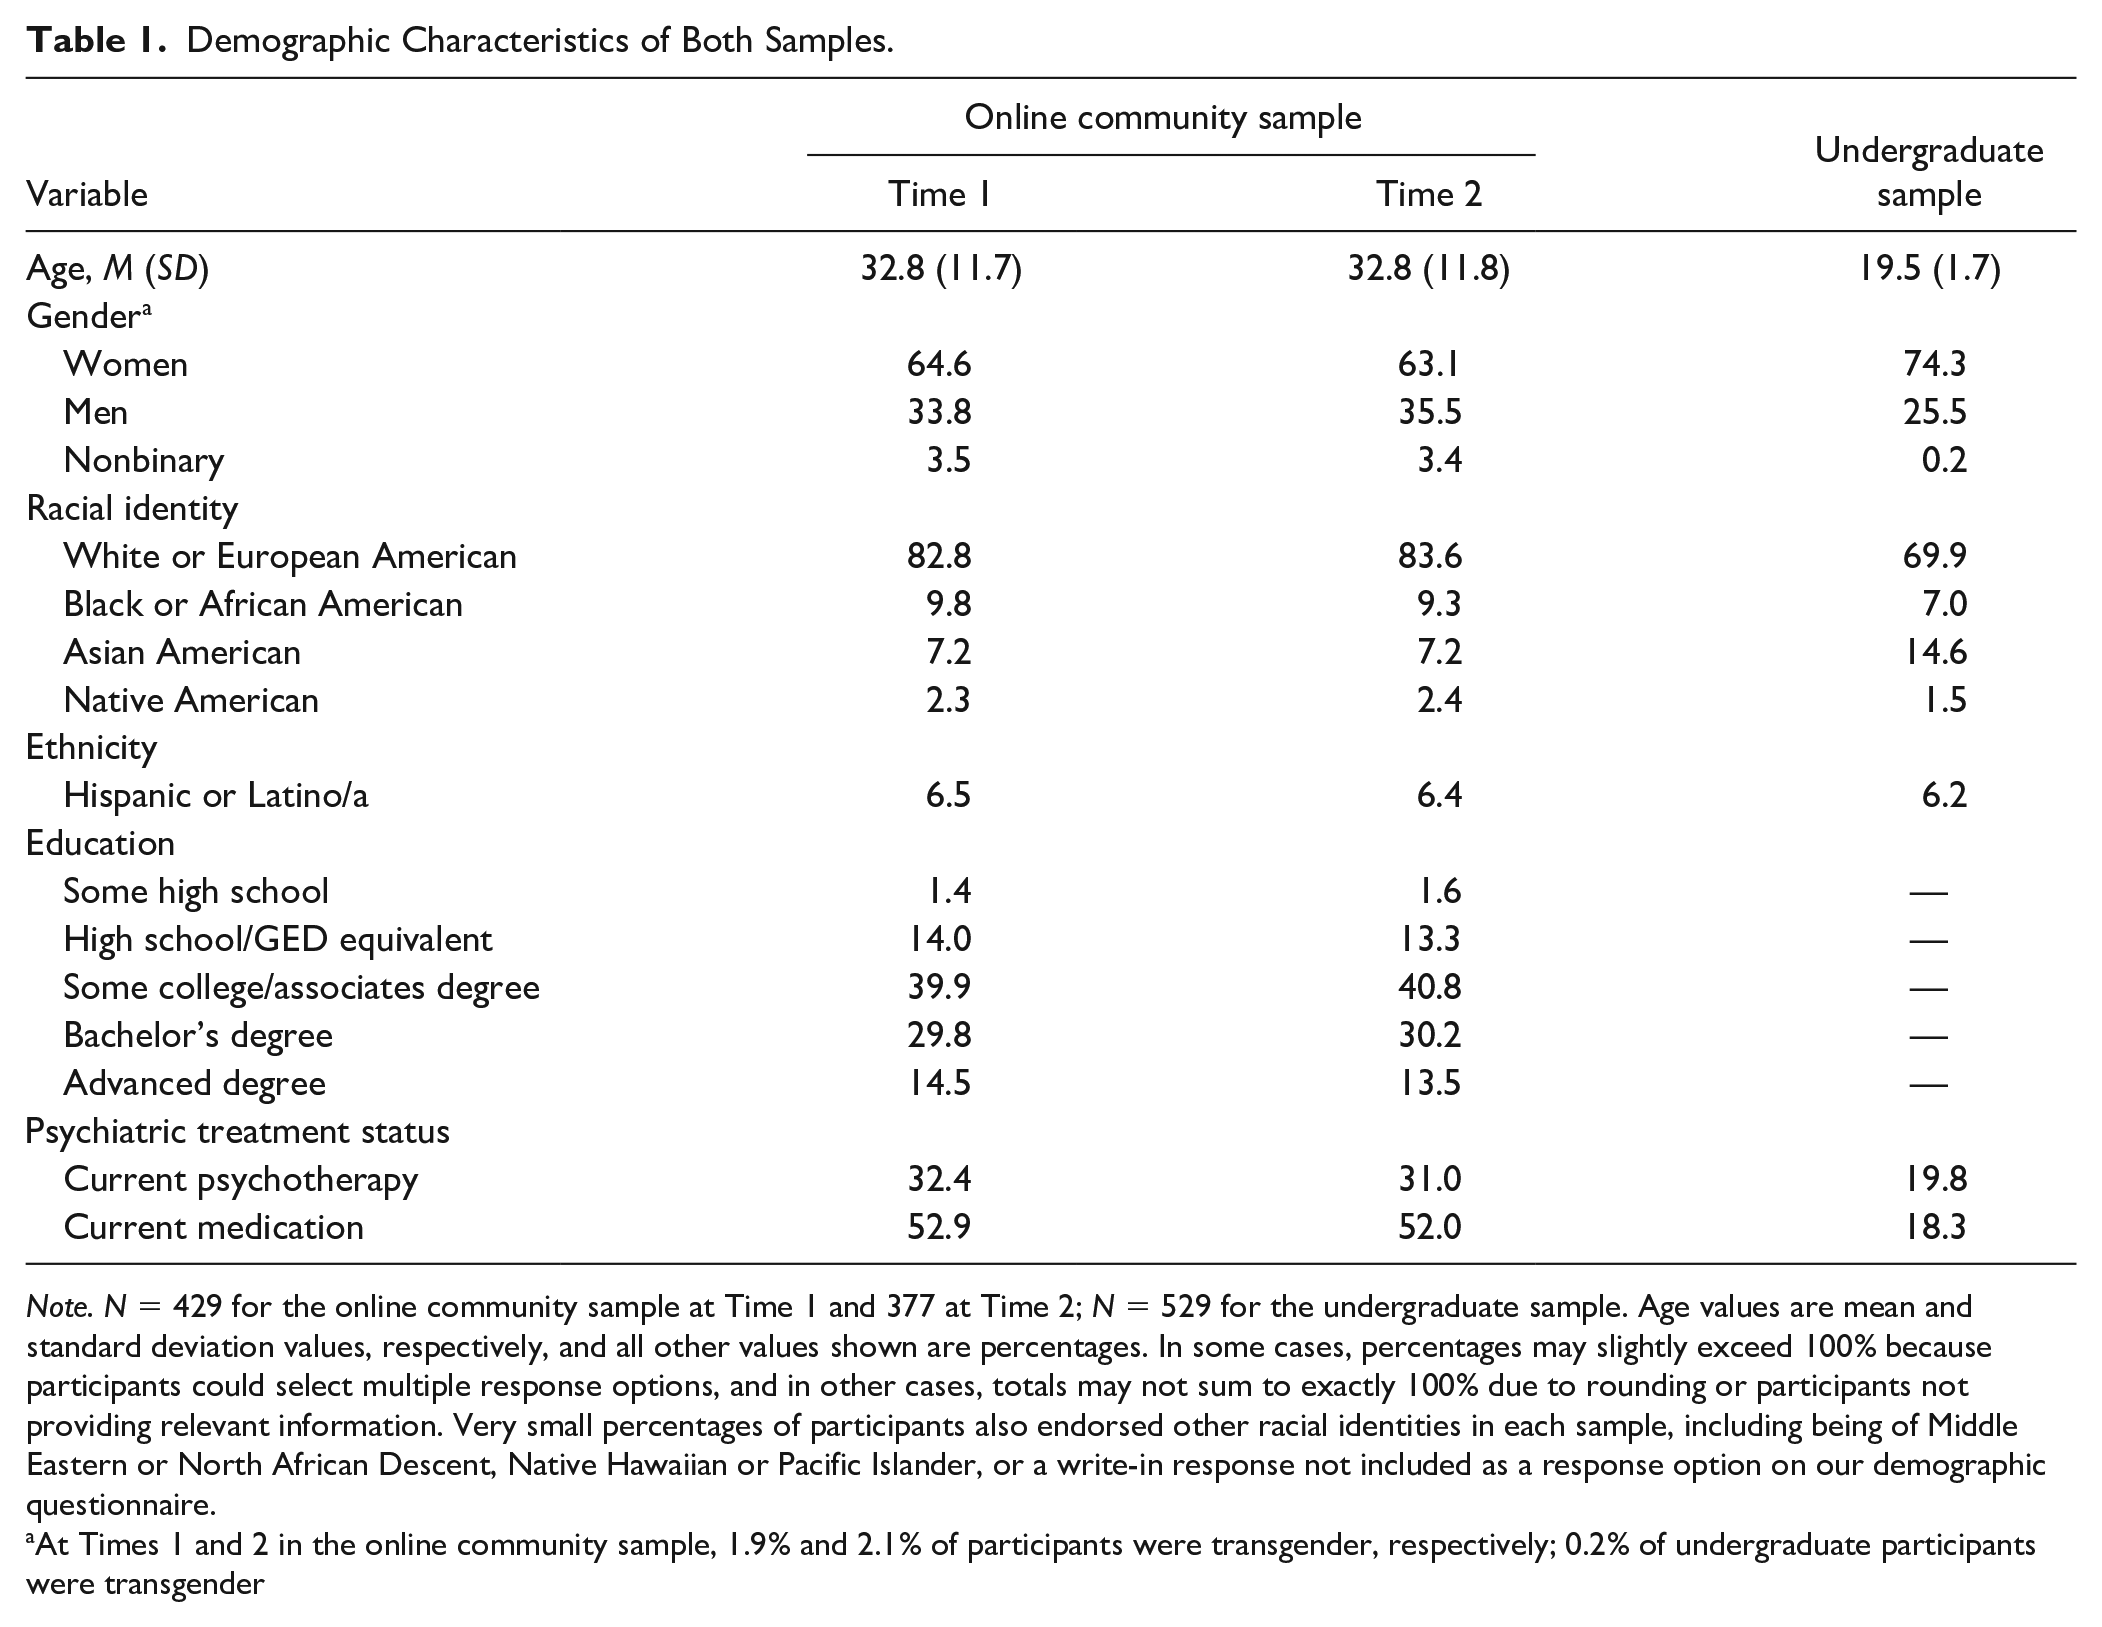
Note. N = 429 for the online community sample at Time 1 and 377 at Time 2; N = 529 for the undergraduate sample. Age values are mean and standard deviation values, respectively, and all other values shown are percentages. In some cases, percentages may slightly exceed 100% because participants could select multiple response options, and in other cases, totals may not sum to exactly 100% due to rounding or participants not providing relevant information. Very small percentages of participants also endorsed other racial identities in each sample, including being of Middle Eastern or North African Descent, Native Hawaiian or Pacific Islander, or a write-in response not included as a response option on our demographic questionnaire.
At Times 1 and 2 in the online community sample, 1.9% and 2.1% of participants were transgender, respectively; 0.2% of undergraduate participants were transgender
Measures
Measures of Psychopathology Dimensions Included in Study Factor Analyses
All measures described in this subsection were administered across samples and timepoints. Our assessment strategy did not provide comprehensive coverage of all specific trait dimensions previously identified as indicators of well-established HiTOP spectra, which prevented us from comprehensively delineating hierarchical trait structures. However, we used scales from a range of measures to assess dimensions representative of core HiTOP domains as well dimensions related to NDDs and hypomania.
First, we administered select scales from the Comprehensive Assessment of Traits Relevant to Personality Disorder (CAT-PD; Wright & Simms, 2014). Participants responded to the CAT-PD items using a 5-point scale ranging from 0 (very untrue of me) to 4 (very true of me), and we administered scales providing coverage of the HiTOP internalizing, detachment, thought disorder, disinhibited externalizing, and antagonistic externalizing spectra. Kotov et al. (2017) describe these five dimensions as reflecting broad spectra that account for the covariation of more specific symptom dimensions based on extant research, though other spectra have been recognized as provisional and requiring further study (e.g., a somatoform spectrum; see Figure 3 of Kotov et al., 2017, 2020). We included at least several CAT-PD measures to model each of these spectra, with a focus on assessing specific dimensions consistently identified as facets of each spectrum (Kotov et al., 2017; Stanton et al., 2020). Specifically, CAT-PD Anxiousness (7 items), Depressiveness (6 items), and Affective Lability were included as internalizing indicators; Emotional Detachment (7 items), Social Withdrawal (6 items), and Romantic Disinterest (6 items) were selected for coverage of detachment; Unusual Beliefs (7 items), Unusual Experiences (7 items), and Fantasy Proneness (6 items) were included to assess thought disorder; Irresponsibility (7 items), Non-Perseverance (6 items), and Non-Planfulness (6 items) as disinhibited externalizing indicators; and finally, CAT-PD Grandiosity (7 items), Callousness (7 items), Manipulativeness (6 items), and Exhibitionism (6 items; which also may be a reverse detachment indicator; Kotov et al., 2017) to assess antagonistic externalizing.
Next, hypomania-relevant dimensions were assessed using the HPS (Eckblad & Chapman, 1986), a widely used measure assessing traits related to mania proneness. Participants responded to the HPS items using a 5-point scale ranging from 1 (strongly disagree) to 5 (strongly agree). Guided by factor analytic research administering the HPS in this format (Stanton et al., 2019), we scored HPS Activation (9 items; e.g., “get so excited I cannot stop talking”), Charisma (8 items; e.g., “life of the party”), Intellectual Confidence (7 items; e.g., “have periods of insight”), and Mood Lability (7 items; e.g., “moods change frequently”) scales.
Measures administered to assess NDD-relevant dimensions included the 18-item Adult ADHD Self-Report Scale (ASRS; Matza et al., 2011; Stanton et al., 2018), and we used ASRS Inattentiveness (9 items), Motor Hyperactivity/Impulsivity (5 items; e.g., “often feel fidgety”), and Verbal Hyperactivity/Impulsivity (4 items; e.g., “talk excessively”) scale scores for analyses. Rather than participants responding to whether or not they had experienced symptoms using a checklist format (i.e., yes/no responses), participants rated the extent to which they had been experiencing ADHD symptoms over the past year on a 0 (never) to 4 (very often) scale, consistent with the ASRS administration instructions. Although the ASRS assesses symptoms, scores appear as stable as those for measures of many other trait dimensions (e.g., test–retest coefficients near .90 over 2-week intervals; Gomez & Corr, 2014; Matza et al., 2011). Trait dimensions relevant to autism were assessed with the BAPQ (Hurley et al., 2007), which has been cited over 500 times as of August 2021 and is used to assess phenotypic dimensions relevant to autism, including Aloofness (12 items; “prefer to be alone”), Pragmatic Language Difficulties (e.g., “talk too much about certain topics”), and Rigidity (12 items; “strong need for sameness in my routines”).
Finally, participants were administered the 10-item Alcohol Use Disorders Identification Test (AUDIT; Saunders et al., 1993) and an 8-item version of the Drug Use Survey (Clark & Watson, 1999) to assess substance use. The AUDIT assesses alcohol use and potential consequences of alcohol use over the past 12 months. The DUS provides an assessment of the lifetime history of use for a range of substances (e.g., cannabis, amphetamines) on a 7-point scale ranging from 0 (Never) to 6 (40+), with ratings for each item summed to create a total score.
Measures of Symptoms and Other Clinically-Relevant Variables
Clinically-Relevant Items Administered to Both Samples at Time 1
Participants completed items assessing different aspects of their mental health histories (see Online Table S3), including lifetime number of hospitalizations due to mental health issues, average physical pain (on a 0–10 scale; higher scores indicate more pain), and the number of times previously having sought substance use treatment. Participants also indicated their lifetime number of arrests, speeding tickets, being fired from a job, and having stolen something. Furthermore, participants completed items from the Single-Item Global Measures of Severity (Zimmerman et al., 2006) assessing mental health impacts on quality of life (rated on a 0 [very good] to 4 [very bad] scale) and functional impairment (rated on a 0 [not at all] to 4 [extremely] scale).
Additional Clinically-Relevant Items Administered to the Online Community Sample Participants at Time 2
At Time 2, online community participants also completed items assessing past week behaviors including number of times getting drunk (0–7 scale, with a score of 7 equaling all 7 days), using substances to get high (0–7 scale), number of arguments with others, and how many times they were late for an appointment or work (see Online Table S3). Participants also provided information regarding the occurrence of other past week events including how many times they were so upset that they cried, number of nights experiencing sleep difficulties (0–7 scale), and how many times they experienced a panic attack (described to participants as sudden experiences of physiological symptoms related to anxiety). We recognize that participant responses to these items may be influenced by their subjective interpretations (e.g., variation in what constitutes a “panic attack”). Still, these past week events commonly are assessed in treatment settings and may provide insights into participants’ subjective experiences (e.g., reporting many past week arguments would reflect self-perceived social difficulties).
Symptom Measures Administered Across Samples and Timepoints
Finally, participants completed select scales from the Expanded Version of the Inventory of Depression and Anxiety Symptoms (IDAS-II; Watson et al., 2012), with participants in the online community sample also completing these measures at Time 2. This included the IDAS-II Dysphoria (10 items; e.g., “felt depressed”), Social Anxiety (6 items), Mania (5 items; “thoughts jumped rapidly”), and Euphoria scales (5 items; e.g., “so much energy it was hard to sit still”). Participants indicated how much they experienced symptoms over the past 2 weeks using a 5-point scale ranging from 1 (not at all) to 5 (extremely). Scores from the IDAS-II scales were not included in our factor analyses due to these scales assessing recent symptom experiences, whereas measures included assessed trait tendencies or more extended symptom experiences.
Results
Descriptive Statistics
Online Table S3 provides measure descriptive statistics. Mean score differences across online community sample timepoints were trivial (i.e., effect size differences < |.20|). Internalizing, detachment, and disinhibited externalizing scores generally were higher in the online community sample than the undergraduate sample, as anticipated. However, undergraduates reported higher average scores for measures assessing exhibitionism and some hypomania-relevant measures (e.g., d = –.67 for HPS Activation for Time 1 comparisons).
Overview of Primary Study Analyses
As reviewed previously and described in Online Appendix S1, there were several deviations from our preregistered analyses (again, see https://osf.io/hz7au/). Deviations relevant to primary analyses included (a) using exploratory structural equation modeling (ESEM) rather than a purely exploratory factor analytic approach to examine factor models at different levels of hierarchies and (b) removing a series of multiple regression analyses examining associations for emergent factors. Online Tables S4 and S5 provide correlation matrices for variables included in the ESEMs that were conducted to delineate hierarchical psychopathology structures. A maximum likelihood robust (MLR) estimator was used for ESEMs, with factors rotated using an oblique geomin rotation. Across models, indicators were allowed to load onto all factors, though constraints were added for select analyses evaluating Time 1 to Time 2 model similarity. Although we considered a confirmatory factor analytic (CFA) approach given our tentative predictions regarding the nature of factor structures, we opted for using ESEM because use of CFA would have required adjudicating among many different models varying in their loading specifications (e.g., many different combinations for specifying loadings for four hypomania-relevant ratings in tandem with specifying loadings for six NDD-relevant measures).
We followed a hierarchical (“bass-ackwards”) approach by beginning with single-factor ESEM models and continuing to examine models with an increasing number of factors. We ceased extracting additional factors once models included one or more poorly defined or difficult to interpret factors. We considered factors well-defined if they had three or more indicators with primary loadings ≥ |.40| and cross-loadings of ≤ |.30| (Clark & Watson, 2019). We recognize that other criteria could be used for evaluating loadings in addition to these general benchmarks, and we also consider other information (e.g., various model fit indices), as described subsequently. However, an overreliance on model fit indices with ESEM approaches can lead to overfactoring (i.e., fit improving with more factors even when more complex models include poorly defined factors; Montoya & Edwards, 2021), and the presentation of our results provides information for models varying in complexity rather than focusing on identifying a single “best” model.
Keeping these issues in mind, recent simulation research indicates that the following model indices may be useful for informing the maximum number of ESEM/EFA factors to extract (Finch, 2020): The confirmatory fit index (CFI), the Tucker–Lewis index (TLI), the root mean square error of approximation (RMSEA), and the standardized root mean squared residual (SRMR). Values ≤ .08 often are interpreted as indicating acceptable fit for RMSEA and SRMR, as are CFI and TLI values ≥ .95 (Finch, 2020; Montoya & Edwards, 2021), though cutoffs often are relaxed (i.e., CFI and TFL values ≥ .90; RMSEA ≤ .10; Hopwood & Donnellan, 2010). Change in CFI (i.e., ≥ .01) often is used for comparing models differing in factor number, and we also consider changes in RMSEA of ≥ .015, which may be more informative than other methods of comparison when using ESEM (e.g., chi-square difference testing; Bayesian Information Criterion comparisons; Finch, 2020). To provide a comprehensive understanding of variable interrelations, we did not make analytic modifications that could be used to improve model fit (e.g., removing specific variables from analyses). Related to this, even when using a flexible ESEM approach, we anticipated that fit would be poor for models with few factors, as these models would fail to account for psychopathology heterogeneity. In addition, we took into account results of parallel analyses using principal components, which also can be used to inform the maximum number of ESEM factors to extract (Finch, 2020). Finally, we examined emergent factors’ correlates with external variables (e.g., hospitalization history) after evaluating ESEMs.
Results of Hierarchical Structural Analyses
Solutions with Three or Fewer Factors Across Samples at Time 1
Due to the detailed descriptions presented for different models, Table 2 provides general summaries for how all subsequently described results inform psychopathology classification. Parallel analyses suggested that up to four and five factors could be extracted in the Time 1 online community and undergraduate data, respectively. In addition, Table 3 provides model fit indices. Values for CFI increased substantially (i.e., increases ≥ .10) across all one- to three-factor models comparisons (e.g., when comparing single- to two-factor models), with RMSEA values decreasing by > .015 in all cases. Still, overall fit was very poor for 1-3 factor models according to most indices. As described next, results also varied across samples in some ways regarding factor loading patterns and the maximum number of well-defined dimensions that could be identified, precluding stringent evaluations of multigroup invariance. However, to provide an efficient, basic examination of cross-sample factor correspondence, congruence coefficients are presented. Coefficients ≥ .95 indicate strong similarity, and coefficients between .85 and .94 indicate fair similarity (Lorenzo-Seva & ten Berge, 2006).
Summary of Findings From Hierarchical Structural Analyses Across Models Varying in Their Number of Factors.
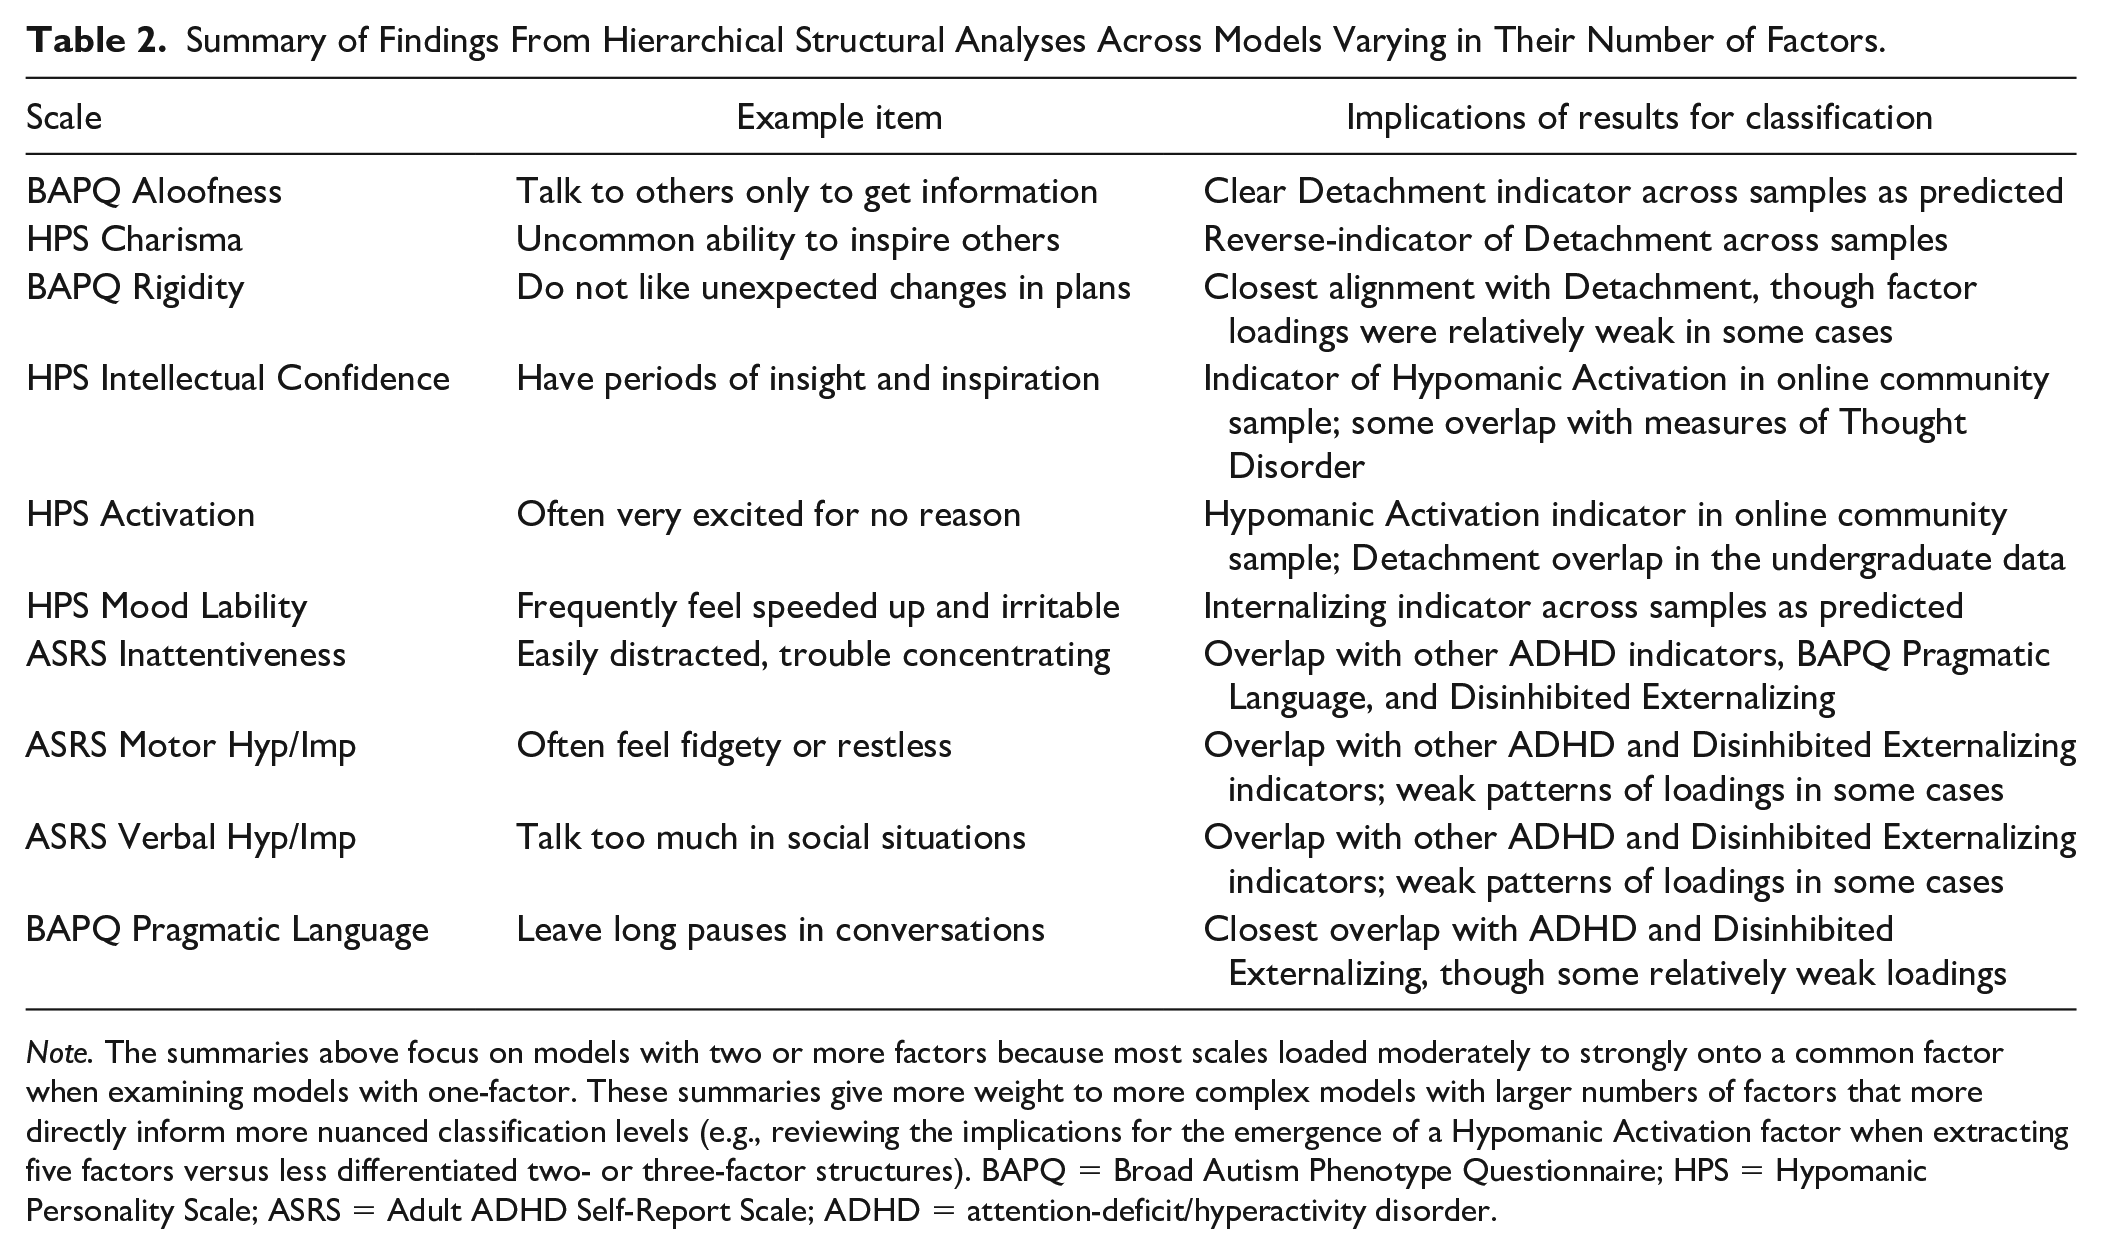
Note. The summaries above focus on models with two or more factors because most scales loaded moderately to strongly onto a common factor when examining models with one-factor. These summaries give more weight to more complex models with larger numbers of factors that more directly inform more nuanced classification levels (e.g., reviewing the implications for the emergence of a Hypomanic Activation factor when extracting five factors versus less differentiated two- or three-factor structures). BAPQ = Broad Autism Phenotype Questionnaire; HPS = Hypomanic Personality Scale; ASRS = Adult ADHD Self-Report Scale; ADHD = attention-deficit/hyperactivity disorder.
Model Fit Indices for Factor Structures Across Samples.
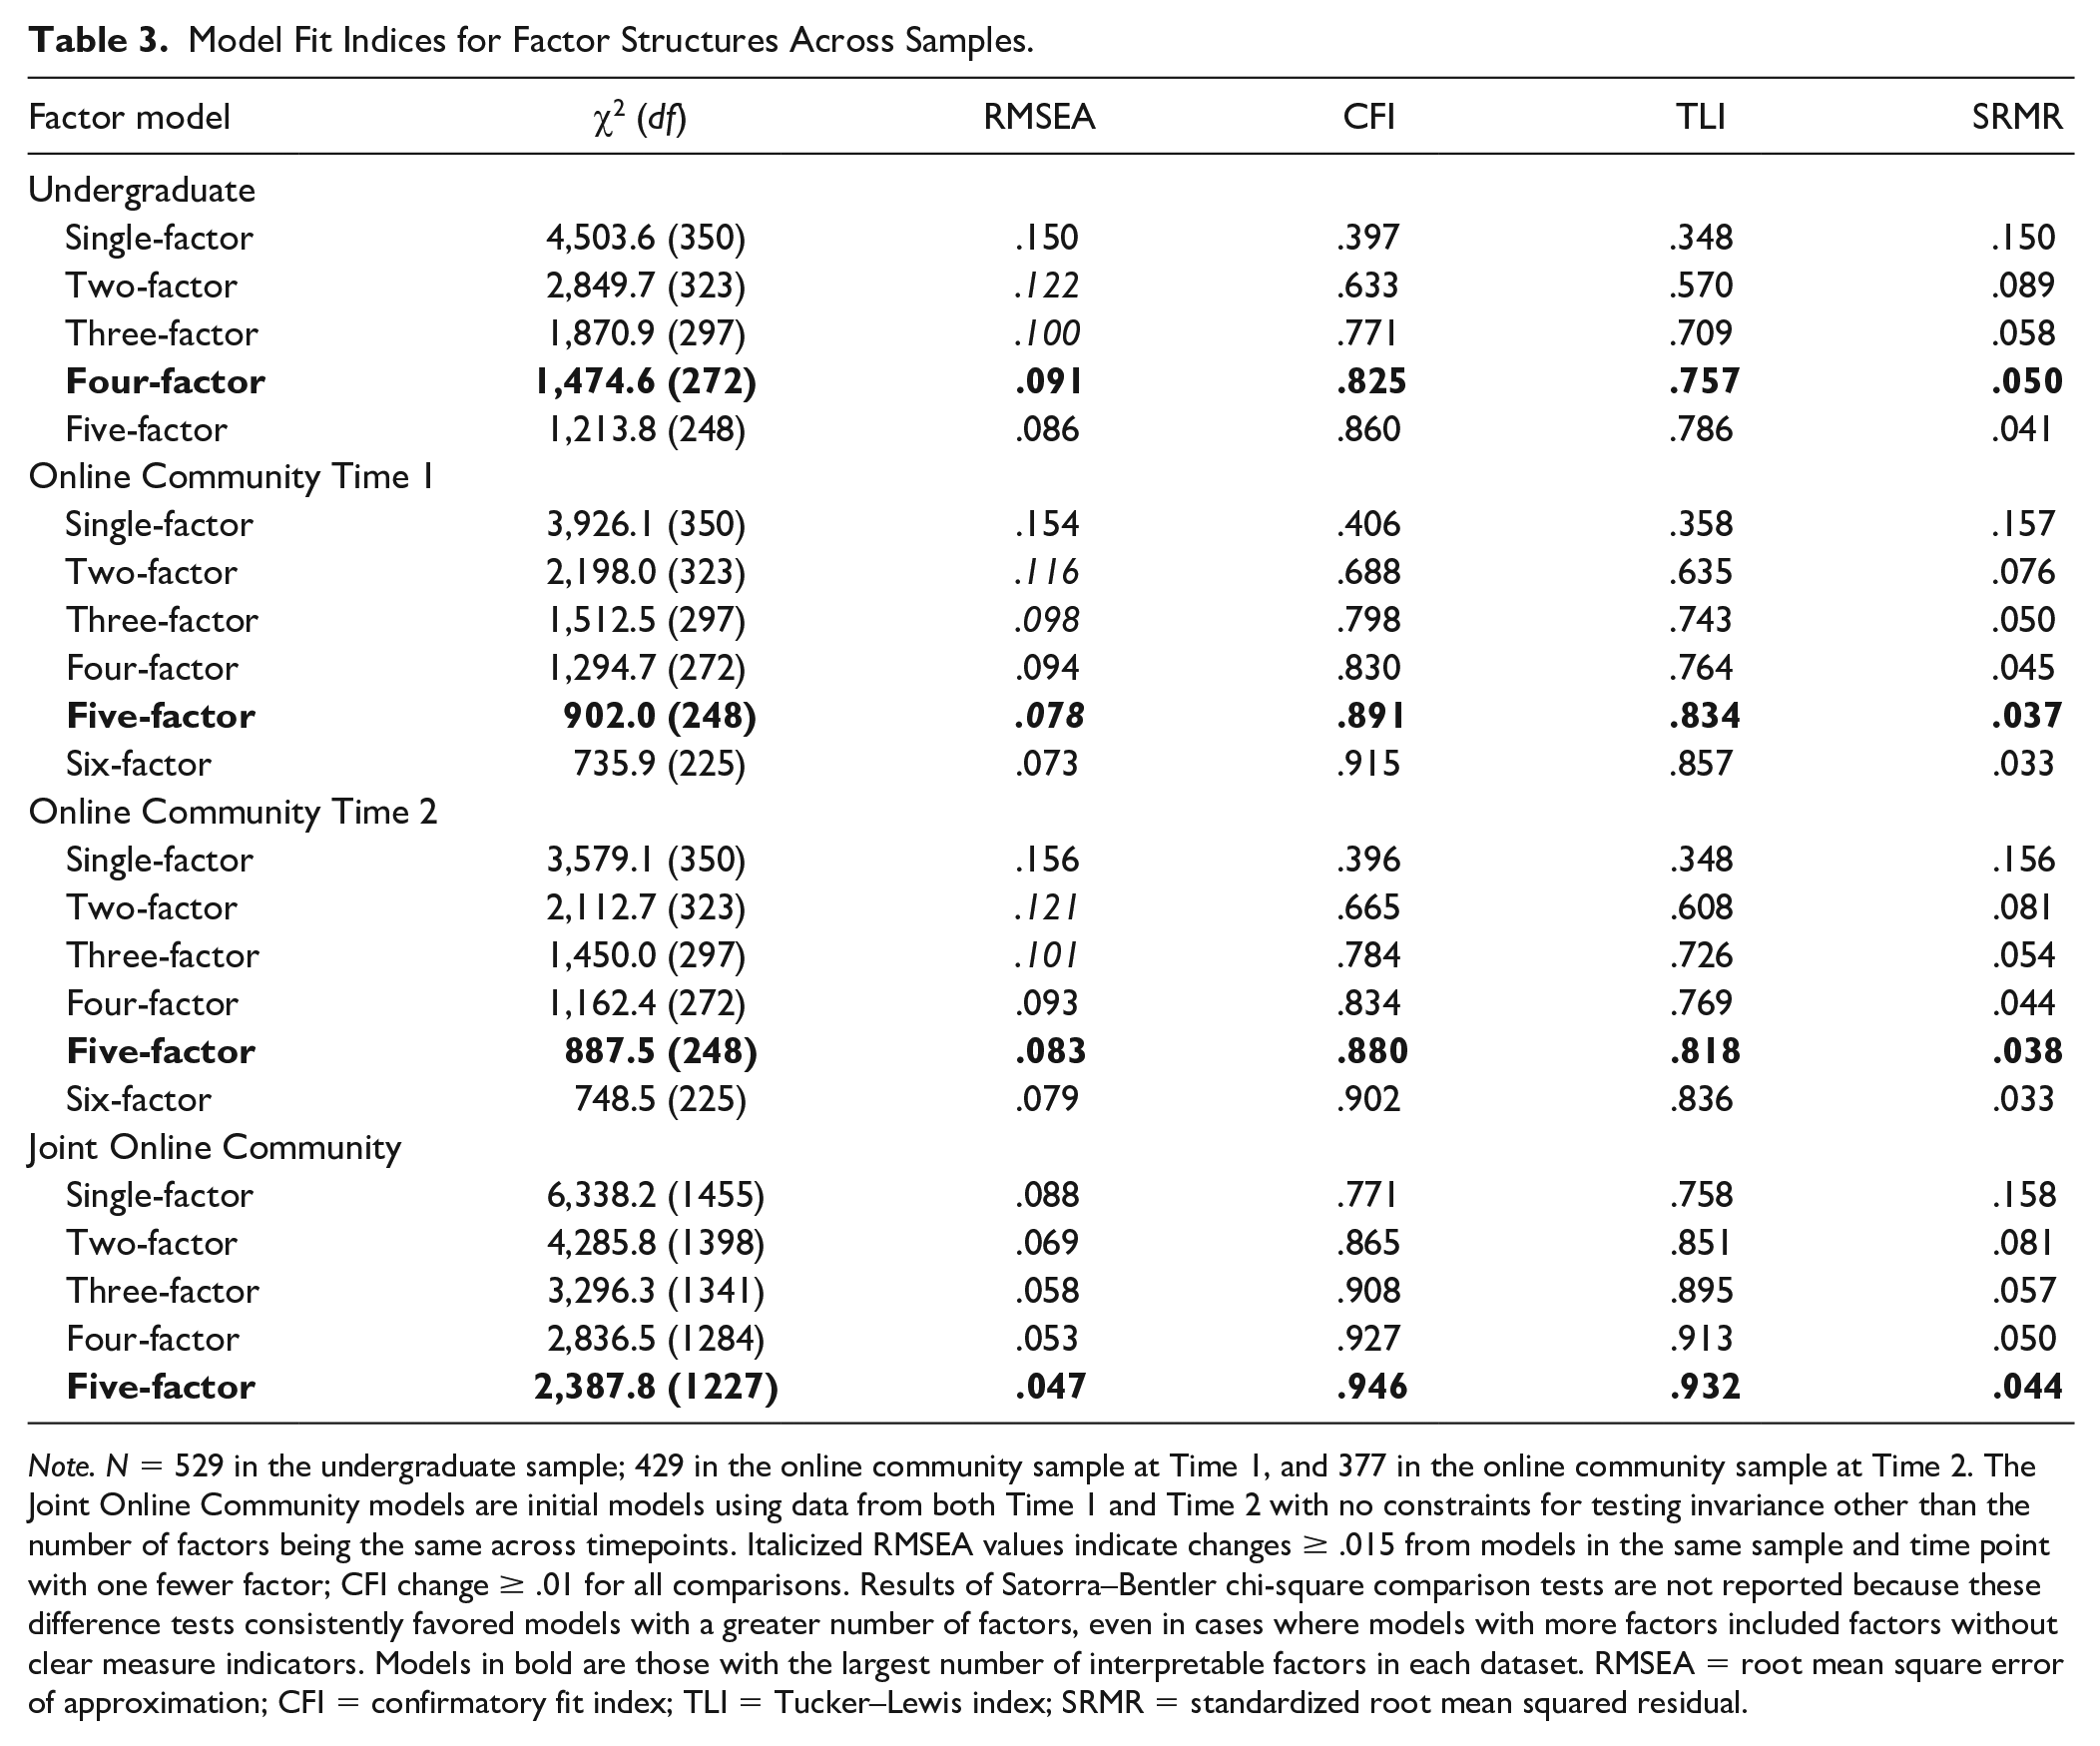
Note. N = 529 in the undergraduate sample; 429 in the online community sample at Time 1, and 377 in the online community sample at Time 2. The Joint Online Community models are initial models using data from both Time 1 and Time 2 with no constraints for testing invariance other than the number of factors being the same across timepoints. Italicized RMSEA values indicate changes ≥ .015 from models in the same sample and time point with one fewer factor; CFI change ≥ .01 for all comparisons. Results of Satorra–Bentler chi-square comparison tests are not reported because these difference tests consistently favored models with a greater number of factors, even in cases where models with more factors included factors without clear measure indicators. Models in bold are those with the largest number of interpretable factors in each dataset. RMSEA = root mean square error of approximation; CFI = confirmatory fit index; TLI = Tucker–Lewis index; SRMR = standardized root mean squared residual.
Acknowledging these issues, Figure 1 depicts hierarchical factor structures from each sample. Figure 1 pathway coefficients represent correlations between factors across hierarchy levels (e.g., from one- to two-factor models), with regression-based factor scores used to model factors. Beginning with single-factor solutions, most scales loaded moderately to strongly (e.g., CAT-PD Lability, ASRS Inattentiveness loaded > .70 across samples) onto a common factor that was similar across datasets (congruence coefficient = .96).
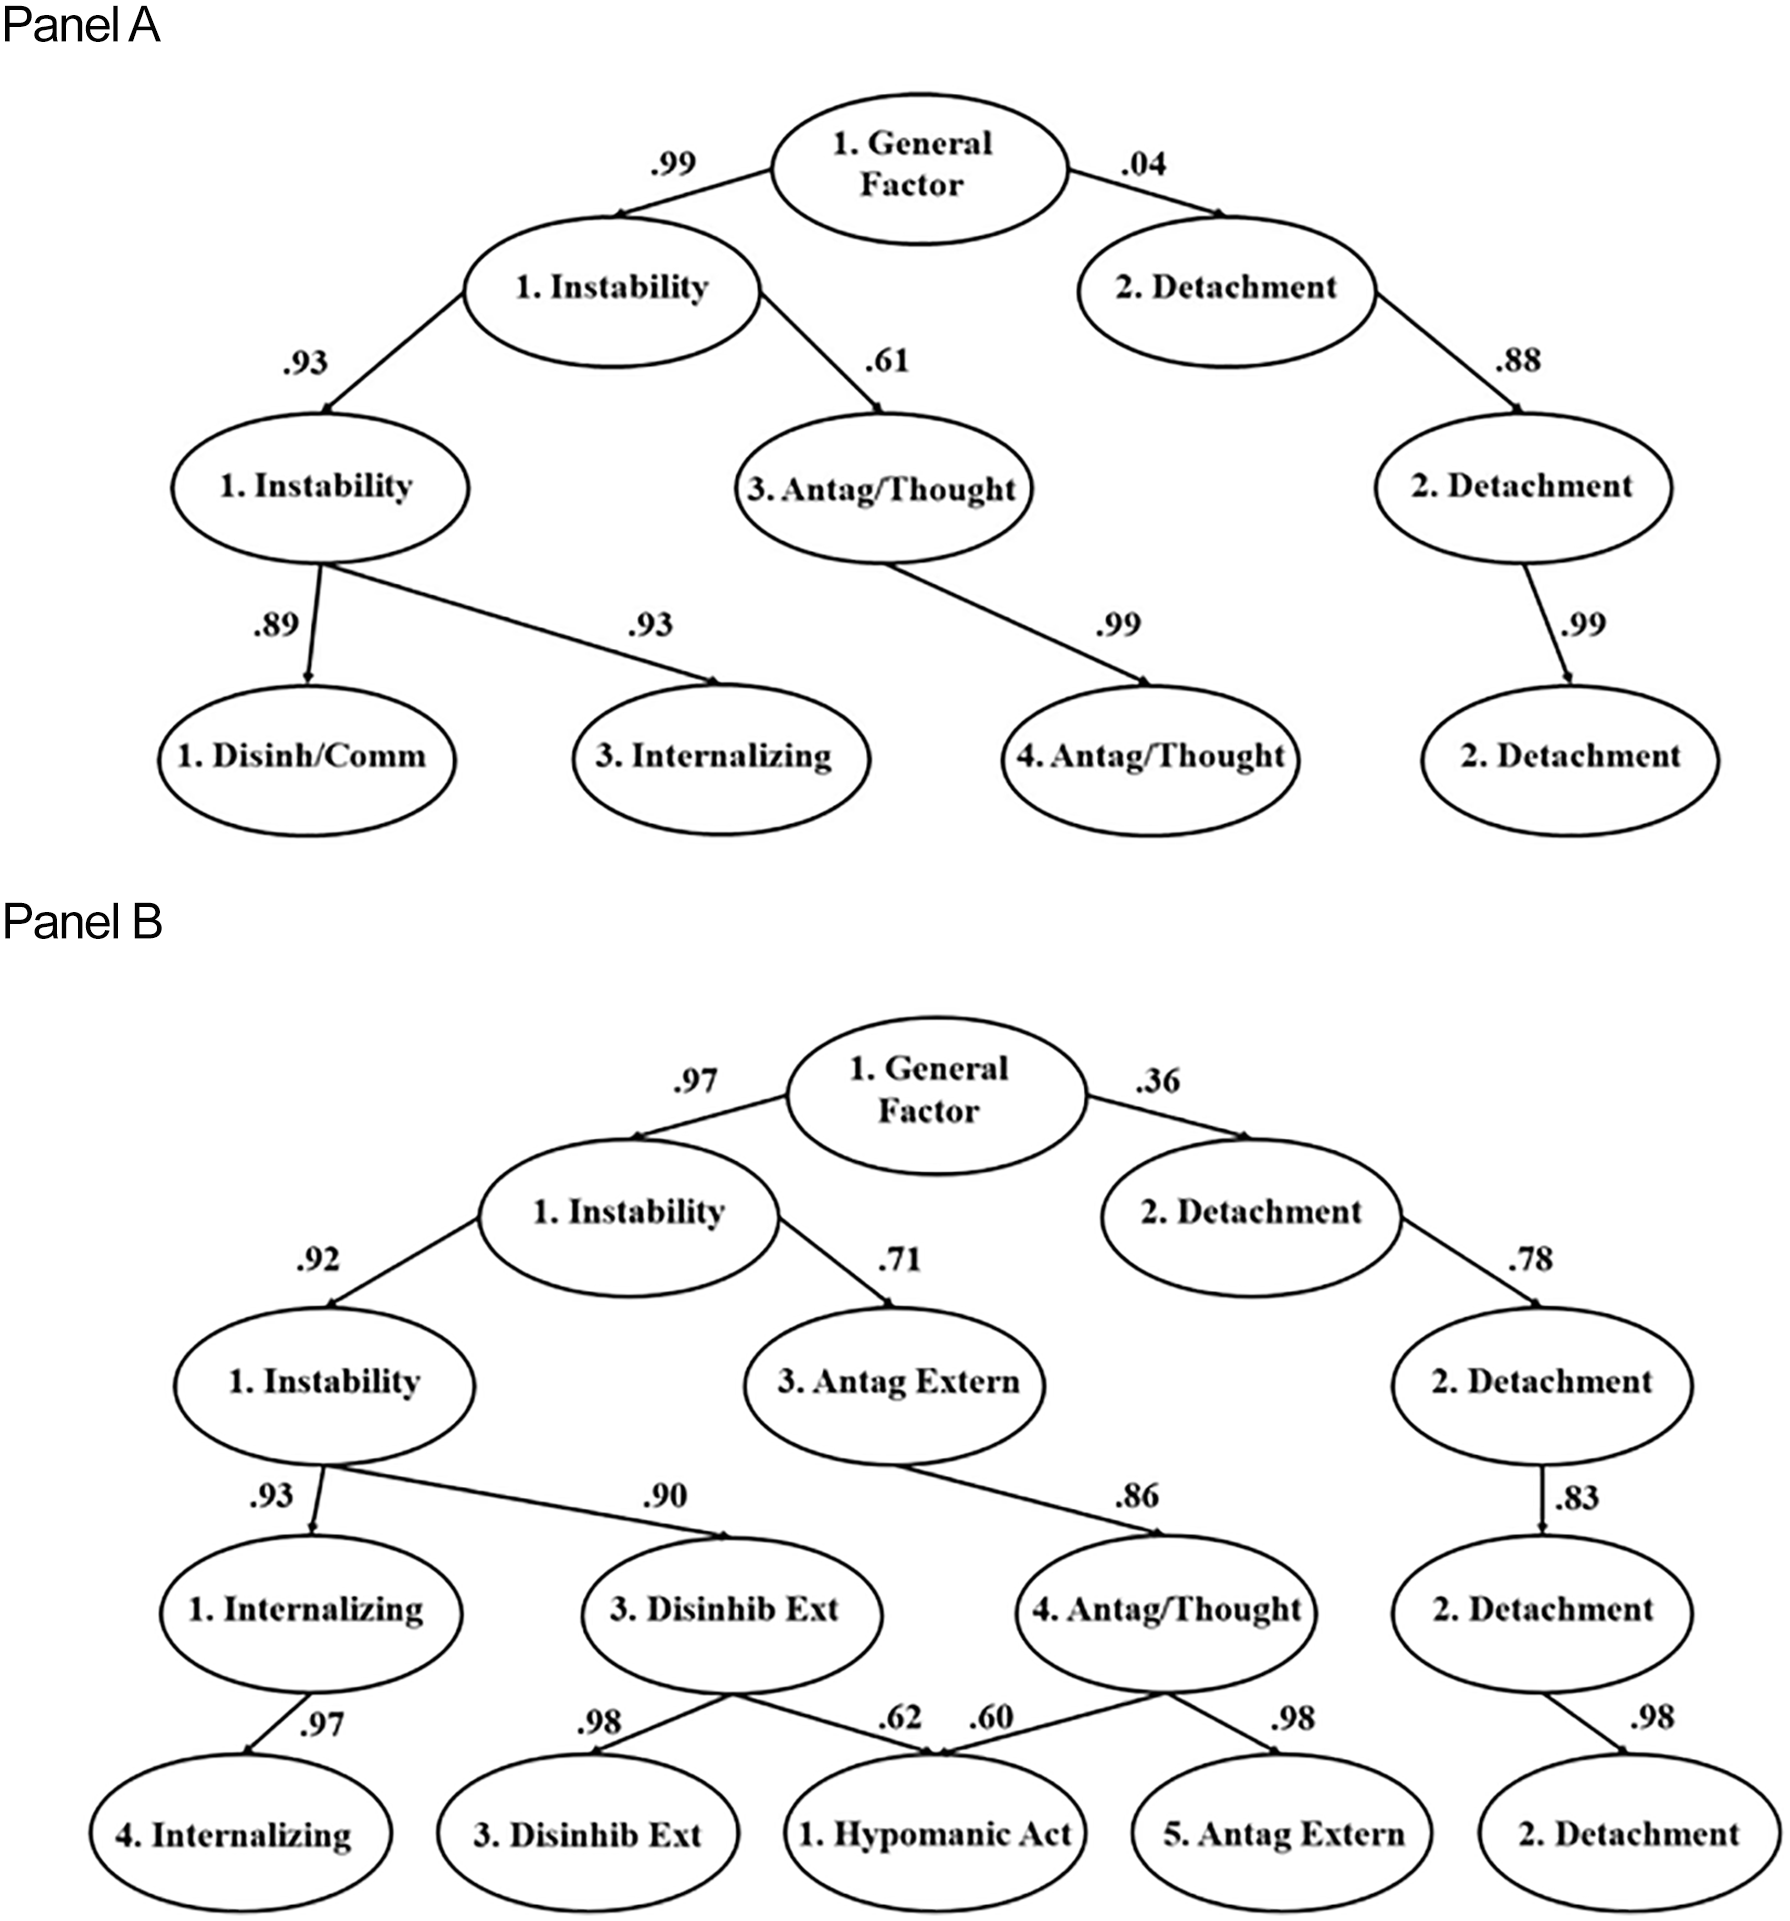
Hierarchical Factor Structures From the Undergraduate and Online Community Samples: Panel A and Panel B
Second, Online Table S6 provides two-factor model loadings and interfactor correlations. Many scales loaded strongly onto an Instability factor, including ADHD indicators, BAPQ Pragmatic Language Difficulties, and HPS Mood Lability (loadings ≥ .50). Scales such as HPS Charisma and BAPQ Aloofness loaded strongly (i.e., loadings > |.60| though in the opposite direction) onto a second Detachment factor. Congruence coefficients indicated fair similarity in cross-sample loadings (coefficients = .88 and .90 for Instability and Detachment, respectively). Note that for the undergraduate sample in this case, and in some other models examined subsequently, the direction of loadings for indicators such as HPS Charisma was positive rather than negative on factors reflecting detachment. However, we use the label Detachment when describing factors for consistency and clarity (rather than using two labels interchangeably to refer to the same basic factor representing Detachment/social engagement).
Next, Online Table S7 provides factor loadings and interfactor correlations for three-factor models. The first two factors in both samples again were labeled Instability and Detachment (pathway coefficients for these factors were > |.75| with factors with the same labels from the two-factor solution). The Instability (congruence coefficient = .96) and Detachment (congruence coefficient = .91) factors from these three-factor structures showed strong and fair cross-sample congruence. Finally, measures such as CAT-PD Unusual Beliefs and CAT-PD Manipulativeness and Grandiosity all loaded strongly (loadings > .60) on the third factor labeled Antagonism/Thought Disorder in the undergraduate dataset. The third factor from the online community dataset was labeled Antagonistic Externalizing (CAT-PD Manipulativeness, Callousness, and Grandiosity loadings > .60), as measures such as CAT-PD Unusual Beliefs did not load strongly onto the online community sample Antagonistic Externalizing factor. As a result, loadings for these factors showed weak congruence (congruence coefficient = .70).
Solutions With Four or More Factors Across Samples
Fit improved when extracting a fourth factor across samples (e.g., CFI improvement > .03 across samples), though some indices (i.e., CFI, TLI) still indicated poor overall fit. Values for SRMR indicated good fit (.050 in the undergraduate data and .045 in the online community data at Time 1; see Table 3), and RMSEA values met relaxed fit cutoffs (i.e., ≤ .10; however, RMSEA change was < .01 from three-factor models across samples).
Factor loadings and interfactor correlations for the four-factor structure from the undergraduate data are provided in Table 4. As shown in Figure 1, Detachment and Antagonism/Thought Disorder factors essentially carried over from the three-factor model (both pathway coefficients = .99). Scales previously loading strongly onto Instability split to load strongly onto Internalizing (pathway coefficient = .93 with Instability from the three-factor model) and Disinhibition/Communication (pathway coefficient = .89) factors. This latter factor was given this label because disinhibition trait measures (e.g., CAT-PD Non-Perseverance), (b) BAPQ Pragmatic Language Difficulties (e.g., “voice is monotone”), and (c) all ADHD measures loaded strongly onto this factor (e.g., ASRS Verbal Hyperactivity/ Impulsivity; all loadings ≥ .57). Notably then, most, but not all, NDD-relevant indicators loaded strongly onto this factor. Regarding other NDD- and hypomania-relevant measures, BAPQ Aloofness and HPS Charisma continued to load strongly onto Detachment as in prior models. However, HPS Intellectual Confidence and BAPQ Rigidity did not have overly strong loadings on any single emergent dimension as the Table 4 results indicate.
Geomin Rotated Factor Loadings From the Four-Factor Model in the Undergraduate Data.
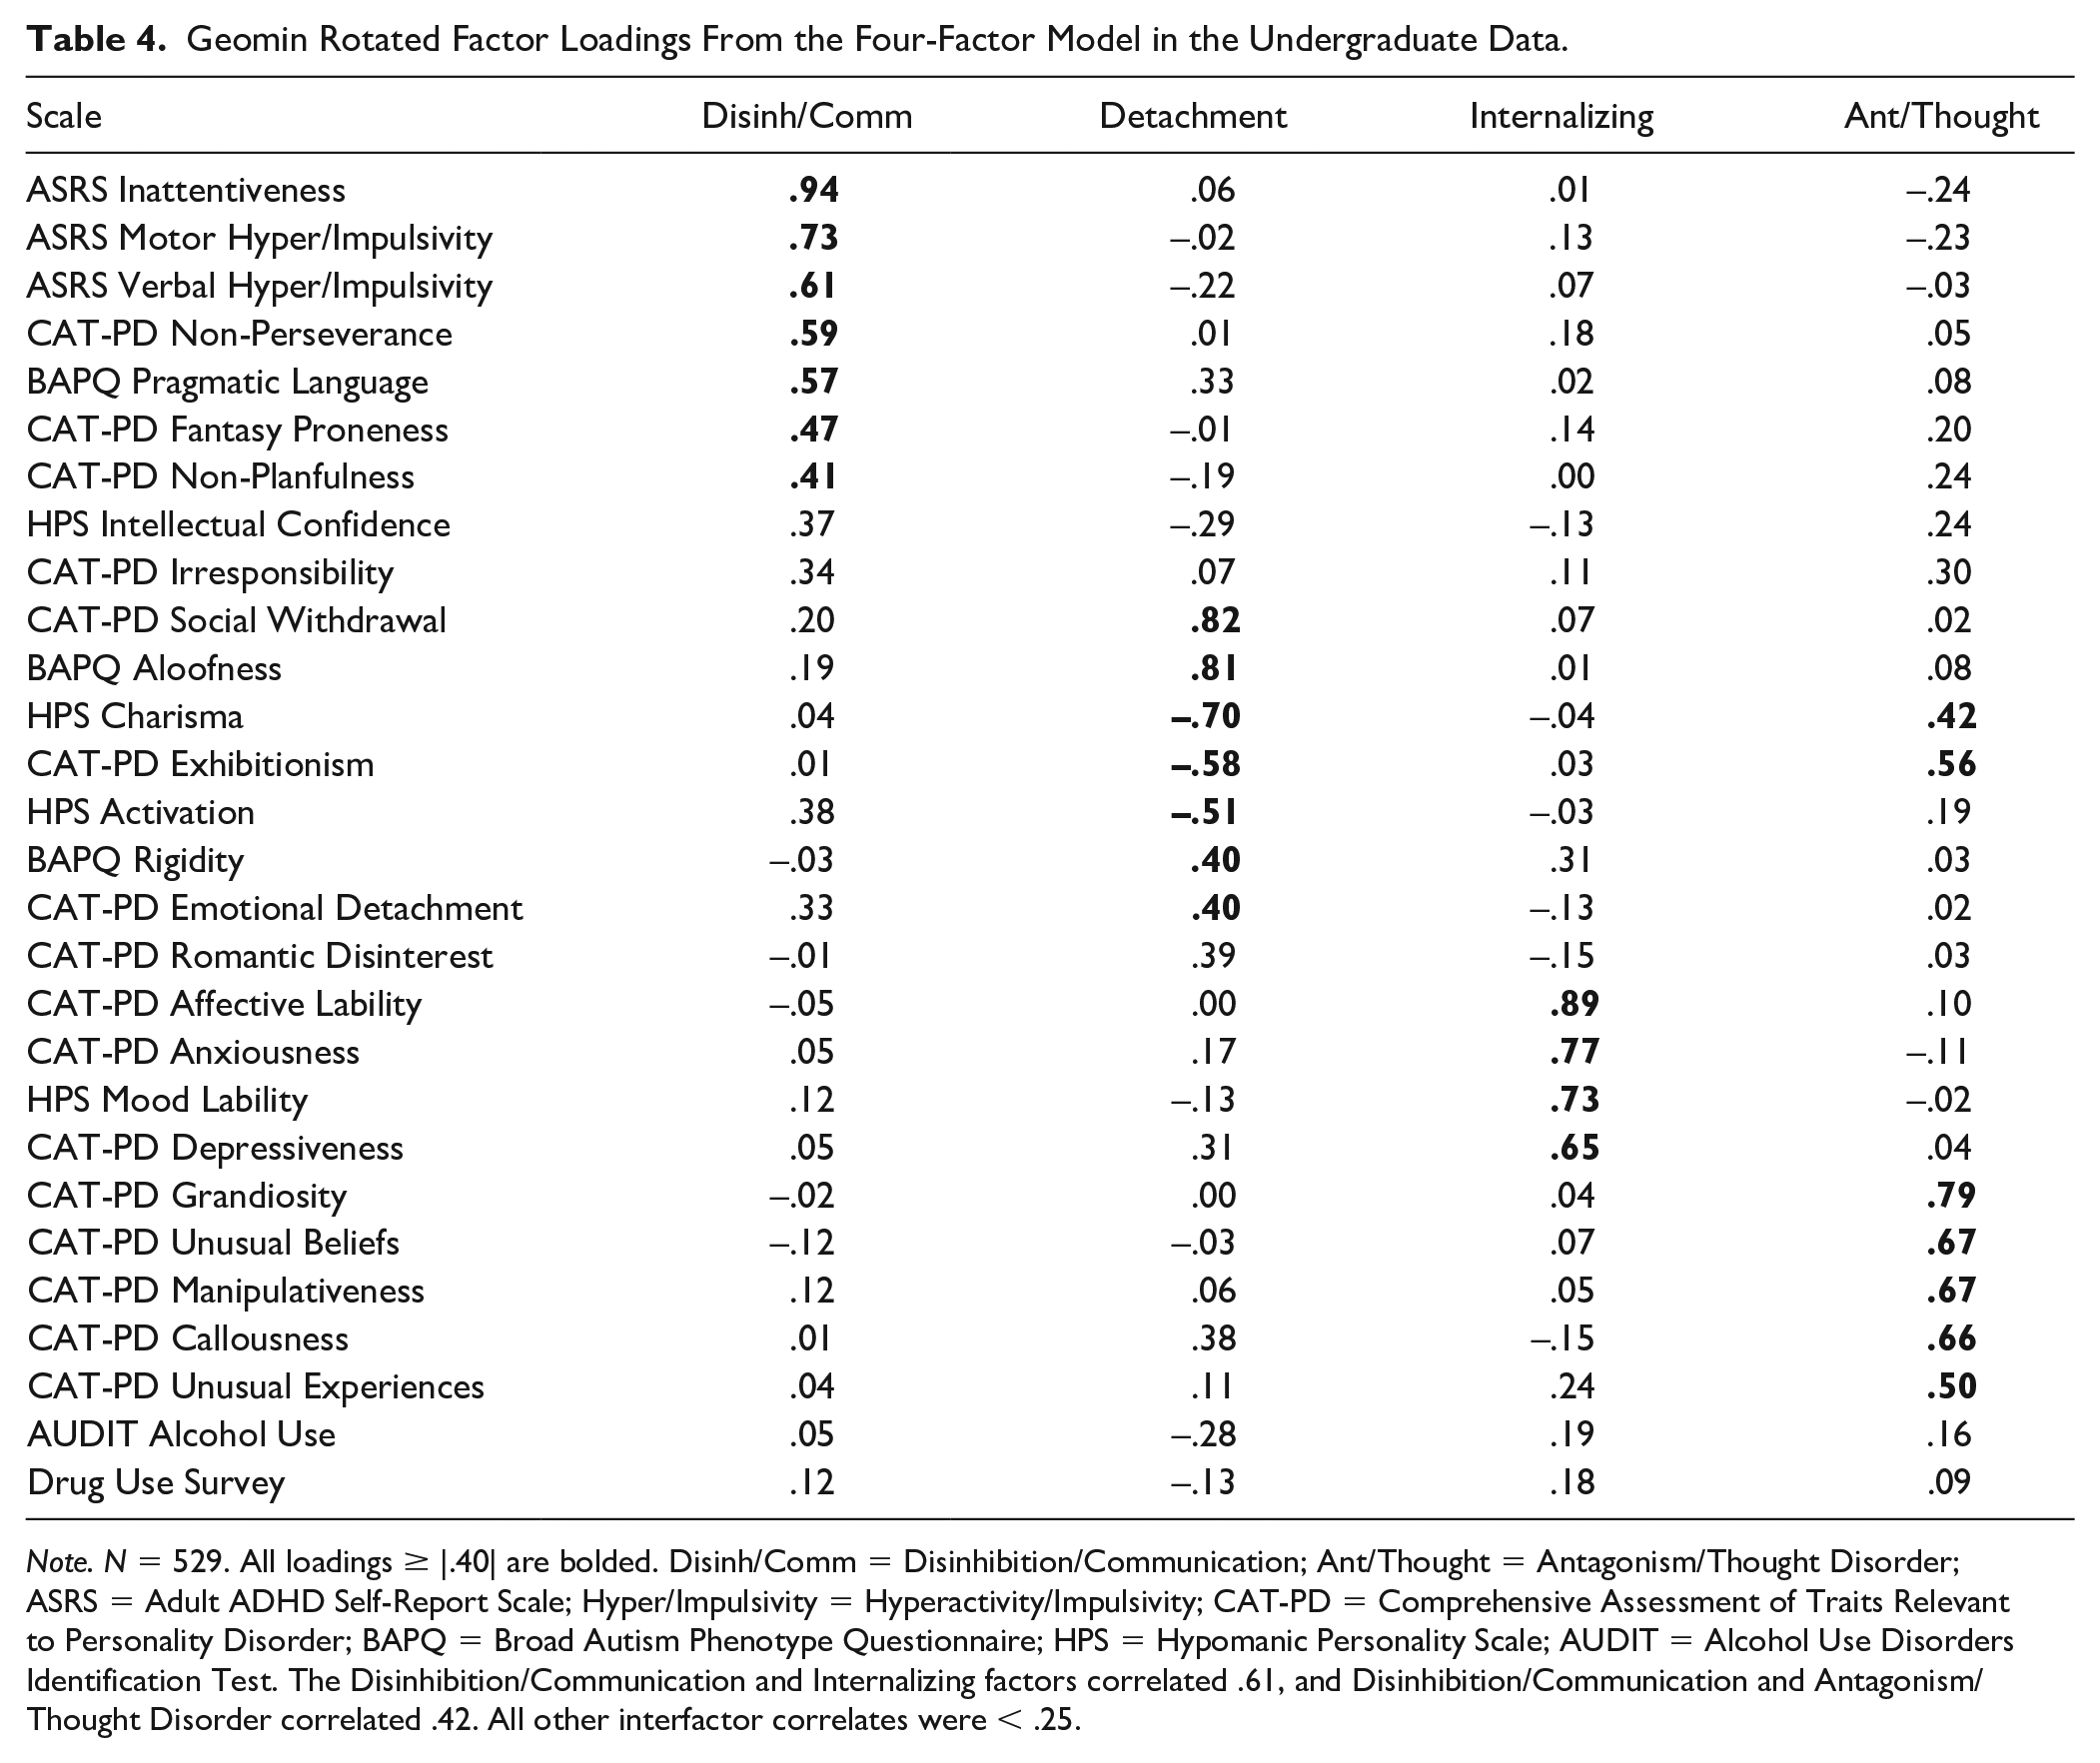
Note. N = 529. All loadings ≥ |.40| are bolded. Disinh/Comm = Disinhibition/Communication; Ant/Thought = Antagonism/Thought Disorder; ASRS = Adult ADHD Self-Report Scale; Hyper/Impulsivity = Hyperactivity/Impulsivity; CAT-PD = Comprehensive Assessment of Traits Relevant to Personality Disorder; BAPQ = Broad Autism Phenotype Questionnaire; HPS = Hypomanic Personality Scale; AUDIT = Alcohol Use Disorders Identification Test. The Disinhibition/Communication and Internalizing factors correlated .61, and Disinhibition/Communication and Antagonism/Thought Disorder correlated .42. All other interfactor correlates were < .25.
Online Table S8 provides factor loadings and interfactor correlations for the Time 1 online community sample four-factor structure. Detachment, Internalizing, and Antagonism/Thought Disorder (CAT-PD Unusual Beliefs now loaded .57 on this factor) factors emerged in this model. Congruence coefficients indicated strong loading similarity for the Detachment and Antagonism/Thought Disorder factors with their respective undergraduate factors (coefficients = .97 and .95, respectively), with fair similarity for Internalizing (coefficient = .89). We labeled the remaining factor Disinhibited Externalizing, which represented a counterpart to the Disinhibition/Communication factor from the undergraduate data to some extent (congruence coefficient = .91). However, ASRS Motor and Verbal Hyperactivity/Impulsivity had comparatively weaker loadings on this factor in the online community data (loadings = .44 and .34, respectively) than in the Table 4 undergraduate results, where both loadings > .60.
Next, although parallel analysis suggested that five factors could be extracted in the undergraduate data and model fit improved meaningfully in some ways (CFI > .03 when comparing four- to five-factor models; Table 3), only one measure (CAT-PD Irresponsibility) had its strongest loading on the fifth factor. This model was thus deemed untenable and not considered further, and these issues persisted for models with more than five factors.
Parallel analysis indicated that only up to four factors could be extracted in the online community dataset, but models with five or more factors were examined to determine their viability. For the five-factor model shown in Table 5, both RMSEA (.078; improvement of .016 from the four-factor model) and SRMR (.037) indicated at least acceptable fit. The CFI value (.891) improved by .061 from the four-factor model but was still slightly below cutoffs indicating acceptable fit, and TFI (.834) still indicated poor fit. When considering factor interpretability, several or more scale indicators were clear markers (i.e., primary loadings ≥ |40| and cross-loadings ≤ |.30|) of all five factors. Therefore, given RMSEA and CFI improvements and all factors appearing psychologically-meaningful and well-defined, we considered this to be sufficient evidence overall to consider this five-factor model further.
Five-Factor Model Geomin Rotated Factor Loadings From the Online Community Data (Time 1).
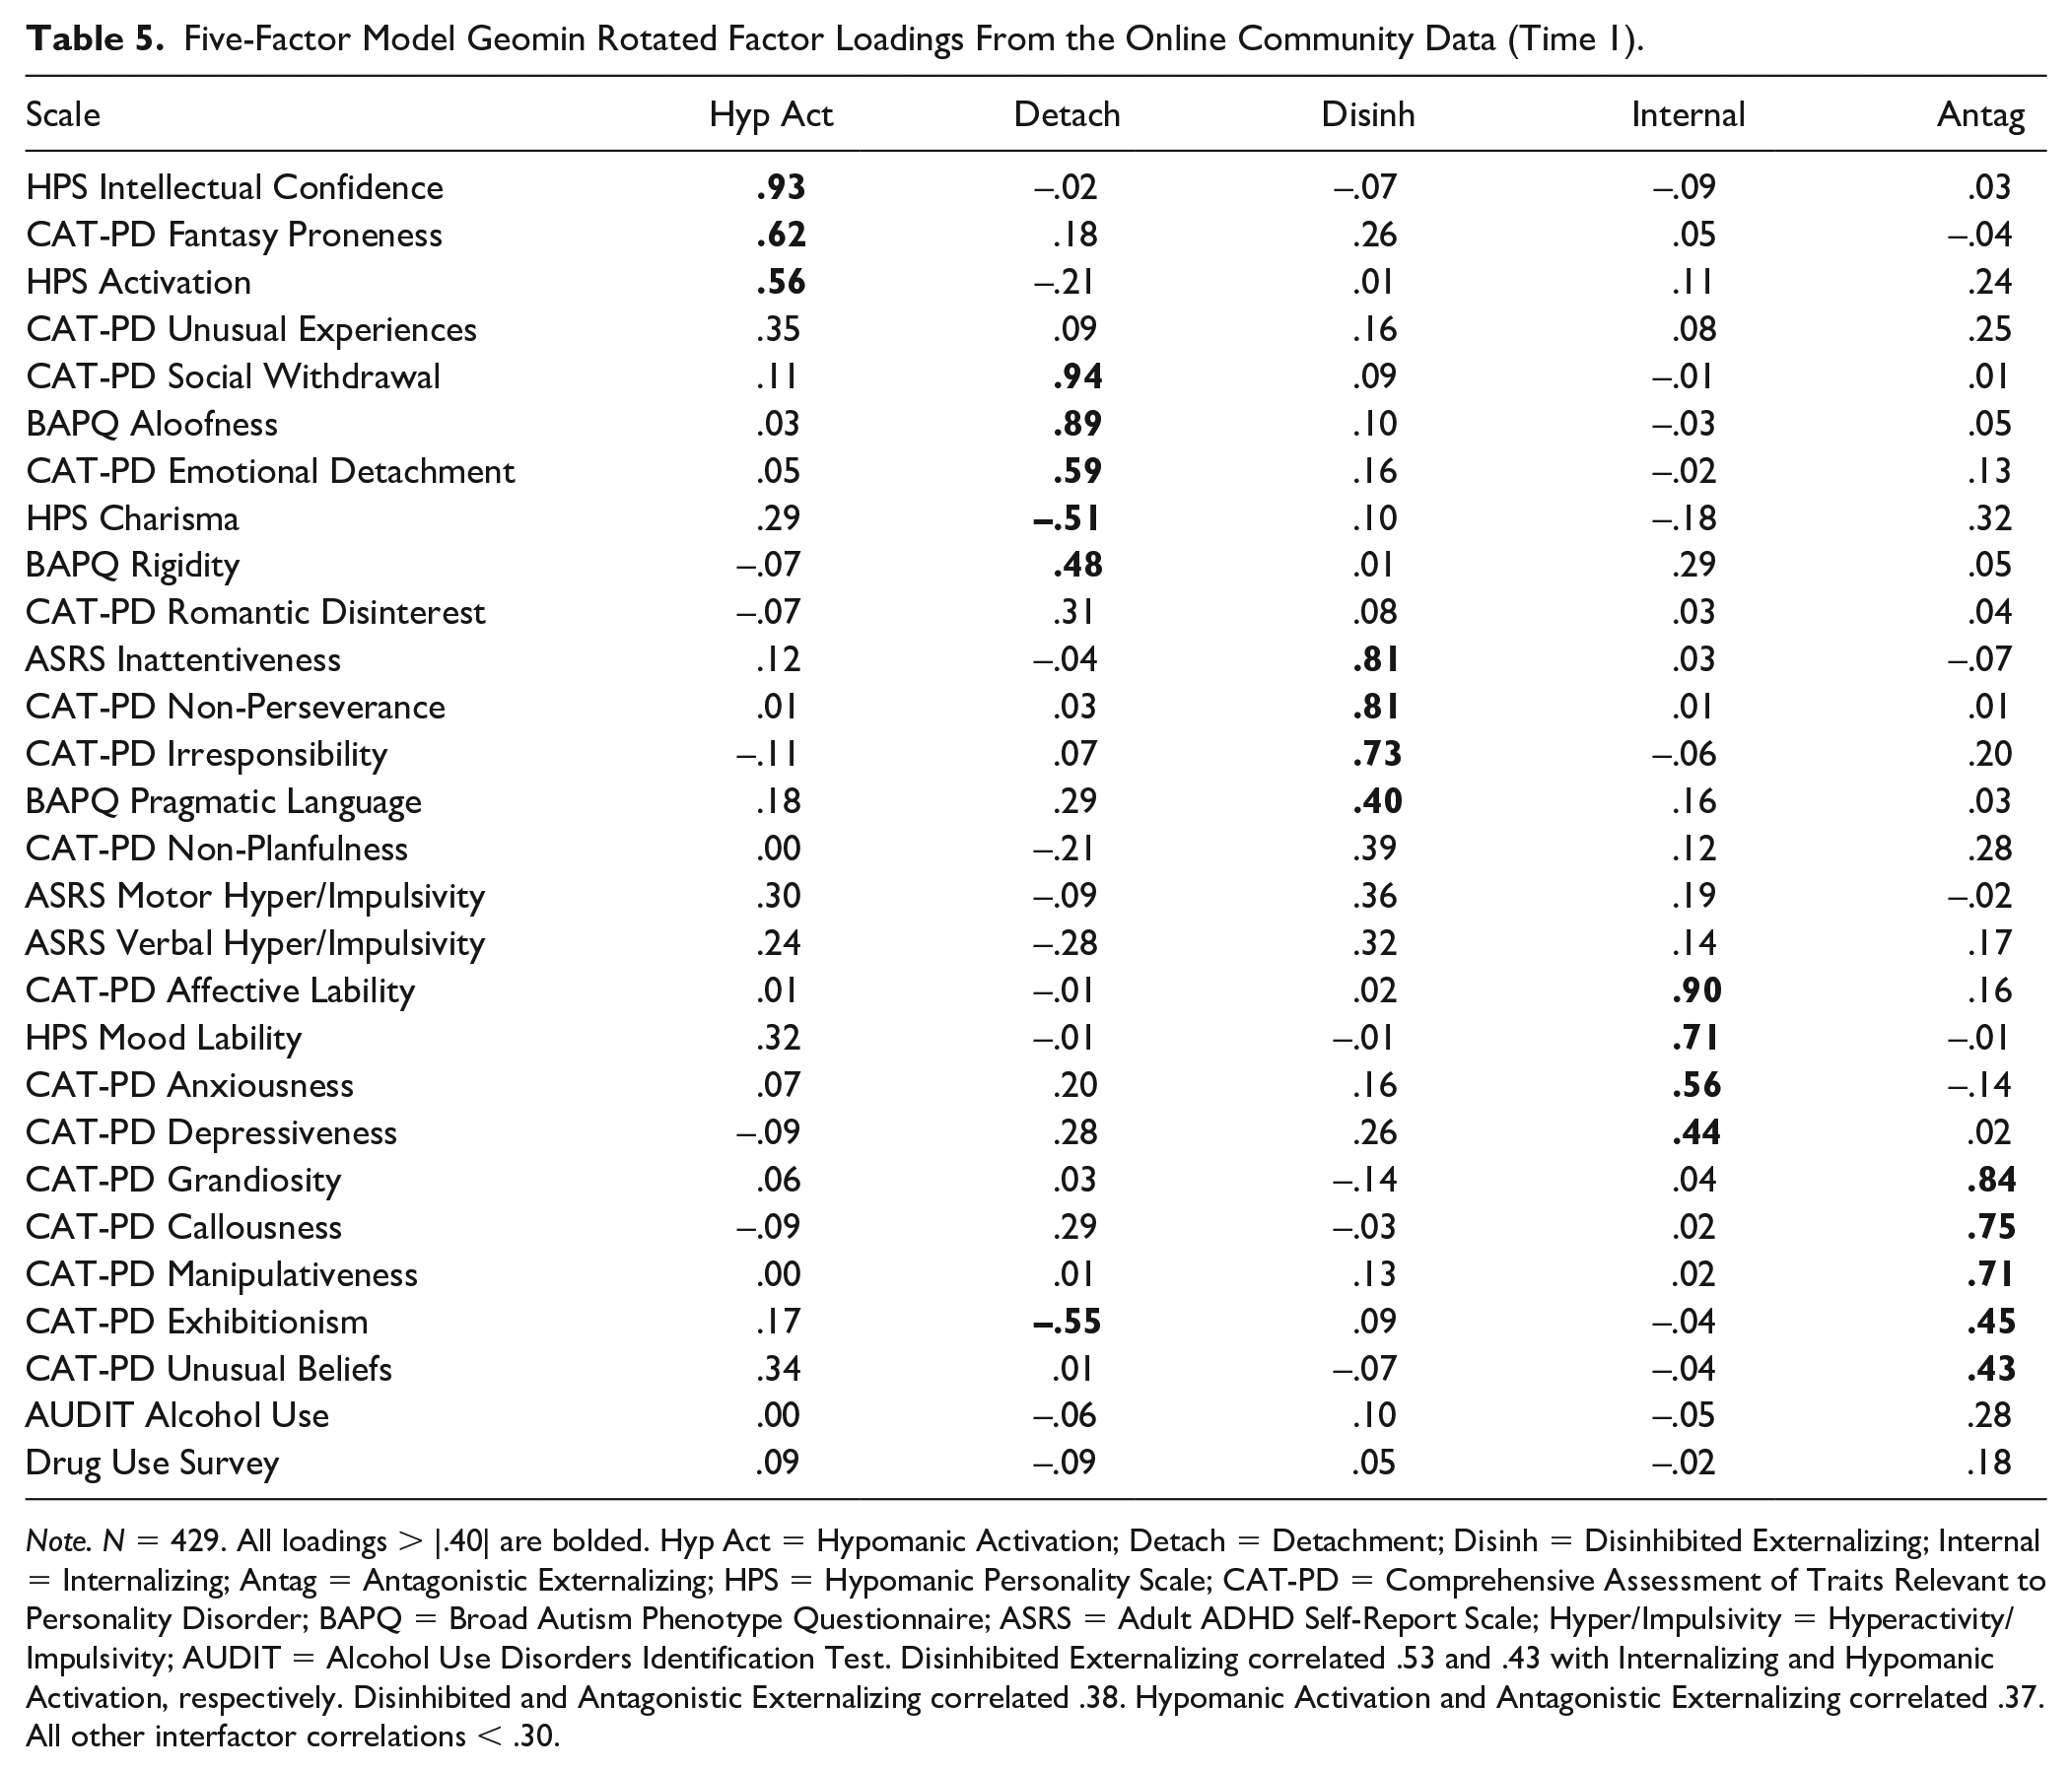
Note. N = 429. All loadings > |.40| are bolded. Hyp Act = Hypomanic Activation; Detach = Detachment; Disinh = Disinhibited Externalizing; Internal = Internalizing; Antag = Antagonistic Externalizing; HPS = Hypomanic Personality Scale; CAT-PD = Comprehensive Assessment of Traits Relevant to Personality Disorder; BAPQ = Broad Autism Phenotype Questionnaire; ASRS = Adult ADHD Self-Report Scale; Hyper/Impulsivity = Hyperactivity/Impulsivity; AUDIT = Alcohol Use Disorders Identification Test. Disinhibited Externalizing correlated .53 and .43 with Internalizing and Hypomanic Activation, respectively. Disinhibited and Antagonistic Externalizing correlated .38. Hypomanic Activation and Antagonistic Externalizing correlated .37. All other interfactor correlations < .30.
As shown in Figure 1, Detachment, Disinhibited Externalizing, and Internalizing again were identified when examining this five-factor model (all pathway coefficients ≥ .97 with corresponding four-factor model factors). Many of the same scales loaded strongly onto factors essentially carrying over from the four-factor model (e.g., HPS Lability on Internalizing; BAPQ Aloofness on Detachment; ASRS Inattentiveness on Disinhibited Externalizing). The factor labeled Antagonistic Externalizing also was closely connected with Antagonism/Thought Disorder from the four-factor model (pathway coefficient = .98). We altered the label for this factor slightly because scales such as CAT-PD Unusual Beliefs that were clear indicators of Antagonism/Thought Disorder in the four-factor model had notable cross-loadings (i.e., loading = .34) on an emergent Hypomanic Activation factor from the five-factor model. Relatedly, CAT-PD Unusual Experiences loaded most strongly (although weakly, loading =.35) on Hypomanic Activation. The factor label Hypomanic Activation was chosen because HPS scales (i.e., HPS Activation and Intellectual Confidence) assessing high energy and goal directed activity linked to extraversion were clear factor markers. In addition, CAT-PD Fantasy Proneness (e.g., “imagination can run wild”) loaded strongly onto this factor (loading = .62). Finally, regarding NDD measures, BAPQ Rigidity and BAPQ Pragmatic Language Difficulties were relatively clear indicators of Detachment and Disinhibited Externalizing, respectively (both primary loadings ≥ .40; no cross-loadings ≥ |.30|). However, ASRS Motor Hyperactivity/Impulsivity and ASRS Verbal Hyperactivity/Impulsivity did not load overly strongly on any factor (highest loadings = .36 and .32, respectively on Disinhibited Externalizing).
Finally, examination of a six-factor structure in the online community data yielded some modest overall model fit improvement (e.g., RMSEA decrease of only .005). Furthermore, only two scales, ASRS Motor Hyperactivity/Impulsivity and ASRS Verbal Hyperactivity/Impulsivity, were clear indicators (i.e., both primary loadings ≥ .40; no cross-loadings ≥ |.30|) of the second factor. This provides some evidence of the distinctiveness of these symptom dimensions, but other factors in this model also were narrowly defined (e.g., only two clear markers for Antagonistic Externalizing). These issues with poor factor definition were exacerbated when extracting seven or more factors, and we do not consider models with six or more factors further.
Factor Similarity Across the Time 1 and Time 2 Online Community Assessments
Initial Time 2 ESEM analyses used only Time 2 data to obtain a general sense of the extent to which the overall patterns of results mirrored those from Time 1. Parallel analysis indicated that up to four factors could be extracted in the Time 2 data. Values for RMSEA were lower than relaxed cutoffs of ≤ .10 in models with four or more factors, and SRMR indicated good fit for models with three or more factors as shown in Table 3. Values for CFI and TLI indicated poor fit for Time 2 models ranging from one to five factors.
Online Tables S6–S9 provide unconstrained factor loadings (i.e., not constrained to equality with Time 1) for Time 2 models with two- to five-factors (most scales had moderate to strong loadings when examining a single-factor model). Examination of Time 2 models ranging in complexity indicated that the nature of factors and factor loadings closely paralleled those from the Time 1 online community data. For example, a maximum of five interpretable factors could be identified in the Time 2 data, with factors appearing to align with those from Time 1 (i.e., Hypomanic Activation, Detachment, Disinhibited Externalizing, Internalizing, and Antagonistic Externalizing factors). Similar to the Time 1 results, models with six or more factors were untenable due to some factors lacking a sufficient number of scale markers and being difficult to interpret. Also paralleling the Time 1 data, improvements in fit when extracting a sixth factor were modest (e.g., RMSEA decrease of only .004).
Due to the apparent similarities across time points regarding the number and nature of factors, we proceeded to conduct formal examinations of temporal invariance. Specifically, we compared (a) models where the only model restriction involved holding the number of factors constant across timepoints with (b) models where both factor loadings and indicator thresholds were constrained to equality. These comparisons required accounting for the participants being readministered the same measures by correlating residuals for factor indicators across timepoints (Nixon et al., 2020). Table 3 provides fit indices for initial comparison models where only the number of factors were held constant. Model fit was acceptable to good according to most indices (e.g., RMSEA < .06) for these baseline models with three or more factors leveraging data from both timepoints. Even though model fit was poor for models with only one or two factors, we still conducted examinations of invariance for all models ranging from one to five factors to determine invariance across factor hierarchy levels. For all levels, models where both factor loadings and thresholds were constrained to equality across timepoints met very stringent criteria for invariance (i.e., CFI decreases ≤ .002; RMSEA increases ≤ .007; Meade et al., 2008) when compared to models where only the number of factors were held constant.
Factor Associations with Other Study Variables
Overview and Undergraduate Sample Associations
Finally, we examined correlations for dimensions from the four-factor undergraduate model and the five-factor online community model. Dimensions were modeled using regression-based factor scores. As shown in Table 6, some associations in the undergraduate data were not surprising; for example, Internalizing and IDAS-II Dysphoria both reflect distress levels and correlated strongly. Internalizing also had noteworthy associations with functional impairment and other clinical variables (e.g., perceived quality of life impact). Notably, some factors showed stronger overall patterns of associations. Disinhibition/Communication had the strongest average correlation with the four IDAS-II symptom ratings of any factor (overall average r = .55) and correlated moderately with some clinical ratings (e.g., functional impairment, r = .43). In contrast, Detachment showed only two correlates > .30 (i.e., IDAS-II Social Anxiety and quality of life), and Antagonism/Thought Disorder had one correlate > .30 (i.e., IDAS-II Euphoria).
Correlations for Emergent Factors With Other Study Ratings in the Undergraduate Sample.
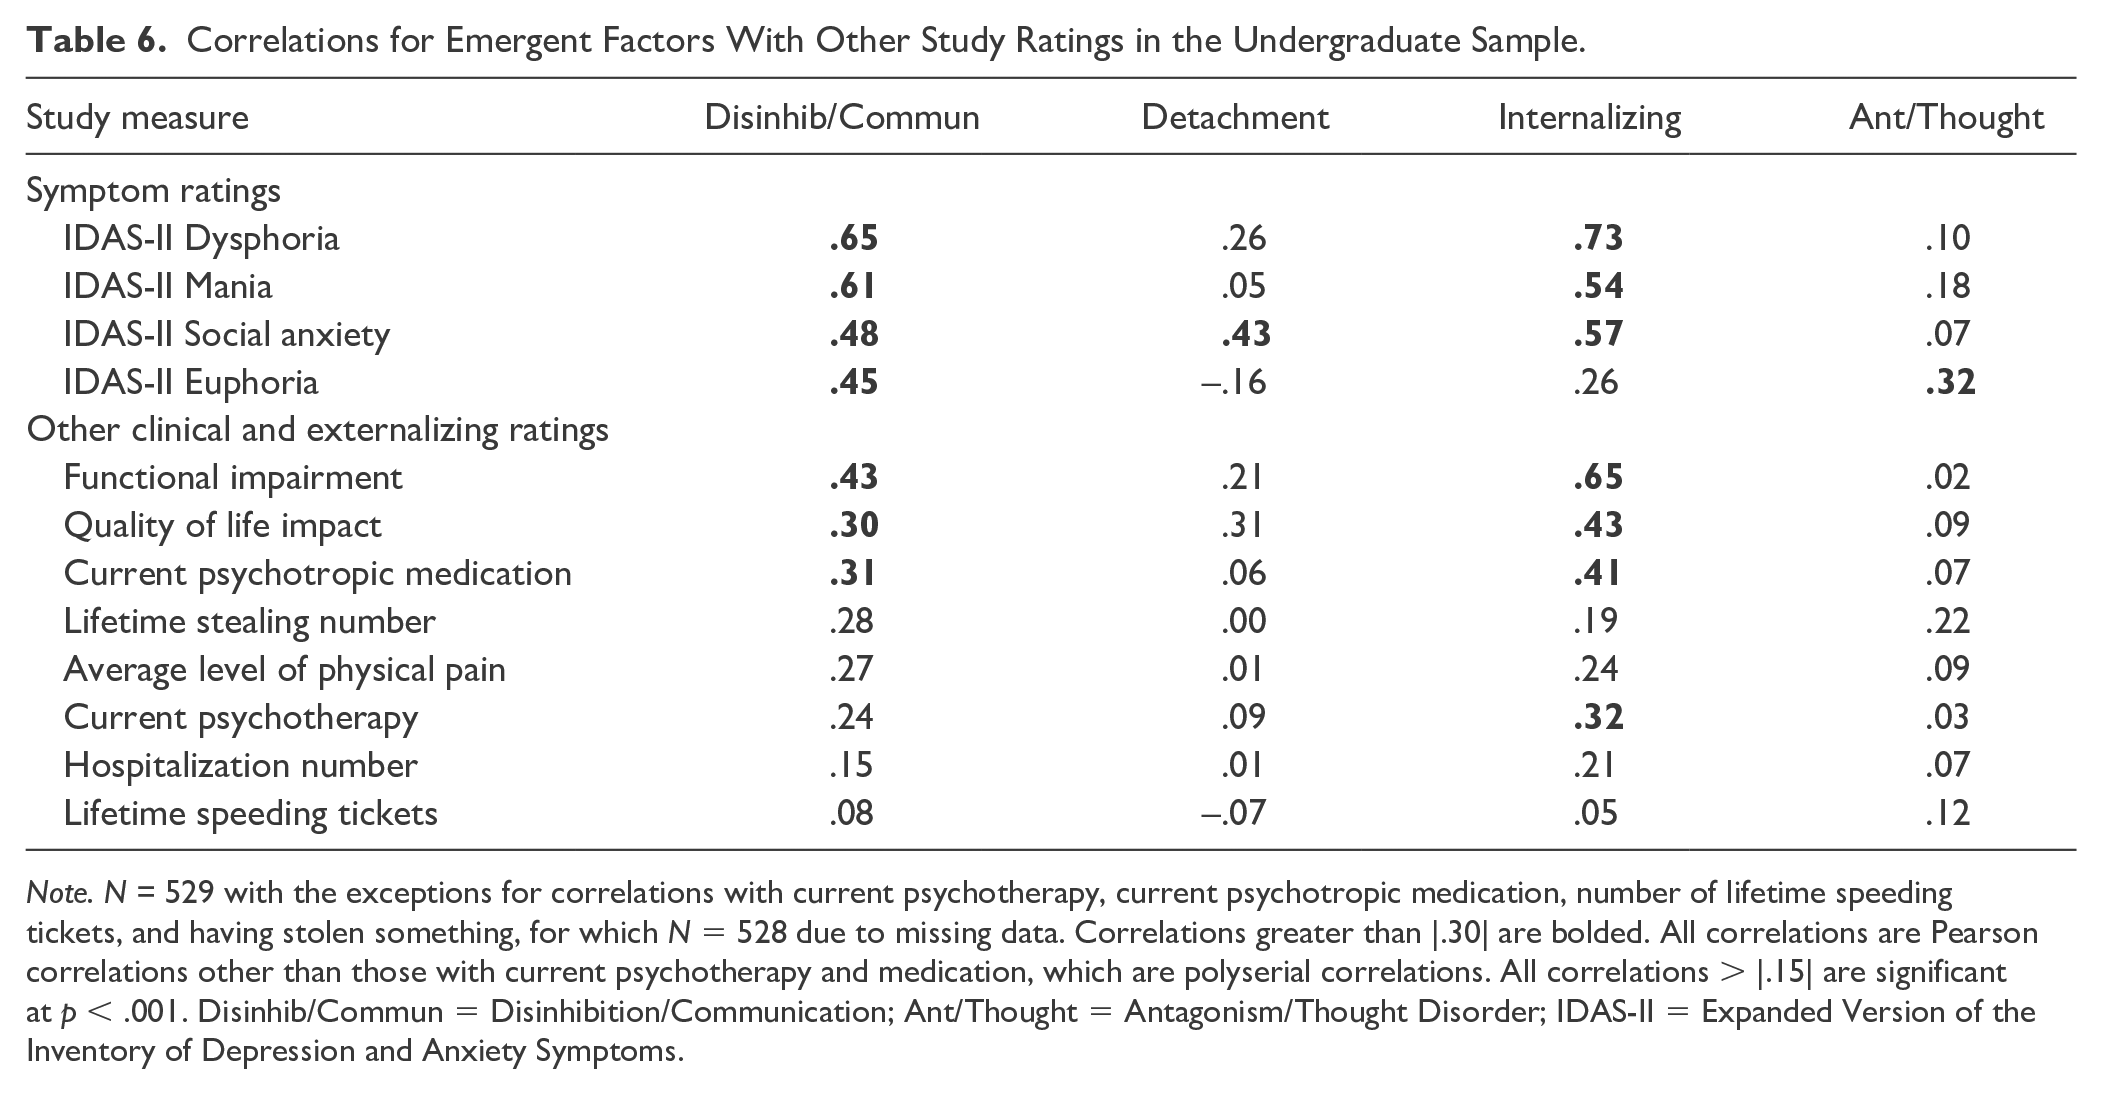
Note. N = 529 with the exceptions for correlations with current psychotherapy, current psychotropic medication, number of lifetime speeding tickets, and having stolen something, for which N = 528 due to missing data. Correlations greater than |.30| are bolded. All correlations are Pearson correlations other than those with current psychotherapy and medication, which are polyserial correlations. All correlations > |.15| are significant at p < .001. Disinhib/Commun = Disinhibition/Communication; Ant/Thought = Antagonism/Thought Disorder; IDAS-II = Expanded Version of the Inventory of Depression and Anxiety Symptoms.
Online Community Sample Associations Across Timepoints
Table 7 provides cross-sectional correlates from the online community sample across timepoints. Factors again generally showed patterns of correlates that would be anticipated based on the content of scales that loaded strongly onto them (e.g., Hypomanic Activation associating robustly with IDAS-II Euphoria and Mania scores; all rs > .55 across timepoints). Disinhibited Externalizing correlated robustly with various symptom ratings, even correlating slightly more strongly with measures such as IDAS-II Dysphoria (rs = .65 and .67, respectively at Times 1 and 2) than did the Internalizing factor. Consistent with the undergraduate sample results, factors such as Detachment showed few notable correlates.
Cross-Sectional Correlations for Emergent Dimensions With Other Study Ratings in the Online Community Sample.
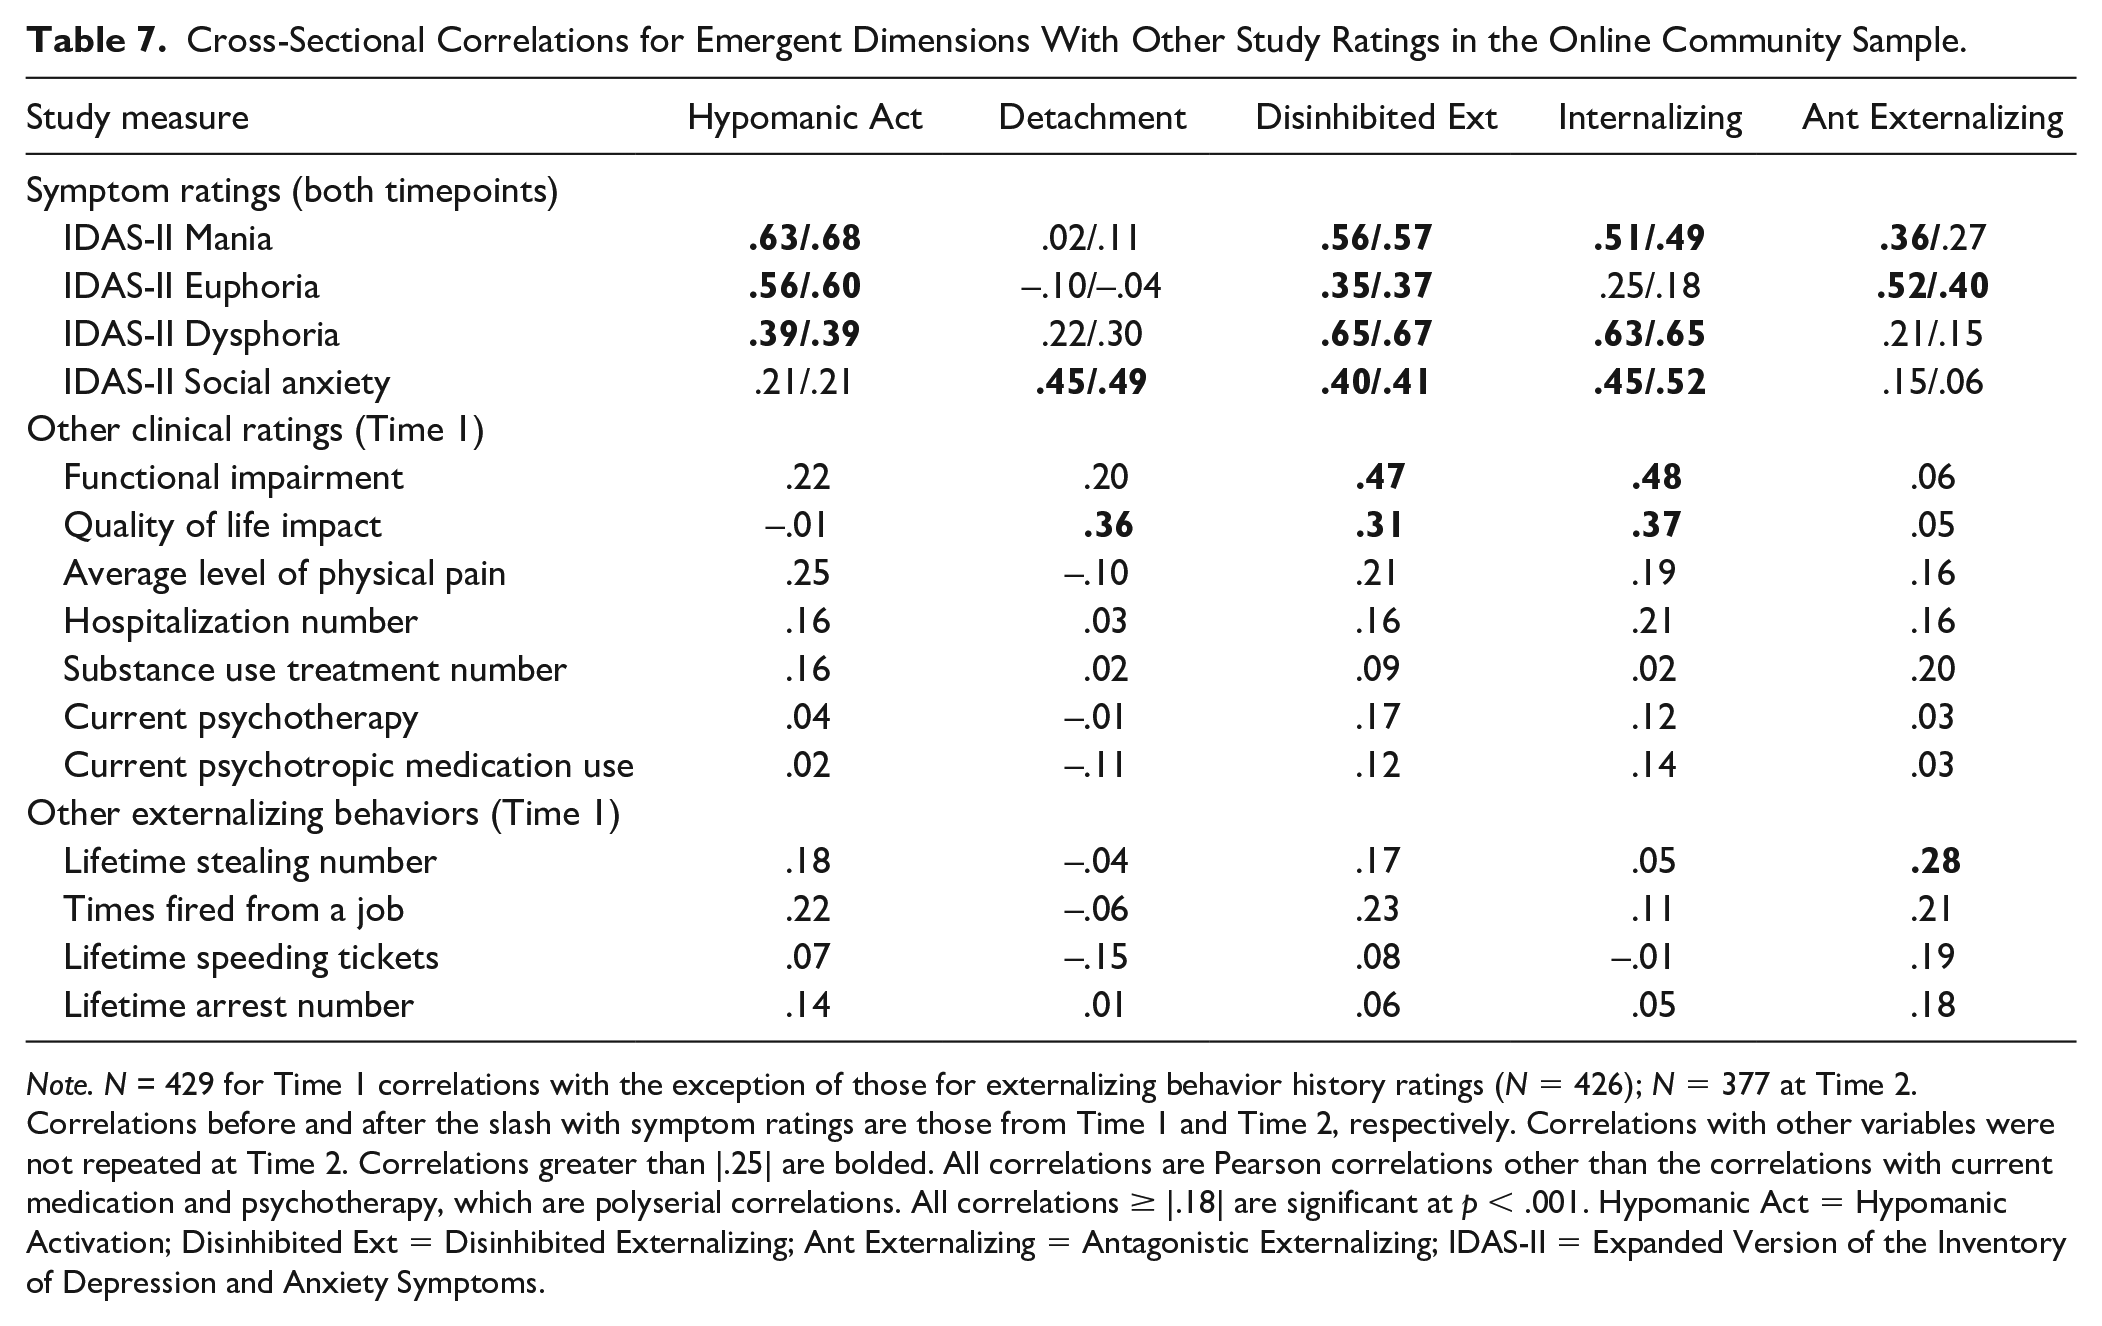
Note. N = 429 for Time 1 correlations with the exception of those for externalizing behavior history ratings (N = 426); N = 377 at Time 2. Correlations before and after the slash with symptom ratings are those from Time 1 and Time 2, respectively. Correlations with other variables were not repeated at Time 2. Correlations greater than |.25| are bolded. All correlations are Pearson correlations other than the correlations with current medication and psychotherapy, which are polyserial correlations. All correlations ≥ |.18| are significant at p < .001. Hypomanic Act = Hypomanic Activation; Disinhibited Ext = Disinhibited Externalizing; Ant Externalizing = Antagonistic Externalizing; IDAS-II = Expanded Version of the Inventory of Depression and Anxiety Symptoms.
Table 8 presents correlations for Time 1 factors with Time 2 past week ratings, with factors generally showing theoretically consistent associations (e.g., a significant association at p < .001 for Disinhibited Externalizing with number of late appointments over the past week). Furthermore, these results again indicated that some factors showed stronger patterns of correlates overall than others. For example, Disinhibited Externalizing and Internalizing had five and four respective correlates that were significant at a p < .001 level, whereas Hypomanic Activation, Detachment, and Antagonistic Externalizing had only two such correlates.
Prospective Correlations for Time 1 Dimensions With Past Week Clinical Ratings at Time 2 in the Online Community Sample.
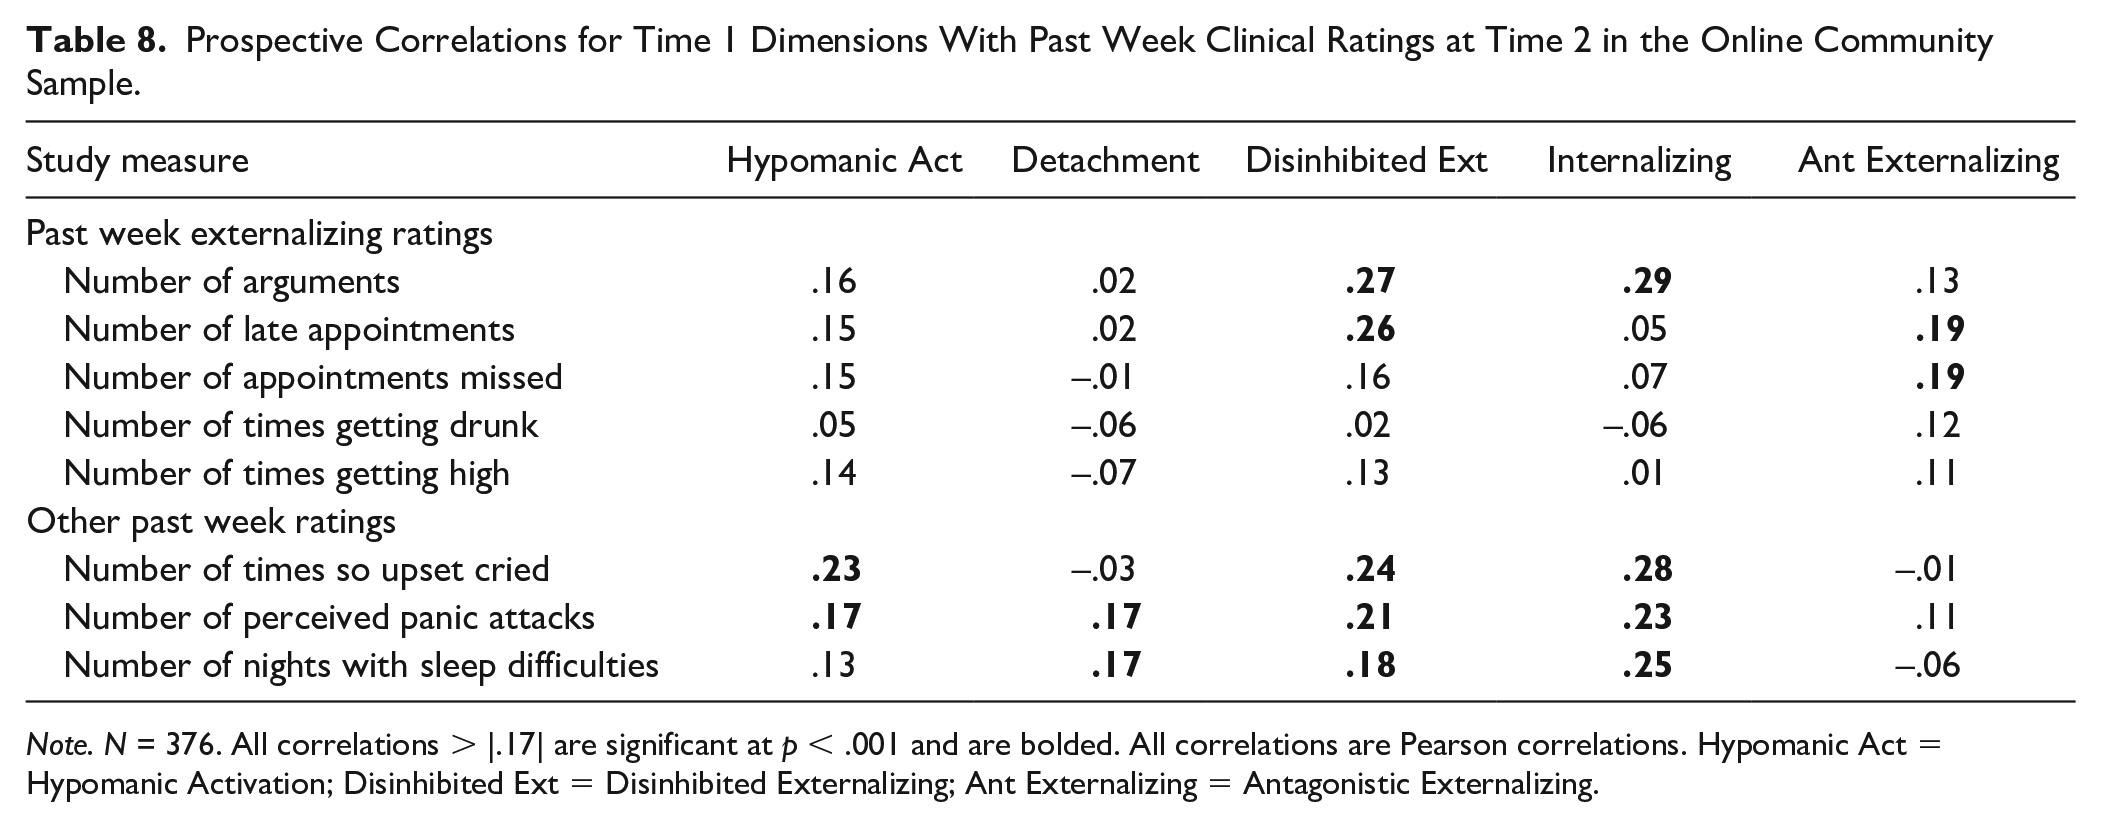
Note. N = 376. All correlations > |.17| are significant at p < .001 and are bolded. All correlations are Pearson correlations. Hypomanic Act = Hypomanic Activation; Disinhibited Ext = Disinhibited Externalizing; Ant Externalizing = Antagonistic Externalizing.
Discussion
Our hierarchical structural results across samples converged to indicate clear aspects of overlap for some NDD- and hypomania-relevant trait dimensions with existing HiTOP spectra (e.g., BAPQ Aloofness with detachment indicators; HPS Mood Lability with internalizing). However, implications for the classification of other specific dimensions are less clear (e.g., some hypomania-relevant traits) due to structures differing in the nature and number of psychologically meaningful factors that could be identified across samples, contrary to our predictions. Regarding our secondary analyses, factors on which internalizing, disinhibited externalizing, and some NDD-relevant measures tended to load strongly showed the most robust patterns of correlates with various clinical and symptom ratings. We predicted that a distinct thought disorder factor would emerge and would show robust external correlates; however, different thought disorder indicators failed to load strongly onto the same common factor in models with the largest number of interpretable dimensions across samples.
We proceed to review the implications of our results for classifying each specific NDD- and hypomania-relevant dimension assessed, but highlight several issues warranting further consideration when designing studies aimed at informing HiTOP classification before doing so. First, our results underscore the need to carefully consider the cross-sample consistency of results in future dimensional classification research, as our conclusions may have differed in some ways had we focused results on only a single sample. For example, the distinct Hypomanic Activation factor identified in the online community data failed to emerge in the undergraduate data. In addition, some aspects of our results that were consistent across the two samples used here were inconsistent with HiTOP framework as currently articulated (Kotov et al., 2020). Unexpected findings in our study included some indicators of antagonistic externalizing and thought disorder loading jointly onto a common factor in select models (e.g., four-factor models across samples). Although some other research indicates strong overlap between antagonistic externalizing and thought disorder (Røysamb et al., 2011), this may have been due to inadequate assessment of thought disorder psychopathology as well other characteristics of our samples (e.g., relatively few participants having extensive histories of thought disorder psychopathology). Some antagonistic externalizing scales (i.e., grandiosity scales) assess inflated self-views that conceivably could overlap with some aspects of thought disorder. However, the CAT-PD Grandiosity scale administered here primarily assesses entitlement (e.g., “should get special privileges”), which seems less connected to thought disorder. Regarding other discrepancies from the broader HiTOP framework, disinhibited and antagonistic externalizing both traditionally are classified within the broader externalizing domain (Kotov et al., 2017); however, our results and those of other recent studies (Forbes et al., 2021) focusing on homogeneous dimensional ratings indicate that disinhibition overlaps strongly with the internalizing spectrum. Given our reliance on a limited measure set and convenience samples, we are not advocating for drastic reorganization of the HiTOP model based on these results. Rather, we are simply drawing attention to these issues to highlight potential challenges and important opportunities ahead for resolving discrepancies across sample types, assessment methods, and study designs in future dimensional classification research.
Next, some measures failed to load strongly onto any factor in some models (e.g., HPS Intellectual Confidence in the four-factor undergraduate model), including indicators of dimensions for which HiTOP classification remains unclear. Relatedly, some widely reported fit indices (e.g., CFI, TLI) indicated poor fit for cross-sectional models with the largest number of viable factors even when using a flexible ESEM approach, recognizing again that model fit was not prioritized in making data analytic decisions. Well-fitting models with clearer patterns of indicator loadings have been identified in many examinations of psychopathology structure of course (Kotov et al., 2017). However, some other recent work also indicates that model fit (a) may be relatively poor according to indices such as CFI and TLI when examining ESEM structures of broad sets of trait ratings spanning multiple HITOP spectra (e.g., Latzman et al., 2019), and (b) can worsen as a function of the number of indicators in analyses increasing (Watts et al., 2021). These issues are important given that more comprehensive examinations of psychopathology structure would involve using sizable indicator sets (e.g., over 30 dimensions are identified as facets of the internalizing domain alone; Watson et al., 2021). As a result, further investigation into how information yielded by fit indices can be used to adjudicate among structural psychopathology models would be useful, as would dialogue regarding the optimal manner for classifying dimensions potentially not aligning neatly with a single existing HiTOP spectrum (e.g., is this evidence that new spectra dimensions should be added to the HiTOP model, issues with validly measuring a construct, and so on).
Implications for the Classification of Specific Psychopathology Dimensions
Taking into account cross-sample discrepancies and related issues, aspects of agreement across sample results still are informative, as summarized in Table 2. For example, HPS Charisma was consistently identified as a reverse-indicator of detachment. Next, BAPQ Aloofness and HPS Mood Lability were clear detachment and internalizing indicators across samples and models, respectively. These results were anticipated based on these measures’ content, for BAPQ Aloofness especially (e.g., “prefer to be alone”). Still, convincingly demonstrating this pattern of results across samples underscores that dimensions traditionally classified as part of the same broader domain align more closely with other forms psychopathology than with one another in some cases (e.g., HPS Mood Lability overlapped more closely with CAT-PD Internalizing measures than other HPS scales). Instances where scales from the same broader measure functioned similarly in analyses included BAPQ Rigidity aligning most closely with detachment, similar to BAPQ Aloofness. Loadings for BAPQ Rigidity on detachment factors were weaker than for BAPQ Aloofness, and this was contrary to predictions that BAPQ Rigidity would be an internalizing indicator (see Online Figure S1).
Next, unlike BAPQ Aloofness and Rigidity, BAPQ Pragmatic Language loaded most strongly onto common factors with ADHD rather than other BAPQ indicators across hierarchical levels. This strong degree of overlap with ADHD symptoms was hypothesized, acknowledging that fewer interpretable factors emerged in each dataset than anticipated. These findings for BAPQ Pragmatic Language also suggest that widely used measures such as the BAPQ assess heterogeneous sets of traits aligning with different spectra, even though terms such as “autism” have been used synonymously with social withdrawal in some prior HiTOP research (Zimmerman et al., 2021).
Across samples, all three ADHD indicators and BAPQ Pragmatic Language Difficulties loaded most strongly onto joint factors with indicators of disinhibited externalizing in models with the greatest number of factors. Specifically, the emergence of a Disinhibition/Communication factor marked by inattention, hyperactivity, communication difficulties, and non-perseverance parallels a distinct NDD factor identified in other recent studies (e.g., Michelini et al., 2019; Stanton et al., 2021). However, with the exception of ASRS Inattentiveness, loadings for other ADHD indicators and BAPQ Pragmatic Language Difficulties were substantially weaker in magnitude on the closest parallel factor in four- and five-factor models from the online community data, which we instead labeled Disinhibited Externalizing due to specific patterns of loadings (e.g., CAT-PD Irresponsibility loading very strongly on this factor in the online community data). Therefore, these findings are less conclusive in some ways regarding the extent to which some NDD features reflect a broader spectrum distinct from other HiTOP spectra. Regardless, overlap for these NDD indicators with disinhibited externalizing indicators was substantial in models with three of fewer factors, with these indicators overlapping meaningfully in these more basic models (e.g., ADHD and internalizing measures loading strongly onto Instability factors in three-factor models). Furthermore, both (a) the online community Disinhibited Externalizing factor and (b) the undergraduate Disinhibition/Communication factor showed notable correlates with internalizing symptoms and related past week ratings reflecting emotion dysregulation, distress, and fear (e.g., perceived panic attacks), underscoring previously identified links between internalizing, disinhibited externalizing, and some NDD features (Forbes et al., 2021; Stanton et al., 2021).
Implications for hypomania-relevant dimensions assessed by HPS Intellectual Confidence and Activation also are uncertain in some ways. These scales had discrepant loading patterns across samples in some cases (e.g., having primary loadings on different factors in the two-factor models across samples), and HPS Intellectual Confidence failed to load strongly onto any factor in the four-factor undergraduate model. Both measures loaded strongly onto a distinct Hypomanic Activation factor in the online community data, as did CAT-PD Fantasy Proneness. Other thought disorder indicators (e.g., CAT-PD Unusual Beliefs) also loaded moderately on this factor, indicating some degree of overlap for these specific hypomania-relevant dimensions with thought disorder. Still, given cross-sample discrepancies in the loading patterns for these measures, future investigation into the classification of these and other hypomania dimensions is needed. Finally, NDD- and hypomania-relevant indicators rarely shared strong loadings onto common factors with antagonistic externalizing indicators in models with three or more factors. This is contrary to some research negatively linking autism-relevant traits with empathy and also was unexpected in some ways given research linking specific hypomania-relevant traits (e.g., charisma) assessed via self-report with antagonistic externalizing (e.g., Stanton et al., 2019).
Future Directions, Limitations, and Conclusion
In addition to the critical need to consider cross-sample differences in structural models, several other study limitations should be acknowledged. First, although assessing homogeneous dimensions was a study strength, it would have been interesting to examine patterns of results using methods other than self-report. At the same time, it may be mistaken to dismiss self-report entirely, even for assessing some aspects of social behavior relevant to NDDs and hypomania. For example, although self-report has limitations, it may provide useful information regarding individuals’ motivations and preferences for social interaction and routine (e.g., even if others describe a person as aloof, self-report may be useful for assessing that person’s internal motivations and level of desire to connect with others; Hurley et al., 2007). Other limitations include limited assessment of some HiTOP spectra and lack of assessment of other symptom dimensions (e.g., checking and counting related to obsessive-compulsive disorders). As a result, we may have reached different conclusions had we assessed a broader range of traits as has been done in other research on NDD classification (e.g., assessing learning and academic difficulties; Michelini et al., 2019).
Next, although the content and structure of symptom and trait measures may parallel one another in many ways (Gomez & Corr, 2014; Jacobsson et al., 2021), our study design precluded comprehensive examinations of the degree of consistency in results when using symptom instead of trait ratings. Relatedly, our approach of administering several trait-based measures of thought disorder (e.g., unusual beliefs, fantasy proneness) may not have adequately captured more severe manifestations of thought disorder psychopathology (e.g., current experiences or extensive histories of positive psychotic symptoms). Furthermore, although online community sample participants were recruited based on psychopathology history, most participants still may not have had extensive histories of thought disorder and other pathology. Consequently, extending our findings in other samples and using other study designs is necessary (e.g., examining fluctuations in manic and thought disorder symptoms), particularly for informing classification of hypomania-relevant dimensions. Examining these issues in samples of participants ranging in demographic factors such as age also will be important given that NDDs traditionally are conceptualized as having their origins in early childhood.
Regarding downstream implications of research of this nature, there is ongoing debate concerning the research and clinical utility of dimensional models as reviewed (Mottron, 2021), including for dimensions described as features of traditional NDD categories that were a focus here. Growing research indicates potential benefits of using transdiagnostic dimensions for NDD diagnosis and treatment planning (e.g., Astle et al., 2021; Gadow & Garman, 2020; Mikami et al., 2019), and improving understanding of the dimensional classification of NDD and hypomania features in future studies would be useful for informing transdiagnostic treatment approaches (e.g., the composition and scoring of clinical assessment measures used for diagnosis and treatment planning may vary depending on which specific traits are viewed as reflecting a potentially distinct NDD spectrum). Acknowledging these issues, our results (a) indicate clear alignment for some NDD- and hypomania-relevant dimensions with existing spectra, (b) indicate the distinctive nature of other dimensions, and (c) draw attention to key future directions for dimensional classification research.
Supplemental Material
sj-docx-1-asm-10.1177_10731911211055670 – Supplemental material for An Initial Investigation of the Joint Classification of Hypomania- and Neurodevelopmental Disorder-Relevant Dimensions Within the Hierarchical Taxonomy of Psychopathology
Supplemental material, sj-docx-1-asm-10.1177_10731911211055670 for An Initial Investigation of the Joint Classification of Hypomania- and Neurodevelopmental Disorder-Relevant Dimensions Within the Hierarchical Taxonomy of Psychopathology by Kasey Stanton, Shereen Khoo, Christina G. McDonnell, Mara Villalongo Andino, Taylor Sturgeon and Laura Aasen in Assessment
Footnotes
Acknowledgements
We would like to acknowledge contributions from undergraduate research assistants, including Peyton Brock, Emma Turton, Natalie Boyle, and Katie Messplay.
Authors’ Note
Please note that the ideas appearing in this manuscript have not been disseminated previously. Research ethics committee approval was obtained for this research, and all individual research participants provided informed consent for their participation. There is no funding to report for this research. Material describing this study’s preregistered data analytic approach and data presented here are available at the first author’s Open Science Framework website at the following link: ![]() .
.
Declaration of Conflicting Interests
The author(s) declared no potential conflicts of interest with respect to the research, authorship, and/or publication of this article.
Funding
The author(s) received no financial support for the research, authorship, and/or publication of this article.
Supplemental Material
Supplemental material for this article is available online.
References
Supplementary Material
Please find the following supplemental material available below.
For Open Access articles published under a Creative Commons License, all supplemental material carries the same license as the article it is associated with.
For non-Open Access articles published, all supplemental material carries a non-exclusive license, and permission requests for re-use of supplemental material or any part of supplemental material shall be sent directly to the copyright owner as specified in the copyright notice associated with the article.