
Abstract
The five-item World Health Organization Well-Being Index (WHO-5) is among the most frequently used brief standard measures to assess hedonic well-being. Numerous studies have investigated different facets of its psychometric properties in adult populations. However, whether these results apply to adolescents is uncertain, and only few psychometric studies employed adolescent populations. Thus, the current study aimed to conduct an in-depth psychometric item response theory analysis of the WHO-5 among adolescents from 43 countries using the Health Behaviour in School-aged Children (HBSC) 2022 data set and investigated its (a) dimensionality and measurement structure, (b) test information values and marginal reliability, (c) cross-country measurement invariance and differential item/test functioning, and (d) convergent validity with other measures related to mental health and well-being across countries. The WHO-5 showed a unidimensional measurement structure and overall high test information values and marginal reliability. Furthermore, although a large proportion of parameters were flagged as non-invariant, differential test functioning of the WHO-5 was only modest. Moreover, the WHO-5 mainly showed a concurring nomological network with the other measures related to mental health and well-being across countries, although with some differences in effect sizes. The WHO-5 Well-Being Index is a psychometrically sound measure that has shown promise for cross-cultural research among adolescents in the included European, Central Asia, and North American countries. The translated versions of the WHO-5 are available at https://osf.io/pbexq.
Keywords
Subjective well-being refers to an individual’s overall evaluation of their life. It encompasses both cognitive assessments of life satisfaction and affective experiences of positive and negative emotions (Diener, 2000). In the context of adolescents, studying subjective well-being becomes paramount, as it provides a nuanced understanding of their mental health and overall life quality during a crucial developmental stage. The study of subjective well-being among diverse adolescent samples sheds light not only on immediate well-being but also on the foundations for long-term mental health outcomes. Research has consistently shown that positive subjective well-being in adolescence is associated with numerous benefits, including better academic performance, enhanced social relationships, and a lower risk of mental health issues later in life (Rees & Main, 2016; Shaffer-Hudkins et al., 2010; Tomás et al., 2020). Given that this decade has seen the largest population of adolescents in human history with most living in low- and middle-income countries (Patton et al., 2016), it becomes imperative that researchers have access to well-validated measures that capture subjective well-being of this population and are suitable for cross-national comparisons (D. Boer et al., 2018). Such measurement instruments could then support the development of targeted interventions and support systems that positively impact the mental health trajectories of adolescents, promoting resilience and well-being into adulthood (Tejada-Gallardo et al., 2020). They could also inform national, regional, and cross-national health and social policy development. Ideally, these measures are not overly long as many research contexts demand short scales, such as multi-topic (cross-cultural) large-scale surveys, longitudinal studies, and prescreening surveys.
The WHO-5 Well-being Index (WHO-5; WHO, 1998) represents a promising measure that potentially could meet these requirements (for a discussion of other self-reported subjective well-being measures, see Jacobs et al., 2024; McDowell, 2010). However, most previous psychometric research on the WHO-5 has been conducted among adults. Thus, it remains unclear whether the WHO-5 is also a sound psychometric measure for adolescents across different countries. Therefore, the aim of this study was to investigate the psychometric properties of the WHO-5 in representative samples of adolescents across 43 European, Central Asia and North American countries.
The WHO-5 Well-Being Index
The WHO-5 is a five-item composite scale used to assess subjective hedonic well-being (Bech, 2012; Kusier & Folker, 2020). The items represent non-invasive questions that are positively worded and capture both feelings (e.g., “I have felt calm and relaxed”) and functioning (e.g., “My daily life has been filled with things that interest me”) in the past two weeks, with response options ranging from 0 (= at no time) to 5 (= all of the time). The WHO-5 is not specific to any disease or condition, making it a useful tool for assessing well-being in both clinical and non-clinical samples. Nonetheless, it displays strong diagnostic accuracy when screening for clinical depression in adults (Krieger et al., 2014; Low et al., 2023; McDowell, 2010; Topp et al., 2015). Furthermore, the WHO-5 has also been found to be a sound measure for cross-cultural comparisons in adults (e.g., Jami & Kemmelmeier, 2020; Sischka, Costa, et al., 2020).
It is important to note that most studies investigating the psychometric properties of the WHO-5 have been conducted among adults (e.g., Jami & Kemmelmeier, 2020; Lara-Cabrera et al., 2022; Sischka, Costa, et al., 2020; Topp et al., 2015), and thus, cannot be unambiguously generalized to adolescent populations (e.g., Borgers et al., 2000; Conijn et al., 2020; Taber, 2010). Research needs to establish that survey measures are developmentally appropriate (Krause et al., 2022; Rose et al., 2017), and that measures that were originally developed for application in adult populations can be used within adolescent populations. Given the WHO-5 has a Flesch Reading Ease Score of 90.0 (de Wit et al., 2007), 1 which is equivalent to a U.S. 5th-grade reading level (Peter et al., 2018) and comparable to other quality-of-life measures typically employed within adolescence populations (Krause et al., 2022), it is possible that it could be applied well in this context.
Psychometric Properties of the WHO-5 in Adolescent Populations
The few psychometric studies in adolescent populations have investigated the dimensionality, the measurement structure, reliability (usually investigated by means of Cronbach’s α), measurement invariance (MI) or differential item/test functioning across various groups, and convergent validity of the WHO-5. These results are summarized in the following section.
Dimensionality and Measurement Structure
Previous studies using parallel analysis (Quansah et al., 2022), principal component analysis with the criterion of eigenvalue being greater than 1 (de Wit et al., 2007), or confirmatory factor analysis (Cosma et al., 2022; de Wit et al., 2007) 2 mainly indicated that the WHO-5 exhibits an essentially unidimensional measurement structure within adolescent samples. In samples of school-aged children across 15 countries, Cosma et al. (2022) reported factor loadings across all items and all countries between .50 and .89. One study (Quansah et al., 2022) also employed an item response theory (IRT) framework and specified a graded response model (GRM) to the WHO-5 items within a Ghanaian sample. The discrimination parameter (a) ranged between 1.22 (Item 1) and 2.80 (Item 3). Moreover, they found only small threshold steps between the response categories “Less than half of the time” and “More than half of the time,” between “More than half of the time” and “Most of the time,” and between “Most of the time” and “All of the time.”
Reliability
Previous research indicated that the WHO-5 showed sufficient marginal reliability (i.e., internal consistency) within adolescent samples, but reliability estimates varied considerably. Adjorlolo and Anum (2021) reported a Cronbach’s α value of .70 within a sample of senior high-school students in Ghana. Cosma et al. (2022) found moderate to high internal consistency in terms of Cronbach’s α (ranged between .75 and .92) in samples of school-aged children across 15 countries. de Wit et al. (2007) reported a Cronbach’s α value of .82 in a sample of adolescents with Type 1 diabetes in the Netherlands. Finally, employing a GRM, Quansah et al. (2022) determined a marginal reliability estimate of .86 and test information values of 8 and above over a wide range of theta within a sample of senior high school students in Ghana.
Measurement Invariance
MI testing is a statistical approach used to assess the extent that scale items operate equivalently across contexts (e.g., gender, age group, country). This is critical to understanding the wider transferability of a scale and the prospective accuracy of cross-group comparisons of latent mean scores. Thus, demonstrating MI is paramount for survey measures that are intended to be used for comparative (and often cross-cultural) research (Millsap, 2011). To the best of our knowledge, only Cosma et al. (2022) investigated cross-country MI of the WHO-5 among adolescent populations. They included representative samples of adolescents across 15 European and Central Asian countries and conducted a multi-group confirmatory factor analysis (with weighted least square mean and variance adjusted [WLSMV] estimator). MI was assessed according to the change in global model fit statistics (i.e., root mean squared error of approximation [RMSEA], comparative fit index [CFI], Tucker–Lewis index [TLI]). Cosma et al. (2022) found that a one-factor model of the WHO-5 did not exhibit configural invariance. In a next step, based on modification indices, they excluded the first item (“I have felt cheerful and in good spirits”) as its error term correlated with the error term of the second item. They deemed this four-item version to have acceptable model fit and subsequently tested it for more stringent MI models. Cosma et al. (2022) found that this four-item version exhibited configural and metric invariance, but not scalar invariance across countries. By freeing the intercepts (or thresholds) of Items 2 and 3, they established a partial invariance model.
Convergent Validity and Nomological Network
Strong convergent validity (i.e., the extent to which the WHO-5 corresponds to measures of related constructs) has also been reported in several studies using adolescent samples. For example, the WHO-5 has been found to be negatively correlated with well-validated measures of depression and anxiety such as the Patient Health Questionnaire-9 (r = –.36), the Center for Epidemiologic Studies Depression Scale (r = –.67), the Reynolds Adolescent Depression Scale-Short Form (r = –.59; Lambert et al., 2014), and the General Anxiety Disorder-7 (r = –.35; Adjorlolo & Anum, 2021; de Wit et al., 2007). Positive correlation with the Warwick-Edinburgh Mental Well-being Scale (r = .57) has been shown among a UK-based sample of 13- to 16-year-olds (Clarke et al., 2011). Negative correlations with psychosomatic complaints (r = –.45; Cosma et al., 2022), health rated as poor (r = −.34; Cosma et al., 2022), 3 and negative affect (r = – .75; Quansah et al., 2022) and positive correlations with life satisfaction (r = .43; Cosma et al., 2022), general mood (r = .54; Lambert et al., 2014), and positive affect (r = .58; Quansah et al., 2022) have also been observed. In samples of adolescents with Type 1 diabetes, the WHO-5 correlated positively with the total generic and subscale-specific scores on the Pediatric Quality of Life Inventory (de Wit et al., 2012), and negatively with depressive symptoms and diabetes burden (Steinberg et al., 2017). The WHO-5 also displayed good criterion validity in screening for depression in pediatric and adolescent psychiatric settings (Allgaier et al., 2012; Blom et al., 2012; Tittel et al., 2023).
IRT Analysis
As this overview of the literature reveals, previous studies mainly applied psychometric methods within a “classical test theory” (CTT) framework (De Champlain, 2010) and treated the WHO-5 items as continuous indicators. Compared to CCT approaches, IRT analysis offers some advantages. First, IRT models account for the ordinal nature of items rather than assuming that they are continuous. 4 Second, IRT analysis focuses more on understanding the performance of each individual item (Houts et al., 2022), incorporating both discrimination parameters (similar to factor loadings in confirmatory factor analysis [CFA]) and item difficulty (threshold parameters). Therefore, IRT is often called an item-level theory, whereas CTT is referred to as test-level theory (DeMars, 2018). Third, unlike Cronbach’s alpha, which assumes uniform measurement error across the latent variable continuum, IRT allows for varying reliability across the continuum depending on item characteristics (Houts et al., 2022). Fourth, IRT models typically utilize all available data, providing full-information estimates, whereas CFA with WLSMV estimation uses summary statistics such as polychoric correlations (Wirth & Edwards, 2007), which is why IRT is often referred to as a full-information item factor analysis (e.g., Cai et al., 2011).
Lack of Research
The discussion of the psychometric properties showed that the WHO-5 seems to be a promising candidate to assess general hedonic well-being among adolescents. However, a few things should be noted. First, as discussed, previous studies mainly employed a CTT framework and did not exploit the potential of an in-depth IRT analysis. Second, previous studies have only included a limited set of countries often within convenience samples. Thus, we have only limited information regarding the psychometric properties of the WHO-5 in adolescent populations across a wider range of countries. Third, as noted earlier, to be able to make valid cross-country comparisons, it is essential to test whether the measurement structure across countries is the same, that is, that MI holds (e.g., Maassen et al., 2023). With the exception of Cosma et al. (2022) who included 15 countries, previous studies have only investigated single-country data. However, as Cosma et al. (2022) investigated MI only based on the change of global model fit, no information about which countries deviated from each other is available. Moreover, they only tested a configural model on the full five-item set and omitted more stringent MI models because of global model fit indices that might have also been judged as “acceptable” (i.e., RMSEA = .073, CFI = .982; TLI = .964; see, e.g., Little, 2013). Thus, we have only limited evidence whether the WHO-5 shows the same measurement structure across a wide range of countries. Fourth, no study so far has investigated whether the nomological net of the WHO-5 is similar across countries. Fifth, we have only limited knowledge about normative data of the WHO-5 within the adolescent population across countries.
Aim of the Present Study
Given its growing application in adolescent cross-national research (e.g., Adjorlolo & Anum, 2021; Cosma et al., 2022; Cosma et al., 2023; Winzer et al., 2021), the present study provides an in-depth psychometric analysis of the WHO-5 in large representative samples of adolescents across 43 countries in Europe, Central Asia, and Canada. First, the dimensionality of the scale was investigated. Second, an IRT analysis was conducted. Since the WHO-5 items have ordered-response categories and previous studies have indicated that the items differ in terms of discrimination (e.g., Cosma et al., 2022), the GRM might be an adequate IRT model. The GRM is also among the most frequently applied models (Depaoli et al., 2018; Houts et al., 2022; Toland, 2014). Due to its relaxed assumptions, the GRM is an IRT model that is particularly relevant to evaluate survey items with ordinal response categories (Depaoli et al., 2018; Houts et al., 2022; Toland, 2014). However, a reduced version of this model (R-GRM) is also investigated, which estimates one common slope parameter across the ordinal response categories for all items (Toland, 2014) and is, thus, more parsimonious. Third, cross-national MI and differential item functioning were investigated to test whether the measurement structure of the WHO-5 is comparable across countries. Fourth, item properties, test information values, and marginal reliability were inspected. Fifth, the associations between the WHO-5 and other well-established measures of subjective well-being were investigated. Finally, norm values (mean, standard deviation, percentile norms) were provided.
Method
This study’s design and its analysis were not pre-registered. The data and materials used in this study will become publicly available in October 2027. The code used for this analysis, and the electronic supplement material [ESM] is available at https://osf.io/pbexq. All analyses were conducted in R (version 4.3.1; R Core Team, 2023) and Mplus Version 8.8 (Muthén & Muthén, 1998–2017). See the Software Information section for the used packages.
Data Collection and Survey Design
The Health Behaviour in School-aged Children (HBSC) study is a large cross-national research study undertaken in collaboration with the WHO Regional Office for Europe. Since 1983, an increasing number of countries from across Europe, Central Asia, and North America have joined the HBSC study, which conducts a school-based survey every 4 years; most recently in 2022 with 44 participating countries. Representative samples of adolescents aged 11, 13, and 15 years are invited to complete the survey and asked about their health behaviors, well-being, and social context. All participating countries follow a standard protocol, with stratified sampling used in each country to represent the regional, economic, and public–private distribution of schools (Inchley et al., 2023). Ethical approval to conduct the survey is sought by the principal investigator of each participating country from their respective ethics review board (or equivalent regulatory institution). Participation in the survey was voluntary with pupils informed that responses were anonymous. Informed consent was obtained from schools, parents, and children, prior to completion. The survey was administered in a classroom setting, with countries able to utilize either paper-based or electronic questionnaires. Detailed information on study methods is available elsewhere (Inchley et al., 2023).
Participants
The initial sample consisted of N = 279,117 respondents from 44 countries in the 2021/2022 survey cycle. Serbia accidentally omitted one response category of the WHO-5, thus excluded (n = 3,713). Due to incomplete data (i.e., one or more missing values on the WHO-5 items), 5.8% (n = 16,015) of respondents were also excluded from the analyses (see Figure A1 in the ESM [https://osf.io/pbexq] for the missing data pattern). 5 The analytical sample therefore consisted of N = 259,389 respondents from 43 countries (50.9% girls; Mage = 13.6 years, SDage = 1.64 years). The number of respondents per country ranged between 1,229 (Greenland) and 34,427 (Wales). See Table A1 in the ESM for further sample details.
Measures
WHO-5 Well-Being Index
The WHO-5 Well-Being Index starts with the following instructions: “Please indicate for each of the five statements which is the closest to how you have been feeling over the last two weeks.” The five items are as follows: “Over the last two weeks . . .” (1) “. . . I have felt cheerful and in good spirits,” (2) “. . . I have felt calm and relaxed,” (3) “. . . I have felt active and vigorous,” (4) “. . . I woke up feeling fresh and rested,” (5) “. . . my daily life has been filled with things that interest me.” The items have the following response options: At no time (0), Some of the time (1), Less than half of the time (2), More than half of the time (3), Most of the time (4), and All of the time (5). All language versions are available at https://osf.io/pbexq.
Other Well-Being Variables
Life satisfaction was measured with Cantril Ladder, a single item, it reads: Here is a picture of a ladder. The top of the ladder “10” is the best possible life for you and the bottom “0” is the worst possible life for you. In general, where on the ladder do you feel you stand at the moment? Tick the box next to the number that best describes where you stand.
The response options present a ladder from 0 (= worst possible life) to 10 (= best possible life)
Self-rated health (SRH) was also measured with a single item, which reads “Would you say your health is . . .?” with the response options ranging from 1 (excellent) to 4 (poor). For our analysis, SRH was re-coded into two response options, 0 (poor) and 1 (fair/good/excellent), according to recommendations of Schnohr et al. (2016).
Psychosomatic complaints were assessed with the HBSC Symptom Checklist (Heinz et al., 2022). This item included the question, “In the last 6 months: how often have you had the following . . .?,” and included eight symptoms (headache, stomachache, backache, feeling low, irritability/bad temper, feeling nervous, difficulties in getting to sleep, feeling dizzy). Adolescents had five response options to choose from: 1 (about every day), 2 (more than once a week), 3 (about every week), 4 (about every month), and 5 (rarely or never). For this analysis, these responses were re-coded into 0 (rarely or never) to 4 (about every day).
Loneliness was measured with a single item: “During the past 12 months, how often have you felt lonely?,” with response options 1 (never), 2 (rarely), 3 (sometimes), 4 (often), and 5 (always).
Demographic Variables
To identify their gender, respondents were asked to indicate whether they are a boy or a girl. In addition, respondents were asked to indicate the month and year of their birth to determine their age at the time of data collection.
The socioeconomic status of the families of the respondents was measured using the Family Affluence Scale (FAS-III) (M. Boer et al., 2023; Torsheim et al., 2016). FAS-III is a self-report measure of family wealth that includes the following six items: (a) “Does your family own a car, van or truck?”; (b) “Do you have your own bedroom for yourself?”; (c) “How many computers do your family own (including laptops and tablets, not including game consoles and smartphones)?”; (d) “How many bathrooms (room with a bath/shower or both) are in your home?”; (e) “Does your family have a dishwasher at home?”; and (6) “How many times did you and your family travel out of [country] for a holiday/vacation last year?” Answer categories are item specific with 0 (no), 1 (yes, one), and 2 (yes, two or more) for Item 1; 0 (no) and 1 (yes) for Items 2 and 5; 0 (none), 1 (one), 2 (two), and 3 (more than two) for Items 3 and 4; and 0 (not at all), 1 (once), 2 (twice), and 3 (more than twice) for Item 6. The FAS score is based on a ridit-scaled variable derived from the sum of the responses, which classifies adolescents into three affluence categories in each country: lowest 20%, medium 60%, and highest 20% (Elgar et al., 2017).
Statistical Analysis
Preliminary Data Analysis
In a first step, the distributions of the items were evaluated as an initial check of item properties and to determine whether each response category within each item was sufficiently used to obtain stable parameter estimates (Toland, 2014). In a next step, polychoric correlations between the items were calculated to get a first impression of the dimensionality of the WHO-5 items and to identify potential problematic items within each country (Watkins, 2018)
Dimensionality Assessment
The dimensionality was tested by submitting a polychoric correlation matrix to exploratory graph analysis (EGA) with the glasso algorithm, a recently proposed network psychometric method for dimensionality assessment (Golino & Epskamp, 2017; Golino et al., 2020). This procedure has been shown to outperform many other dimensionality assessment approaches and assesses the number of dimensions and the relation between the indicators and the dimension in a single step (Golino et al., 2020).
IRT Model Comparison and Model-Data Fit
The appropriateness of the GRM and the R-GRM was evaluated with goodness of fit statistics (RMSEA, SRMSR, CFI, TLI) relying on the limited-information test statistic C2 (Cai & Monroe, 2014; Monroe & Cai, 2015). It should however be noted that, just like in a CFA context (e.g., McNeish & Wolf, 2023), judging model fit against fixed cutoffs might be problematic as many factors other than model (mis-)fit have an impact on them. 6 The two IRT models were thus further compared with the likelihood ratio test and three information criteria (i.e., AIC, BIC, and SABIC). Moreover, to assess the relative improvement in the proportion of variability accounted for by one model over the other, we calculated the change in R2 based on the likelihood ratio G2 test statistic (De Ayala, 2009). As these fit statistics represent global model fit statistics that do not tell us where the model misfit stems from, they always should be interpreted in conjunction with local model fit statistics. The local (or conditional) independence assumption was evaluated with the Jackknife Slope Index (JSI) and its respective cutoff value (mean of the JSI values plus twice the standard deviation) as proposed by Edwards et al. (2018). Positive JSI values indicate that the removal of a specific item causes the slope of another item to decrease, while negative JSI values indicate that the removal of a specific item leads to an increased slope of another item. Item fit was investigated with the generalized S-X2 item fit index (Kang & Chen, 2011) and corresponding item-level RMSEA values as the measure of effect size. Raw residual plots were created to assess the functional form (or monotonicity) assumption (Wells & Hambleton, 2016).
MI and Differential Item/Test Functioning Analysis
MI of the WHO-5 across countries was first evaluated by means of a multi-group IRT analysis with increasingly restrictive nested models, starting with the configural invariance model (i.e., factor variances fixed to one, factor means fixed to zero, discrimination and threshold parameters freely estimated in all countries), then the metric invariance model (i.e., factor variance fixed to one only in the first country, factor means fixed to zero in all countries, discrimination parameters constrained to be equal across all countries, threshold parameters freely estimated in all countries), and finally the scalar invariance model (i.e., factor variance fixed to one only in the first country, factor means fixed to zero only in the first country, discrimination and threshold parameters constrained to be equal across all countries).
Potential differential item/test functioning across countries was investigated with the alignment-optimization method (Asparouhov & Muthén, 2014; DeMars, 2020; Marsh et al., 2018; B. Muthén & Asparouhov, 2014) with robust maximum likelihood estimator (MLR). Applying a simplicity function, this procedure starts with the configural invariance model (assuming that a reasonable configural invariance model exists) and searches for a set of (discrimination and threshold) parameters that can be constrained across countries without loss in model fit. The alignment optimization is a linking approach under a partial invariance scenario, and the aligned model has the same model fit as the configural invariance model. The aligned model is determined in two steps: First, the configural invariance model is estimated. Second, the factor means and variances are freely estimated, and their values are chosen based on the simplicity function to minimize the total size of non-invariance for every pair of groups and every discrimination and threshold parameter (e.g., Kim et al., 2017). The alignment procedure also provides an R2-like measure (i.e., ranging from 0 to 1) for every parameter that represents variation in this parameter across groups in the configural model that can be explained by variation in factor mean and factor variance across groups and not non-invariance. Thus, higher values indicate higher levels of invariance. Asparouhov and Muthén (2014) recommend to start with the FREE approach (factor variance of the reference group is set to 1 and freely estimated in all other groups, factor mean is freely estimated in all groups) and to switch to the FIXED approach (factor mean and factor variance of the reference group is set to 0 and 1, respectively, and freely estimated in all other groups) if the FREE approach is poorly identified. For methodological and technical details of the alignment procedure (such as the computation of the simplicity function), see the studies by Asparouhov and Muthén (2014), Kim et al. (2017), and Marsh et al. (2018). For examples of applied studies, see the studies by Sischka, Grübbel et al. (2024) and Sischka, Albert and Kornadt (2024).
The aligned IRT parameters were used to further analyze country pairwise differential test functioning with the compensatory (sDRF) and non-compensatory differential response functioning (uDRF) statistics (Chalmers, 2018) and respective 99% bootstrapped confidence intervals (with n = 10,000 bootstrap samples).
Item Properties, Information Functions, and Marginal Reliability
The psychometric properties of the WHO-5 were investigated using the aligned multi-group IRT model, as this approach places the group-specific item parameters onto a common metric (e.g., B. Muthén & Asparouhov, 2014). Thus, the item parameters across countries can be directly compared. Based on this model, item (ICC) and test characteristic curves (TCC) as well as item (IIF) and test information functions (TIF) were derived, with empirical marginal reliability (ρ) as the summary measure of score precision (Brown, 2018).
Relationship With External Criteria
The association of the WHO-5 with other variables was investigated by means of correlational analysis. Confidence intervals were derived with bootstrapping (n = 1,000 bootstrap samples).
Results
Preliminary Data Analysis
The items of the WHO-5 showed some amount of skewness and kurtosis (Mskewness = −0.48, SDskewness = 0.36, Minskewness = −1.60, Maxskewness = 0.39, Mkurtosis = −0.61, SDkurtosis = 0.57, Minkurtosis = −1.40, Maxkurtosis = 2.20; see Table A2 and Figure A2 in the ESM [https://osf.io/pbexq]), but these values were not pronounced enough to indicate any issues with item performance. Almost all response categories within each item across countries were sufficiently used (i.e., n≥ 30). 7 The items’ polychoric correlations over all countries and item pairs ranged between .42 and .80 (Mpolycor = .59, SDpolycor = .07). Kyrgyzstan showed the lowest average item intercorrelations (Mpolycor = .48, SDpolycor = .03, Minpolycor = .42, Maxpolycor = .53), whereas Bulgaria showed the highest average item intercorrelations (Mpolycor = 0.72, SDpolycor = 0.04, Minpolycor = .68, Maxpolycor = .81, see Figure A3 in the ESM). The polychoric correlation matrices showed no abnormalities.
Dimensionality Assessment
The EGA indicated a one-factor solution for all countries (see Figure A4 in the ESM). Moreover, the EGA showed that Items 1 and 2 were more strongly connected than any other item pair for most countries.
IRT Model Comparison and Model-Data Fit
According to commonly used thresholds (e.g., Kline, 2016; Little, 2013), the goodness of fit statistics based on the test statistic C2 for the GRM, the SRMSR, the CFI, and the TLI indicated a good/very good model fit, whereas the RMSEA indicated a poor fit (i.e., values above .1) for some countries (i.e., Bulgaria, Switzerland, Denmark, Malta; see Table 1). For the R-GRM, most fit indices got slightly worse but were still in a good range (see Table A4 in the ESM). For the R-GRM, three countries showed RMSEA values above .1 (i.e., Bulgaria, Denmark, Slovenia). The likelihood ratio test (Table A5) and the information criteria (Figure A5 in the ESM) favored the GRM over the R-GRM in almost all countries (except for Greenland). However, the ΔR2 between the R-GRM and the GRM for every country ranged between .000 (Greenland; Kyrgyzstan) and .006 (Slovenia), indicating overall only small model improvements. Nevertheless, as the main aim of the present study was to find a configural model that fits in every country and to accommodate the heterogeneity across countries, the items were further analyzed based on the GRM (see Table A6–A10 in the ESM for item parameters).
Goodness of Fit Statistics for the Graded Response Model
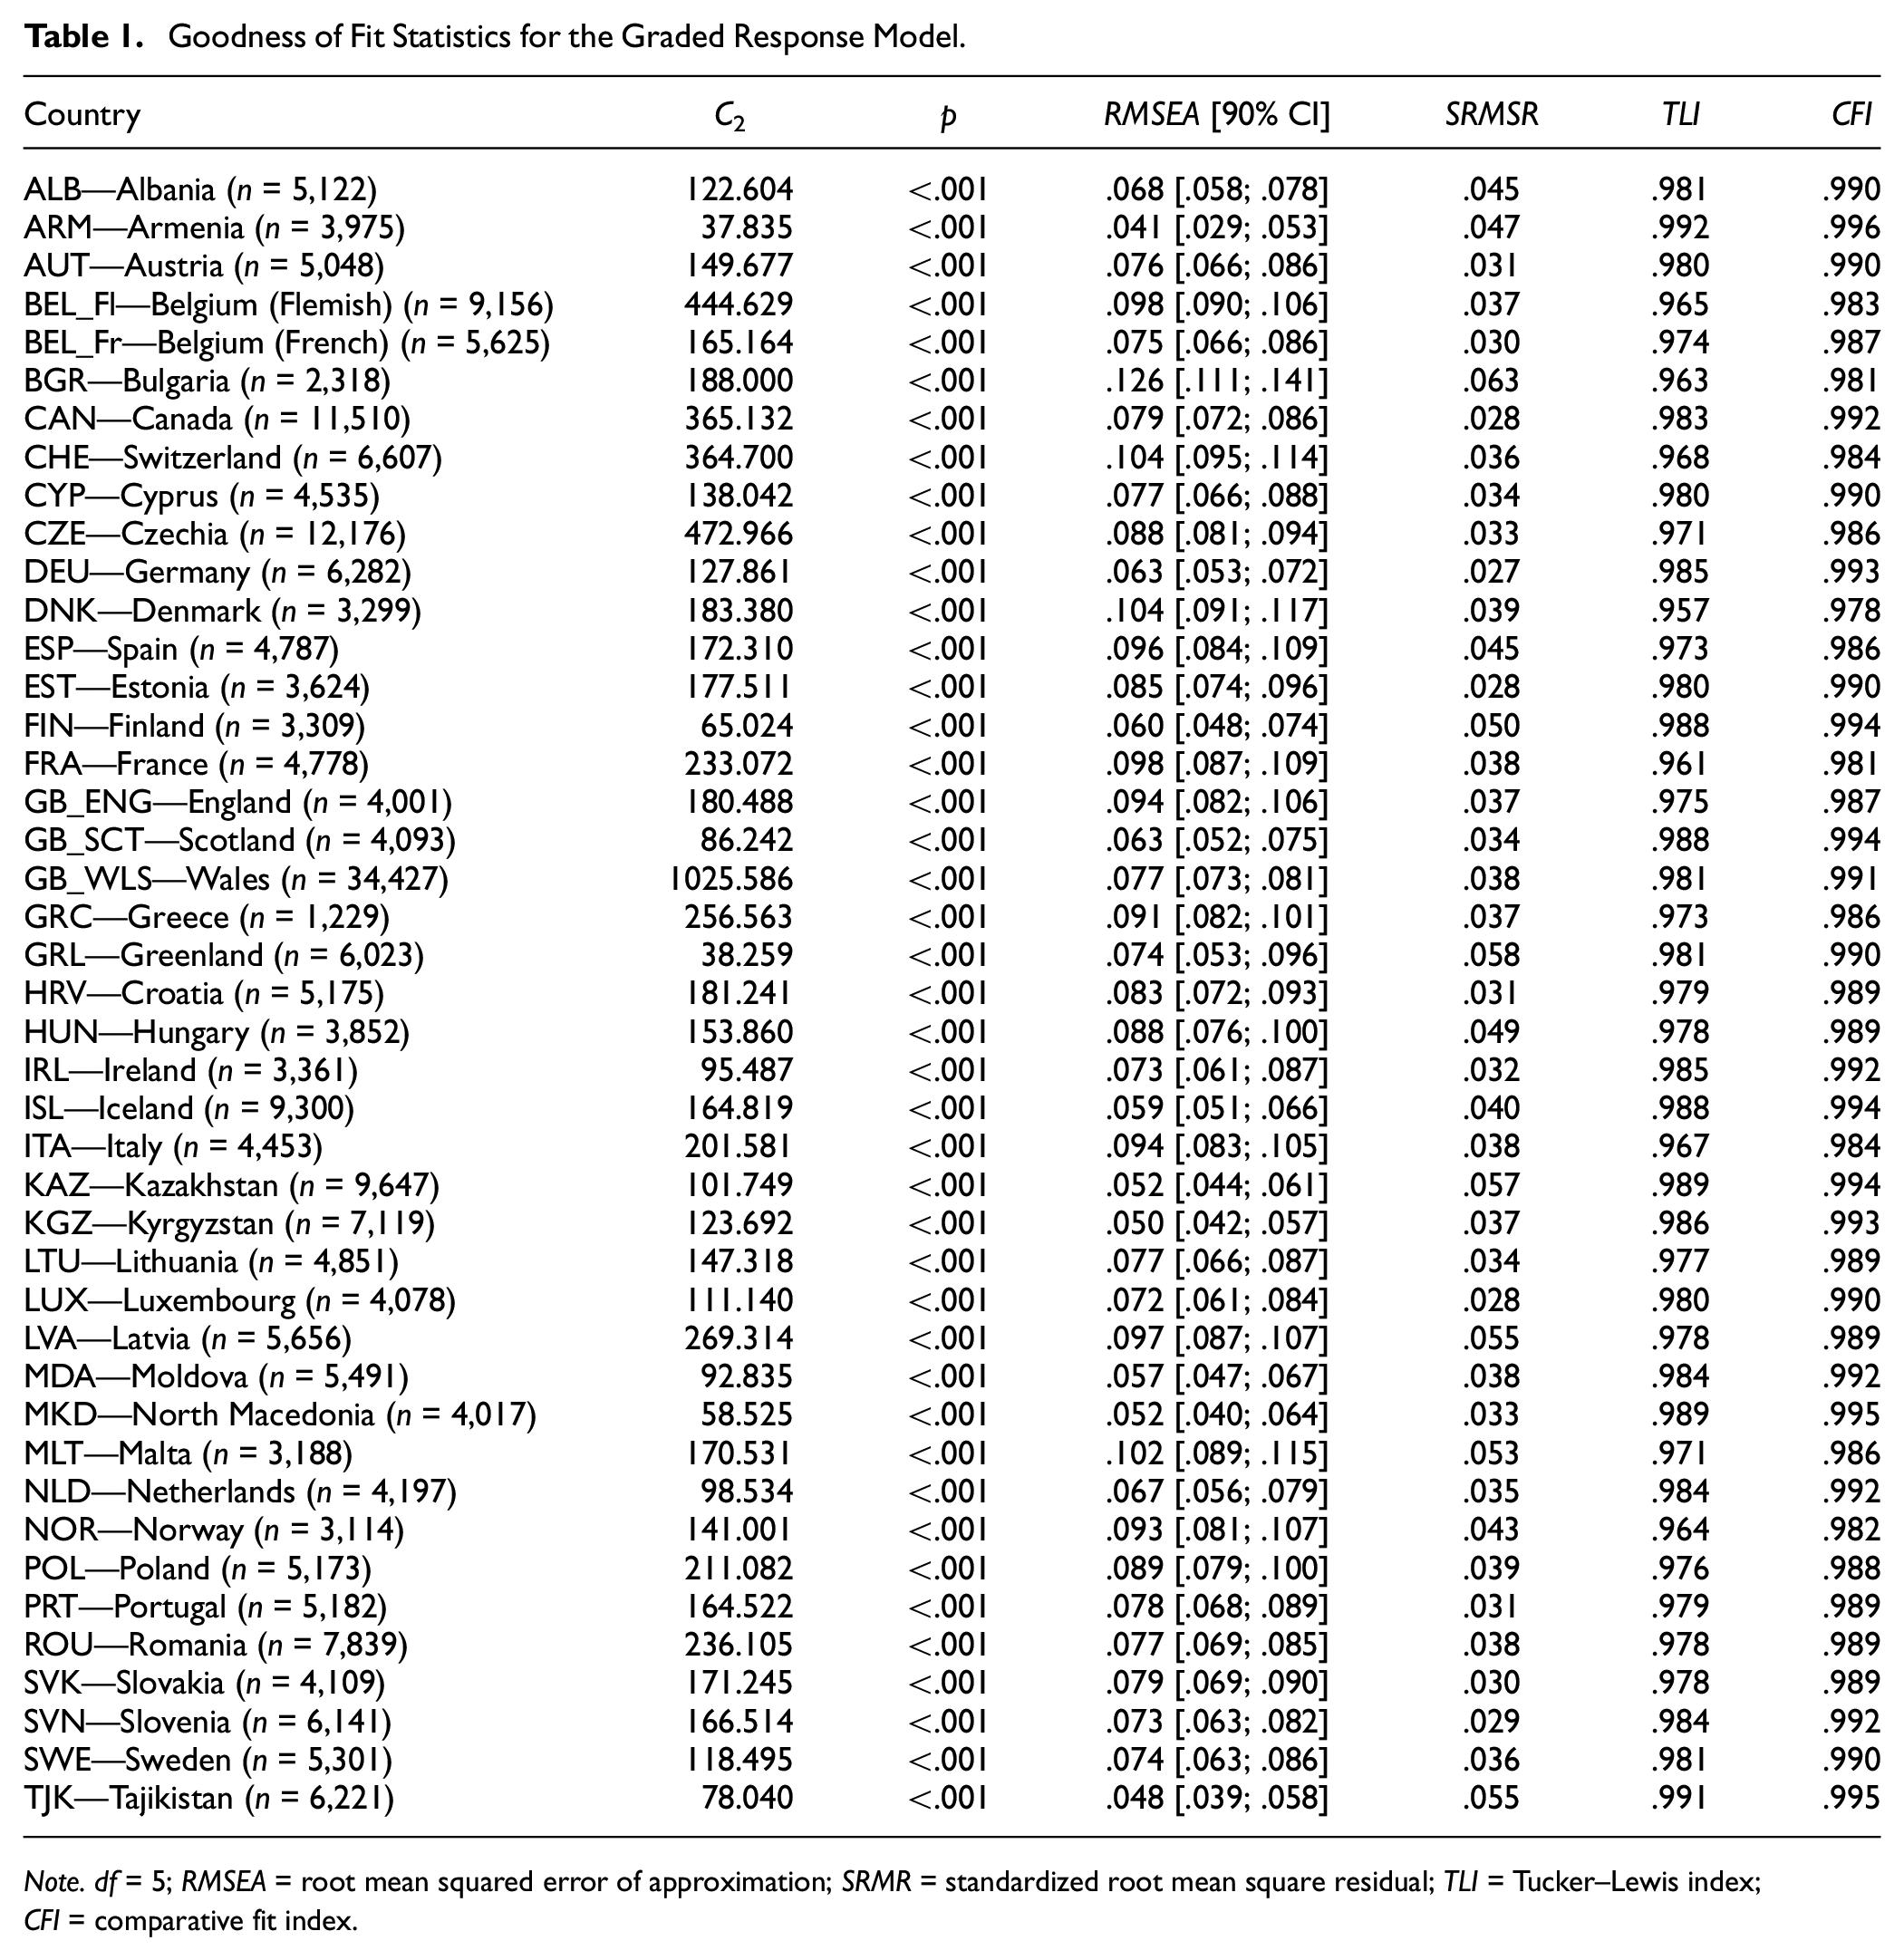
Note. df = 5; RMSEA = root mean squared error of approximation; SRMR = standardized root mean square residual; TLI = Tucker–Lewis index; CFI = comparative fit index.
The JSI flagged local dependence between Item 1 and 2 for Austria, Estonia, Scotland, Wales, Croatia, Hungary, Moldova, North Macedonia, Norway, Slovakia, and Sweden (see Figure A6 in the ESM). However, the values were only slightly above the threshold; thus, local dependency might be considered still in an acceptable range. The generalized S-X2 item fit index flagged most of the items as deviating from the GRM curves. However, the item-level RMSEA ranged between .009 and .039 for Item 1, between .000 and .049 for Item 2, between .008 and .032 for Item 3, between .012 and .032 for Item 4, and between .006 and .032 for Item 5, indicating low to medium deviation of the items from the GRM (see Figure A7 in the ESM). Finally, the raw residual plots indicated no strong deviation from monotonicity (see Figure A8–A50 in the ESM). See Figure A51–A55 for the item parameter, ICC, IIF, TCC, and TIF for the different countries. These analyses indicated that the GRM can be used as a starting point for the configural invariance model.
MI and Differential Item/Test Functioning Analysis
The multi-group analysis revealed a very good fit for the configural invariance model (C2 = 8,246.855, df = 215, p < .001, RMSEA [90% CI] = .012 [.012, .012], SRMSR for each country ranged between .027 and .063, TLI = .979, CFI = .989; see also Table A11 in the ESM), indicating that the model structure is the same across countries. Constraining the discrimination parameters to be equal (metric invariance model) across countries had almost no effect on model fit (C2 = 11,846.283, df = 383, p < .001, RMSEA [90% CI] = .011 [.011; .011], SRMSR for each country ranged between .029 and .078, TLI = .983, CFI = .985), indicating the same metric of the WHO-5 in the countries. However, constraining the item thresholds to be equal (scalar invariance model) across countries leads to a substantial loss in model fit according to some goodness of fit statistics (C2 = 68,062.554, df = 1,391, p < .001, RMSEA [90% CI] = .014 [.014, .014], SRMSR for each country ranged between .029 and .189, TLI = .973, CFI = .912), indicating non-invariance for at least some threshold parameters.
We started the alignment method with the FREE approach. However, Mplus provided a warning that the model might be poorly identified; thus, we switched to the FIXED approach with Poland as the reference group as indicated by the Mplus warning. Table 2 shows the fit statistics of the alignment analysis with the FIXED approach and with Poland as the reference group (with mean fixed to 0 and variance fixed to 1). The average invariance index (mean over all R2 values) equaled .564, and 47.2% of the parameters were flagged as being non-invariant. The R2 values for the item discrimination ranged between .350 and .831 (MR2 = .626; SDR2 = .180), and the percentage of approximate invariant countries between 62.8% and 88.4%. Interestingly, the discrimination parameter of Item 1 showed the lowest R2 value, but the second highest number of invariant countries compared to the item discrimination parameter of the other items. This indicates that the non-invariance in this parameter came from a few “outlier” countries.
Alignment Fit Statistics
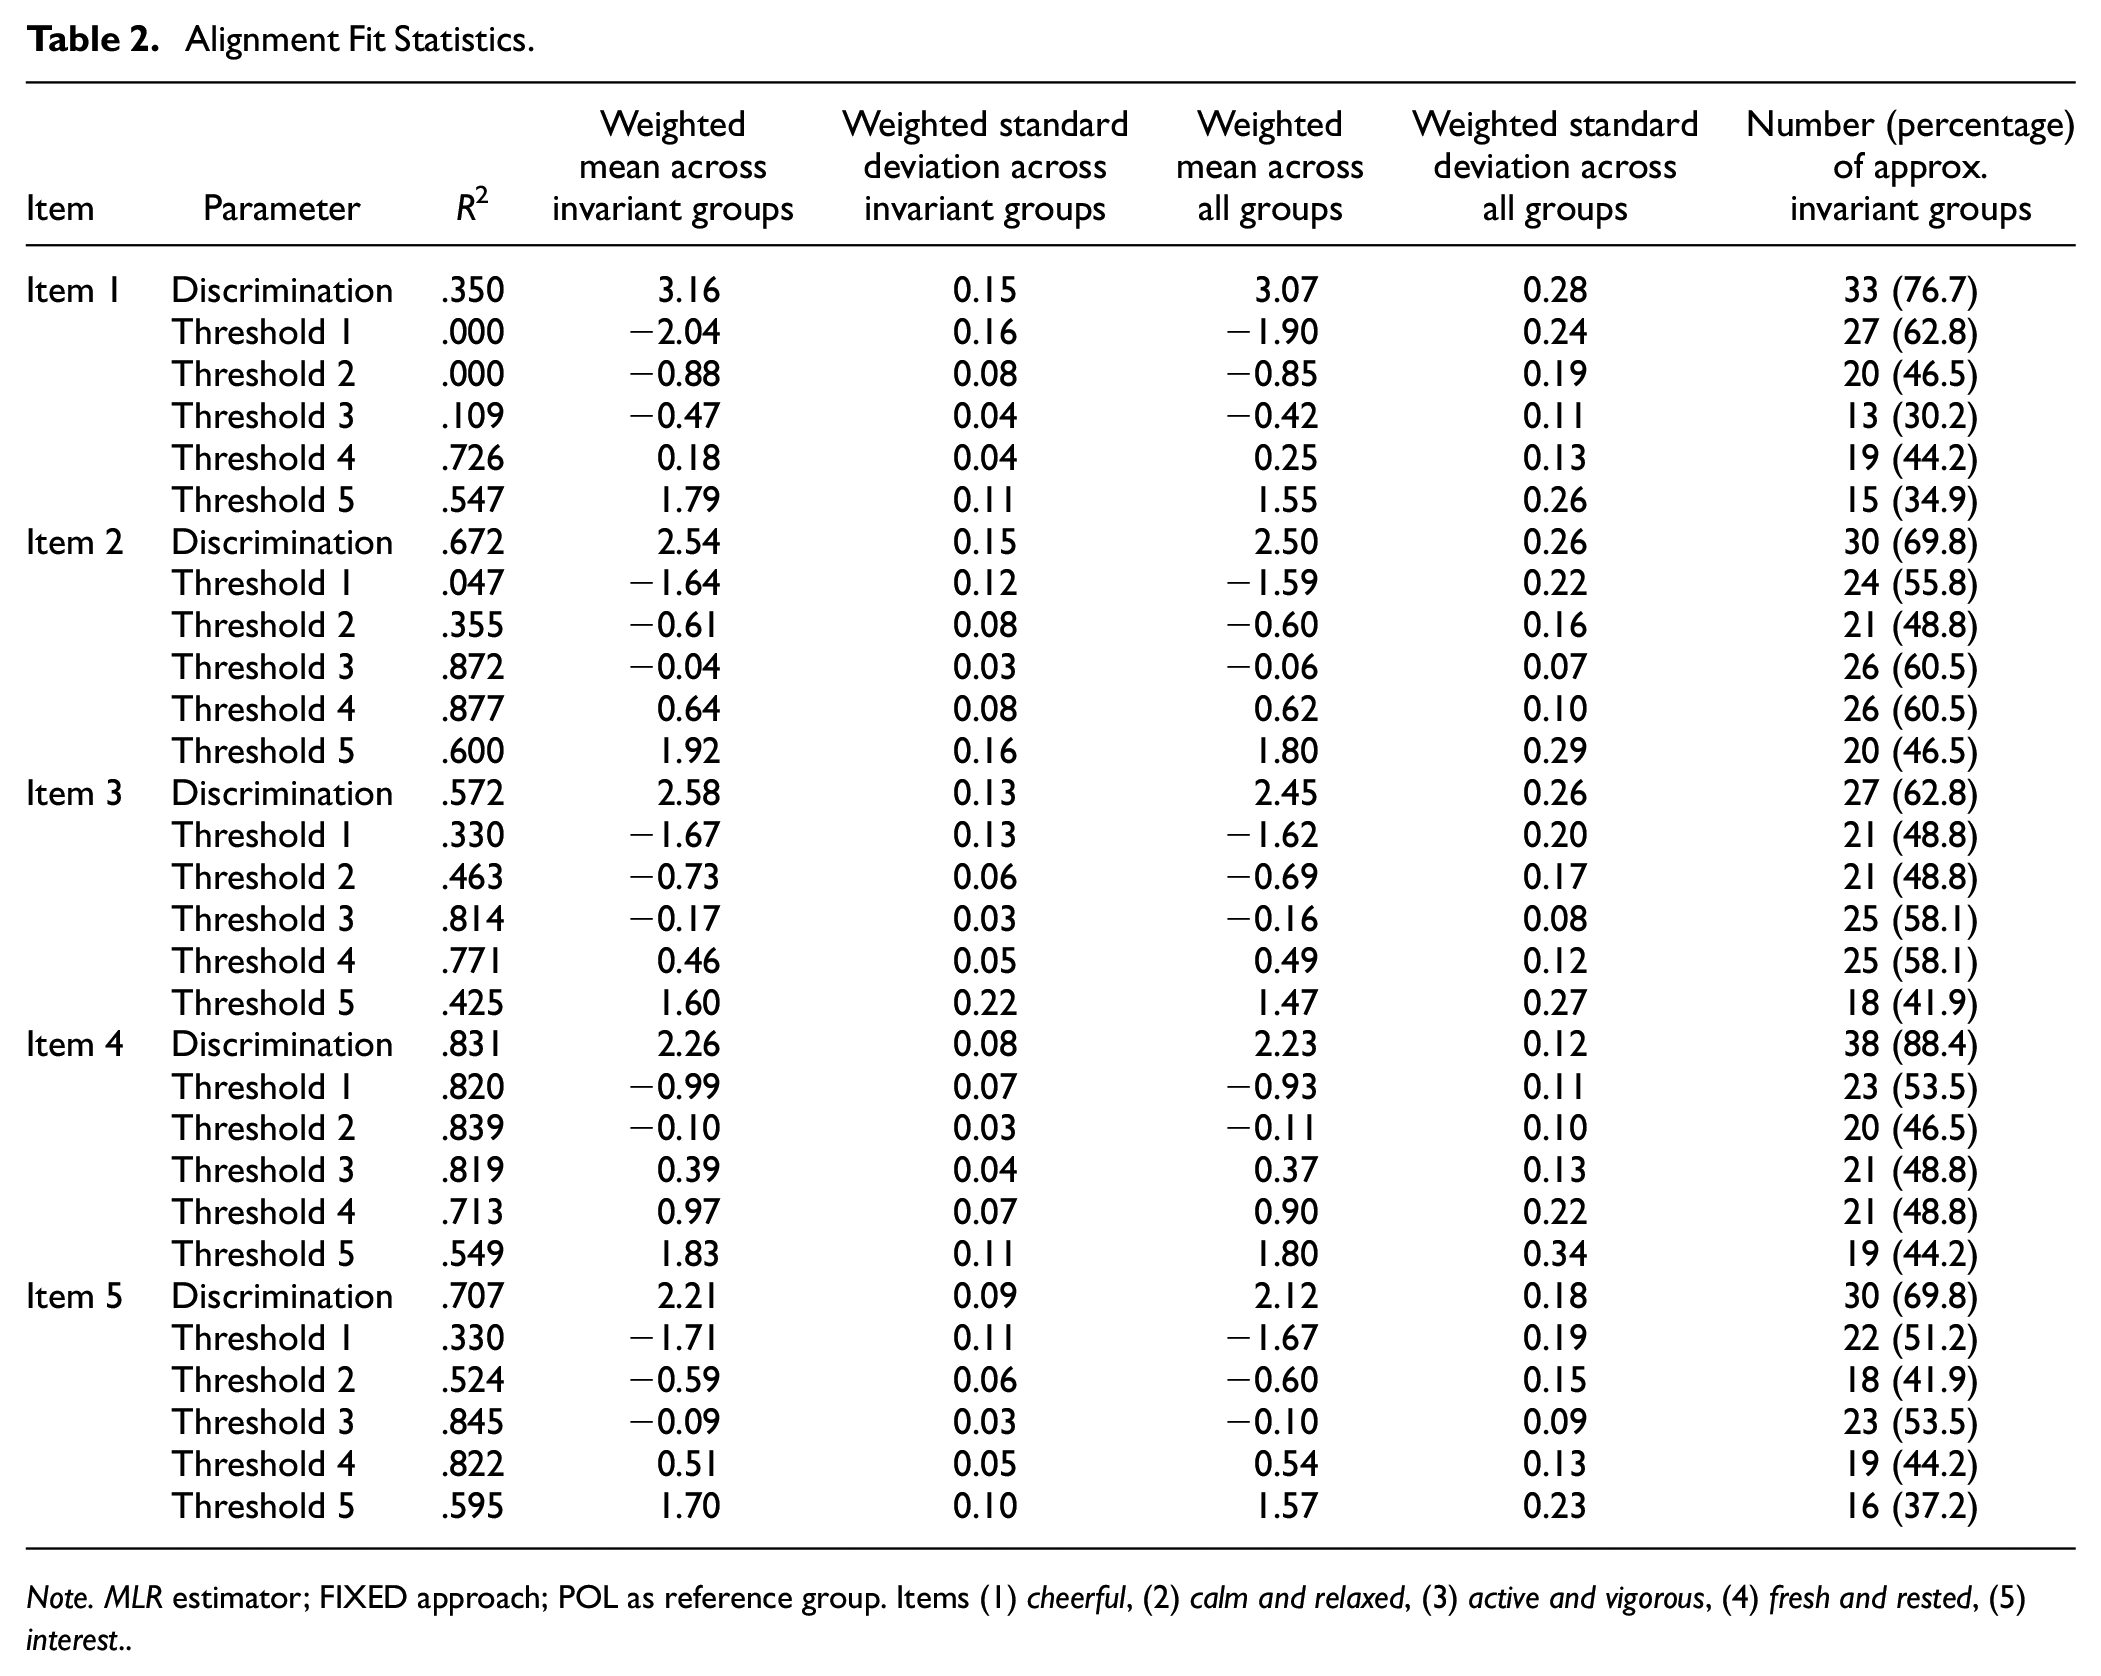
Note. MLR estimator; FIXED approach; POL as reference group. Items (1) cheerful, (2) calm and relaxed, (3) active and vigorous, (4) fresh and rested, (5) interest.
The R2 values for the item thresholds ranged between .000 and. 877 (MR2 = .552; SDR2 = .288), and the percentage of approximate invariant countries between 30.2% and 62.8%. 8 Figure 1 shows the item parameters of the GRM after the alignment procedure (see also Table A13–A17 in the ESM for the exact values). These parameters can be directly compared because of the scale linking via alignment. Figure 1 gives a more nuanced picture of the (non-)invariance of the parameter and shows which countries were deviating most. For instance, it can be seen that the item discrimination parameters for Item 1 in Greenland, Kyrgyzstan, and Tajikistan were clearly non-invariant compared to those in the other countries (see also Figure A56 in the ESM for a quick overview on (non-)invariant parameters).
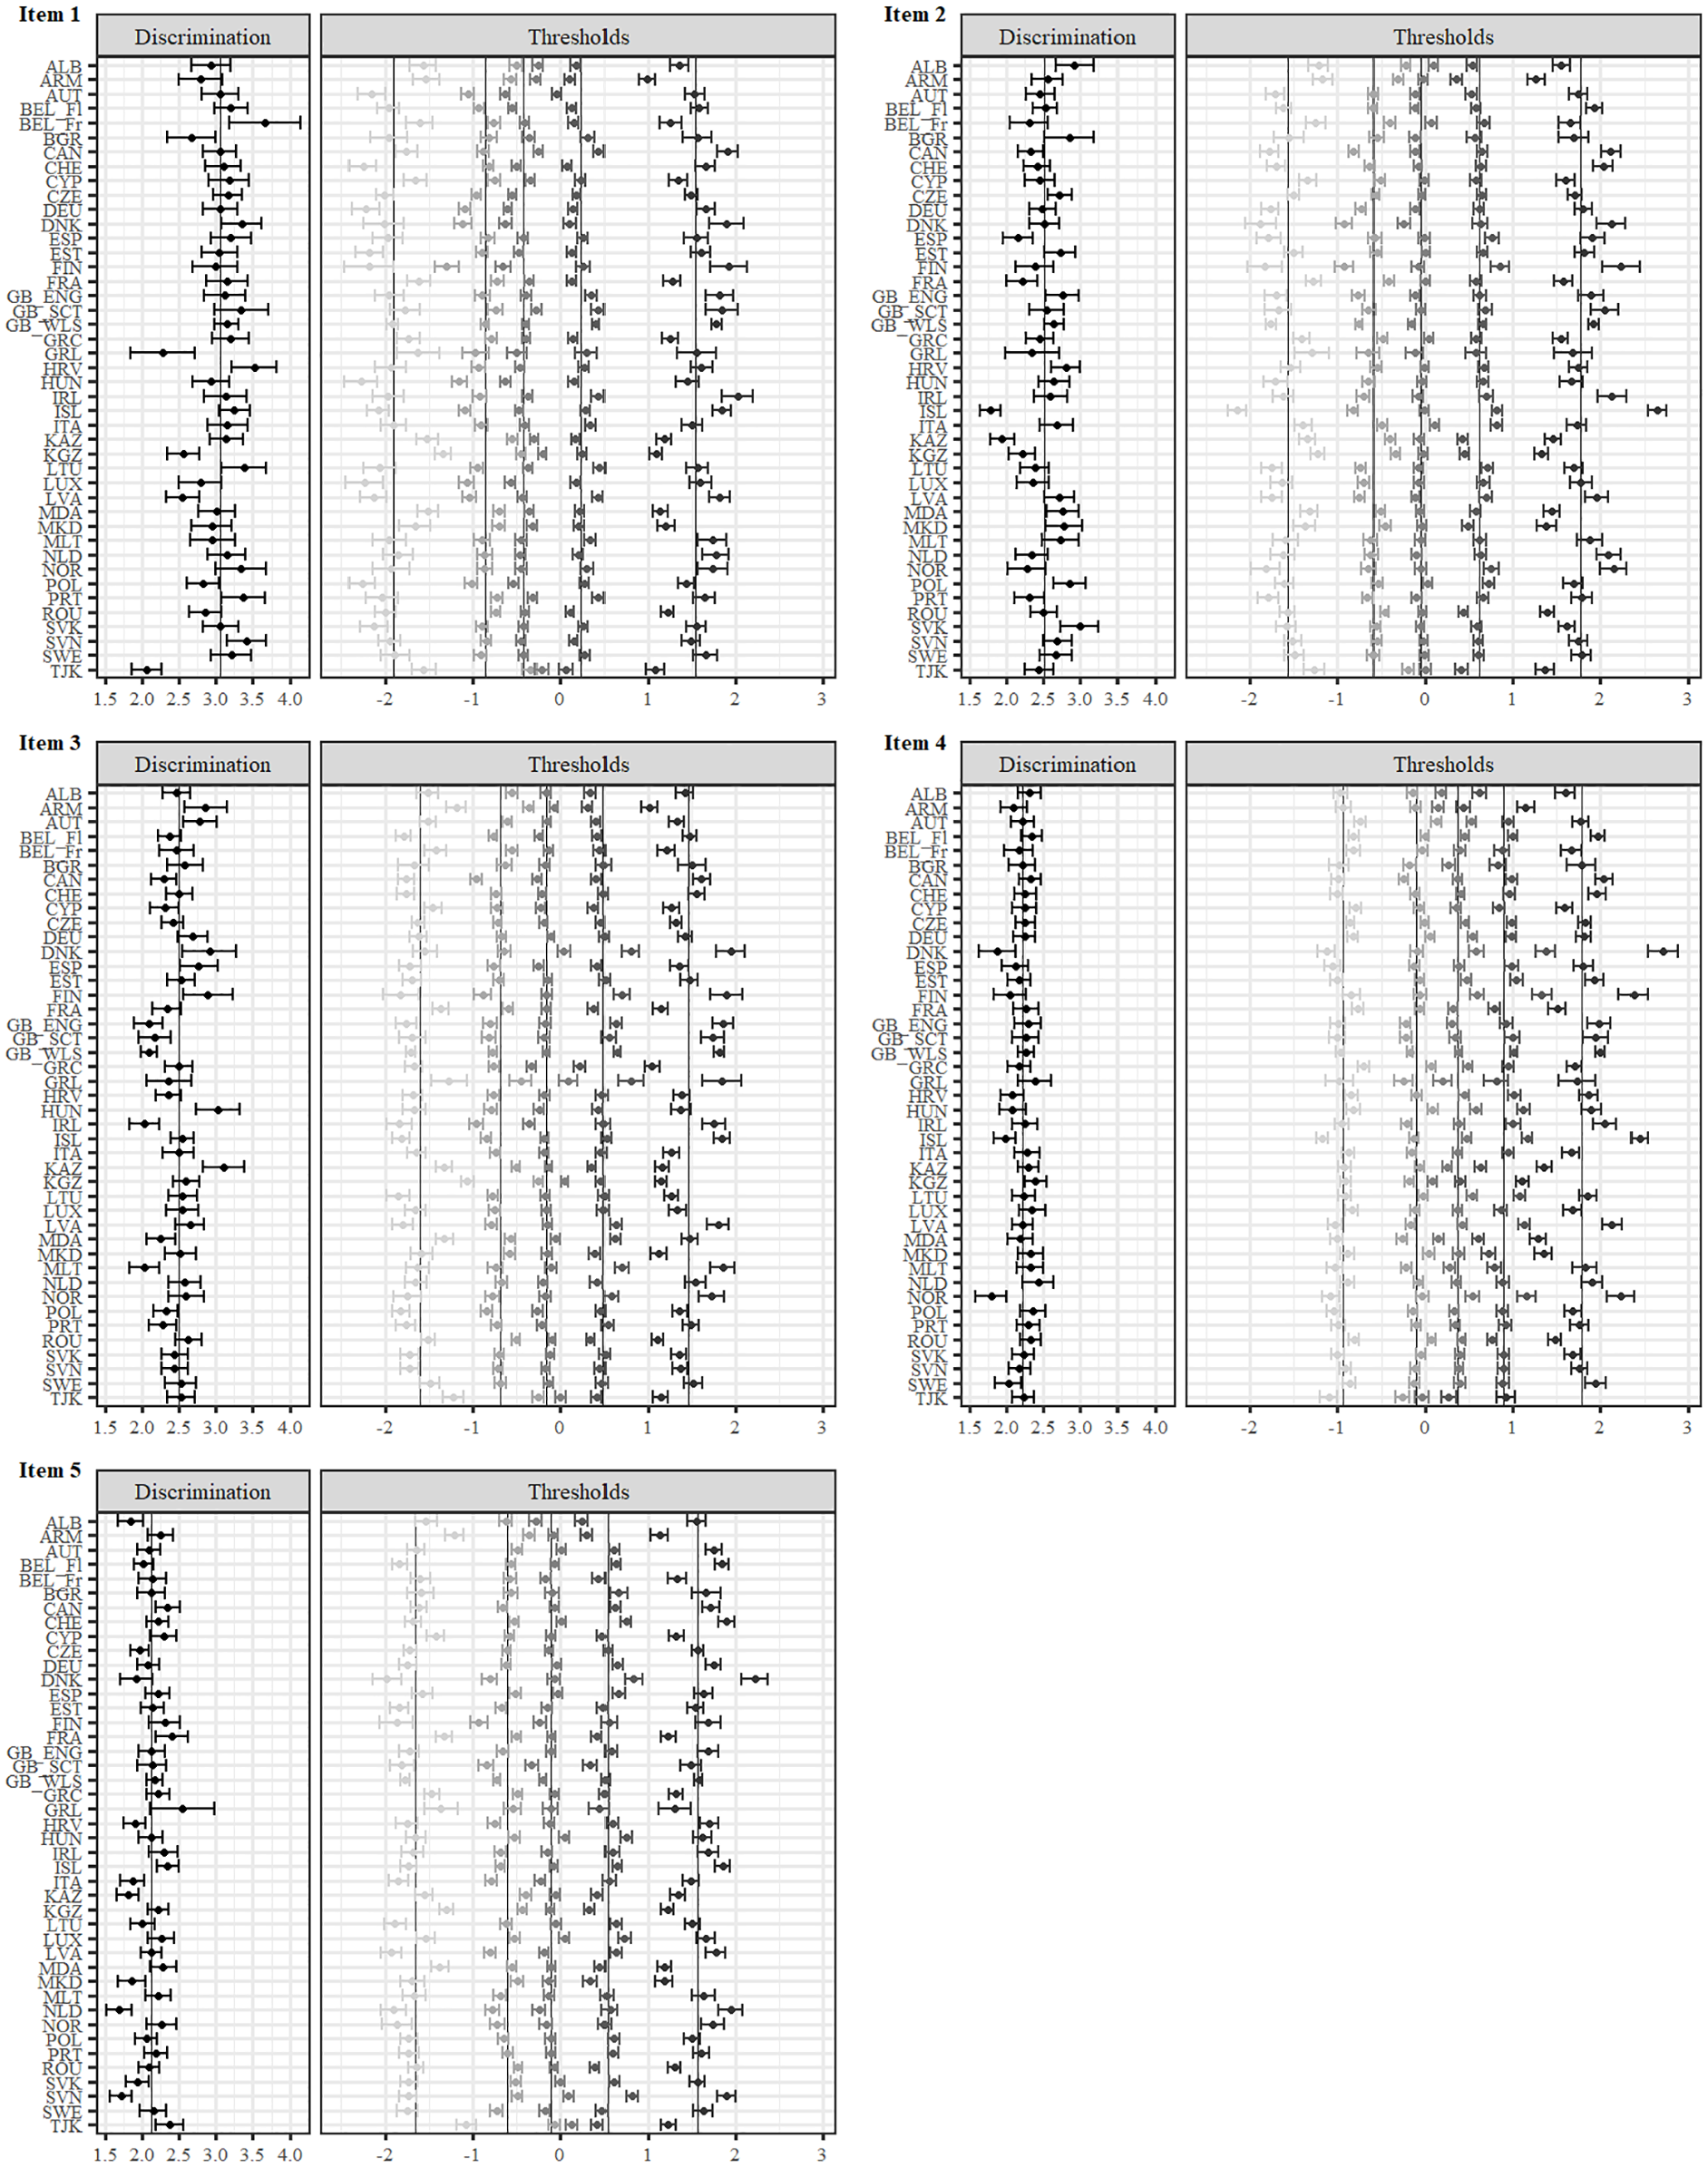
Item Parameter for the GRM After Alignment.
Figure 2 shows the TCCs of the unidimensional GRM after alignment. Exemplary, it can be seen that at lower levels on the latent variable, the expected test scores were especially low for Albania, Kyrgyzstan, and Tajikistan, whereas at higher levels on the latent variable, the expected test scores were especially high for North Macedonia.
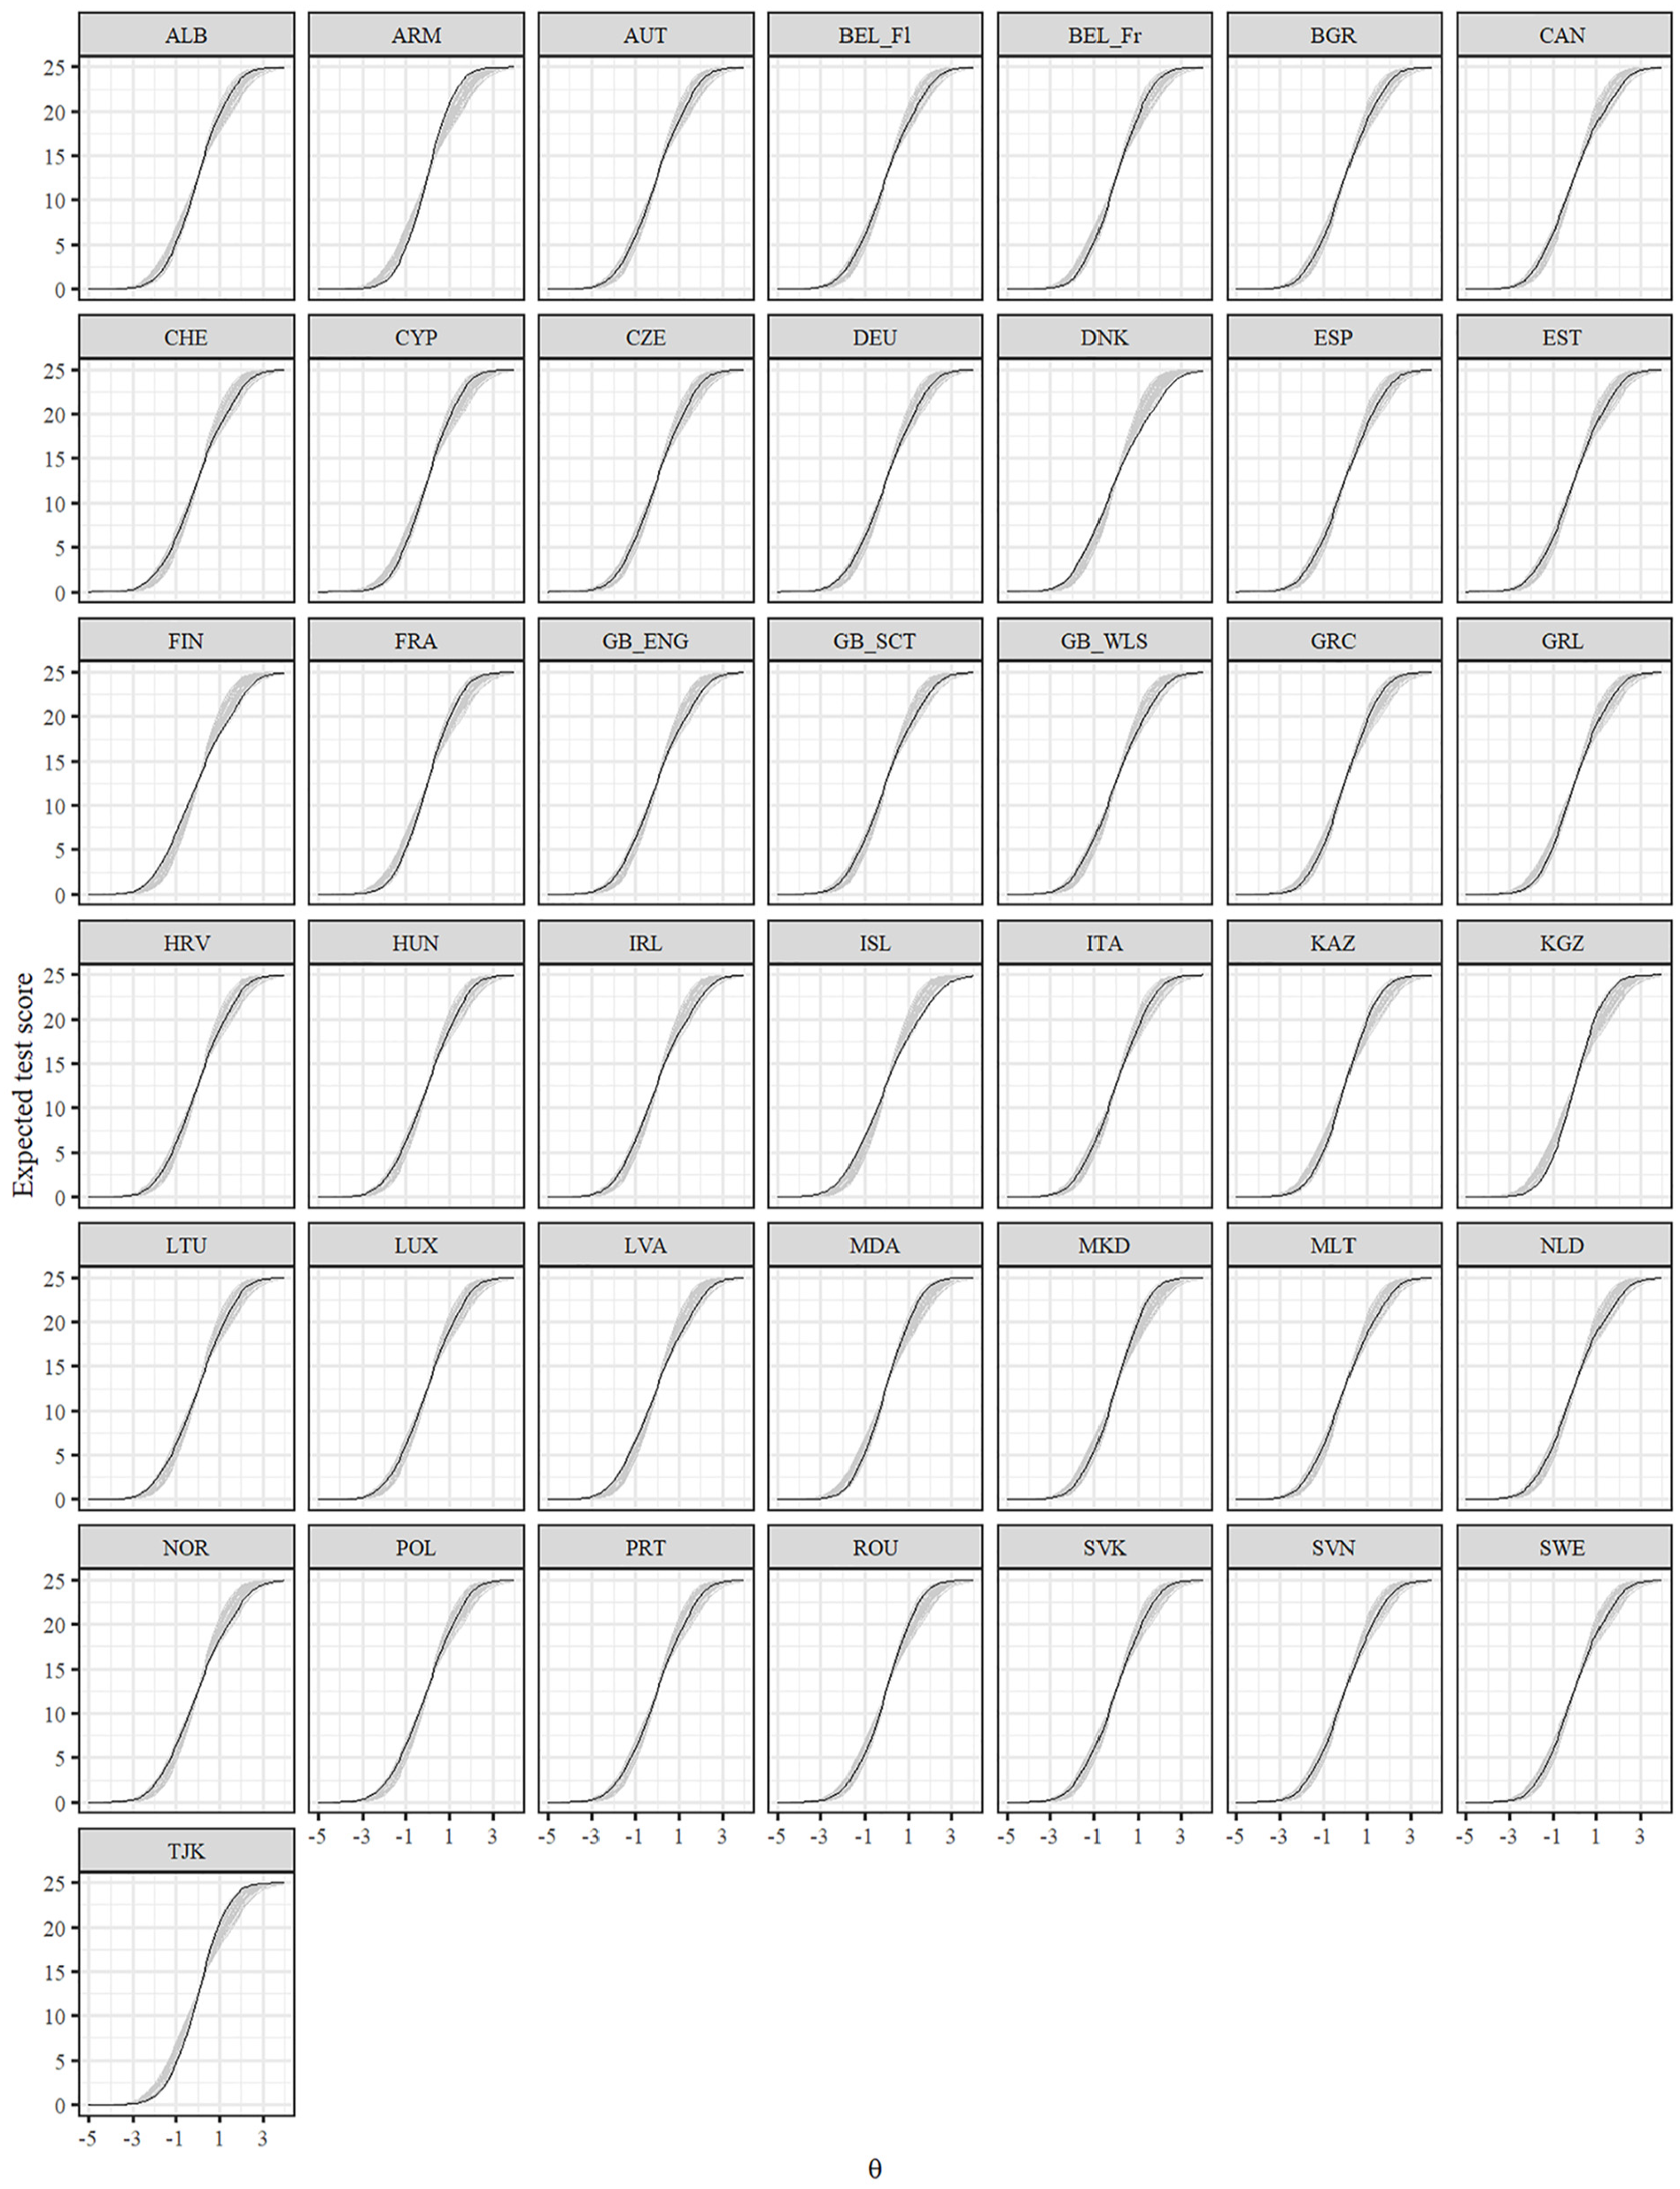
Test Characteristic Curves for the GRM After Alignment.
Figure 3 gives a more fine-grained insight in the differential test functioning across countries. It shows the difference in expected test scores dependent on the level of the latent variable together with the sDRF and uDRF statistics with England as the reference group. Negative values indicate that students in England had higher expected test scores, whereas positive values indicate that the other group had higher expected test scores. The sDRF and uDRF statistics summarize the differential test functioning across the full range of the latent variable. For example, when comparing England and Switzerland, only minor differential test functioning effects occurred, whereas differential test functioning is larger between England and Kyrgyzstan. Taking England as the reference group, the sDRF statistics ranged between −0.34 and 0.79 (MsDRF = 0.12, SDsDRF = 0.25), and the uDRF statistics between 0.03 and 1.40 (MuDRF = 0.42, SDuDRF = 0.36).
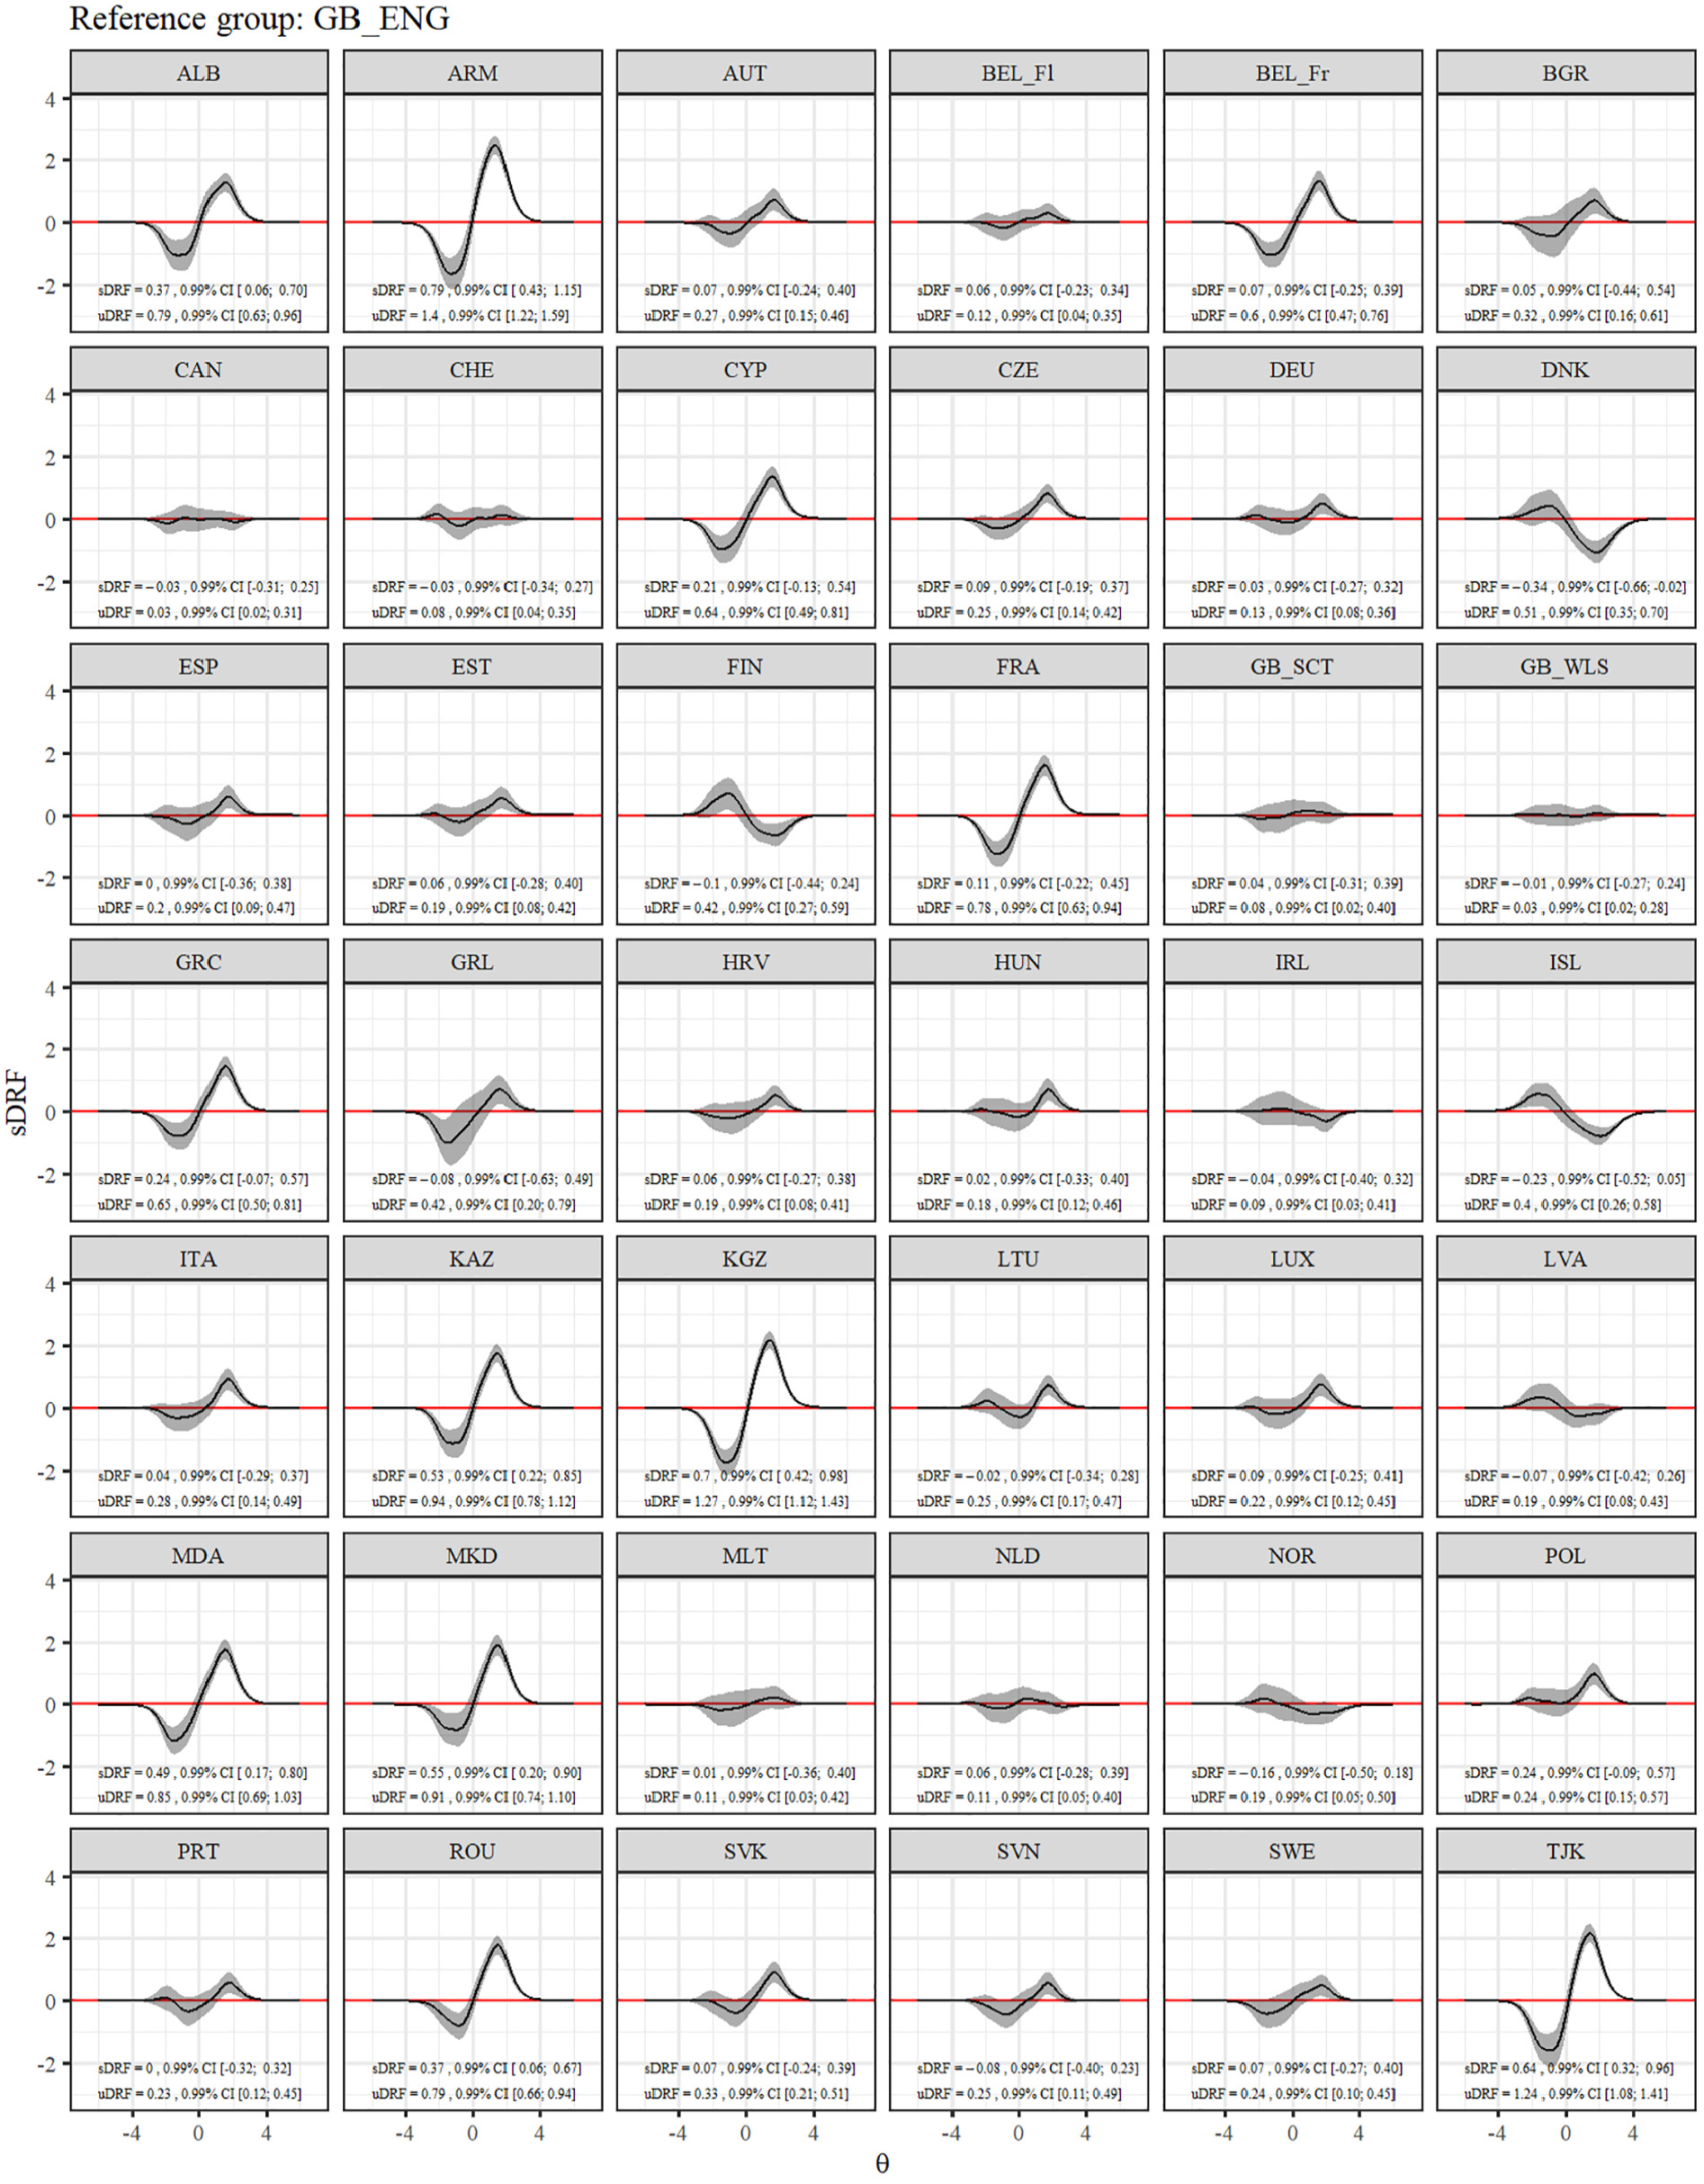
Differential Test Functioning for the GRM After Alignment.
Item Properties, Information Functions, and Marginal Reliability of the Aligned IRT Model
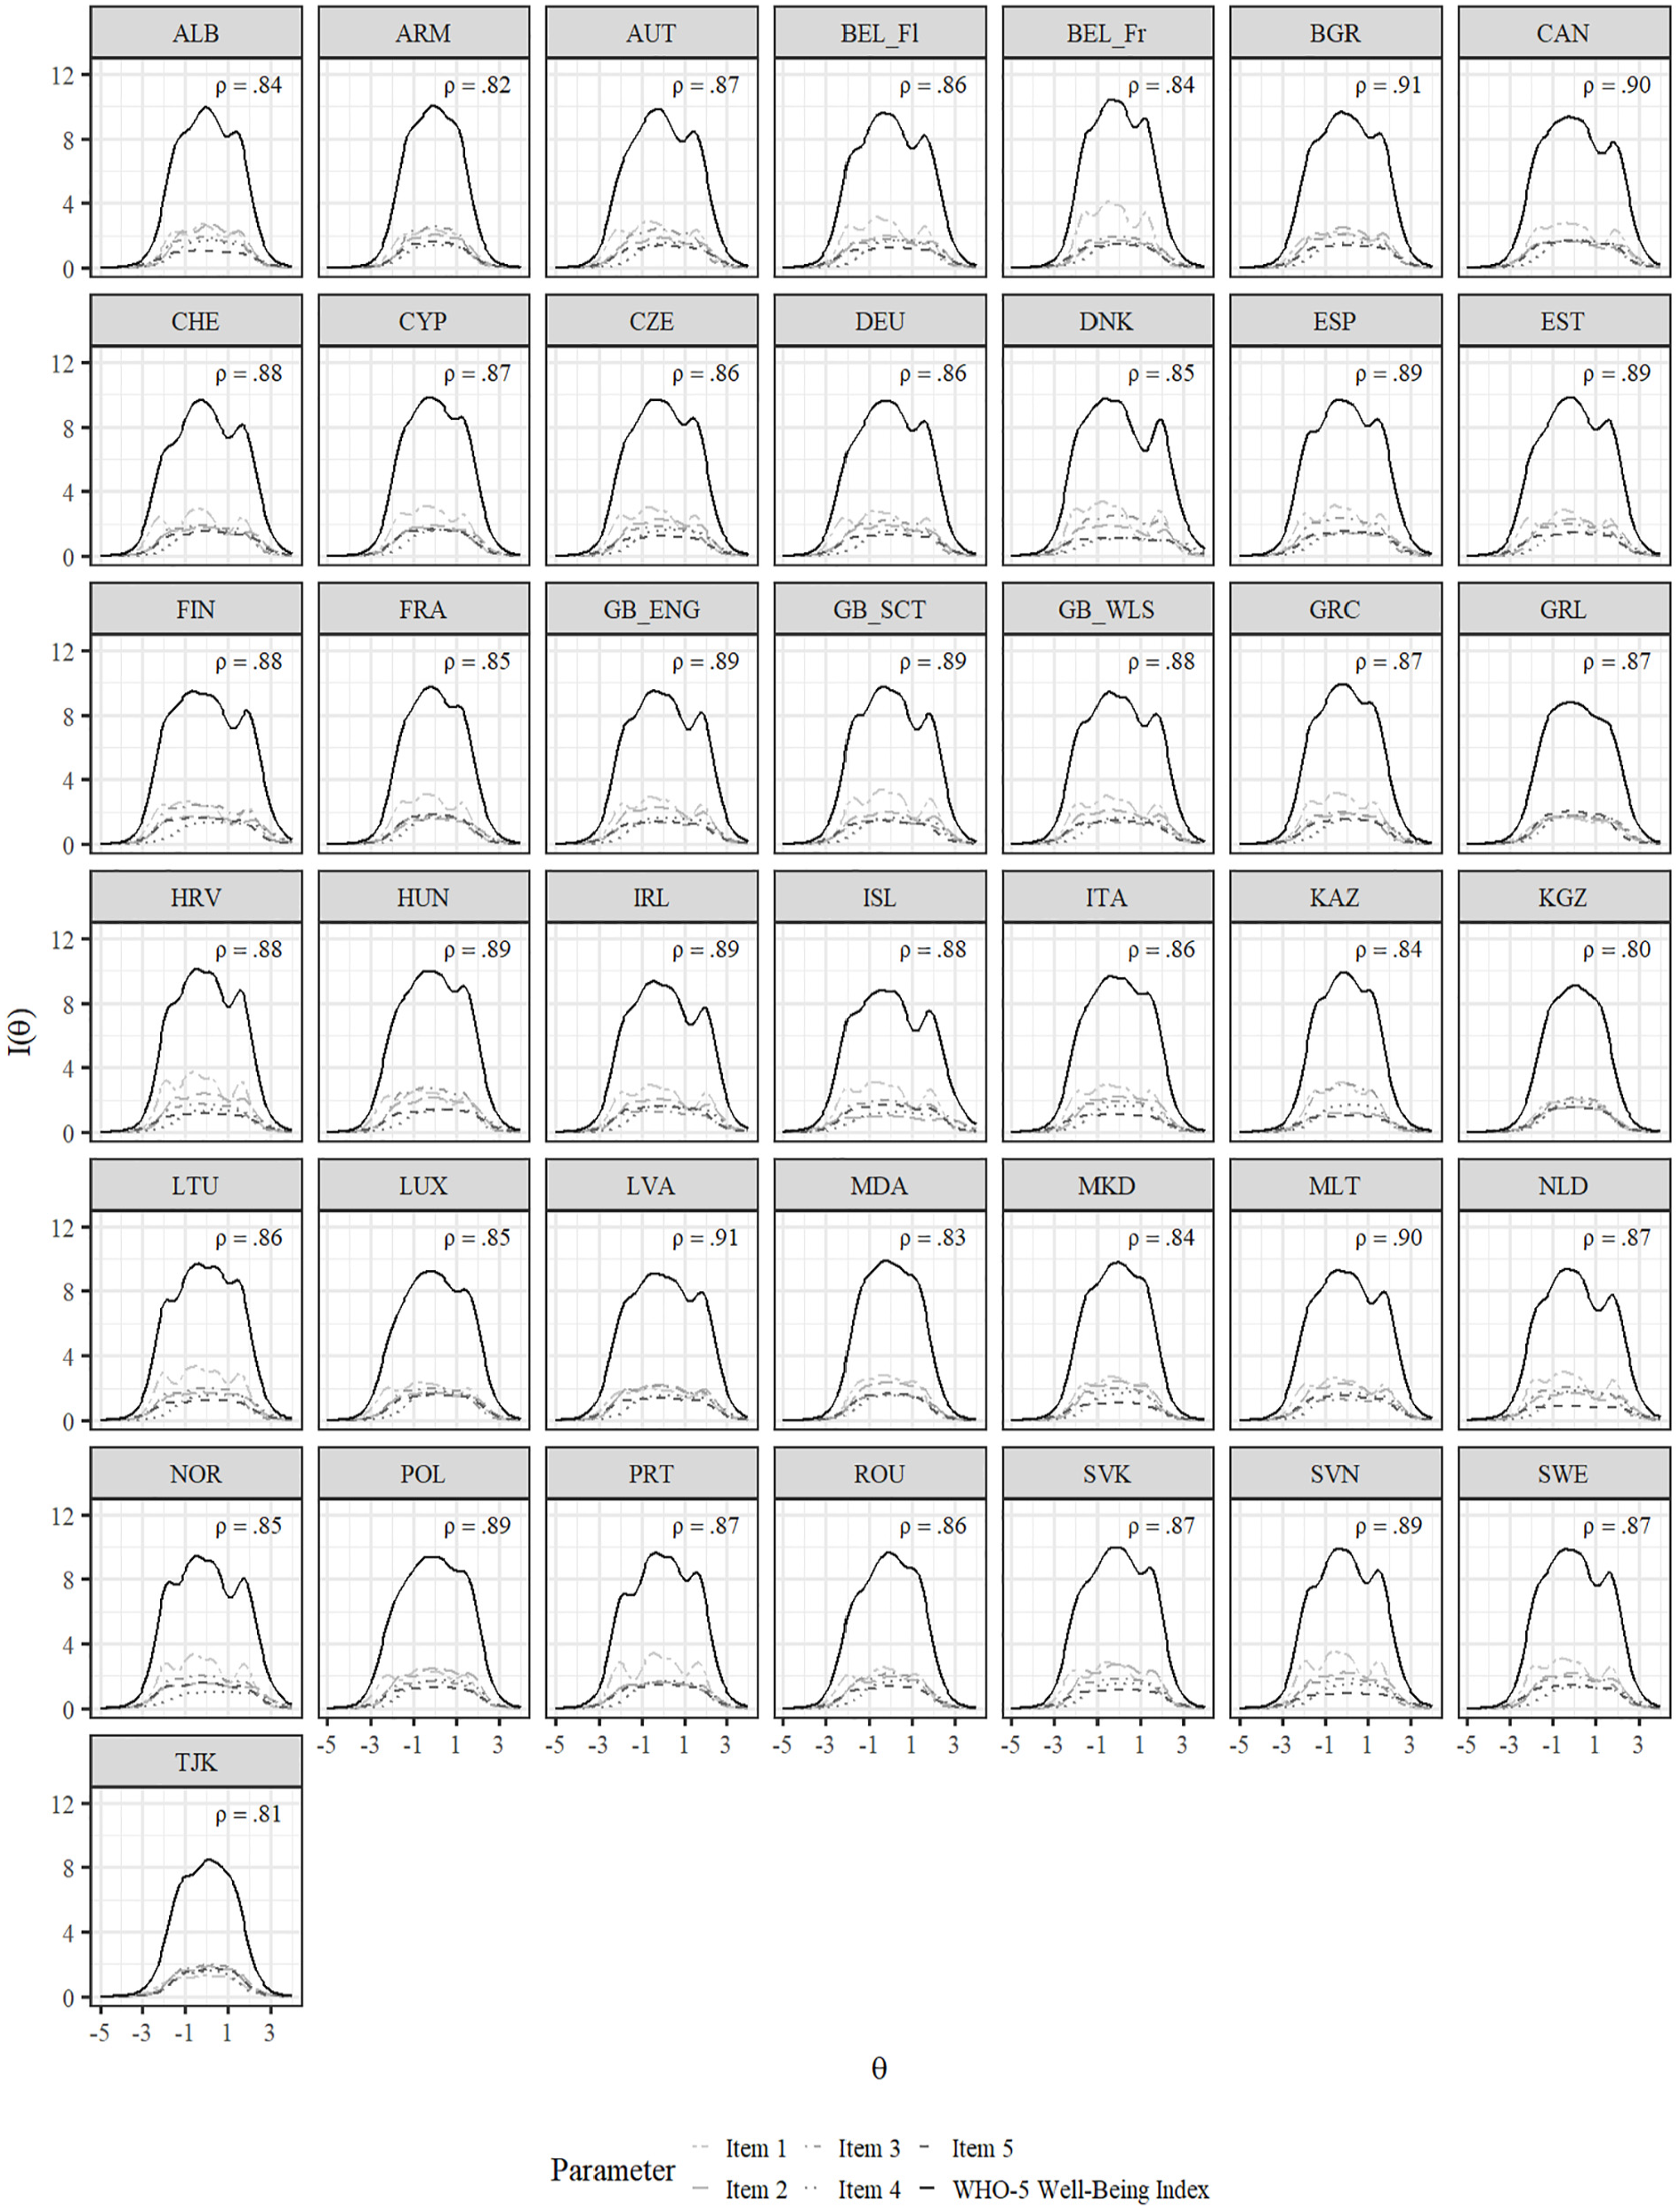
All items showed high or very high discrimination parameters (Baker, 2001) across all countries (see Figure 1; Mitem discrimination = 2.48, SDitem discrimination = .40, Minitem discrimination = 1.68, Maxitem discrimination = 3.67). Moreover, all items showed smaller distances between the Thresholds b2 and b3, and between b3 and b4. Figure 4 displays the TIF and IIF of the aligned GRM across countries. The marginal reliability ranged between .80 and .91. In most countries, Item 1 provided the most amount of information.
Item and Test Information Functions for the GRM After Alignment.
The correlations between factor scores and manifest sum scores ranged between .94 and .99 within each country (see Figure A57 in the ESM). Figure 5 shows the association between the WHO-5 country means when the scoring of the WHO-5 is performed via manifest sum scores or via (expected a-posterior [EAP]) factor scores of the aligned GRM. The correlation is very high (r = .97), indicating mostly negligible differences in country ranking between the two scoring methods (see also Figure A58 in the ESM for the order of the countries).
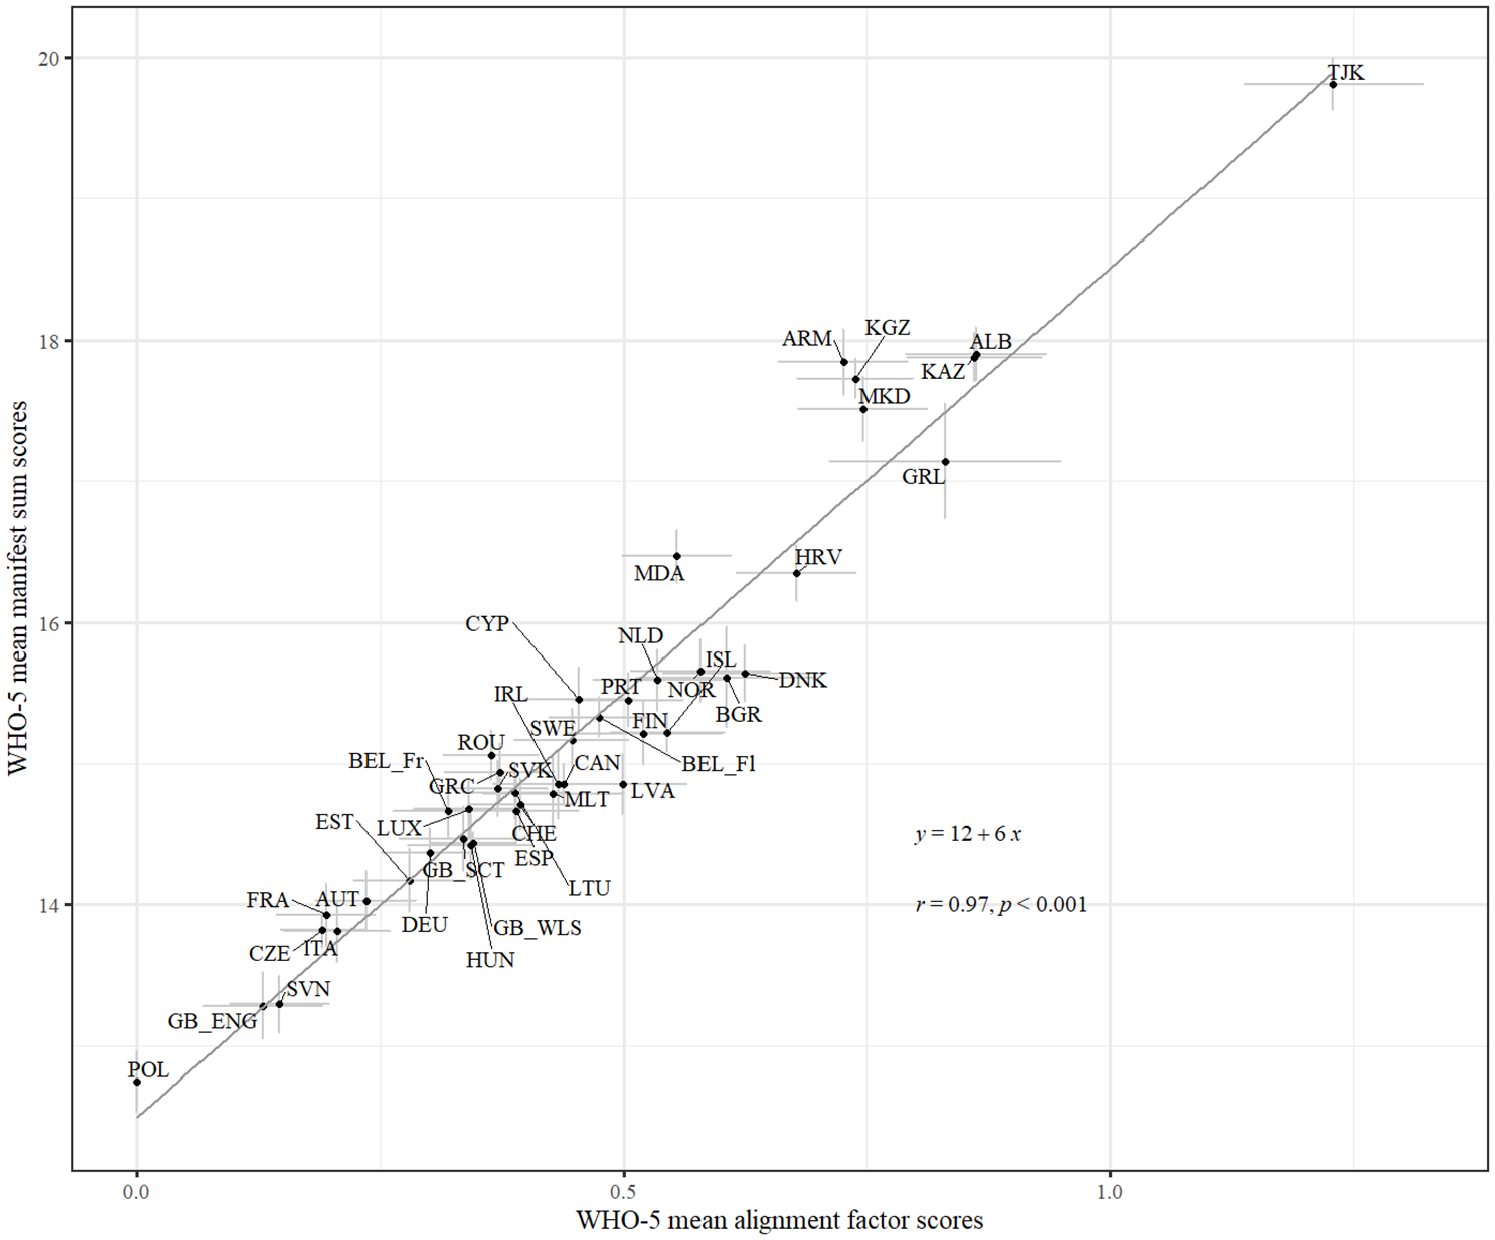
Scatterplot With Country Means of Factor Scores and Manifest Sum Scores.
Relationship With External Criteria
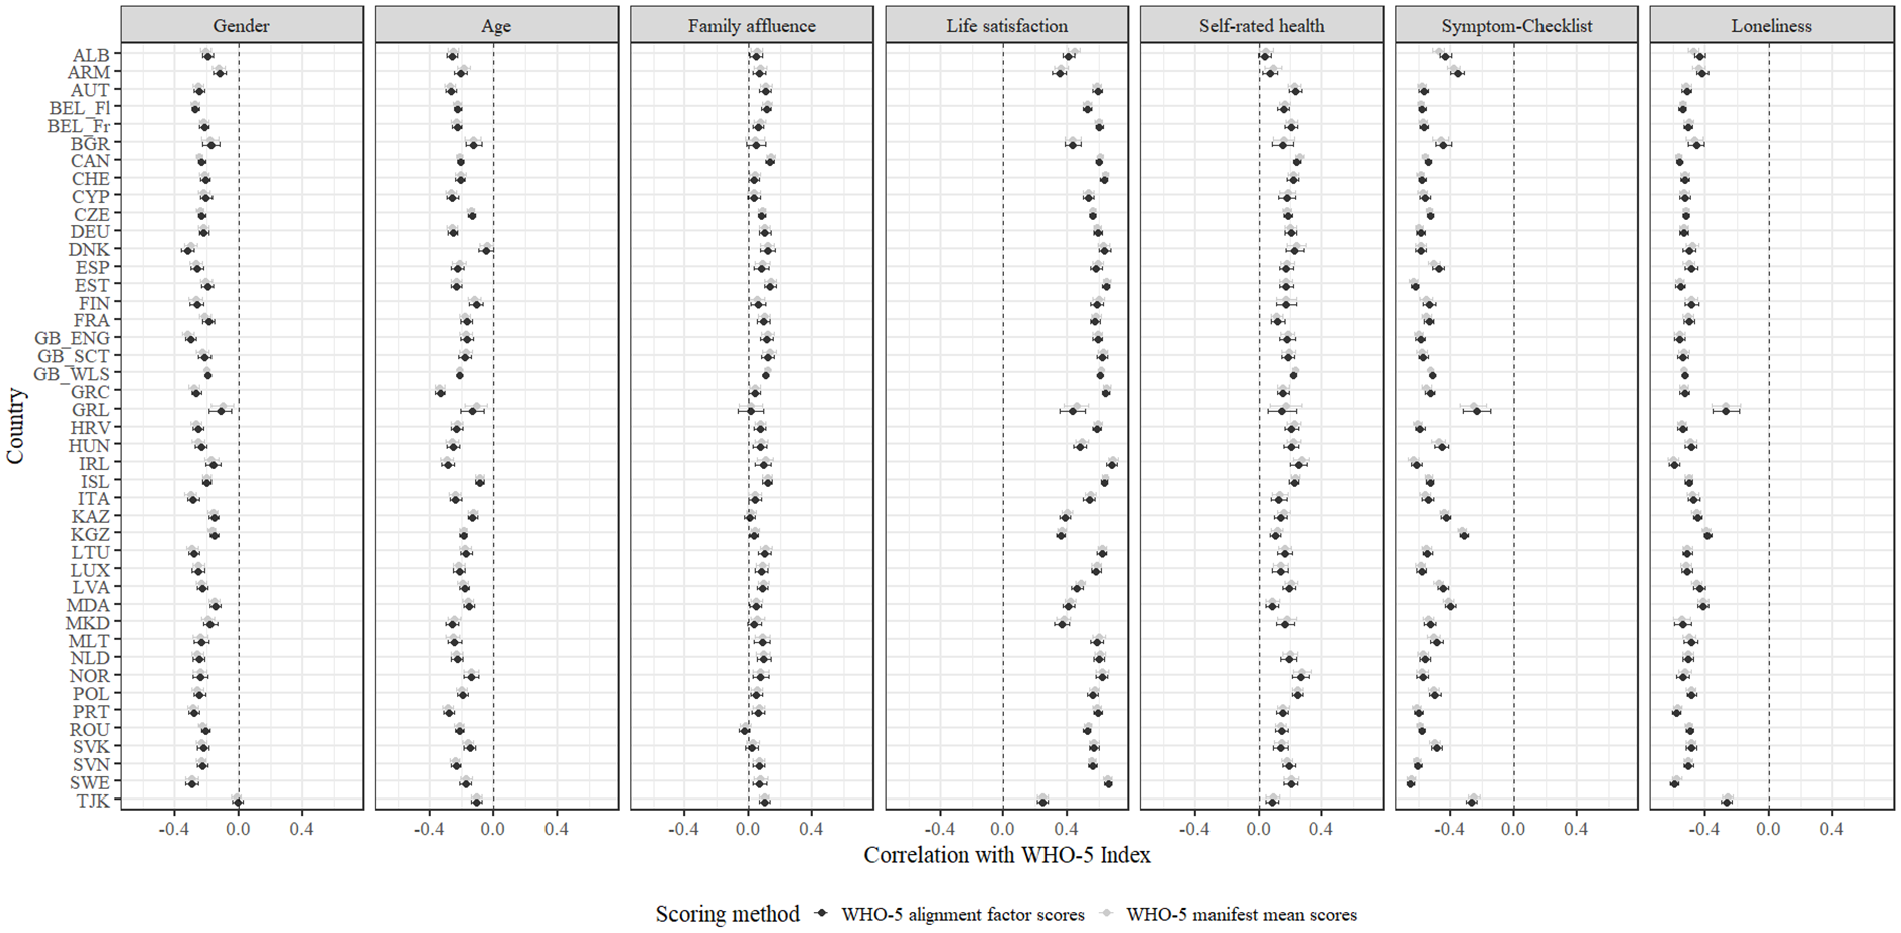
The correlations between the WHO-5 (for manifest sum scores and for factor scores of the aligned GRM) and the other variables are shown in Figure 6. The correlations of WHO-5 manifest sum scores to gender ranged between –.32 and –.02 (Mcor = −.23, SDcor = .06); of WHO-5 sum scores to age, between –.34 and –.04 (Mcor = −.20, SDcor = .06); WHO-5 sum scores to family affluence, between −.02 and .14 (Mcor = .07, SDcor = .04); WHO-5 sum scores to life satisfaction, between .24 and .69 (Mcor = .55, SDcor = .10); WHO-5 sum scores to SRH, between .05 and .27 (Mcor = .18, SDcor = .05); WHO-5 sum scores to Symptom Checklist, between –.65 and –.25 (Mcor = −.53, SDcor = .09); and WHO-5 sum scores to loneliness, between –.60 and –.26 (Mcor = −.50, SDcor = .07) across countries. Overall, the differences between the correlations of the manifest sum scores and the criterion variables and the correlations of the factor scores from the aligned GRM and the criterion variables were not substantial. Across all variables and countries, the differences ranged between –.05 and .04, indicating that the correlations derived from the manifest sum scores and those from the factor scores are nearly equivalent. This suggests that using either scoring method yields similar results when assessing relationships with external criteria.
Correlations Between the WHO-5 Index and the Other Variables.
Norm Values
Table 3 presents the mean sum scores, standard deviations, and percentiles of the WHO-5 across countries. The country means ranged between 12.7 (Poland) and 19.8 (Tajikistan). 9 See Table A21 in the ESM for WHO-5 norm values stratified by age groups and gender. 10
Mean, Standard Deviation, and Percentile Norms of the WHO-5 Well-Being Index Across Countries
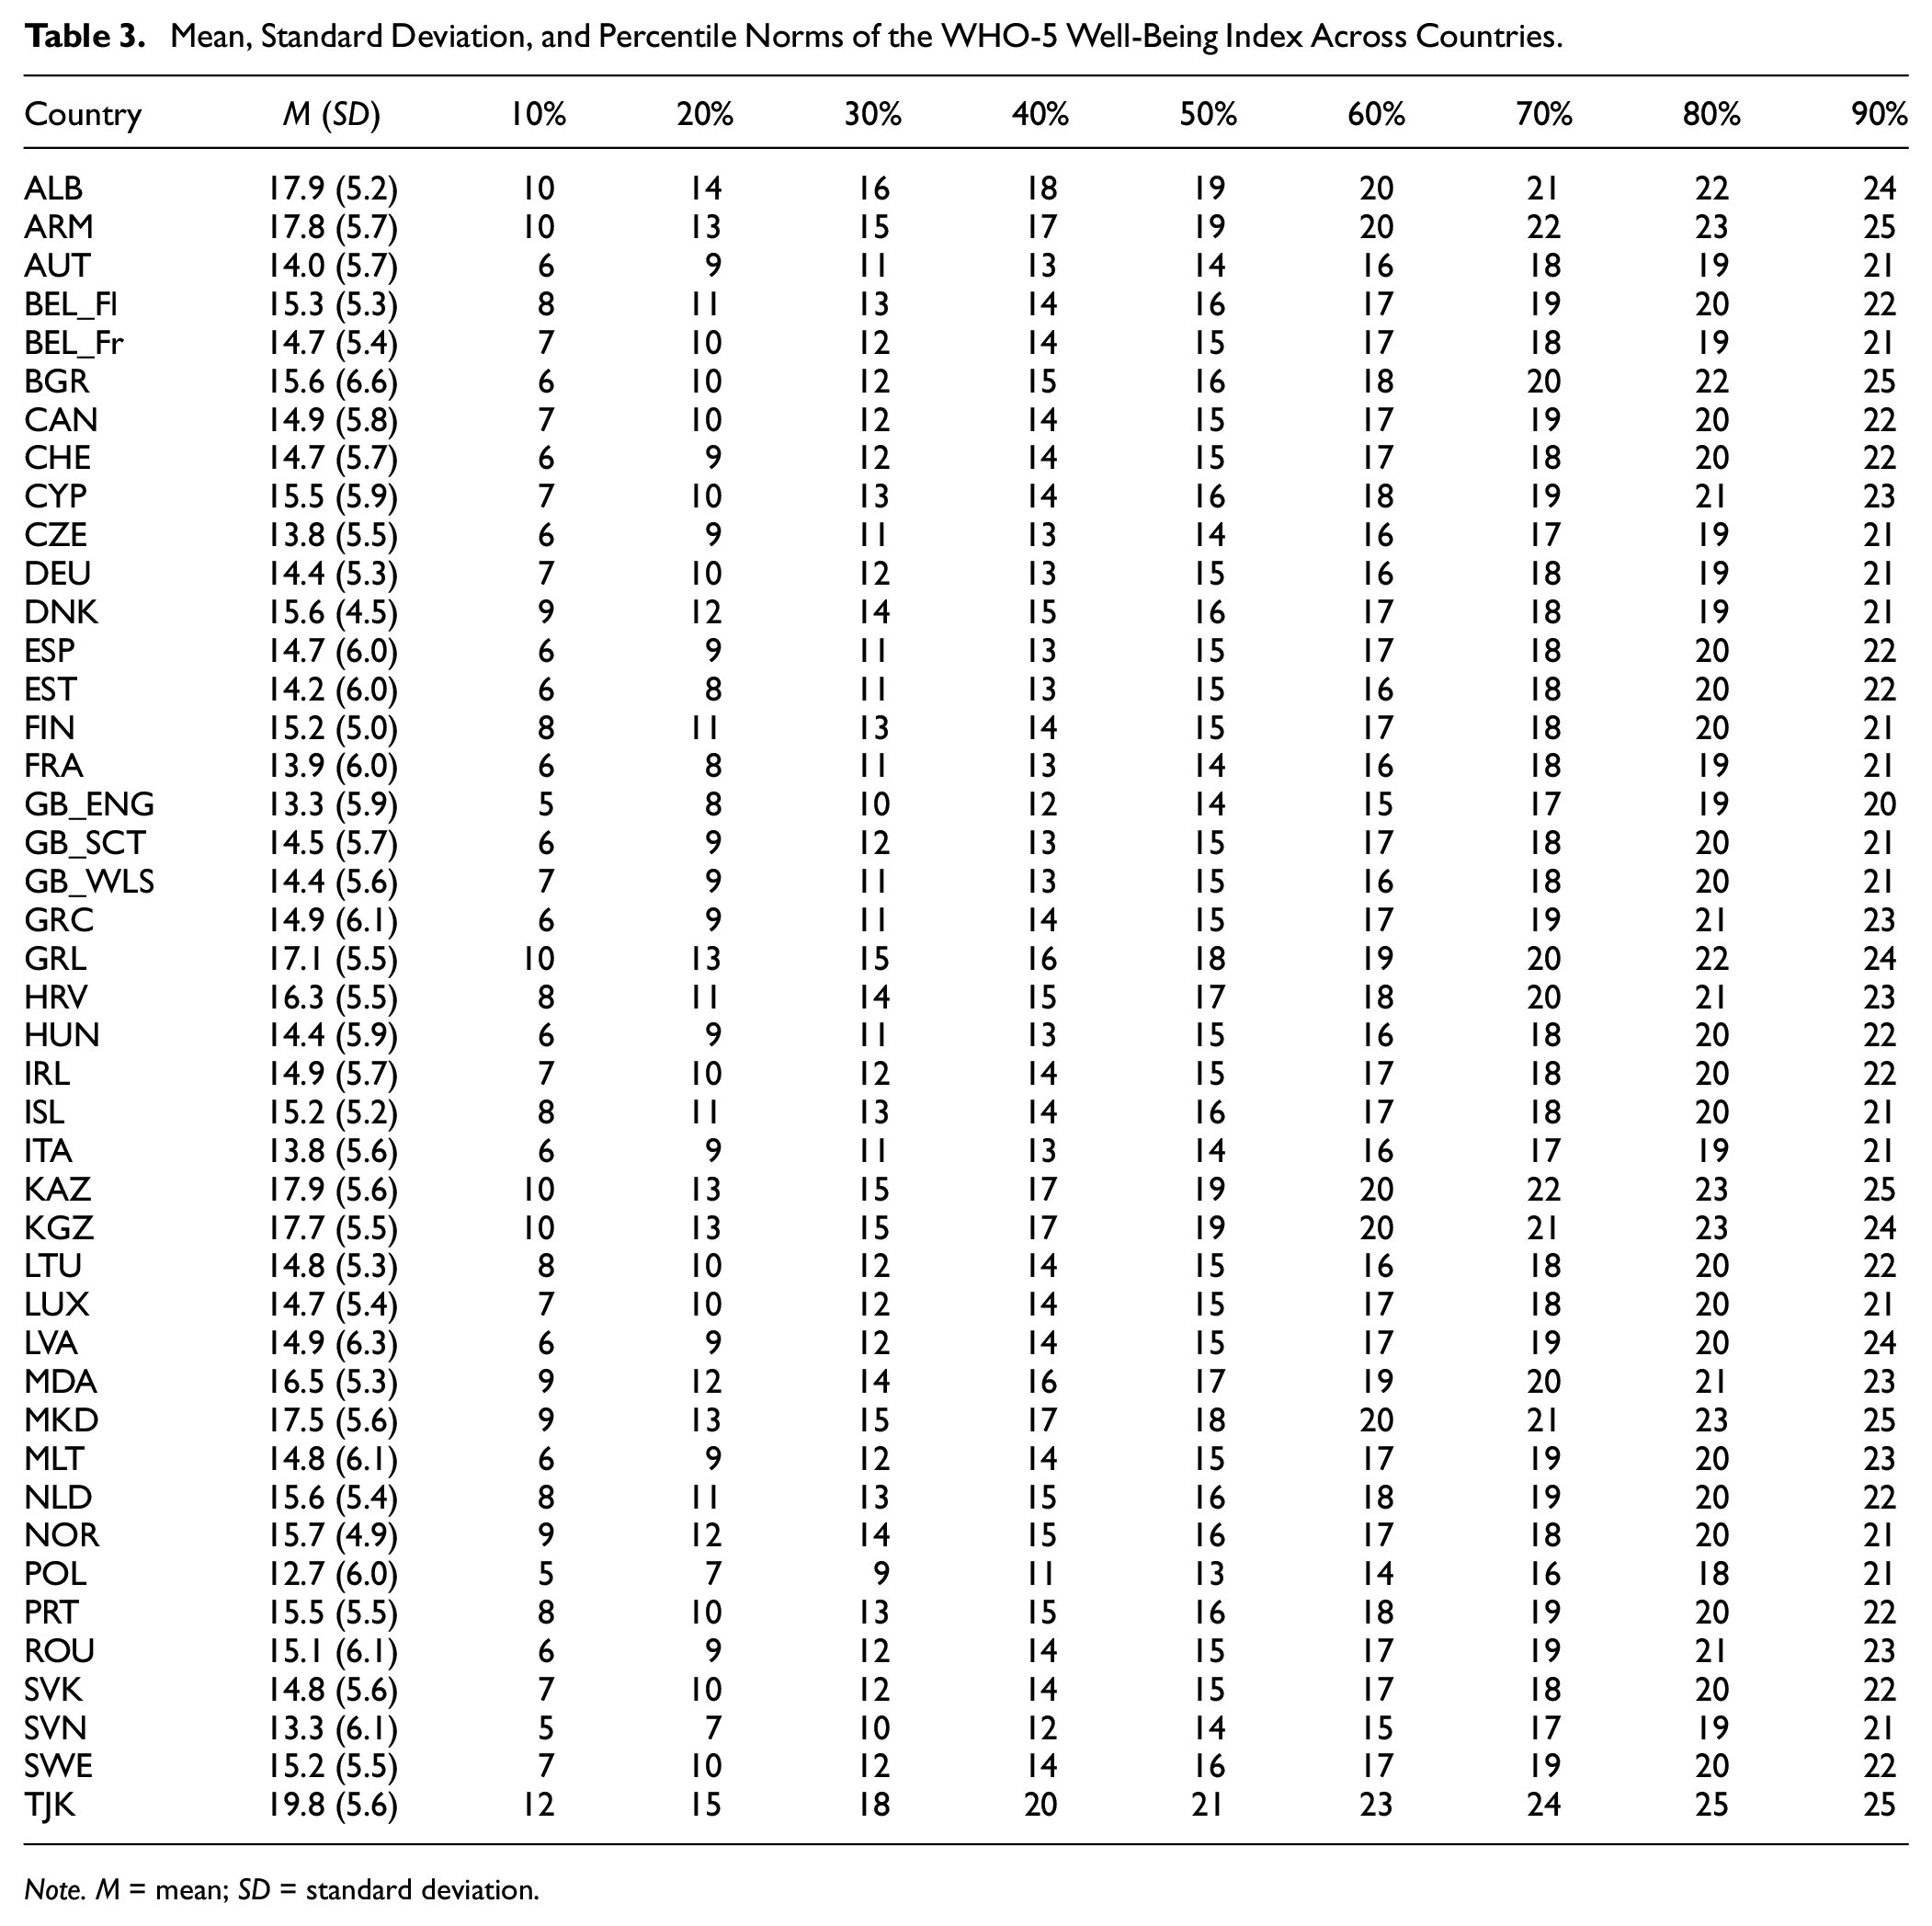
Note. M = mean; SD = standard deviation.
Discussion
In the present study using national representative samples of adolescents from 43 European and Central Asia countries as well as Canada, we provided an in-depth psychometric analysis of the WHO-5 Well-being Index by investigating its dimensionality and measurement structure, item properties, reliability, cross-national MI, and its nomological network in adolescent samples.
Dimensionality, Measurement Structure, Item Properties, and Reliability
In line with previous research (e.g., Cosma et al., 2022; de Wit et al., 2007), EGA dimensionality analysis revealed that the WHO-5 items map onto one latent (hedonic well-being) dimension in all countries. The GRM showed a good model-data fit in most countries, and its assumptions (i.e., local independence, monotonicity, item fit) were mostly met. Regarding the local independence assumption, Items 1 and 2 showed the highest amount of local dependence within most countries. This finding is in line with recent research (Cosma et al., 2022). However, contrary to Cosma et al. (2022), our results indicate that the violation of the local independence assumption seems to be negligible and suggests that all five items of the WHO-5 should be retained to maintain construct depth.
All items exhibited substantial discriminatory power across all countries (i.e., a ≥ 1.68; e.g., Baker, 2001). This indicates that all items are relevant indicators of hedonic well-being in all countries. Our results mirror previous research on the WHO-5 measurement structure within adolescence (Quansah et al., 2022) and adults (Sischka, Costa, et al., 2020) and showed somewhat smaller distances between the thresholds b2 (some of the time vs. less than half the time) and b3 (less than half the time vs. more than half the time), and between b3 and b4 (more than half the time vs. most of the time). The marginal reliability was high for all countries (≥80). Moreover, test information values of the WHO-5 were also sufficiently high (≥4, O’Connor, 2018) over different levels of the latent variable in all countries.
Cross-Country MI and Differential Item/Test Functioning
Overall, the multi-group IRT analysis indicated that the WHO-5 exhibits configural and metric but not scalar cross-country invariance. However, a subsequent alignment procedure revealed some amount of non-invariance at the item discrimination and threshold level (47.2% of all parameters were non-invariant). Especially Item 1 showed some cross-country item discrimination variability (e.g., Greenland, Tajikistan). Moreover, all items showed a higher amount of threshold non-invariance for the first (b1) and last (b5) threshold than for the other thresholds. Consequently, differential test functioning was particularly pronounced at the extreme levels of the latent continuum, a finding that has also been shown in adult samples (Sischka, Costa, et al., 2020). Overall, the results indicated small to moderate differential test functioning across countries. For instance, data from England and Albania showed an average deviation of 0.79 (99% CI [0.63, 0.96]) points from the WHO-5 expected test scores (ranging between 0 and 25) for the same level on the latent variable. 11 Especially Armenia, Kyrgyzstan, and Tajikistan showed some amount of non-invariance compared to the other countries.
Relationship With External Criteria
Overall, the WHO-5 showed the expected associations with the external criteria (i.e., moderate to strong positive correlations with life satisfaction and SRH; and negative correlations with Symptom Checklist and loneliness). These associations have in part already been established in both adolescent (e.g., Cosma et al., 2022) and adult (e.g., Aliyev et al., 2024; Sischka, Schmidt, & Steffgen, 2020) populations. In line with expectations, on average, boys (Salk et al., 2017), younger students (González-Carrasco et al., 2017; Michel et al., 2009), and students with a higher socioeconomic status (Sweeting & Hunt, 2014) scored higher on the WHO-5.
Correlational analysis revealed a similar nomological net of the WHO-5 across countries, with the exceptions of Greenland and Tajikistan that showed substantially lower correlations with some other measures (i.e., Symptom Checklist and loneliness). The scoring method of the WHO-5 (GRM alignment factor scores versus manifest sum scores) had almost no effects on the associations between the WHO-5 and the external criteria.
Study Strengths, Limitations, Constraints to Generality, and Future Research
One strength of the current study is the alignment in research protocol across countries during data collection, which ensures functional equivalence (Schnohr et al., 2015) and makes cross-national data more comparable. Another strength of the HBSC study is the nationally representative datasets across 43 countries with a large sample size for all included countries (i.e., n ranged between 1,229 and 34,427). Therefore, the analysis has obtained reasonable item parameter recovery (Ostini et al., 2015), and the statistical power was large enough to detect even small differential item/test functioning across countries (Nguyen et al., 2014).
One limitation concerns the included countries as many of them represent WEIRD societies (Western, Educated, Industrialized, Rich, and Democratic; Henrich et al., 2010). While our sample included a few lower-middle-income and middle-income countries, there was no representation from low-income countries or regions in the Global South. Most of the participating countries were located in Europe and Central Asia, resulting in a somewhat limited cultural and economic diversity. Thus, future research might test the WHO-5’s psychometric properties and MI in adolescent populations across a wider range of countries (e.g., in South America, Asia, and Africa). This would further enhance our understanding of the measure’s applicability and validity across diverse cultural and economic contexts. Moreover, the current study only used cross-sectional data, which limits the conclusions regarding the causal direction of the associations between the WHO-5 and the external criteria. In addition, test–retest reliability, that is, temporal stability and the longitudinal factor structure, remains unknown. Thus, future studies might investigate the predictive evidence of validity (Cooper, 2019) and temporal stability, as well as temporal invariance (Widaman et al., 2010) of the WHO-5 in adolescent populations. Finally, although the WHO-5 was originally developed as a generic, global measure of subjective well-being, it has frequently been applied and tested as a screening tool for depression, especially in adult populations (e.g., Topp et al., 2015). Since the HBSC data lack a gold standard measure to assess depression (e.g., structured clinical interviews), the sensitivity and specificity of the WHO-5 for detecting this disorder in adolescents remain unknown. Therefore, the present study is unable to derive or recommend cutoff values for the WHO-5 to identify depression in this age group (but see the studies by Allgaier et al., 2012; Blom et al., 2012; Tittel et al., 2023 for adolescent-specific applications). Nevertheless, previous research in adults has demonstrated that the WHO-5 shows adequate sensitivity and specificity in identifying depressive symptoms (Topp et al., 2015), comparable to widely used tools like the Patient Health Questionnaire-9 (He et al., 2020) and the Beck Depression Inventory Revised (von Glischinski et al., 2019).
Implications: The WHO-5 in Applied Research
The current study indicates that the psychometric properties of the WHO-5 are robust against different cultural/language contexts, and thus, it can be applied to cross-country research on adolescent mental health/well-being. It is also worth noting that sum/mean scoring is a suitable scoring method for the WHO-5 across all countries that introduce negligible bias. This makes it a suitable measure for applied researchers and practitioners with limited psychometric knowledge. To reiterate, the WHO-5 is especially useful when the aim is to assess hedonic well-being. Compared to previous research (Cosma et al., 2022), our results do not indicate the need to remove items of the WHO-5. Instead, it can be used in its current form. To facilitate meaningful assessments and comparisons of individual or group scores, general and age-/gender-specific norm values for the WHO-5 were provided. Even if cross-county comparisons in subjective well-being may be less of interest to each participating country, the development of standards—as used for adults in the WHO-5—and hence as a screening tool for depression too, is an important next step.6po?>
Conclusion
Due to its brevity and use of non-invasive questions, the WHO-5 Well-Being Index seems to be an optimal measure to assess hedonic well-being in adolescence. The current study revealed that it exhibits a unidimensional factor structure, a high degree of cross-country MI, high reliability, and a similar nomological network across countries. The WHO-5 Well-Being Index is a psychometrically sound measure that has shown promise for cross-cultural research among adolescents in the included European and Central Asian countries. However, given the limited representation of lower-income countries and regions outside of Europe and Central Asia, further research is needed to establish its applicability and validity in more diverse cultural, geographic, and economic contexts.
Software Information
Data analysis was done in R (Version 4.3.1; R Core Team, 2024) and Mplus (v8.8; Muthén & Muthén, 1998–2017). Data transformations were done with the tidyverse (Wickham et al., 2019), car (Fox & Weisberg, 2019), labeled (Larmarange, 2024), and sjlabelled (Lüdecke, 2022) packages. Descriptive statistics were calculated with the weights (Pasek et al., 2021) and the Weighted.Desc.Stat (Parchami, 2016) packages. Dimensionality assessment was done with the EGAnet (Golino & Christensen, 2024) package. Item response analyses were done with the mirt (Chalmers, 2012) and irtQ (Lim et al., 2024) packages. The graphs were created with the ggplot2 (Wickham, 2016) and ggpubr (Kassambara, 2020) packages. The alignment analysis was done in Mplus and read in R with the package MplusAutomation (Hallquist & Wiley, 2018).
Footnotes
Acknowledgements
Health Behaviour in School-aged Children is an international study carried out in collaboration with WHO/EURO. Jo Inchley (University of Glasgow) was the International Coordinator for the 2021/22 survey. The Data Bank Manager was Professor Oddrun Samdal (University of Bergen). The 2021/22 survey included in this study was conducted by the following principal investigators in 43 countries and regions: Albania (Gentiana Qirjako), Armenia (Sergey G. Sargsyan and Marina Melkumova), Austria (Rosemarie Felder-Puig), Flemish Belgium (Bart De Clercq), French Belgium (Katia Castetbon), Bulgaria (Lidiya Vasileva), Bulgaria (Anna Alexandrova-Karamanova, Elitsa Dimitrova), Canada (William Pickett and Wendy Craig), Croatia (Ivana Pavic Simetin), Czech Republic (Michal Kalman), Denmark (Katrine Rich Madsen), England (Sabina Hulbert, Sally Kendal), Estonia (Leila Oja), Finland (Jorma Tynjälä), France (Emmanuelle Godeau), Germany (Matthias Richter), Georgia (Lela Shengelia), Greece (Anna Kokkevi, Anastasios Fotiou), Greenland (Birgit Niclasen), Hungary (Ágnes Németh), Iceland (Arsaell M. Arnarsson), Ireland (Saoirse Nic Gabhainn), Italy (Lorena Charrier, Paola Nardone), Kazakhstan (Shynar Abdrakhmanova and Valikhan Akhmetov), Kyrgyzstan (Gulat Maemerova), Latvia (Iveta Pudule), Lithuania (Kastytis Šmigelskas), Luxembourg (Carolina Catunda, Maud Moinard), Malta (Charmaine Gauci), Moldova (Galina Lesco), the Netherlands (Gonneke Stevens and Saskia van Dorsselaer), North Macedonia (Lina Kostarova Unkovska), Norway (Oddrun Samdal), Poland (Anna Dzielka, Agnieszka Malkowska-Szkutnik), Portugal (Margarida Gaspar de Matos), Romania (Adriana Baban), Scotland (Jo Inchley), Slovakia (Andrea Madarasova Geckova), Slovenia (Helena Jericek), Spain (Carmen Moreno), Sweden (Petra Lofstedt), Switzerland (Marina Delgrande-Jordan, Hervé Kuendig), Tajikistan (Sabir Kurbanov, Zohir Nabiev), Wales (Chris Roberts). For details, see ![]()
Author Contributions
Conceptualization: Philipp E. Sischka, Alina Cosma; Data curation: Philipp E. Sischka; Formal analysis: Philipp E. Sischka; Review and proofreading of syntax: Caroline Residori; Methodology: Philipp E. Sischka; Writing—original draft: Philipp E. Sischka, Alina Cosma, Nicholas Page, Christina Schnohr; Writing—review & editing: Philipp E. Sischka, Alina Cosma, Gina Martin, Caroline Residori, Nour Hammami, Nicholas Page, Christina Schnohr.
Declaration of Conflicting Interests
The author(s) declared no potential conflicts of interest with respect to the research, authorship, and/or publication of this article.
Funding
The author(s) disclosed receipt of the following financial support for the research, authorship, and/or publication of this article: Alina Cosma has received funding from the European Union’s Horizon 2020 research and innovation program under the Marie Sklodowska-Curie grant agreement no. 101028678, Project GenerationZ. The study was supported by the project “Research of Excellence on Digital Technologies and Wellbeing CZ.02.01.01/00/22_008/0004583,” which is co-financed by the European Union. Nicholas Page is supported by the Center for Development, Evaluation, Complexity and Implementation in Public Health Improvement (DECIPHer), funded by the Welsh Government through Health and Care Research Wales.