
Abstract
The Barkley Deficits in Executive Functioning Scale (BDEFS) is a multidimensional measure of executive functioning (EF). Yet, no work has validated the 20-item BDEFS short form (BDEFS-SF) among individuals at risk of EF deficits, including college students who consume alcohol. The current study evaluated the factor structure and measurement invariance of the BDEFS-SF in 867 undergraduates from 12 colleges/universities who endorsed past-month alcohol use. The bifactor model best fit the data, supporting the use of the general factor over the five subscales for measurement models, and measurement invariance was partially supported across sex assigned at birth. Four subscales were uniquely associated with alcohol use, consequences, and alcohol protective behavioral strategies. The BDEFS-SF total score appears to be a valid measure of EF among undergraduates who use alcohol; however, more research is needed to increase the clinical utility of the measure given the lack of support for the use of the subscales in measurement models.
Keywords
Executive functioning (EF) is broadly described as an integrated, multifaceted group of cognitive abilities that are critical for social, psychological, and cognitive development (Diamond, 2013). Although definitions of EF tend to differ due to its multifactorial nature, EF is generally characterized as a broad construct comprising higher-order cognitive abilities (e.g., behavioral inhibition, working memory) that facilitate goal-directed behavior (Suchy, 2009). As such, EF reflects the ability to self-regulate behavior to make choices that align with future-oriented goals. Furthermore, evidence suggests that performance-based measures and self-report ratings assess different aspects of EF or different mental constructs altogether (Toplak et al., 2013). Whereas performance-based measures appear to assess the efficiency of cognitive abilities, self-report measures appear to assess the degree of goal attainment, with evidence that scores on EF ratings are highly correlated with engagement in health behaviors, collateral reports of EF, and intelligence testing (Barkley & Murphy, 2011; McGrath et al., 2021). Given that EF continues to mature through early adulthood as the frontal cortex myelinates, corresponding with a time period when engagement in health risk behaviors, such as alcohol use, can be detrimental to health outcomes (Arnett, 2005; Gray-Burrows et al., 2019; McGrath et al., 2021), it is important to examine EF in this population using a psychometrically validated self-report measure.
The Barkley Deficits in Executive Functioning Scale (BDEFS; Barkley, 2011a) is a self-report measure of cognitive and behavioral manifestations of EF. The 20-item short form (BDEFS-SF), derived from the 89-item long form (BDEFS-LF), was developed for clinical screening and research purposes (Barkley, 2011a). Utilizing a U.S. Census-matched sample of adults 18 and over, the initial validation study of the BDEFS evidenced a five-factor model in accordance with Barkley’s (1997) conceptual model of EF (Barkley, 2011a). The five subscales include: self-management of time, self-organization and problem-solving, self-regulation of emotion, self-restraint, and self-motivation. The short form was derived by including the four highest loading items from each of the five subscales of the long form, and both the LF and SF demonstrated psychometric support with evidence of construct validity, internal consistency, and test–retest reliability (Barkley, 2011a,b). The items from the BDEFS-SF also informed a clinical interview approach, where clinicians can obtain an EF symptom count by tallying the items endorsed with a 3 (often) or 4 (very often) (Allee-Smith et al., 2013).
Psychometric studies of the BDEFS-LF have found support for the five-factor model across community samples, clinical samples (e.g., attention deficit hyperactivity disorder; Barkley & Fischer, 2011), and a small number of studies including college students (Dehili et al., 2017; Kamradt et al., 2021). Kamradt et al. (2021) also found partial measurement invariance of the BDEFS-LF across sex assigned at birth in their college student sample. Only two studies to date have evaluated the psychometric properties of the BDEFS-SF: one demonstrated support for the five-factor model as compared to a single-factor model (Lace et al., 2022); one demonstrated support for a bifactor model as compared to a five-factor and a hierarchical model (Clauss et al., 2021). Findings by Clauss et al. (2021) are important because the bifactor model potentially aligns with the recommended scoring of the short form and the conceptualization of EF where a general factor (total score) offers unique variance above and beyond EF domain subscales (Barkley, 2011a). However, Clauss et al. (2021) findings did not support the use of the domain-specific subscales. To our knowledge, no prior studies have investigated the factor structure of the BDEFS-SF in a college student sample.
There is strong empirical support that EF among college students is associated with a variety of outcomes. Prior work with the BDEFS (short and long forms) has demonstrated associations with academic performance (Knouse et al., 2014), social functioning (Hilton et al., 2024), mental health symptoms (Dehili et al., 2017; Feldman et al., 2013), and engagement in health risk behaviors (e.g., substance use; Brunelle & Flood, 2016), as well as differences in EF deficits between male and female college students (Kamradt et al., 2021). Despite different versions of the BDEFS being utilized in research with college student populations, further research is needed to evaluate the psychometric properties of the BDEFS-SF among college students who engage in health risk behaviors that can result in changes, inefficiencies, or deficits in EF.
Alcohol use is one of the most pervasive health risk behaviors among college students, with nearly 60% of students endorsing past-month use and 32% endorsing binge drinking (i.e., 5+/4+ drinks in a row for males/females) in the past 2 weeks (Patrick et al., 2022). There is substantive evidence of a reciprocal relationship between alcohol use and EF, with some studies finding that alcohol use in early adulthood is associated with both chronic and acute EF deficits (Abdulaal et al., 2023; Gustavson et al., 2017), and others finding that college students with preexisting EF deficits are more likely to binge drink and to develop alcohol use problems (Brunelle & Flood, 2016; Volkow et al., 2012). Examination of the structural validity of the BDEFS-SF with college students who use alcohol can help researchers identify the aspects of EF most related to at-risk alcohol use and set the stage for future research to identify preventive strategies for this population.
Over the last several decades, models and frameworks of alcohol use disorder (AUD) and other addictive disorders have increasingly incorporated and demonstrated empirical support for the role of cognitive processes, such as EF, in the development and maintenance of at-risk alcohol use (e.g., Bechara, 2005; Goldman et al., 1991; Kwako et al., 2016; Kwako & Koob, 2017). For example, dual process theory posits two competing systems (control system and impulsive system) that influence behavior reciprocally (Lindgren et al., 2019). In the context of alcohol use, the dual relationship is impacted because the control system is not functioning optimally due to the influence of alcohol and, at times, by other preexisting factors (e.g., history of executive deficits). In addition, dual process theory emphasizes the role of trait and state control as moderators of the impulsive system on alcohol use patterns, suggesting that prior deficits in EF (trait) may influence the trajectory of alcohol use over time. Specific to college students, research has shown that young adulthood is an important moderator of this dual relationship (Wiers et al., 2010). The Addictions Neuroclinical Assessment model is another prevailing model that elaborates on the role of EF in the development of at-risk alcohol use (Kwako & Koob, 2017).
Given the importance of prevention of health risk behaviors for college students, it is worthwhile to examine the relationship between EF and alcohol protective behavioral strategies (PBSs) among college students. Alcohol PBSs are cognitive-behavioral strategies that individuals can use before, during, or after alcohol use to prevent alcohol-related harm (Martens et al., 2011). Often included in brief motivational interventions to address risky alcohol use among college students (Treloar et al., 2015), PBS strategies may include using a designated driver, stopping drinking at a predetermined time, or avoiding mixing different types of alcohol. Thus, engaging in PBS may be reflective of self-regulatory processes (i.e., EF) with the specific goal of preventing alcohol-related harm. However, there is a dearth of research examining how EF relates to alcohol PBS (Martens et al., 2005). Given that there is marked variability in how EF is assessed in the alcohol literature (Day et al., 2015), a critical first step to understanding the relation of EF with risky/protective alcohol use variables is to test the psychometric properties of a validated EF measure (i.e., BDEFS-SF) in a sample of college students who use alcohol.
The Current Study
Building upon prior work (i.e., Clauss et al., 2021; Kamradt et al., 2021), the present study evaluated the structural validity of the BDEFS-SF in a multi-site sample of U.S.-based college students who drink alcohol. Although the research on the psychometric properties of the BDEFS-SF is limited, there is preliminary evidence that a bifactor model best fits the BDEFS-SF among adults in the community and use of the domain-specific subscales was not recommended (Clauss et al., 2021). Given the literature calling for greater attention to differences in alcohol-related consequences across sex and gender (Ruiz & Oscar-Berman, 2013) and research utilizing other measures of EF and related constructs supporting invariance across sex assigned at birth (e.g., Boyraz et al., 2019; Pagliaccio et al., 2016), we investigated measurement invariance across sex assigned at birth. One previous examination of the factor structure of the BDEFS-LF found that, despite a high degree of item-level redundancy, the five-factor solution was partially invariant across sex assigned at birth (Kamradt et al., 2021). Thus, we hypothesized that the bifactor model (vs. one-factor, five-factor, and hierarchical models) would best fit our data and that the BDEFS-SF will be invariant across sex in our sample.
In addition, previous studies with the BDEFS-LF have found significant positive associations between the BDEFS subscales/total score and at-risk alcohol use among college students (Brunelle & Flood, 2016; Conner, 2015; Langberg et al., 2014) and recommended the BDEFS as a potential screener to identify college students requiring intervention (Brunelle & Flood, 2016). Yet, the 20-item BDEFS-SF may be a more practical, efficient tool to identify at-risk students and to guide alcohol prevention efforts. To this end, and to assess criterion-related validity, we examined associations between the BDEFS-SF and alcohol-related behaviors. We hypothesized that BDEFS-SF would be positively associated with typical weekly alcohol use and alcohol use consequences (i.e., greater self-reported EF deficits would be associated with more alcohol use and greater alcohol use consequences). In addition, we sought to clarify the relation between the BDEFS and alcohol PBS to inform future work in this area by conducting exploratory analyses on these variables.
Method
Participants and Procedures
Participants were college students recruited through a multi-site collaboration of 12 colleges/universities across the United States from September 2020 to May 2021. A full description of study recruitment and procedures are detailed elsewhere (see Hurlocker et al., 2022), and study materials are available at https://osf.io/ta25n/?view_only=204ff14bb6274835a20297629776ec7e. Eligible participants included enrolled college students between 18 and 25 years of age who endorsed past-month alcohol or other substance use. To ease participant burden while maintaining data integrity, a planned missingness design was used such that participants completed measures of alcohol and substance use followed by a random selection of 10 additional measures (out of a possible 36 measures) of other health behaviors. A single site institutional review board (IRB) approach was used, and all study procedures were approved by the University of Southern Mississippi IRB. The current analytic sample included the 867 participants (Mage = 19.45, SD = 1.44) who completed the BDEFS-SF.
Participant Sociodemographics
Participants were students who primarily identified as female (n = 588; 67.8%) and were Freshmen (n = 425; 49.0%), attending college in the western/northwestern U.S. (n = 412; 47.5%). The ethnic/racial composition of the sample included non-Hispanic White (n = 554; 63.9%), African American/Black (n = 28; 3.2%), Latino/a/x (n = 80; 9.2%), Asian/Asian American (n = 17; 2.0%), American Indian/Alaska Native/Native American (n = 7; 0.8%), and Multiracial/ethnic (n = 179; 20.6%). Regarding sexual orientation, 598 participants (69.1%) rated themselves as “completely heterosexual” followed by “mostly heterosexual” (n = 150; 17.3%). On average, participants consumed 8.46 (SD = 7.97) standard drinks per week and consumed alcohol on 2.20 (SD = 1.42) days per week.
Measures
Barkley Deficits of Executive Functioning Scale-Short Form
The BDEFS-SF (Barkley & Murphy, 2011) is a 20-item self-report measure of the past 6-months EF. Respondents rate each item on a 4-point response scale ranging from (1) rarely or not at all to (4) very often and higher scores indicate greater deficits in self-reported EF. Six scores can be derived from the BDEFS-SF, including a total EF score and five theorized subscale scores: (a) self-management to time; (b) self-organization/problem-solving; (c) self-restraint; (d) self-motivation; and (e) self-regulation of emotions. Previous evidence suggests that the BDEFS-SF has good psychometric properties in a community sample of adults (Clauss et al., 2021) and that scores on the measure are positively correlated with collateral reports of EF (McGrath et al., 2021).
Alcohol Use Variables
The Daily Drinking Questionnaire (DDQ; Collins et al., 1985) was used to assess the quantity and frequency of alcohol use in a typical week within the past month. Participants indicate how many standard drinks they consume each day of a typical week. A typical weekly alcohol use score is created by summing the number of drinks reported for each day of the week. The Brief Young Adult Alcohol Consequences Questionnaire (BYAACQ; Kahler et al., 2005) was used to assess past-month frequency of alcohol-related consequences. Participants responded to the 24 items using a dichotomous response scale (0 = no/1 = yes), and a total score was created by summing responses on all items (α = .90). Finally, the Protective Behavioral Strategies Scale-20 (PBSS-20; Treloar et al., 2015) was used to assess the past-month frequency of harm reduction strategies that individuals may use before, during, or after drinking alcohol. Participants responded to the 20 items using a six-point response scale (1 = never to 6 = always) across three subscales: Stopping/Limiting Drinking (α = .89), Manner of Drinking (α = .87), and Serious Harm Reduction (α = .90) PBS.
Data Analysis
A series of factor structures were tested to identify the optimal model of the BDEFS-SF. In line with prior work (Clauss et al., 2021), we first performed confirmatory factor analyses (CFAs) of a one-factor and a five-factor structure. Hypothesizing the five-factor structure would have a superior model fit, we then tested a hierarchical CFA, such that a single higher-order factor of EF predicted the five lower-order factors of EF. This model evaluates the extent that one’s overall EF explains the five dimensions of executive functioning. Finally, we estimated a bifactor structure which allows items to load on their respective five factors as well as load on a general EF factor. All models were run using a robust weighted least squares mean and variance estimator (WLSMV). Given the chi-square statistic is sensitive to sample size (Bollen, 1989), we used several approximate fit indices, including the comparative fit index (CFI), Tucker–Lewis index (TLI), and root mean square error of approximation (RMSEA). Good (adequate) model fit is indicated with CFI or TLI scores of .95 (.90–.94) or higher and a RMSEA score of .06 (.07–.08) or lower (Chen et al., 2008; Hu & Bentler, 1999). To compare the fit of nested models, we performed chi-square difference tests and examined 90% confidence intervals (CI) of RMSEA, with nonsignificant chi-square tests and overlap of 90% RMSEA CIs suggesting models were not significant (Brown, 2015; Cheung & Rensvold, 2002; Kline, 2016). We also examined the salience of item loadings to identify the optimal model, with significant loadings of 0.20 or higher indicative of salience loadings and, thus, representing a better-defined factor (Tabachnick & Fidell, 2007).
Following recommendations by Rodriguez et al. (2016), additional examination of fit for the bifactor model included: OmegaH (i.e., proportion of variance in total score attributable to the general factor), OmegaHS (i.e., proportion of variance in specific factors after accounting for variance from general factor), explained common variance (ECV; indicator of unidimensionality and represents proportion of common variance accounted for by the general factor), item-level explained common variance (I-ECV; variance accounted for by each item that is attributable to the general factor, with values greater than .80 indicative of unidimensionality), percent of uncontaminated correlations (PUC; percent of item correlations that are contaminated due to variance from the general and specific factors, with unidimensionality indicated if PUC and ECV are greater than .70), average relative parameter bias (ARPB; average bias across item parameters forced into a unidimensional versus multidimensional structure, with less than .15 indicative of unidimensionality), factor determinacy (FD; correlation between factors and factor scores, with value greater than .90 suggesting utility of factors scores in measurement models), and construct replicability (H; extent factor is well defined by its indicators, with values greater than .80 indicative of latent variable stability).
Finally, the best-fitting model was tested for measurement invariance across sex assigned at birth using theta parameterization and titrating constraining of the model from configural (no constraints) to scalar invariance (factor loadings and thresholds held constant). Prior work supports constraining factor loadings and thresholds in a single step when using ordered categorical items (Brown, 2015; Muthen & Asparouhov, 2002; Sass, 2011), and model comparisons between configural and scalar invariance were conducted by examining changes in the CFI. Based on guidance to evaluate model fit with ordered categorical data (Sass et al., 2014), measurement invariance was considered supported if changes in CFI were less than .002 (Meade et al., 2008). To evaluate criterion-related validity of the best-fitting BDEFS-SF model, we evaluated Pearson correlation coefficients between the BDEFS-SF factors and the alcohol-related variables. We also performed a more stringent test of criterion-related validity by testing a structural model with the alcohol-related variables (i.e., alcohol use, alcohol problems, and three PBS subscales) regressed on the BDEFS-SF factors, controlling for sex assigned at birth (coded as 0 = male, 1 = female). All analyses were performed using M-plus, version 8.
Results
Global Fit Comparison
Table 1 shows the global fit values for all tested models. The one-factor model was the only model that evidenced poor model fit whereas the correlated five-factor, hierarchical, and bifactor models all evidenced good model fit. The correlated five-factor model fit the data significantly better than the one-factor model based on a significant difference test (χ2(10) = 1071.96, p < .001). Comparison between the correlated five-factor and hierarchical models revealed that the hierarchical model fit the data significantly better than the correlated five-factor model (χ2(15) = 70.16, p < .001), but there was overlap in 90% RMSEA CIs suggesting that the models did not significantly differ. Finally, the bifactor model fit the data significantly better than the hierarchical model (χ2(15) = 239.24, p < .001) and there was no overlap in 90% RMSEA CIs. Taken together, these findings suggest that the bifactor model provided the best fit with the data. Table 2 shows the factor loadings of the bifactor model. All items demonstrated significant, positive loadings on the general EF factor and their designated factors, although two items on their designated factors fell below the recommended cutoff to suggest item salience.
Fit Indices of the Different BDEFS-SF Factor Models
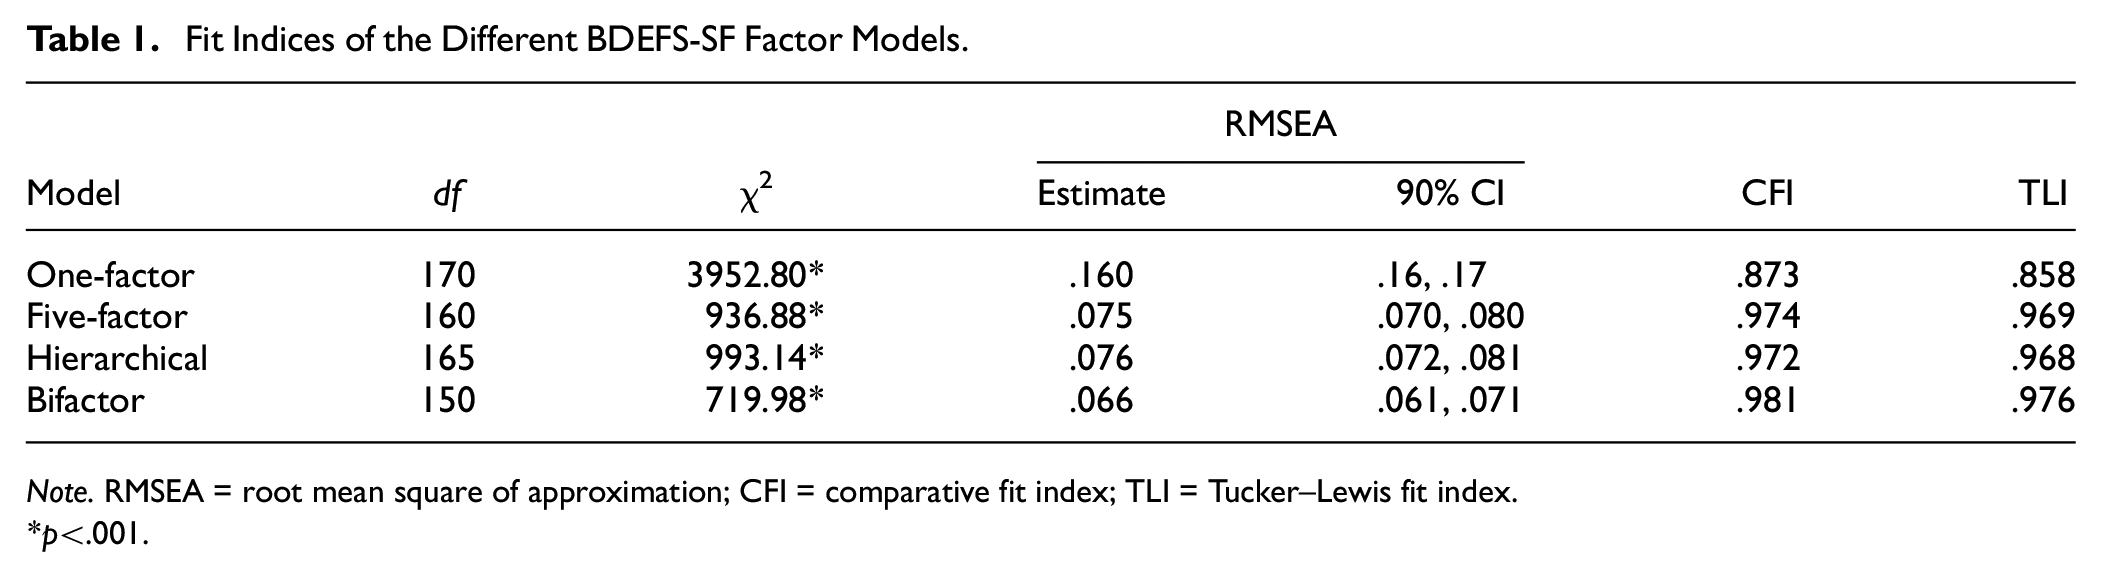
Note. RMSEA = root mean square of approximation; CFI = comparative fit index; TLI = Tucker–Lewis fit index.
p<.001
Standardized Factor Loadings of Bifactor Model
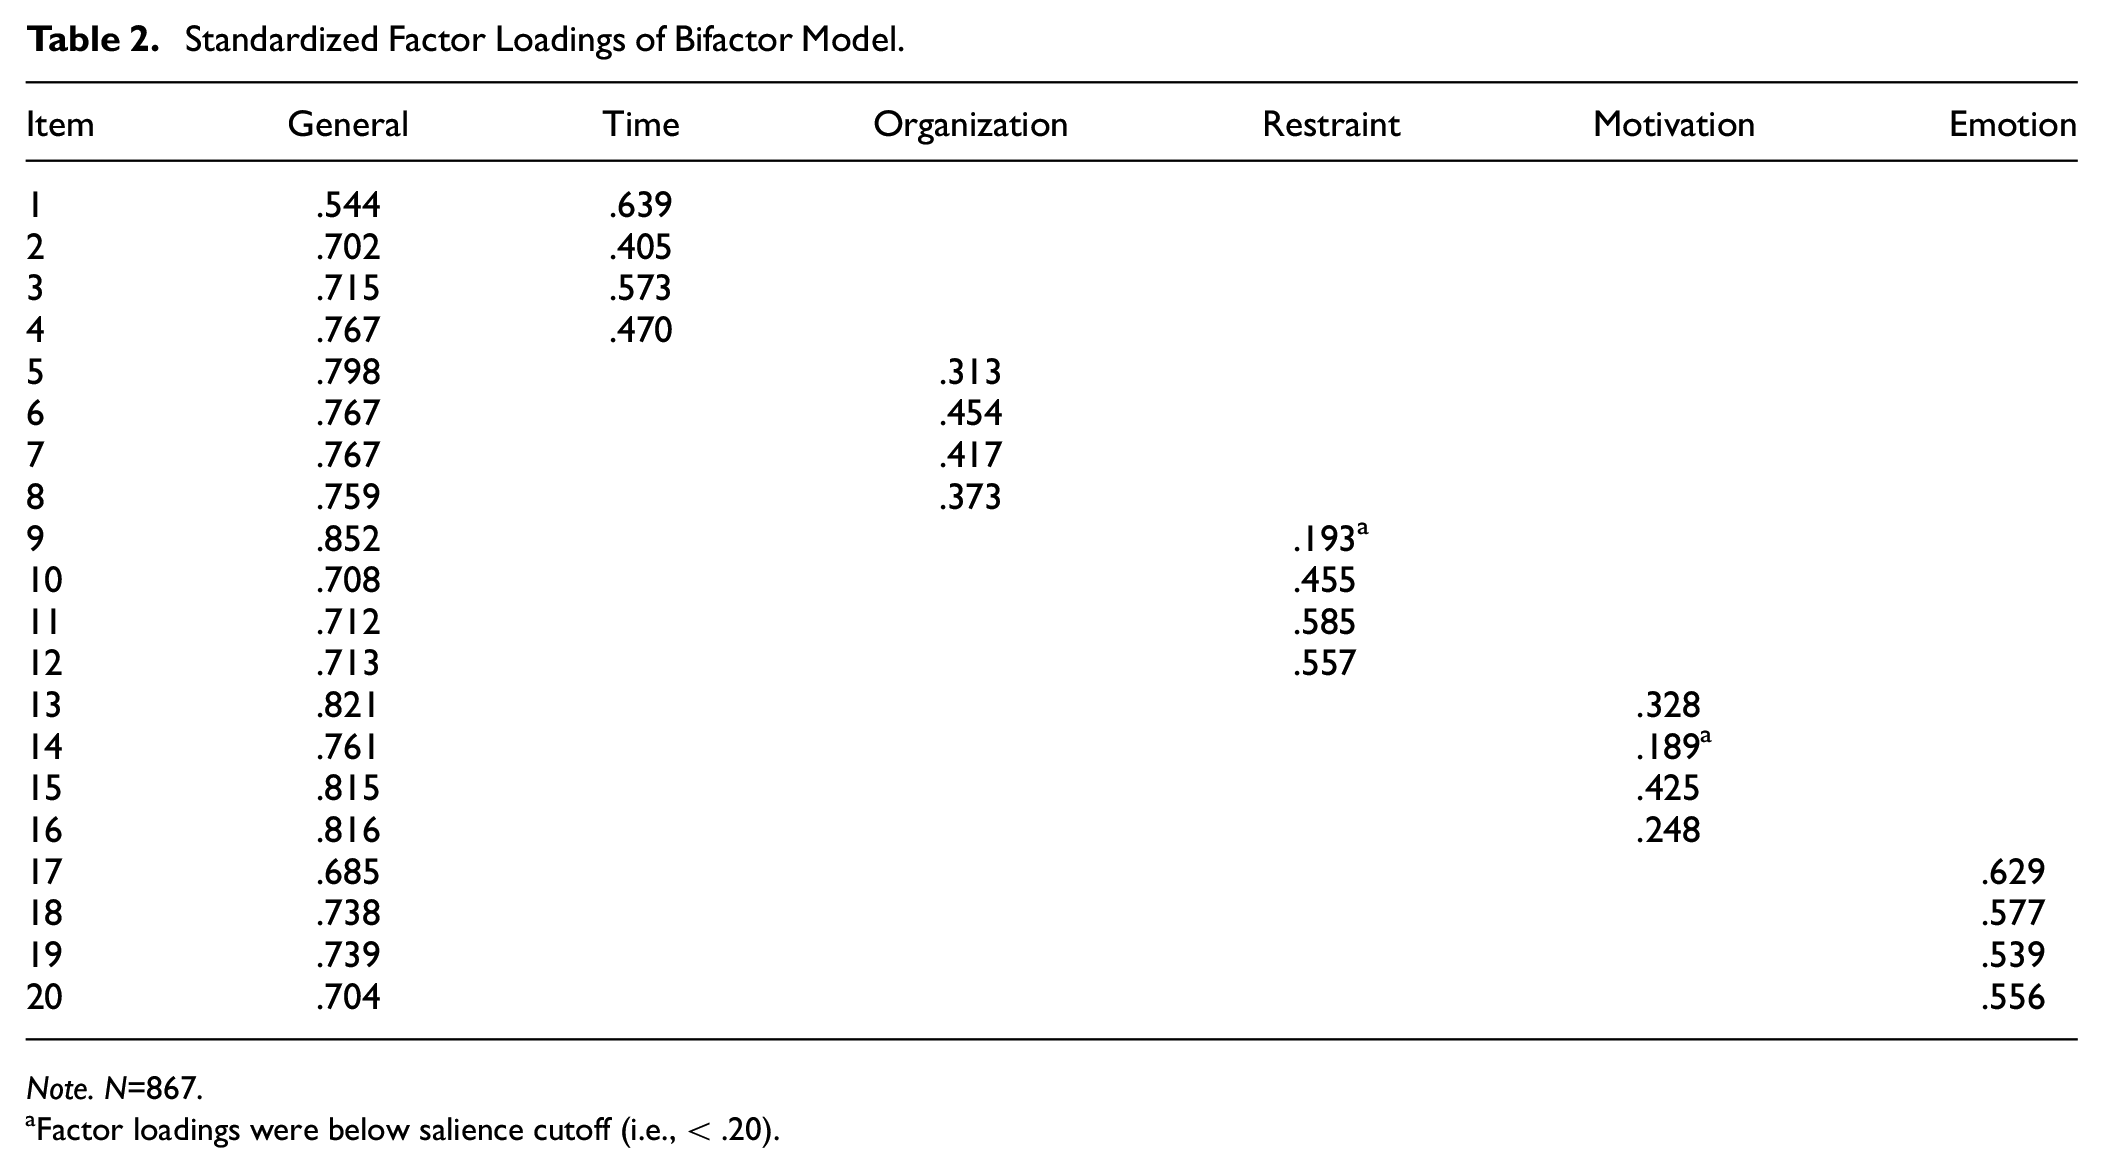
Note. N=867.
Factor loadings were below salience cutoff (i.e., < .20).
Table 3 shows the fit criteria for the bifactor model. Reliability estimates were good for the general and specific factors. However, the majority of the reliability variance was accounted for by the general factor (ωH = .913), with less variance accounted for by the specific factors (.111 < ωHSs < .375). Support for the unidimensionality of the BDEFS-SF was evident by the combined ECV value (.72) and PUC value (.842), the high ECV-I values (.420–.951), and the low ARPB value (.082). Finally, whereas FD values of the general factor (.965) and the self-regulation of emotion specific factor (.903) appeared suitable for measurement, H values suggested that only the general factor (.965) was a stable latent variable. Given the acceptable item loadings and the adequate internal consistencies of the factors, measurement invariance was tested on the BDEFS-SF using the bifactor model. As depicted in Table 4, the bifactor model demonstrated configural but not scalar invariance across male and female students. Given only partial invariance was supported, we did not examine differences between male and female students on the general and specific BDEFS-SF factors.
Evaluation Indices of Bifactor Model
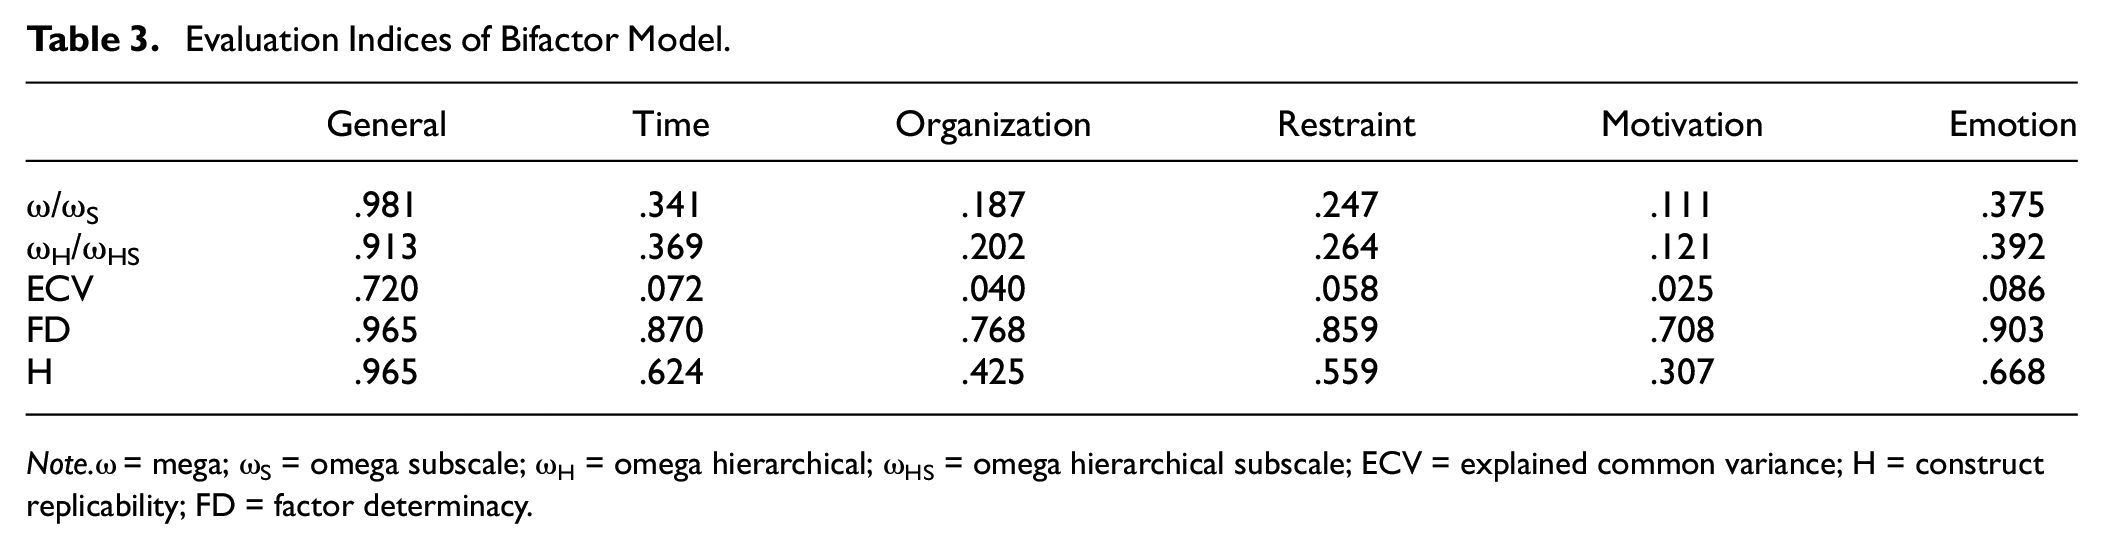
Note.ω = mega; ωS = omega subscale; ωH = omega hierarchical; ωHS = omega hierarchical subscale; ECV = explained common variance; H = construct replicability; FD = factor determinacy.
Model Fit and Measurement Invariance Results of the BDEFS-SF Across Sex Assigned at Birth
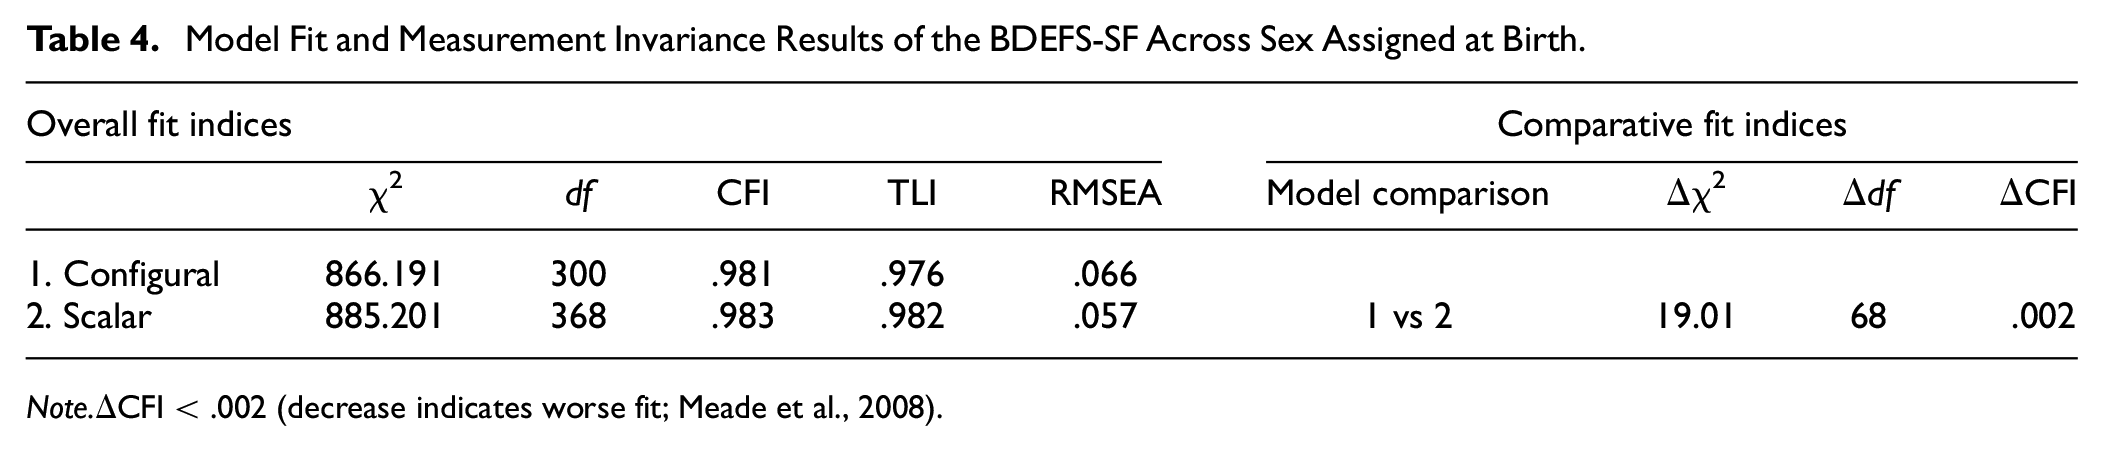
Note.ΔCFI < .002 (decrease indicates worse fit; Meade et al., 2008).
Structural Model
Table 5 presents the Pearson correlation coefficients of BDEFS-SF total scale and subscales and alcohol-related variables. The total scale and all subscales were significantly, positively correlated with alcohol-related problems, but only the BDEFS-SF self-restraint subscale was significantly, positively associated with typical weekly alcohol use. The total scale and all subscales except self-organization were significantly and negatively correlated with Stopping/Limiting Drinking and Manner of Drinking PBS, and all BDEFS-SF scales except self-management of time were significantly and negatively correlated with Serious Harm Reduction PBS. The structural model of the BDEFS-SF general and specific factors on alcohol-related variables, while accounting for weekly alcohol use and sex assigned at birth, revealed a good fit with the data (χ2(246) = 715.56, p < .001; RMSEA = .05, 90%CI [.04,.05], CFI = .99, TLI = .98). Specifically, deficits in general EF (b = .26, p < .001), self-restraint (b = .20, p < .001), self-motivation (b = .17, p < .01), and self-regulation of emotions (b = .11, p < .05) predicted more alcohol-related consequences. Furthermore, deficits in self-organization, self-restraint, self-motivation, and self-regulation of emotions predicted less Stopping/Limiting Drinking PBS (b = –.17, p < .01, b = –.12, p < .05, b = –.25, p < .01, b = –.12, p < .05, respectively) and Manner of Drinking PBS (b = –.21, p < .001, b = –.20, p < .001, b = –.25, p < .01, b = –.13, p < .05, respectively). Finally, whereas deficits in general EF predicted less Serious Harm Reduction PBS (b = –.18, p < .001), deficits in self-management of time and self-organization predicted more Serious Harm Reduction PBS (b = .20, p < .001, b = .12, p < .05, respectively).
Means, Standard Deviations, and Intercorrelations of Study Variables
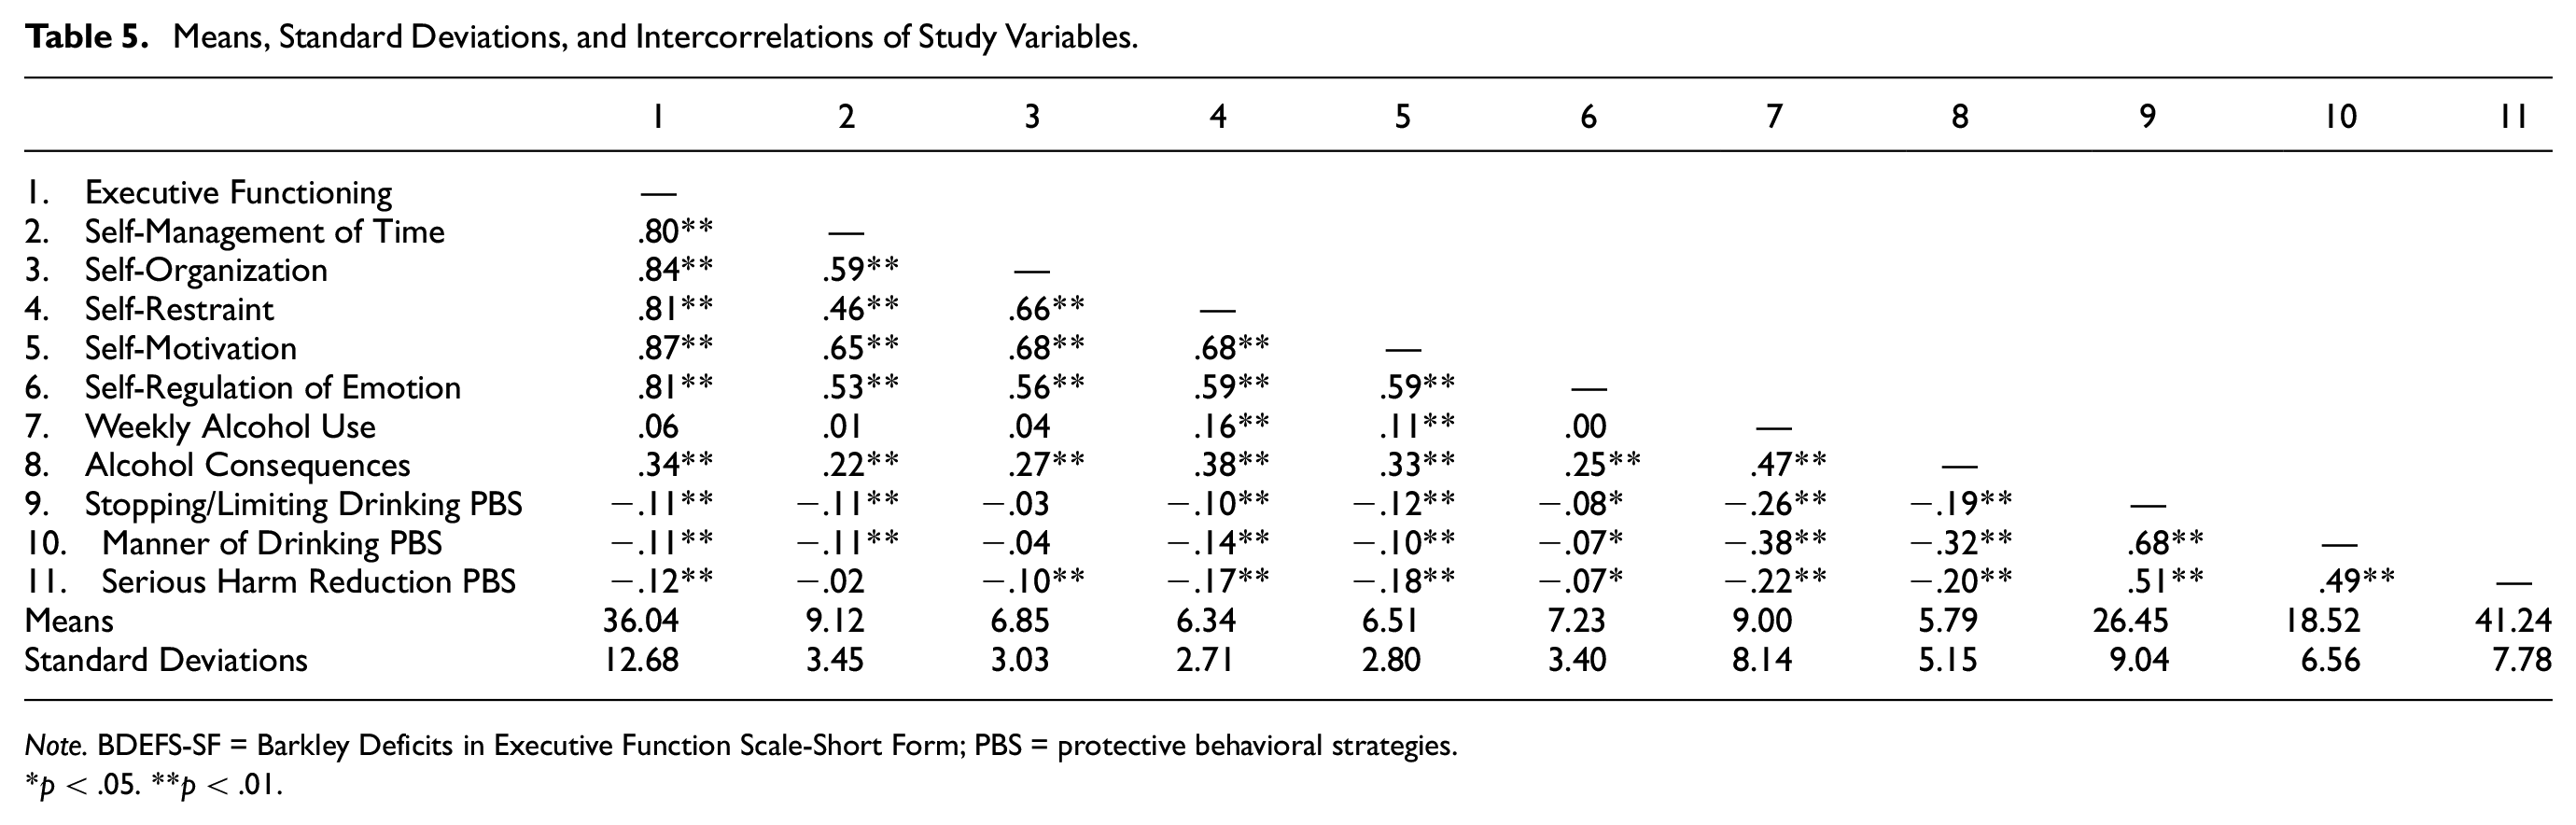
Note. BDEFS-SF = Barkley Deficits in Executive Function Scale-Short Form; PBS = protective behavioral strategies.
p < .05. **p < .01.
Discussion
The psychometric properties of the BDEFS-SF have yet to be examined in a population that reports relatively higher levels of EF deficits, such as college students who use alcohol. This represents a significant gap in the literature, given that greater EF deficits are associated with worse academic performance and increased likelihood of at-risk alcohol use, including progression to alcohol use disorder (Day et al., 2015; Nixon, 2013; Peeters et al., 2015). Consistent with the theory that EF is comprised of a general EF ability and unique sub-abilities, and with a prior examination of the BDEFS-SF factor structure with community adults (Clauss et al., 2021), the current study found support for the bifactor model of the BDEFS-SF among college students who use alcohol. This finding is consistent with the recommended scoring of the BDEFS-SF, which provides five domain-specific subscale scores as well as a total EF summary score (Barkley, 2011a). Overall, our findings offer preliminary support that the BDEFS-SF may be a viable brief screener to identify students with EF deficits who engage in at-risk alcohol use and, with more empirical work, may help identify strategies to target EF deficits in brief alcohol interventions.
Although the bifactor model was supported, examination of additional bifactor fit indices evidenced more support for the unidimensionality of the BDEFS-SF, suggesting the utility of the total score, an overall estimate of EF abilities, rather than the five domain-specific subscale scores. In addition, we found that while the self-regulation of emotion subscale is suitable for measurement, the general factor is the only score suitable for both measurement and latent variables. This is somewhat inconsistent with the only other examination of the BDEFS-SF factor structure to date that found that all the domain-specific subscale scores were inadequate for measurement and latent variables in a sample of community adults (Clauss et al., 2021). Our study extends upon this prior investigation and highlights the importance of examining the BDEFS-SF across different age groups and individuals known to engage in health risk behaviors. Specific to conducting this work across different age groups, there is support for the unidimensionality of EF at earlier stages of development that shifts to being more multifactorial across adulthood while maintaining a strong underlying EF factor (Costa et al., 2022; Karr et al., 2018). Taken together, we contend that the BDEFS-SF may be utilized in clinical practice as a brief screener of EF, much like the Patient Health Questionnaire-9 (PHQ-9) is utilized for depression in health care settings (Kroenke et al., 2001). Importantly, as outlined in Clauss et al. (2021), who also advocate for the use of the BDEFS-SF as a screener, the BDEFS manual only includes normative data for the BDEFS-SF total score. Utilizing the BDEFS-SF as a screener can inform whether it is appropriate to further assess EF and the selection of additional assessments to be administered (i.e., both self-report and/or objective measures of EF).
Distinct associations were found between the BDEFS-SF subscales and alcohol-related variables. The BDEFS-SF total score, self-restraint, self-motivation, and self-regulation of emotions subscales were all positively associated with alcohol-related consequences above and beyond the effects of other EF subscales, past-week alcohol use, and sex assigned at birth. These findings are largely consistent with prior work highlighting the unique roles of response inhibition (e.g., control system; Goudriaan et al., 2011; Kwako et al., 2016; Lindgren et al., 2019) and motivation in the initiation and maintenance of at-risk alcohol use. These findings are also consistent with the EF and alcohol literature where greater impairments in response inhibition (i.e., self-restraint, impulsivity) have been associated with alcohol-related consequences (Day et al., 2015), and EF deficits may also be a neuropsychological consequence of risky alcohol use (Fernández-Serrano et al., 2010). While also consistent with dual process theory, namely that state and trait control moderate the impulsive system (Lindgren et al., 2019), these data were cross-sectional, and more work is needed to elucidate the relationship between state control (current alcohol use impacts on EF) and trait control (preexisting deficits in EF) in this population of college students who consume alcohol. This is particularly evident given the concerns around the empirical and clinical utility of the BDEFS-SF subscales; however, general EF and self-regulation of emotions may be important to measure in research with college students who drink alcohol given the emphasis on deficits in EF and emotion regulation are central to models of addiction (Kwako et al., 2016; Votaw et al., 2020).
Findings from the current study also provide preliminary evidence for unique associations between the BDEFS-SF and PBS subscales. Specifically, more deficits in self-organization, self-restraint, and self-regulation of emotions subscales were associated with fewer Stopping/Limiting Drinking and Manner of Drinking PBS. These findings are not surprising given the executive load needed to think through and plan to engage in PBS use (e.g., greater deficits in EF have been associated with a higher likelihood of binge drinking; Brunelle & Flood, 2016). While the BDEFS-SF total score was associated with less Serious Harm Reduction PBS, the self-regulation of time and self-organization subscales were both associated with more use of Serious Harm Reduction PRB. Although surprising, there are likely other factors that buffer the impacts of executive dysfunction and predict safe drinking behaviors, such as high levels of intelligence (Milioni et al., 2017), mood and anxiety (Warren et al., 2021), and sleep (Ji et al., 2021). In addition, neither the self-regulation of time nor the self-organization subscale were supported for use in measurement or latent variable modeling in our study or Clauss et al.’s study, warranting caution in overinterpreting these findings. In other words, these findings further support the use of the BDEFS-SF total score only, given the inconsistencies in findings when using BDEFS-SF subscales. Future work should examine how other factors, like preexisting EF deficits, drinking motives, and drinking context, influence risky and safe drinking behavior among students with deficits in EF.
Limitations
Our study is not without limitations. First, these data were cross-sectional, limiting our ability to expand on causality and attend to the stability of EF over time, which would be best explored using longitudinal, experimental designs. In addition, we did not include potential sources of premorbid executive dysfunction as covariates (i.e., attention-deficit/hyperactivity disorder [ADHD], learning disability, depression, post-traumatic stress disorder [PTSD], head injury, and sleep disturbance), as the planned missingness design resulted in not all participants completing the supplemental measures that may be associated with self-reported EF. Our sample was predominantly non-Latinx White (63.9%) or multiracial or multiethnic (20.6%) and from 4-year colleges/universities, thus limiting generalizability to other racially/ethnically student populations, and those attending two-year colleges who may engage in different alcohol use patterns. Similarly, these findings warrant replication in an adult sample of alcohol users and samples of individuals along the spectrum of alcohol use (low, medium, high, and very high-risk levels of drinking). In addition, the sample size was not large enough to test for measurement invariance of the BDEFS-SF across other social identities (i.e., race, ethnicity, gender, and sexual orientation) that are disparately impacted by minority stress and associated cognitive functioning and health behaviors (Patel et al., 2022). Our sample precluded the ability to test for the validity of self-reported EF with other EF self-report measures, objective measures of EF, and/or collateral reports of EF. Relatedly, future work on the BDEFS-SF as a clinical screener should include sensitivity and specificity analyses to determine proper cutoff scores to detect clinically significant EF deficits. These data were also collected during the COVID-19 pandemic, a time when the academic environment changed substantively to respond to stay-at-home guidelines, and research during this time has supported a significant impact on the health behaviors of those with greater preexisting EF deficits (Appelhans et al., 2021). Thus, it is possible that self-reported EF within the COVID-19 lockdown may represent a unique context, and replication of our findings post-pandemic is warranted.
Conclusions
The BDEFS-SF is a valid and reliable measure of EF in college students who use alcohol. Brief screening tools of EF may be useful to identify college students experiencing consequences from at-risk alcohol use (i.e., EF deficits, alcohol-related consequences) and to inform later prevention and/or intervention strategies. Our findings represent a preliminary step to identifying college students experiencing EF deficits who may benefit from brief alcohol interventions. To our knowledge, this is the first study to test the psychometric properties of the BDEFS-SF in a sample of individuals who endorse alcohol use; given the emphasis on executive dysfunction as a major component in the etiology and maintenance of alcohol use disorder (i.e., ANA framework; Kwako et al., 2016), more work is needed to identify how this model can apply to prevention. Importantly, assessment of EF for young adults who are in college may be an important ability to monitor as a part of routine health and mental health care during this critical age period where individuals are still experiencing brain growth, and some of whom might be engaging in at-risk alcohol use.
Footnotes
Declaration of Conflicting Interests
The author(s) declared no potential conflicts of interest with respect to the research, authorship, and/or publication of this article.
Funding
The author(s) disclosed receipt of the following financial support for the research, authorship, and/or publication of this article: Our work was funded by the National Institute of Alcohol Abuse and Alcoholism, T32AA018108 (PI: Witkiewitz) and the National Institute on Drug Abuse, K23DA052646 (PI: Hurlocker).