
Abstract
Psychometric and normative information is provided for the Child and Adolescent Behavior Inventory (CABI) cognitive disengagement syndrome, anxiety, depression, attention-deficit/hyperactivity disorder (ADHD)-inattention, ADHD-hyperactivity/impulsivity, oppositional defiant disorder, social impairment, peer rejection, withdrawal from peer interactions, and academic impairment scales with a nationally representative sample of Spanish youth. Parents of 5,525 Spanish youth (ages 5–16, 56.1% males) completed the CABI scales on their sons and daughters. Scores on the 10 CABI scales demonstrated excellent reliability, invariance, and validity for males and females within early childhood (ages 5–8), middle childhood (ages 9–12), and adolescence (ages 13–16). Normative information (T-scores) is provided for females and males within each age group for the 10 CABI scales. The new psychometric and normative information increase the usefulness of the CABI scale scores for research and clinical activities. Copies of the CABI and the norms are available at no cost to professionals.
The Child and Adolescent Behavior Inventory (CABI), formerly the Child and Adolescent Disruptive Behavior Inventory (CADBI), is a parent and teacher rating scale of psychopathology and functional impairment in children and adolescents (Burns et al., 1997–2021a, 1997–2021b). The main difference between the last version of the CADBI (Burns et al., 2017) and the most current CABI is the inclusion of a larger number of cognitive disengagement syndrome (CDS) symptoms (an increase from 8 to 15 symptoms) and additional impairment scales. Supplemental Table S1 lists the reliability and validity studies on the CABI and CADBI scale scores from 1997 to the present by country of the study.
The current version of the scale measures parent and teacher perceptions of CDS, anxiety (symptoms specific to Diagnostic and Statistical Manual of Mental Disorders [DSM]-5 anxiety disorders), depression (negative mood, hopelessness, loneliness, worthlessness, and anhedonia), DSM-5 attention-deficit/hyperactivity disorder (ADHD)-inattention (IN), DSM-5 ADHD-hyperactivity/impulsivity (HI), DSM-5 oppositional defiant disorder (ODD), DSM-5 limited prosocial emotions specifier, social impairment, peer rejection, withdrawal from peer interactions, and academic impairment. Supplemental Tables S2 and S3 show the wording of the items on the English and Spanish versions of the CABI, respectively. 1
Certain features of the CABI make it unique relative to other rating scales (Burns & Becker, 2022; Burns et al., 2021; Burns, Preszler, & Becker, 2022). First, clinical expertise was used to increase the content validity of the wording of the symptoms and the instructions (see, e.g., the instructions for the rating of the ADHD symptoms). Second, a 6-point rating scale with behavioral definitions of each anchor is used to quantify the occurrence of the symptoms for the past month. Most other parent and teacher rating scales use anchors with no behavioral definitions (e.g., never or rarely, sometimes, often, and very often), thus allowing each parent or teacher to define each anchor uniquely. Third, the CABI includes a broad range of internalizing and externalizing symptom dimensions as well as four impairment dimensions. Fourth, even though the scale covers a range of symptom and impairment dimensions, less than 10 minutes are required to complete the scale. Fifth, parent and teacher ratings are both based on the past 1 month, thus allowing meaningful comparisons across parent and teacher ratings. Sixth, because each CABI scale is a separate module, clinicians and researchers are able to select the specific scales relevant to their goals (see e.g., Becker, Dunn, et al., 2024; Becker et al., 2020). Seventh, the CABI was designed to be used with youth from kindergarten to 12th grade, thus covering a wide age range with the same items. And eighth, the CABI is available for free (including numerous translations), thus making it a cost-effective measure.
Although research supports the reliability, invariance, and validity of CABI scale scores with youth from Brazil, Chile, Iran, South Korea, Spain, Turkey, and the United States (Table S1), only one study has provided national norms for the CABI scale scores. This study involved a nationally representative sample of 2,056 U.S. children from kindergarten to sixth grade rated by their mothers (Burns, Preszler, & Becker, 2022). There is thus a need for additional studies with nationally representative samples of youth from other countries.
Objectives
Parent ratings of a nationally representative sample of 5,525 Spanish youth were used to address two objectives. The first objective evaluated the psychometric properties of CABI scale scores for males and females separately within early childhood (ages 5–8), middle childhood (ages 9–12), and adolescence (ages 13–16). 2 The second objective was to provide normative information (T-scores) for the CABI scales for males and females separately within the three age groups. We now note the psychometric information used to evaluate the scores on each of the CABI scales as well as the importance of normative information for the scales.
Reliability of CABI Scale Scores
With one exception, the scores for each scale were expected to contain a high level of true score variance (Burns et al., 2021; Burns, Preszler, & Becker, 2022). Scores on the anxiety scale were expected to contain less true score because five of the six anxiety items represent different anxiety disorders (Burns, Geiser, et al., 2022).
Unidimensionality of CABI Scale Scores
It is important to know if the scores on a scale reflect a unidimensional or multidimensional construct. This issue is important given the goal to understand the associations among constructs on a scale as well as the associations of the scale’s constructs with other external correlates (e.g., the nomological validity network). Each of the CABI scales was expected to provide a unidimensional measure of its specific latent dimension (Burns et al., 2021; Burns, Preszler, & Becker, 2022). The one exception was the CABI CDS scale. The CDS scores were expected to be multidimensional due to the three conceptual dimensions within this scale (daydreaming, mental confusion, and hypoactivity; see Table 2 in the work of Becker et al., 2023).
Invariance of CABI Scale Scores Across Sex Within Age Groups
It is also important to know if the items on the CABI scales function in the same manner across males and females within early childhood, middle childhood, and adolescence. Invariance of like-item loadings and like-item thresholds establishes equality of scale units and a common zero point (i.e., no differential item functioning across sex within the age groups), thus allowing a meaningful comparison of males and females on the latent dimension (Brown, 2015). It was expected that most of the items on each scale would demonstrate invariance of like-item loadings and thresholds across females and males within each age group (Başay et al., 2021; Burns et al., 2021; Burns, Preszler, & Becker, 2022). It was also expected that the factor means on each scale would not differ significantly, or if significant, effect sizes would be trivial to small.
Usefulness of CABI Scale Scores for Screening
For CABI scale scores to be useful for screening purposes, the scale scores need to provide a high level of information and precision approximately 1.50 standard deviations about the scale score means (scores of 1.50 standard deviations above the mean are often used for screening purposes in clinical psychology, psychiatry, and allied disciplines). CABI scale scores were expected to provide a high level of information and precision from slightly below the mean to approximately 2.00 standard deviations above the mean (Burns et al., 2021; Burns, Preszler, & Becker, 2022), thus indicating the usefulness of the symptom scores for screening purposes.
Criterion Validity of CABI Scale Scores With Mental Disorder Diagnoses
CABI scale scores need to correlate with other variables in a theoretically consistent manner, especially variables external to the scales. One such variable includes history of mental disorder diagnoses. We thus determined the association of a history of ADHD, oppositional defiant disorder/conduct disorder, anxiety, depression, bipolar disorder, autism/autism spectrum disorder, language delay, learning disorders, and intellectual disability diagnoses with each CABI scale. It was expected that the diagnoses would have their strongest association with the CABI scale most relevant to the diagnosis (e.g., a depression diagnosis with CABI depression scale, Burns, Preszler, & Becker, 2022). For diagnoses with no corresponding CABI scale (bipolar disorder, autism/autism spectrum disorder, language delay, learning disorders, and intellectual disability), it was expected that these diagnoses would have their strongest associations with CABI impairment scales (social impairment, peer rejection, peer withdrawal, and academic impairment). This pattern of associations would provide additional support for the criterion validity of CABI scale scores. 3
Normative Information on CABI Scale Scores
Normative information (T-scores) is provided for the CABI scales for males and females separately within each of the three age groups. This information allows clinicians to use the scale scores for screening purposes within clinical assessments (e.g., T-scores 65 or higher being used to guide further assessment). This information also allows researchers to determine the number of youths with scores in the clinical range in their research as well as if treatment moves scores out of the clinical range. And, since the CABI and the norms are available for no cost, the scale and the norms can be used as part of a cost-effective screening procedure by clinicians and researchers.
Summary
The study reports the psychometric properties and the normative information on CABI scale scores for males and females separately within early childhood, middle childhood, and adolescence. The “Results” section provides a brief presentation of this information with the Supplemental Tables and Figures providing the specific information that individuals will hopefully find useful for research and clinical activities.
Methods
Participants and Procedures
The survey company Qualtrics was used to obtain a nationally representative sample of Spanish children and adolescents from ages 5 to 16 with a minimum of 450 children/adolescents for each age. The information was collected via the internet from standing panels maintained by Qualtrics (www.qualtrics.com). Qualtrics used various algorithms to detect random responding, bots, and duplicate respondents (www.qualtrics.com/support/survey-platform/survey-module/survey-checker/fraud-detection). Qualtrics also used procedures to confirm the identity and demographic characteristics of participants. The parent provided informed consent for the study. The participants were the mothers (mother, stepmother, or female guardian, 55.08%) and fathers (father, stepfather, or male guardian, 44.92%) of 5,525 youth. The percent of the sample in the four sex of rater/sex of youth combinations were: (a) mothers/males = 25%, (b) mothers/females = 30%, (c) fathers/males = 31%, and (d) fathers/females = 14%. The average age of the mothers and fathers were 40.03 (SD = 7.40) and 41.69 (SD = 7.99), respectively, with the average age of the female and male youth being 10.45 (SD = 3.41) and 10.58 (SD = 3.41), respectively. 4
Table 1 shows the sample characteristics. A one sample z test for a proportion showed that 18 of the 19 comparisons between the sample percentage and population percentage for the 19 regions of Spain did not differ significantly (ps > .05). Our sample value for the Community of Madrid (20%), however, was significantly (p < .001) larger than the population value for the Community of Madrid (14%). The percentage of families from the 19 autonomous regions thus closely matched the percentage of the Spanish population from the regions (National Statistics Institute of Spain, 2021b). The educational level of the raters in our sample were 22.75%, 30.95%, and 46.30% for primary/secondary, vocational, and university degrees, respectively. The values for the Spanish population for age 25 to 54 were approximately 32%, 23%, and 45% for primary/secondary, vocational, and university degrees, respectively (National Statistics Institute of Spain, 2021a). Although our sample percentage for university degrees did not differ from the population percentage for university degrees (p > .05), our sample had a smaller percentage of individuals in the primary/secondary category and larger percentage of individuals in the vocational training category than the population percentages (ps < .001). The research protocol was approved by the Institutional Review Board of the University of the Balearic Islands.
Characteristics of Families in Sample (National Percentage If Available)
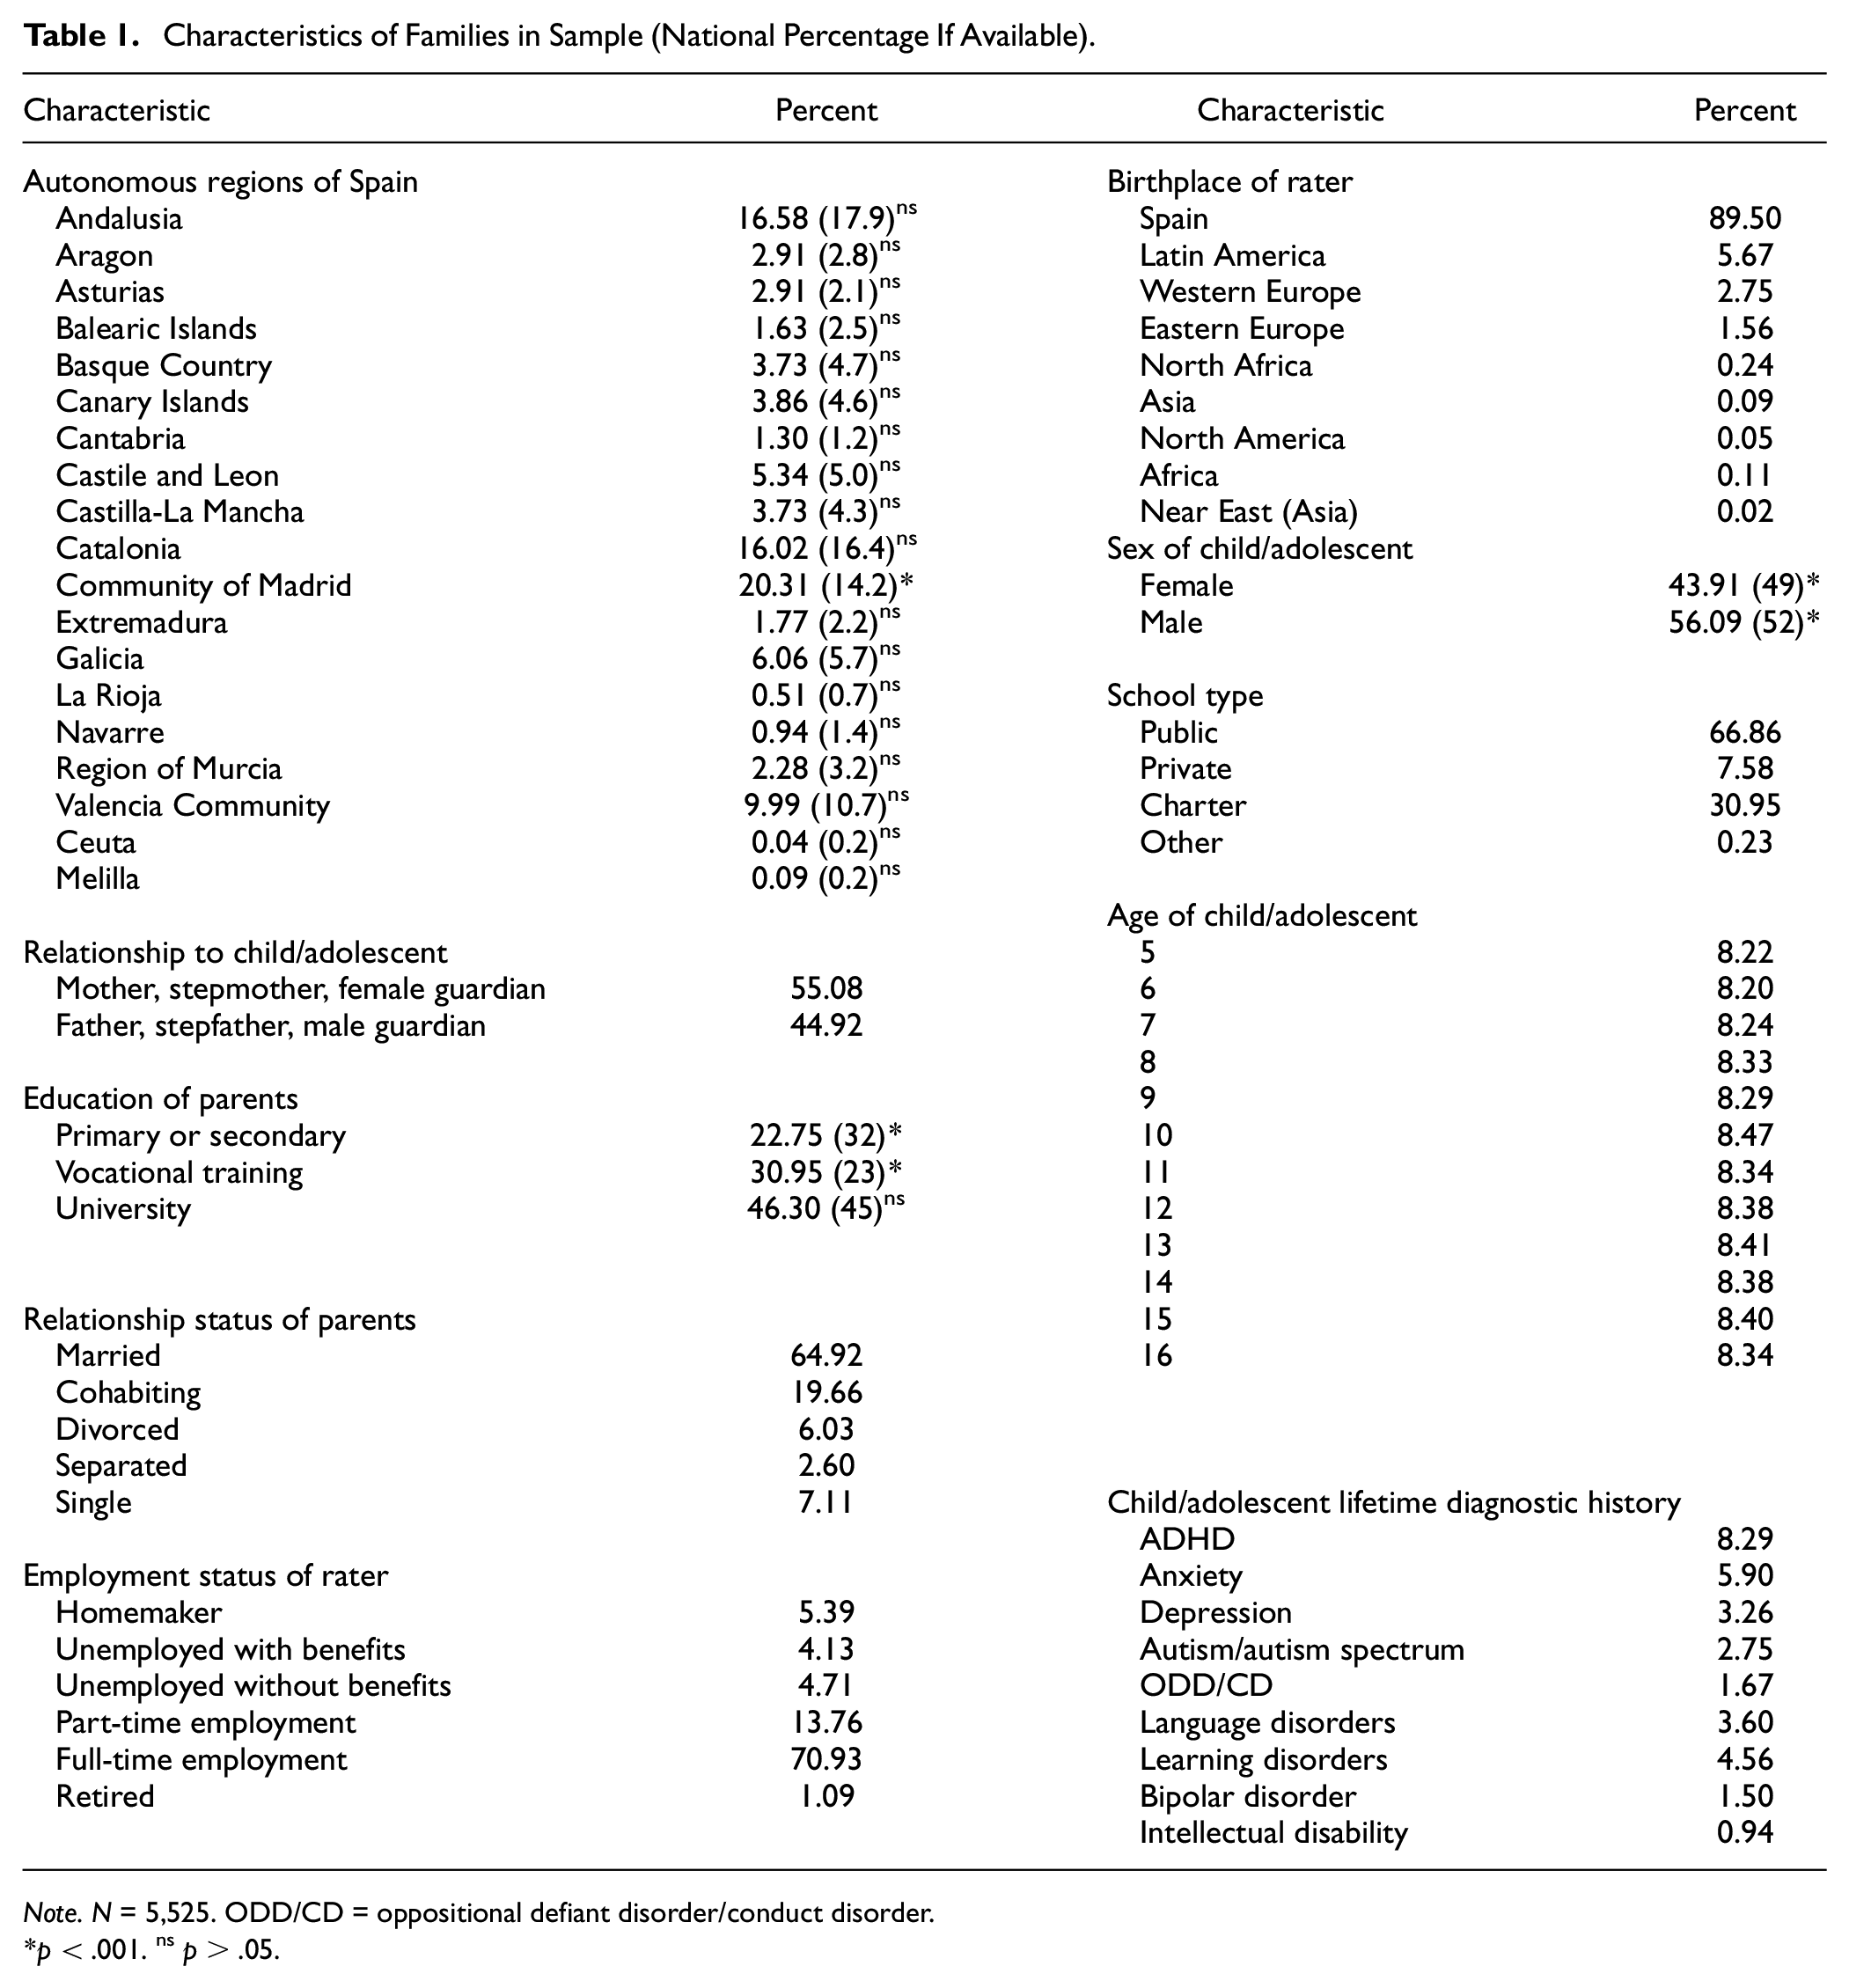
Note. N = 5,525. ODD/CD = oppositional defiant disorder/conduct disorder.
p < .001. nsp > .05.
Measures
Child and Adolescent Behavior Inventory 2.0
The CABI 2.0 measures CDS (15 symptoms), anxiety (six symptoms), depression (six symptoms), ADHD-IN (nine symptoms), ADHD-HI (nine symptoms), ODD (eight symptoms), social impairment (five items), peer rejection (four items), social withdrawal from peer interactions (five items), and academic impairment (five items; Burns et al., 1997–2021a). The CABI limited prosocial emotions scale was not available for this study. Individuals with previous experiences in the translation of rating scales from English to Spanish translated the CABI into Spanish (Sáez et al., 2019). These individuals had advanced degrees in clinical child psychology along with many years of research and clinical experiences with children and adolescents. Supplemental Tables S2 and S3 show the English and Spanish CABI scale items, respectively.
Symptoms were rated with 6-point anchors for the past month (0 = almost never [never or about once per month], 1 = seldom [about once per week], 2 = sometimes [several times per week], 3 = often [about once per day], 4 = very often [several times per day], and 5 = almost always [many times per day]). Social and academic impairment items were rated with 4-point anchors (0 = no difficulty, 1 = slight difficulty, 2 = moderate difficulty, and 3 = severe difficulty). Peer rejection and social withdrawal from peer interactions items were rated with 5-point anchors (0 = not at all, 1 = seldom, 2 = sometimes, 3 = often, and 4 = very often).
Earlier studies support the factor structure, reliability (internal consistency, test–retest, and interrater), invariance, and validity of CABI scale scores from Spain (Burns et al., 2021; Burns, Geiser, et al., 2022; Burns, Preszler, Ahnach, et al., 2022). Other studies from Brazil, Iran, South Korea, Turkey, and the United States also support the psychometric properties of CABI scale scores (Başay et al., 2021; Becker et al., 2020; Belinati et al., 2024; Burns & Becker, 2022; Burns, Preszler, & Becker, 2022; Jung et al., 2021; Sadeghi-Bahmani et al., 2022). Reliability coefficients (omega for categorical indicators, Flora, 2020) for CABI scale scores for the total sample as well as for males and females separately within early childhood, middle childhood, and adolescence for this nationally representative sample are presented in the “Results” section. There was no missing information on any of the CABI scales.
Youth Diagnostic History
After the completion of the CABI, parents were asked if a professional had ever diagnosed (yes/no) their child or adolescent with a mental disorder from a list of disorders (ADHD, any anxiety disorder, any depressive disorder, bipolar disorder, autism/autism spectrum disorder, oppositional defiant/conduct disorder, language disorders, learning disorders, and intellectual disability).
Analytic Strategy
Statistical Software for Analyses
The R statistical software was used to determine the reliability coefficients for the CABI scale scores (omega for categorical indicators, see Flora, 2020, for the R code). The Mplus statistical software was used to perform the factor and invariance analyses (version 8.10, robust weighted least squares estimator [WLSMV]). The Stata statistical software was used to obtain the test information functions from the graded response item response theory model (version 16.0, robust maximum likelihood estimator [MLR]). Stata was used to obtain the plots of the test information functions rather than Mplus because the plots are more publication quality with the Stata software. All these analyses treated the CABI items as categorical indicators.
The Mplus statistical software was used to determine the first-order (Pearson) correlations among the CABI scale scores as manifest variables. The Mplus statistical software was also used to determine Cohen’s d values for the association between the mental disorder diagnostic category (e.g., absence/presence of a history positive for an ADHD diagnosis) and CABI mean scale scores (i.e., each CABI scale was regressed on each diagnostic category). These analyses treated mean scale scores as approximately continuous indicators and used the MLR. The SPSS statistical software (version 29) was used to calculate the normative information (T-scores) for the CABI scale scores.
We now provide more specific information on the analyses used to evaluate the unidimensionality and invariance of CABI scale scores and the analyses used to obtain the test information functions. Alpha level was set at p < .001 for all significance tests given the large size of the sample.
Evaluation of CABI Scale Scores for Unidimensionality
The scores on each CABI scale were evaluated for unidimensionality separately for males and females within the three age groups (i.e., 30 one-factor confirmatory factor analysis [CFA] models for males [10 within each age group] and 30 one-factor CFA models for females [10 within each age group]). Global model fit was evaluated with the comparative fit index (CFI: acceptable fit ≥ .90 and close fit ≥ .95) and the standardized root mean square residual (SRMR: acceptable fit ≤ .08, close fit ≤ .05) (Little, 2024). Local ill-fit (local independence) was evaluated with the correlational residual matrix for each analysis (correlational residuals greater than an absolute .10 were used to suggest local ill-fit, Kline, 2023).
Evaluation of the Invariance of CABI Scale Scores Across Sex Within Age Groups
An invariance analysis was performed on each CABI scale across males and females within each age group (10 invariance analyses for early childhood, 10 invariance analyses for middle childhood, and 10 invariance analyses for adolescence). The Mplus difftest was used to determine if the model with constraints on like-item loadings and like-item thresholds resulted in a significant (p < .001) decrement in fit relative to the model without the constraints. If a significant decrement in fit occurred, then the modification indices were inspected to determine the item with the strongest contribution to the lack of invariance. The constraints on the loadings and thresholds on this item were then released and then the model re-evaluated for partial measurement invariance until the Mplus difftest yielded a non-significant decrement in fit (p > .001). The invariance analyses also allowed us to compare the factor means (latent d values) for each CABI scale across females and males within each age group. 5
Evaluation of CABI Scale Scores for Screening Purposes
The graded response item response theory model was used to obtain the test information functions CABI scale scores for males and females separately within each age group (i.e., 30 test information function for males [10 within each age group] and 30 test information functions for females [10 within each age group]). These information functions indicate the information and precision of the CABI scale scores along the trait dimension. For screening purposes, it was important for the scale scores to provide a high level of information and precision approximately 1.50 standard deviations above the mean.
Results
Descriptive Information
Table 2 shows the correlations, reliability coefficients (omega for categorical indicators), means, and standard deviations for the CABI scale scores for the total sample. The scores from each of the scales showed excellent reliability (omega values from .89 to .95 with most around .94). All the correlations among the scales were less than .75 with most much lower, thus providing support for the discriminant validity of scores for the CABI scales (Brown, 2015, p. 116). Although these correlations are inflated to a certain degree because of the use of a single source, other studies with the CABI scales have demonstrated strong convergent and discriminant validity with small source effects for two sources within the same setting (Burns et al., 2014; Burns, Geiser et al., 2022; Litson et al., 2018; Preszler et al., 2017; Preszler et al., 2019; Seijas et al., 2019).
Correlations (SEs) Among CABI Scale Scores, Reliability Coefficients, Means, and Standard Deviations for Total Sample.
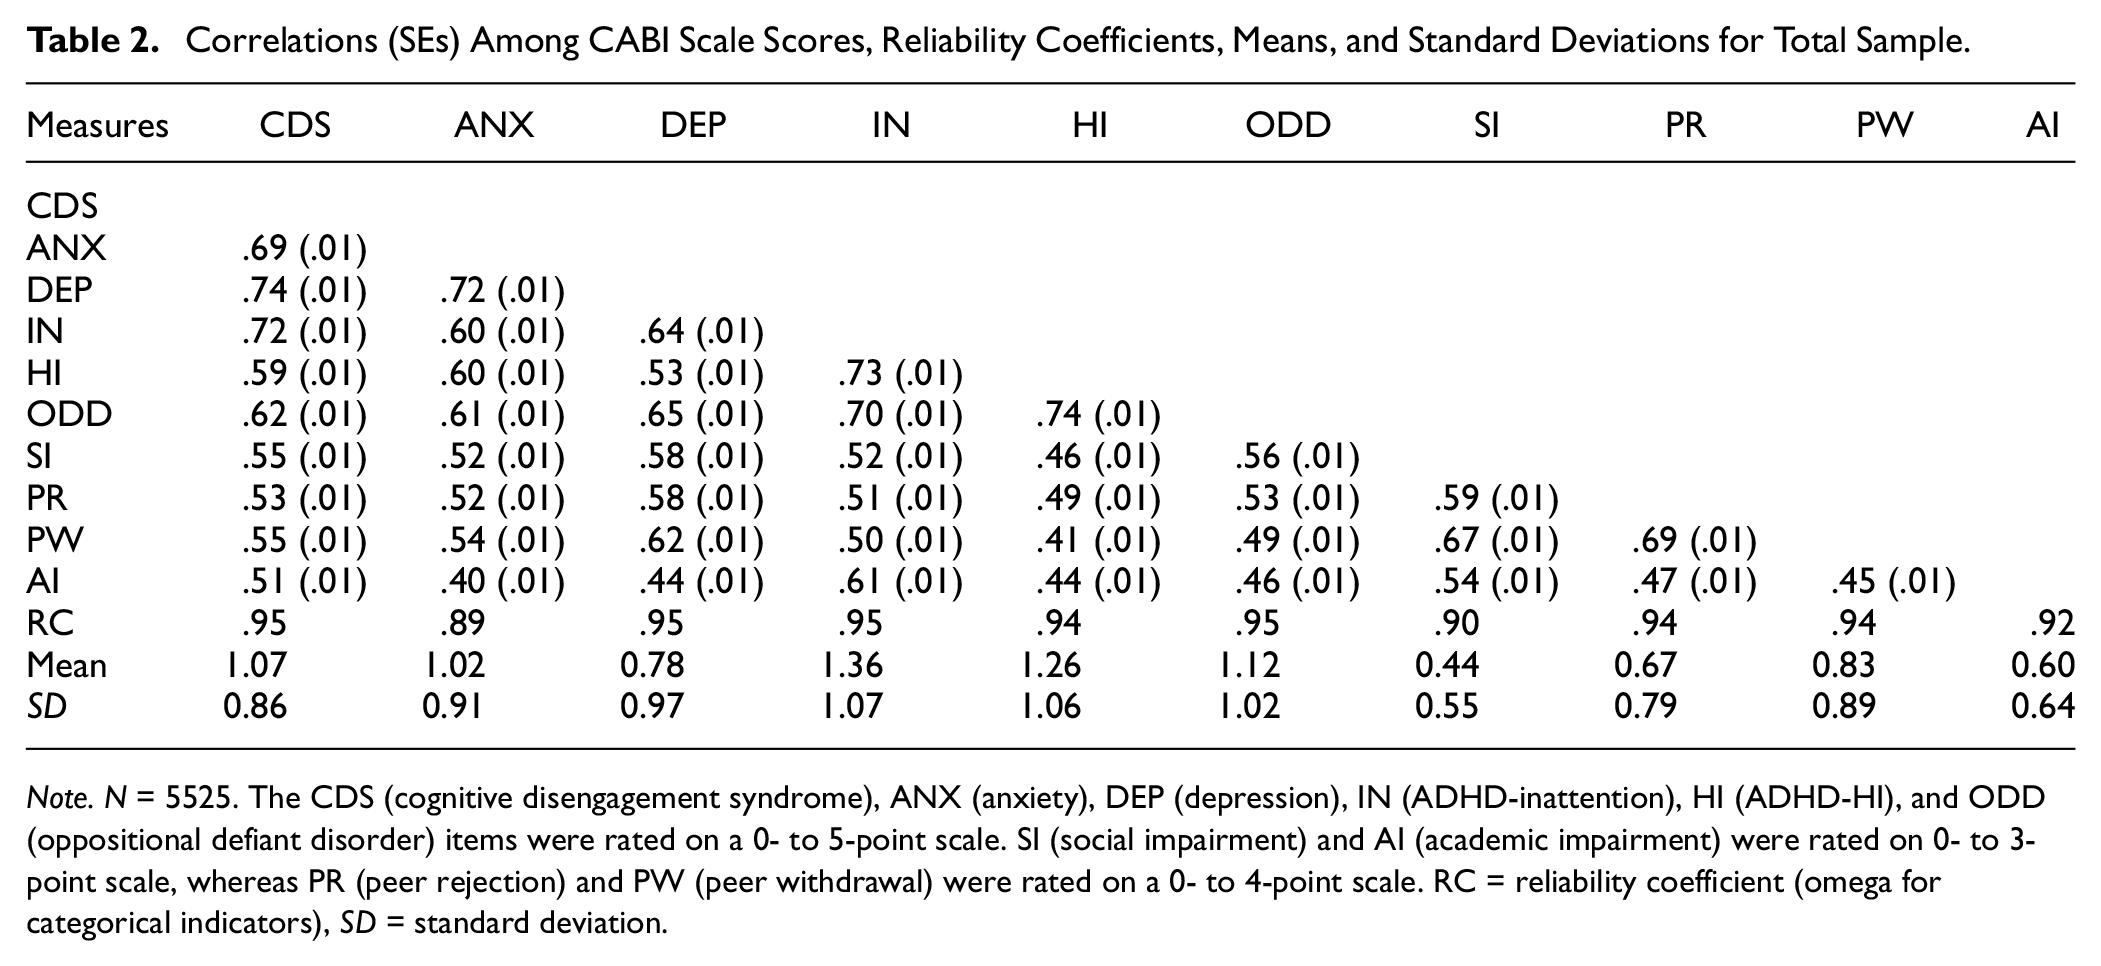
Note. N = 5525. The CDS (cognitive disengagement syndrome), ANX (anxiety), DEP (depression), IN (ADHD-inattention), HI (ADHD-HI), and ODD (oppositional defiant disorder) items were rated on a 0- to 5-point scale. SI (social impairment) and AI (academic impairment) were rated on 0- to 3-point scale, whereas PR (peer rejection) and PW (peer withdrawal) were rated on a 0- to 4-point scale. RC = reliability coefficient (omega for categorical indicators), SD = standard deviation.
Supplemental Tables S4–S9 provide this same information for the 10 scales for males and females separately for early childhood, middle childhood, and adolescence. The results for males and females separately within the three age groups were similar to the findings for the total sample.
Unidimensionality of CABI Scale Scores
Males
Supplemental Table S10 shows the global model fit results for each of the 10 CABI scales for males within the three age groups. Twenty-seven of the 30 CFAs resulted in close fit (CFIs ≥ .95 and SRMRs < .05) with either no local-ill fit (22 analyses) or minor local ill-fit (i.e., one to four correlated residuals slightly larger than an absolute .10, range = .11–.15). The three analyses for the CDS scale yielded an acceptable fit (CFIs ≥ .92 and SRMRs ≤ .06). As expected, the CDS scale showed the most ill-fit due to the three conceptual dimensions within this scale (approximately 20 of the 105 correlated residuals for each of the three analyses were larger than an absolute .10, range = .11–22, with most less than .15). Even with the possibility of 3weak CDS sub-factors, our recommendation is that the total CDS score be used at this time for research and clinical purposes (Becker et al., 2023; Hoyle et al., 2023).
Females
Supplemental Table S11 shows the global model fit results for each of the 10 CABI scales for females within the three age groups. Twenty-seven of the 30 confirmatory analyses again yielded a close fit (CFIs ≥ .95 and SRMRs ≤ .05) with either no (19 analyses) or only minor local ill-fit (two to five correlated residuals slightly larger than an absolute .10, range = .11–.23 with most less than .15). The three analyses on the CDS scale yielded acceptable fit (CFIs ≥ .91 and SRMRs ≤ .06). And, as expected, the CDS scale again showed the most local-ill fit due to the three conceptual dimensions within this scale (approximately .20 of the 105 correlated residuals were larger than an absolute .10 for each of the three analyses, range = .11–.26 with most less than .15).
Loadings
Supplemental Tables S12–S21 show the standardized loadings and standard errors for each CABI item on its scale for males and females within the three age groups. All the loadings were moderate to substantial (nearly all from .70 to high .80s/low .90s). 6
Invariance Analyses of CABI Scale Scores Across Sex Within Age Groups
Ages 5–8
For the invariance analyses across females and males within the 5 to 8 age group, the CDS, ADHD-IN, ODD, anxiety, depression, social impairment, peer rejection, and academic impairment scales did not show a significant decrement in fit with constraints on like-item loadings and thresholds (Mplus difftest, ps > .001). It was necessary, however, to release the constraints on the item talks too much from the ADHD-HI scale and the item shy about participating in peer activities from the peer withdrawal scale. For the talks too much item, males tended to have higher thresholds than females for the lower anchor transitions (0–1, 1–2, and 2–3 rating anchor transitions). For the withdrawal from peer interactions item, females had a higher loading than males. Supplemental Table S22 shows these invariance analyses.
Ages 9–12
For the invariance analyses across females and males for the 9 to 12 age group, the CDS, ADHD-IN, anxiety, depression, social impairment, peer rejection, and withdrawal from peer interaction scales did not show a significant decrement in fit with constraints on like-item loadings and thresholds (ps > .001). For the ADHD-HI scale, it was again necessary to release the constraints on the talks too much item as well as the interrupts or intrudes on others item. For the talks too much item, the second threshold (1–2 rating anchor transition) was higher for males than females. For the interrupts or intrudes on others item, the first and second thresholds (0–1 and 1–2 rating anchor transitions) tended to be higher for males than females. For the ODD scale, it was necessary to release the constraints on the annoys others on purpose item. Here there was tendency for females to have higher second and third thresholds (2–3 and 3–4 rating anchor transitions) than males. Finally, for the academic impairment scale, it was necessary to release the constraints on the arithmetic and mathematics skills item (males with a higher first threshold than females). Supplemental Table S23 shows these invariance analyses.
Ages 13–16
For the invariance analyses across females and males for the 13 to 16 age group, the CDS, ADHD-IN, depression, social impairment, peer rejection, and withdrawal from peer interactions scales did not show a significant decrement in fit with constraints on like-item loadings and thresholds (ps > .001). It was again necessary to release the constraints on the ADHD-HI item talks too much (tendency for a higher second threshold for males than females) as well as the ADHD-HI item driven/on the go (tendency for a higher first threshold for females than males). For the anxiety scale, it was necessary to release the constraints on the item seems anxious about separation from parents (higher first threshold for females than males) and for the ODD item annoys others on purpose (higher first threshold for females than males). Finally, it was again necessary to release the constraints on the arithmetic and mathematics skills item on the academic impairment scale (higher first and second thresholds for males than females). Supplemental Table S24 shows these invariance analyses.
Mean Differences on CABI Scale Score Factors for Females and Males With Age Groups
Table 3 show Cohen’s latent d values for the differences between males and females for each CABI scale factor within the three age groups (positive scores indicate males had a higher mean score). Significant (p < .001) differences occurred for only two scales. For the ADHD-HI factor, males had higher latent means than females for ages 5 to 8 and 9 to 13 (d = .22, SE = .05 and d = .28, SE = .05, respectively). Males also had higher latent means than females on the academic impairment factor for ages 9 to 12 and 13 to 16 (d = .26, SE = .06 and d = .27, SE = .06, respectively). These differences reflect small effect sizes.
Latent d (SEs) Value Differences between Females and Males on CABI Scale Factors Within Early Childhood, Middle Childhood, and Adolescence (Positive d Values Indicate Higher Scores for Males)
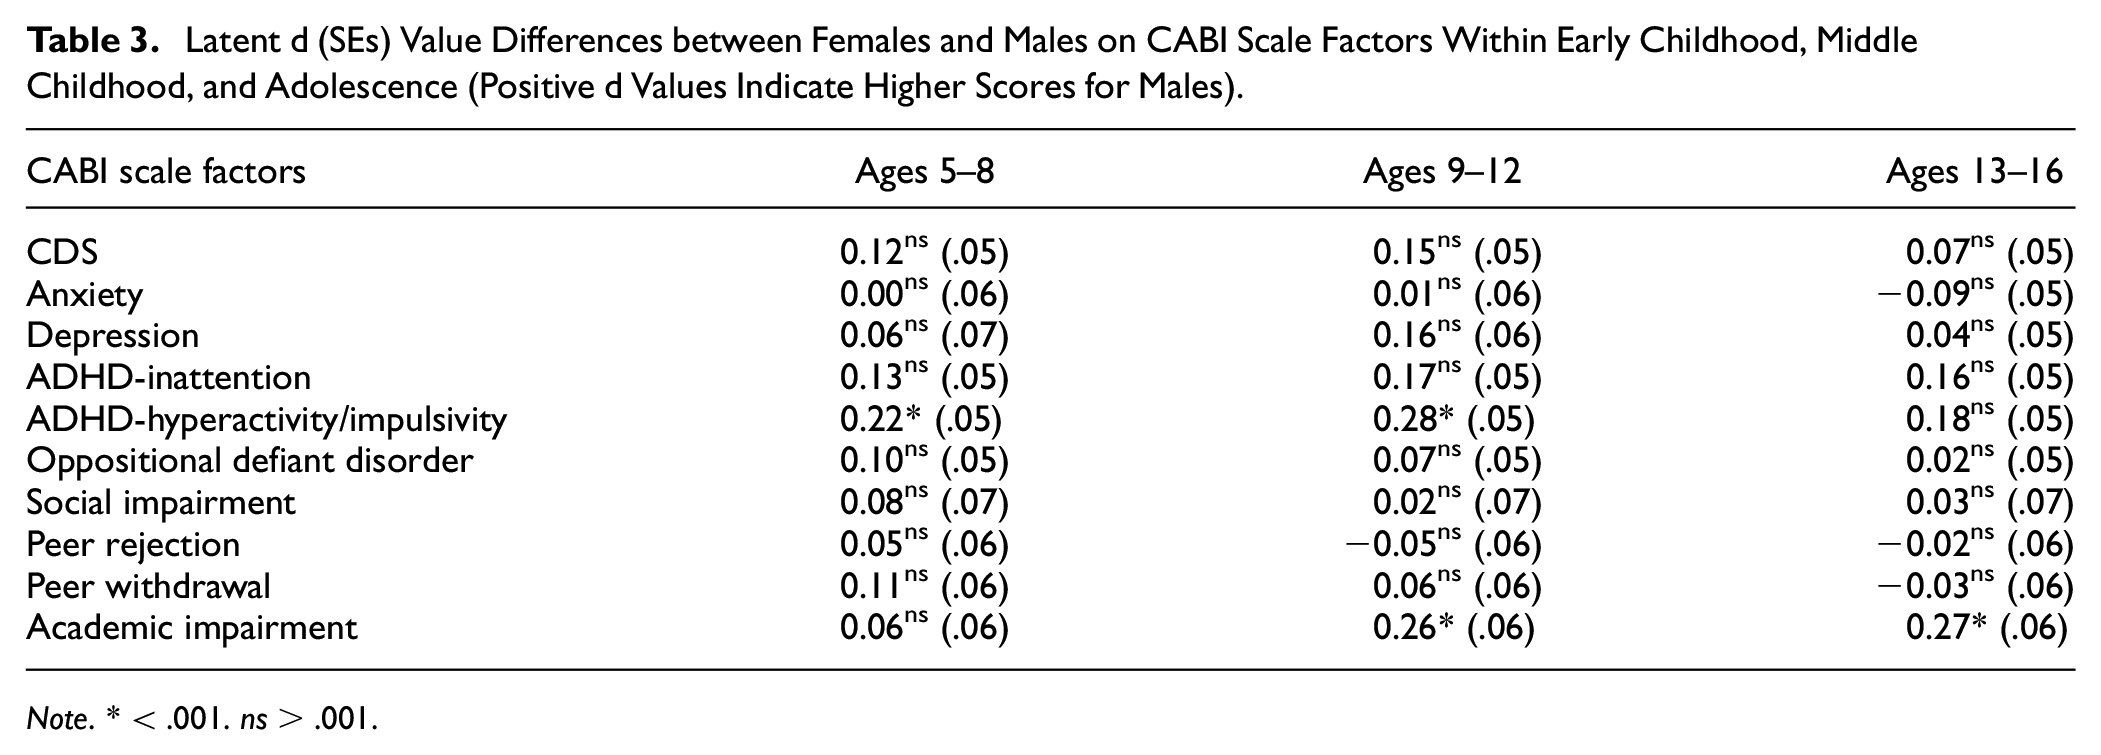
Note. * < .001. ns > .001.
Usefulness of CABI Scale Scores for Screening Purposes
Supplemental Figures S1–S6 show the test information functions from the graded response item response theory model for the 10 CABI scales for males and females within each of the three age groups (30 test information functions for females and 30 functions for males). The six symptom scales provided a high level of information and precision (low standard error) from approximately 0.50 standard deviations below the trait mean to slightly greater than 2.00 standard deviations above the trait mean. The four functional impairment scales provided a high level of information and precision from approximately the trait mean to slightly greater than 2.00 standard deviations above the trait mean. The scores from all the CABI scales provided a high level of information and precision within the clinical range (1.50–2.00 standard deviations above the trait mean for the scale), thus suggesting the usefulness of the scales for screening purposes. These results also indicate that the CABI scales provide good measures of each latent variable from slightly below the trait mean to approximately 2.00 standard deviations above the trait mean.
Criterion Validity of CABI Scale Scores With Mental Disorder Diagnoses
Table 4 shows the associations (d values) of having a history of ADHD, ODD/conduct disorder, anxiety, depression, bipolar disorder, autism/autism spectrum disorder, language delay, learning disorders, or intellectual disability diagnosis with each of the 10 CABI scales. Each diagnosis had a strong association (often strongest) with the CABI scale corresponding to the diagnosis (e.g., a history of a depression diagnosis had a d value of 1.73 with CABI depression scale scores). For diagnoses with no corresponding CABI scale (bipolar disorder, autism/autism spectrum disorder, language delay, learning disorders, and intellectual disability), the highest d values occurred with the functional impairment scales (e.g., the bipolar disorder diagnosis had d values of 1.56 and 1.48 with CABI social impairment and peer rejection scores, respectively).
Associations (d Values) of Youth Diagnoses with CABI Scale Scores
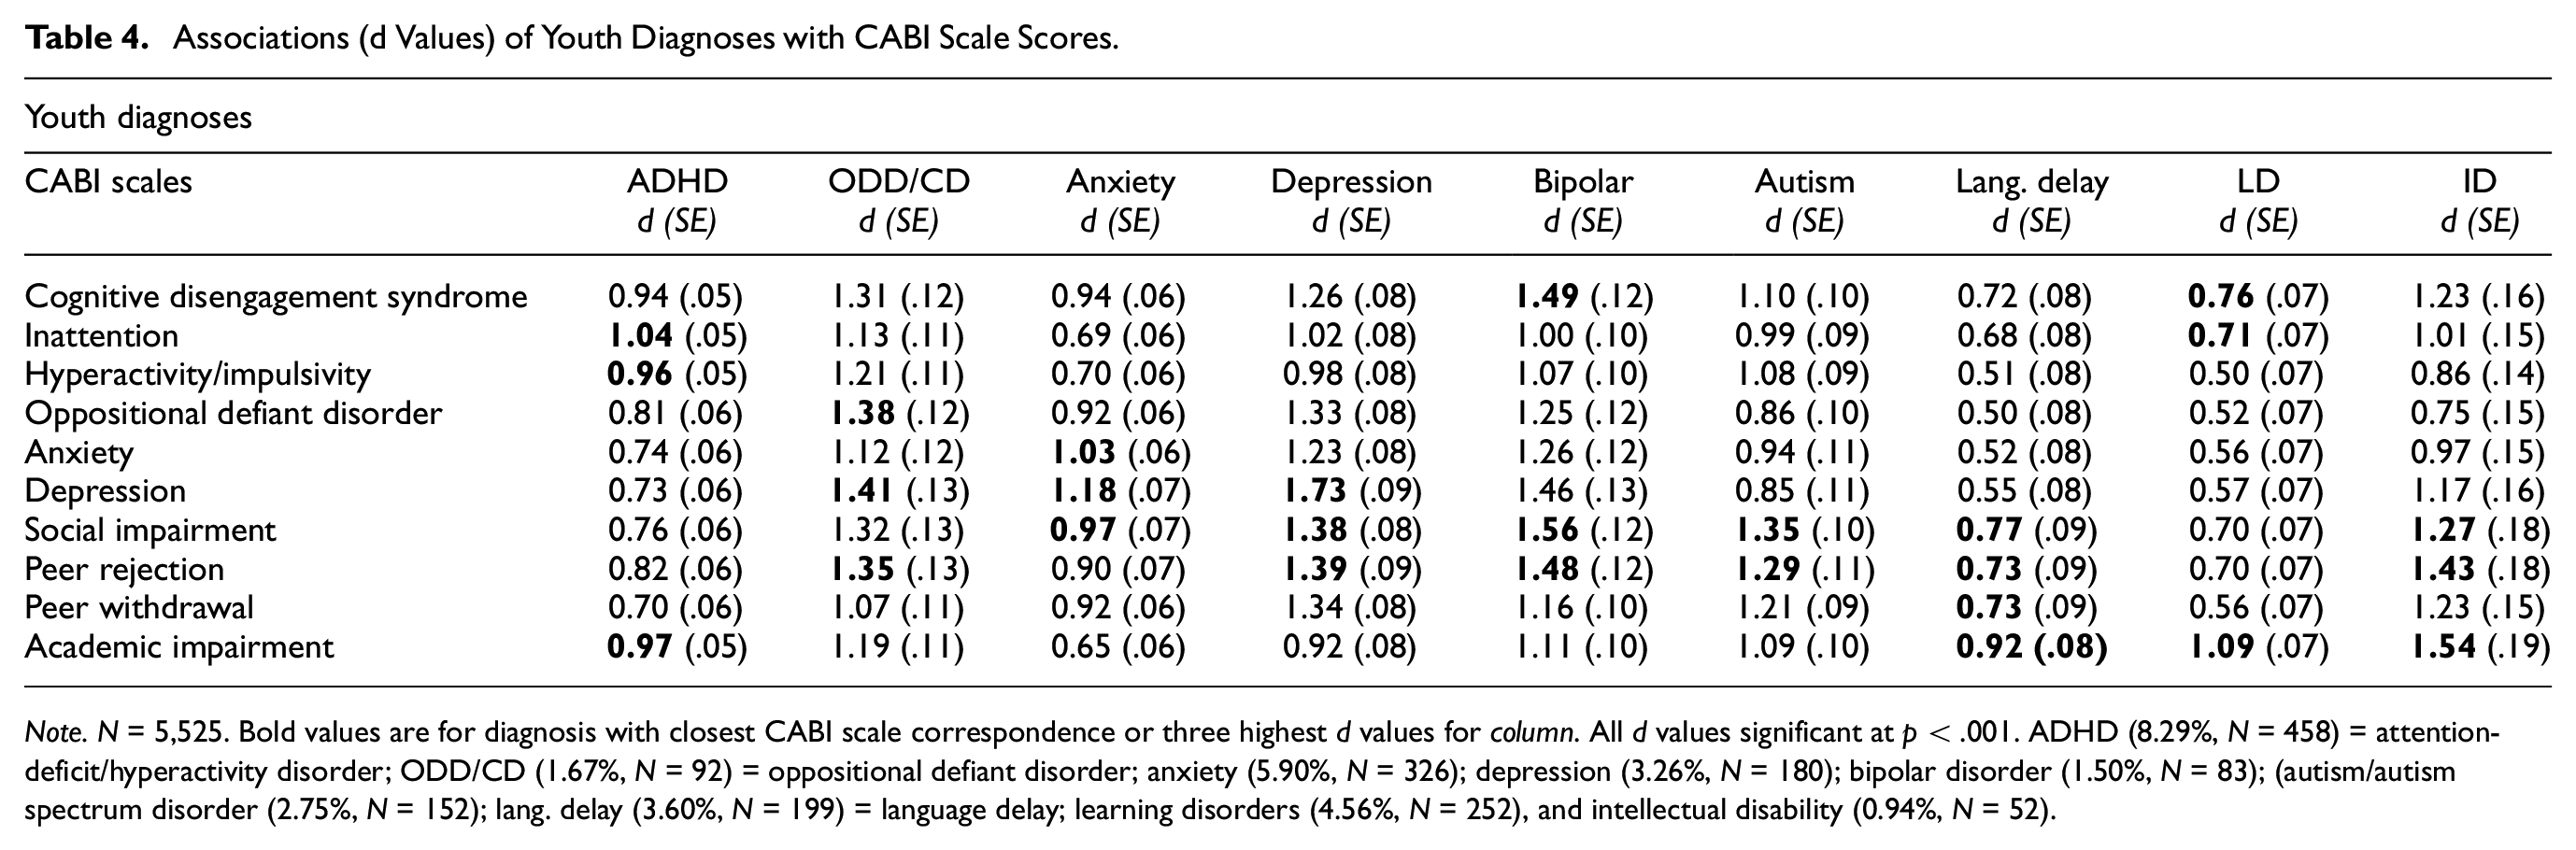
Note. N = 5,525. Bold values are for diagnosis with closest CABI scale correspondence or three highest d values for column. All d values significant at p < .001. ADHD (8.29%, N = 458) = attention-deficit/hyperactivity disorder; ODD/CD (1.67%, N = 92) = oppositional defiant disorder; anxiety (5.90%, N = 326); depression (3.26%, N = 180); bipolar disorder (1.50%, N = 83); (autism/autism spectrum disorder (2.75%, N = 152); lang. delay (3.60%, N = 199) = language delay; learning disorders (4.56%, N = 252), and intellectual disability (0.94%, N = 52).
Normative Information on CABI Scales
Supplemental Tables S25–S54 provide T-scores that correspond to mean scale scores for the 10 CABI scales for males and females within ages 5–8, 9–12, and 13–16. This normative information is also available from the authors.
Discussion
The scores on the 10 CABI scales demonstrated positive psychometric properties for parent ratings of a nationally representative sample of 5,525 Spanish youth from ages 5 to 16. First, scores on the 10 scales showed excellent reliability for females and males separately within the three age groups. Second, the scores on the 10 scales showed good discriminant validity for females and males separately within the three age groups. Third, the scores on nine of the 10 scales demonstrated strong unidimensional properties for males and females separately within the three age groups. Scores on the CDS scale, although indicating an acceptable fit, had the greatest degree of local ill-fit due to the weak conceptual dimensions within this scale (daydreaming, mental confusion, and hypoactivity, see Table 2 in Becker et al. 2023). At this time, however, we recommend the use of the total scores on the CDS scale for clinical and research and clinical activities (i.e., the study of unique effects of each sub-factor eliminates all their shared variance, thus significantly changing the meaning of the CDS construct, see Hoyle et al., 2023).
Fourth, invariance analyses indicated that nearly all the items on the 10 scales showed invariance of like-item loadings and thresholds across females and males within the three age groups. The factor means also did not differ across males and females for 8 of the 10 scales (i.e., males higher than females on the ADHD-HI scale [ages 5–8 and 9–12) and the academic impairment scale (ages 9–12 and 13–16). Fifth, the test information functions indicated that the 10 CABI scales provided high level of information and precision within the clinical range (1.50–2.00 standard deviations above the trait mean for the scale). This result occurred for females and males separately within each of the three age groups. Sixth, CABI scale scores had the strongest association with the mental disorder diagnosis associated with the specific scale (e.g., a history of a depression diagnosis with CABI depression scale scores). And, if the diagnosis did not correspond to any CABI scale (e.g., bipolar disorder), then the association was strongest with the CABI functional impairment scales (e.g., social impairment and peer rejection). These results thus provide additional support for the criterion validity of CABI scale scores (see also Becker, Dunn, et al., 2024; Becker et al., 2022; Becker, Vaughn, et al., 2024 for other examples of criterion validity).
These positive psychometric results for the scores on the 10 CABI scales provide justification for the use of the norms for screening purposes. More specifically, the norms will allow clinicians to determine if a youth’s scores are in the clinical range (e.g., T-scores > 64 or 69). The norms will also allow clinicians to monitor the progress of treatment (e.g., whether scores move from the clinical range to the non-clinical range). In addition, the norms will allow researchers to determine what percentage of their research samples have scores in the clinical range, as well as track change across development in longitudinal studies. Finally, the CABI and the norms are available at no cost to clinicians and researchers, thus providing a brief and cost-effective measure for practice and research, and since each scale can be administered separately, individuals can select the scale or scales most relevant to their needs (e.g., research protocol or specific clinical presentations/treatment focus).
Limitations and Future Directions
Future research needs to obtain similar nationally representative samples from other countries. In addition, the requirement of the collection of a large nationally representative sample of Spanish youth for this study did not allow us to conduct diagnostic interviews, intellectual, academic or neuropsychological assessments, direct observations of home and school behavior, or obtain school records. In addition, it was not possible to examine invariance over the sex of rater/sex of ratee combinations. All these aspects represent limitations of the current study (see Becker, Dunn, et al., 2024; 7 Becker et al., 2022; Becker, Vaughn, et al., 2024 for other studies with CABI scales that address these validity questions with other samples). Similar validity studies conducted by others are also important for the further evaluation of the CABI scale scores. In closing, we hope that clinicians and researchers find the CABI scales and the new norms useful in their clinical and research activities.
Supplemental Material
sj-docx-1-asm-10.1177_10731911251317785 – Supplemental material for Psychometric and Normative Information on the Child and Adolescent Behavior Inventory With Parent Ratings in a Nationally Representative Sample of Spanish Youth
Supplemental material, sj-docx-1-asm-10.1177_10731911251317785 for Psychometric and Normative Information on the Child and Adolescent Behavior Inventory With Parent Ratings in a Nationally Representative Sample of Spanish Youth by G. Leonard Burns, Juan José Montaño, Stephen P. Becker and Mateu Servera in Assessment
Footnotes
Declaration of Conflicting Interests
The author(s) declared no potential conflicts of interest with respect to the research, authorship, and/or publication of this article.
Funding
The author(s) disclosed receipt of the following financial support for the research, authorship, and/or publication of this article: This research was supported by a grant PID2020-118309RB-I00 funded by MCIN/AEI/10.13039/501100011033.
Ethical Approval
The research protocol was approved by the Research Ethics Committee (Institutional Review Board) of the University of the Balearic Islands. The approval number was 246CER22.
Informed Consent
Parents provided written informed consent.
Pre-Registration
The study was not pre-registered. The Mplus input and outputs files for all analyses are available from the first author.
Supplemental Material
Supplemental material for this article is available online.