
Abstract
To refine the 23-item chronic Hepatitis B quality of life instrument (CHBQOL) using the modified Delphi method and Rasch model analysis, this study conducted a secondary data analysis on 578 chronic Hepatitis B (CHB) patients. The preliminary evaluation of the item’s importance of the original CHBQOL and the final review of the short form of CHBQOL (CHBQOL-SF) were collected by the Delphi method. A bi-factor model was estimated and Rasch analysis with partial credit model was performed on each domain of the CHBQOL. Six items were suggested to remove based on the Delphi results. The fit of the bi-factor model was acceptable (RMSEA = 0.040; CFI = 0.983; TLI = 0.965). Disordered thresholds were initially found on three out of five items in Somatic symptoms, and four out of six items in Social stigma. Uniform differential item functioning was observed for three items for age group, two items for gender, and one item each for different ALT levels and HBV-DNA levels. Finally, the 10-item CHBQOL-SF retained the four-dimensional structure of the original instrument. The 10 items fit the Rasch model well and response options were set reasonably. The 10-item CHBQOL-SF would offer a brief and easily administrative CHB-specific patient-reported outcome measure for use in clinical practice and population studies.
With high transmissibility and incidence of adverse outcomes, hepatitis B virus (HBV) has become a significant global public health threat (GBD 2017 Cirrhosis Collaborators, 2020; Global Burden of Disease Liver Cancer Collaboration et al., 2017; Trépo et al., 2014). As a progressive and life-threatened disease, its long-term antiviral treatment tends to impose substantial economic, psychological, and life impact on chronic hepatitis B (CHB) patients and even their families (Z. Kong et al., 2019; Taheri Ezbarami et al., 2017). All these would undoubtedly influence CHB patients’ daily lives and health-related quality of life (HRQoL). HRQoL represents the subjective assessment of individual health-specific well-being (Modabbernia et al., 2013; Wallace et al., 2017). We previously developed a 23-item culture-grounded instrument to assess HRQoL of Chinese CHB patients (CHBQOL) (Zhu et al., 2019). It made up the deficiencies of existing instruments lacking cultural- and disease-specificity, and inadequate evaluations of psychometric properties (Evon et al., 2020; Liu et al., 2016; Ong et al., 2010; Spiegel et al., 2007). The reliability and initial validity of CHBQOL were acceptable and proved to be an appropriate tool for assessing HRQoL among Chinese CHB patients.
However, China has the highest prevalence of HBV infection in the world (Su et al., 2022). Nearly one-third of the global burden of HBV infections were from China (Miao et al., 2021), among which more than 80% were CHB cases. In 2016, World Health Organization (WHO) proposed a program to eliminate viral hepatitis, realizing a 90% reduction in the number of new HBV infections by 2030 (Miao et al., 2021). In line with the strategy, China has strengthened the monitoring and follow-up of the standardized diagnosis, treatment, and prognosis of CHB patients. Since CHB-related epidemiological surveys have been on such a large scale, a short form of CHBQOL (CHBQOL-SF) would be in great need for better completion rates. However, patient-reported outcomes (e.g., PRO) are part of epidemiological surveys, accompanied by multiple other key outcomes (e.g., clinical indicators) (Younossi et al., 2023). Therefore, the short form could facilitate its inclusion in broader surveys and daily monitoring with less response burden.
Existing CHB-specific measures are commonly burdensome and with deficiencies (Bayliss et al., 1998; Liu et al., 2016; Ong et al., 2010; Younossi et al., 1999). For example, Liver Disease Quality of Life (LDQOL) involves multiple dimensions with 111 items. The Chronic Liver Disease Questionnaire (CLCD) has fewer response burdens with 29 items, while it has low differentiation between the different stages of liver disease. Previous studies showed that short forms often contained around 10 items or less to truly reduce the filling burden (Hibbard et al., 2005; Kosinski et al., 2003; Reinius et al., 2017; Rossi Ferrario et al., 2019). Liver Disease Symptom Index 2.0 (LDSI 2.0) is relatively brief with nine items. Whereas, it focuses on liver disease-related clinical symptoms and their influences on lives, not including other aspects of HRQoL (Plas et al., 2004). A shorter version of CHBQOL would greatly enhance measuring activation in a clinical setting.
Therefore, the CHBQOL-SF was in great need to facilitate daily monitoring of CHB patients’ HRQoL. It could help enhance measuring activation in large-scale epidemiological or clinical surveys with less response burden. This study aimed to develop a substantially short version based on the original version of CHBQOL with less information loss.
Materials and Methods
Development of CHBQOL-SF
The original CHBQOL contains 23 items in a four-dimensional structure, which had acceptable goodness of fit (Zhu et al., 2019). The four dimensions describing HRQoL are, respectively, Somatic symptoms (six items), Emotional symptoms (six items), Belief (two items), and Social stigma (nine items). Each item is measured on a 6-point Likert-type scale with anchors from 0 (“not at all”) to 5 (“very much”). Items 1 to 12 and 15 to 23 are reverse scoring items so that higher scores represent better HRQoL. All CHBQOL domains have satisfactory reliability with Cronbach’s α coefficients ranging from .73 to .91. The sum scores of items within the same domain represent the CHBQOL domain score. The raw domain scores were then transformed into standardized scores ranging from 0 to 100.
Relying on the previous cohort (Zhu et al., 2019), this study aimed to develop the CHBQOL-SF with fewer than half the number items. CHBQOL-SF could yield a single score representing CHB patients’ HRQoL. But it would nevertheless conform to the conceptual model on which the CHBQOL was developed (four dimensions or subscales). It would also preserve both the content and the psychometric properties of the original instrument as far as possible. It was expected that each dimension of the short version would have two or more items. This proposal had been approved by the Zhejiang University School of Public Health Ethics Committee (ZGL201501-1).
Participants Selection
The target sample of this study were approximately 600 CHB patients from six tertiary hospitals, respectively, in six cities from the Zhejiang Province, China. The sample sites had varying socioeconomic status according to GDP per capita. The CHB patients were from both inpatient and outpatient departments of six hospitals. Participants were selected based on strict inclusion and exclusion criteria, with clinicians verifying disease-related information. Recruitment aimed to ensure a socio-demographically representative sample of the Chinese CHB population, considering gender, age, education, and treatment status. More detailed information could refer to our previous work (Zhu et al., 2019).
Procedures
A two-step method was performed to the item selection procedure: first, conducted by items’ importance evaluation from the modified Delphi method preliminarily; second, further referring to the items’ parameter estimation and model fit with item response theory (IRT) and the Rasch analysis.
Phase 1: Modified Delphi Method
A panel of 13 experts was selected by purposive sampling for representativeness and authority. This study performed three rounds of the modified Delphi method to obtain consensus within the experts’ panel. The modified Delphi method generally requires experts to fill a structured questionnaire and encourages them to provide as many suggestions as possible in the first round of consultation (Fink et al., 1984).
For each round of the modified Delphi method, the importance evaluation of items was scored on 1 to 5 points, representing “very inappropriate” to “very appropriate,” respectively. Also, opinions regarding each item and suggestions for revision would be collected. The results and the scoring reasons from the first round were integrated into the second round for more agreement. The consultation was closed when the experts’ opinions were generally in agreement. Since the opinions of the second Delphi round had reached the agreement, the final round was organized to have the Delphi group review development methodology and potential application of the shorted measure. The expert consultation questionnaires were distributed by mail, e-mail, and paper. Researchers contacted all experts before distributing the questionnaires to ensure they filled them out in time.
Phase 2: IRT and the Rasch Analysis
This study utilized Rasch measurement theory to model the probability of individuals’ response to one item based on the difference between individuals’ ability and the item’s difficulty (Tatum, 2000). Aside from testing the assumptions of the model fit, this study also estimated a bi-factor model and calculated the coefficients omega and omega Hierarchical (omegaH). The bi-factor model would help judge whether the multidimensional item response data had a strong enough general factor to justify a unidimensional measurement model; and determined the adequacy of a total score instead by scoring subscales. The coefficients would help check the extent to which the full scale scores could be determined by a single general factor (Rodriguez et al., 2016). The polytomous Rasch model’s partial credit model (PCM) was selected to fit the cross-sectional sample data due to the ordered multilevel items (Hays et al., 2000). A series of parameter estimations were performed based on validating the IRT theoretical assumptions and model fit. The critical parameter indicators were as follows:
Item characteristic curve (ICC) and item information curve (IIC) As the underlying trait measured increases, patients have a higher probability of choosing a positive response, obtaining higher scale scores. Consistent with this response behavior, the ICC should be an S-shaped curve with an increasing trend from left to right. Since this study applied one-parameter model (Rasch and PCM) for depicting ICC, all items’ discrimination parameters are constant 1. IIC visualizes the relationship between the amount of item information and the level of participants’ latent traits. A larger IIC coverage area indicates a greater amount of information contained in the items, and a higher accuracy in estimating the patient’s PRO level (Wu et al., 2016).
Category probability curve (CPC) and ranking of the threshold parameters The intersected point of two adjacent CPCs can be recognized as the corresponding scoring categories’ threshold parameter (β i , also known as the difficulty parameter in this study) (Lin et al., 2014). In the PCM, each item’s thresholds are theoretically ranked from smallest to largest. The study adopted a 6-point Likert-type scale from 0 to 5; thus, there are five thresholds (β1 < β2 < β3 < β4 < β5), which indicates that it is increasingly difficult for individuals to obtain a higher QoL score on the item. If the ranking of the threshold parameters is reversed or inverted, like β2 > β3 or β2 > β4, it indicates the poor setting of option categories. It could be considered to adjust the option settings of the item or even delete it for improvement.
Individual item fit residual (FitResid) The threshold parameters of the items are centralized. If the data fit well with the polytomous Rasch model, the mean of the threshold parameters (equal to location—the item difficulty parameter) of all items will tend to 0 and the standard deviation to 1. The residuals of each item can be calculated from the threshold parameters estimated by the model (theoretical values), and the actual QoL scores of the participants (observed values). If the residuals’ absolute value of an item is less than 2.5, and its chi-square test is not statistically significant (Bonferroni adjusted), the item is considered to be a good fit (X. Chen et al., 2013).
Differential item functioning (DIF) It is assessed to determine whether participants from different subgroups (e.g., gender, age group) respond differently to the same item while individuals’ trait level (e.g., disease severity) is on the same level (Lee et al., 2022) and to evaluate the sensitivity of items among different subgroups (Fayers & Machin, 2016). For more details, uniform DIF represents that one subgroup always has a higher response probability than the other, regardless of the level of subgroups’ constant trait. In contrast, nonuniform DIF represents one group has a higher response probability than the other when it is at a low trait level and a lower response probability than the other when it is at a high trait level. This study examined DIF for different genders (male and female), ages (≤30 and >30 years old), income levels (<2,000, 2,000~6,000, and >6,000 RMB; 1US$ ≈ 6.7 RMB), and disease statuses from different subgroups (including HBV DNA level, HBeAg status, and ALT level).
The impact of DIF was evaluated by McFadden’s pseudo R2 and the test characteristic curve (TCC) for further item-selection. As recommended, pseudo R2 < .13 suggests that the impact of DIF is negligible; pseudo R2 within .13~.26 suggests that the impact of DIF is moderate; pseudo R2 > .26 suggests that the impact of DIF is large, and consider to delete (Scott et al., 2009). TCC could provide visual impacts of DIF on the domain’s whole test and similarity of test responses across subgroups on corresponding dimensions, which could be considered as a suppled evidence.
Person separation index (PSI) and Person-item map The PSI was used to assess the internal consistency reliability of the scale; however, it only uses the logit values instead of the raw scores, where a value of ≥.70 was considered acceptable (Tennant & Conaghan, 2007). The person-item map will combine the item threshold parameters and the individual latent traits on one scale, simultaneously reflecting the relationship between them. It helps select the items that provide the most excellent coverage of the individuals’ condition without redundant information (Lee et al., 2022).
Since the items are scored via Likert-type scales, the graded response model (GRM), as a two-parameter model, is also common with such types of noncognitive items. Therefore, this study also conducted the GRM as a comparison with PCM results, and mainly performed the item parameter analysis (e.g., discrimination parameters, difficulty parameters, category characteristic curves [CCCs], and IICs), and DIF analysis. Relevant detailed analysis could refer to Supplementary Material 2.
Data Analysis
Modified Delphi Method
This study examines the reliability and representation of items based on the experts’ importance evaluation scores. This part of the survey was analyzed using the Holey and colleagues method of assessing consensus and stability (Holey et al., 2007): (a) response rates; (b) mean and standardized deviation (SD) of one item’s importance score; (c) full-score percentage in each item; (d) coefficient of variance (CV, calculated by SD/mean value); (e) Kendall’s W (d and e indicating the agreement of experts’ opinions); (f) the coefficient of expert authority (Cr, formula refer to the Supplementary Text 1). It is generally considered that the mean importance score ≥ 4.00, full-score percentage ≥ 20%, CV ≤ 0.25, and Cr ≥ 0.70 can be performed as the criteria for item selection. To ensure the rigorous procedure, the “cut-off value method” was adopted to select items in this study. The corresponding cut-off values are calculated using the arithmetic mean of the importance score, CV, and full-score percentage of items in each dimension plus or minus their SD, respectively. Only the importance scores of the 23 items in the second round would be adopted as the item selection criteria. It would be considered superior when the full-score percentage and the mean importance score are higher, and the CV is lower than the corresponding cut-off value. Items with at least two parameters meeting the abovementioned criteria would be retained.
IRT and the Rasch Analysis
Before constructing and testing an IRT model, this study first tested assumptions of unidimensionality, local independence, and monotonicity (Batchelder et al., 2020; DeMars, 2010). Respectively, they were performed by principal component analysis (PCA), one-factor confirmatory factor analysis (CFA), and characteristics of ICC. When conducting CFA, the mean value of the residual covariance among items of one domain, closing to 0, could validate the assumption of local independence (Cai, 2010; Gibbons et al., 2007). Bi-factor model was also examined. For multidimensional data with a bi-factor model, the coefficient omega estimates the proportion of variance in the observed total score attributable to all “modeled” sources of common variance (including a common source of variance in the factor model) (Equation 1). Whereas the coefficient omegaH estimates the proportion of variance in the observed total score attributable to the general factor (Equation 2). For more detailed information, please refer to a previous work (Rodriguez et al., 2016):


n represents the number of the specific factors/domains of the target scale; parameters in the equation could extract from a bi-factor model;
This study had insights into the disordered thresholds and CPC to analyze item difficulties. DIF was also adopted to detect items’ sensitivity to measuring among different subgroups. Location, FitResid, chi-square, and p-value examined the fit of the unidimensional Rasch models. We re-evaluated the overall fit with the internal consistency of the scale and the PSI, which is comparable with Cronbach’s alpha (Cano et al., 2011). The fit with the internal consistency of each dimension was also evaluated. All P-values were adjusted according to the Bonferroni method with a probability base of .01.
All descriptive analyses were performed using the SPSS 25.0 statistical software. The bi-factor model was estimated using the “mirt” package, and the impact of DIF were evaluated using the “lordif” package in R version 4.4.1. Amos 23.0 was utilized to perform the CFA to test the local independence assumption. All Rasch measurement analyses were performed using the Rasch Unidimensional Measurement Model Software (RUMM) version 2030 (Andrich et al., 2008).
Results
Participants’ Characteristics
The expert panel in the modified Delphi Method A total of 13 experts participated in the consultation, and the mean age was 49 (SD 9.2). The expert panel included three related fields (hepatitis clinical medicine [53.8%], psychology and behavior science [23.1%], and HRQoL [23.1%]). Experts work in tertiary hospitals, medical colleges, or universities from Zhejiang, Sichuan, Shanxi, and Guangdong Provinces. All experts had doctoral degrees, and most (92.3%) had senior or associate senior titles. Both rounds of the consultation received a 100% return rate, and ten and five constructive comments were received, respectively.
Patients sample in the Rasch model This study recruited five hundred and seventy-eight participants, and 74.2% were male. The average age was 39.22 (SD 11.07) years old. Most participants were married or cohabiting (83.4%) and full-time employed (66.1%). About one-third of the patients had a middle school education (34.3%), and less than 10% of patients had no health insurance (8.3%). More than a half of CHB patients were on treatment with virus suppressed (61.6%) during the study period. Participants with HBV DNA below 2,000 IU/mL accounted for 68.1%. 55.2% of patients were HBeAg positive, and 67.0% of participants had normal ALT level (≤40 U/L). For more details, please refer to our previous work (Zhu et al., 2019).
Items Selection Process Based on Modified Delphi Method
Consensus Regarding the Expert Questionnaire
According to the related formulas, Cr in this study was 0.83 (>0.70). It indicated that the experts evaluated the importance of items based on clinical practice and related theories. Therefore, the reliability was excellent. Table 1 shows the statistical results of the two rounds’ modified Delphi method. Overall, the mean importance score and the full-score percentages improved, and CV decreased in the second round. The Kendall’s W for expert ratings was 0.18 in the first round and increased to 0.25 in the second round (p-value < .001 in both rounds). It indicated that the experts’ opinions became more consistent and concentrated, and the consultation results were reliable.
Importance Scores of the Two-Round Modified Delphi Method.

Item Selection Results Based on the Modified Delphi Method
Table 2 shows the cut-off values of the importance scores, full-score percentages, and CV in the second round of the modified Delphi method. According to the abovementioned principles, six items were not recommended for retention. One item out of Somatic symptoms, two items out of Emotional symptoms, and three items out of Social stigma domains were removed, respectively (see Table 3 for more details).
The Cut-Off Values in the Second Round of the Modified Delphi Method.

Experts’ Comments for the Removed Items.

Item Selection Process Based on IRT and the Rasch Model
Testing of Assumptions in the IRT
The 17 items retained by the modified Delphi method were subjected to PCA (see Table 4)—only one factor with an eigenvalue greater than one could be extracted for each dimension upon testing. Also, the ratio of the eigenvalue of the first factor to the second one was greater than 3 in each dimension. The first factor in all models could explain more than 50% of the variance. Therefore, each dimension was consistent with the assumption of unidimensionality.
Results of PCA Toward Each Dimension.

E1 The first eigenvalue; E2 The second eigenvalue.
The residual correlation of CFA was performed to conduct local independence tests. Four domains of Somatic symptoms, Emotional symptoms, Belief, and Social stigma were fitted to a one-factor CFA model. The mean values of the residual covariance were .049, .040, .000, and .057, respectively, which satisfied the assumption of local independence.
In addition, all 17 ICC plots were monotonically increasing curves. It indicated that patients with higher QoL scores of a specific domain were more likely to choose higher ranks of options. Thus, the monotonicity assumptions were fulfilled. Furthermore, all IIC were single-peaked and suitable for IRT analysis. Figure 1 took Item 1 of the Somatic symptoms as an example showing ICC and IIC plots. All 17 plots of ICC and IIC can be referred to in Supplementary Figure 1.
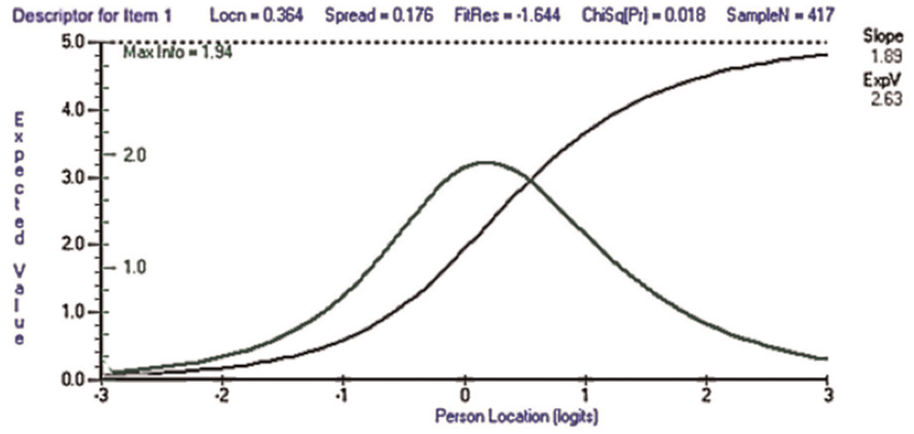
ICC (the Black Line) and IIC (the Green Line) of Item 1 in Somatic Symptoms as an Example.
The Bi-Factor Model and omegaH
The bi-factor model was acceptable (RMSEA = 0.040, with 95% CI: 0.025∼0.054; CFI = 0.983; TLI = 0.965). Also, it provided standardized factor loadings of the 17 items retained (see the Supplementary Table 1), which allowed the calculation of the omega and omegaH. The coefficient omegaH was 0.823, meaning that 82.3% of the variance of unit-weighted total scores can be attributed to the individual differences on the general factor. The square root of omegaH (0.907) showed strong correlation between the general factor and the observed total scores. For the 17 items retained in the CHBQOL, a comparison of omegaH (0.823) with omega (0.959) was critical that the majority of the reliable variance in total scores (0.823/0.959 = 0.858) can be attributed to the general factor, assumed to reflect individual differences on the trait of HRQoL. About 10% (0.959 − 0.823 = 0.136) of the reliable variance in total scores can be attributed to the multidimensionality caused by the group factors. Thus, raw total scores can be interpreted as an acceptably unidimensional reflection of HRQoL among CHB patients, despite the multidimensionality of the CHBQOL.
Item Difficulties Analysis
The 17 items’ mean thresholds ranged from −0.778 (Item 12) to 0.364 (Item 1). Disordered thresholds were initially found on three out of five items in Somatic symptoms and four out of six items in Social stigma. Among them, the disordered threshold of Item 16 was in the most severe condition, and Items 5, 15, and 17 also had three options with disordered thresholds. Correspondingly, the CPCs of these four items were obvious to be overlapped (see Figure 2). Therefore, these four items were considered to be removed for poor quality. Another three items (Item 1, Item 2, and Item 21) were retained, for they only showed disordered thresholds between two adjacent options (for more details, see Supplementary Table 2).
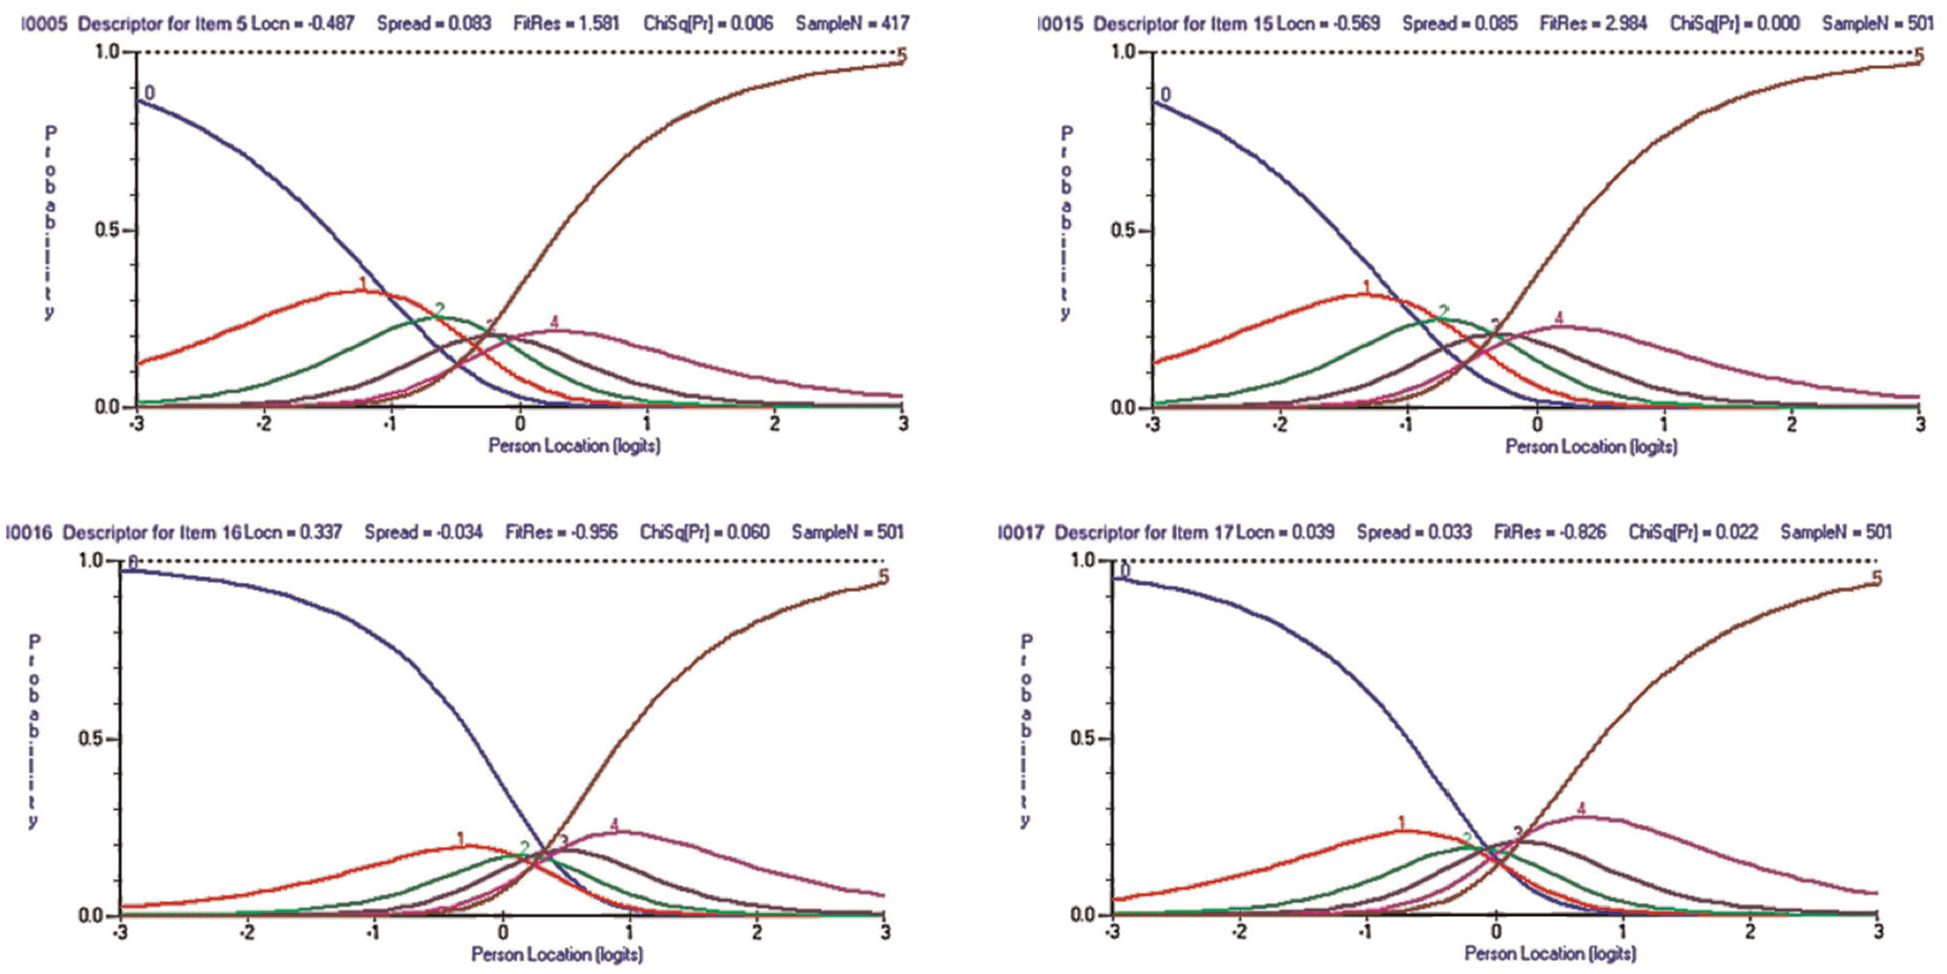
Overlapped CPCs of Items 5, 15, 16, and 17.
DIF Analysis
A total of seven items showed uniform DIF and no item showed nonuniform DIF in this study (see Figure 3). The detailed analysis and evaluation of the extent of DIF impacts were as follows:
Age groups: Items 1, 15, and 21 showed uniform DIF by age. As shown in Figure 3, the subgroup of age ≤30 years had more responses to Items 1 and 15 but less to Item 21 than those of age >30 years. In other words, patients of age <30 years were more likely to have higher QoL scores and be less likely to feel nauseous and be worried about transmitting to others, but more likely to worry about decreased social activities.
Gender group: Items 16 and 21 showed uniform DIF by gender. It indicated that among patients with the same social functioning, males responded less to Item 16 and more to Item 21 than females. Females were more likely to have higher QoL scores than males in the presence of equivalent perceived family dislike. However, males were more likely to have higher QoL scores than females for the same decrease in social activity.
ALT levels: Item 13 showed DIF by the level of ALT. Among patients with the same ability in the Belief domain, more response to Item 13 was found in those with abnormal ALT levels than normal ones. In other words, those with abnormal ALT levels had more preference for the belief that chronic hepatitis B could be cured.
HBV-DNA status: Item 15 showed DIF by the level of HBV-DNA. People with HBV-DNA above the detection limit (2,000 IU/mL) were more likely to have higher QoL scores than those below the detection limit and were more likely to react with fear of transmitting to others.
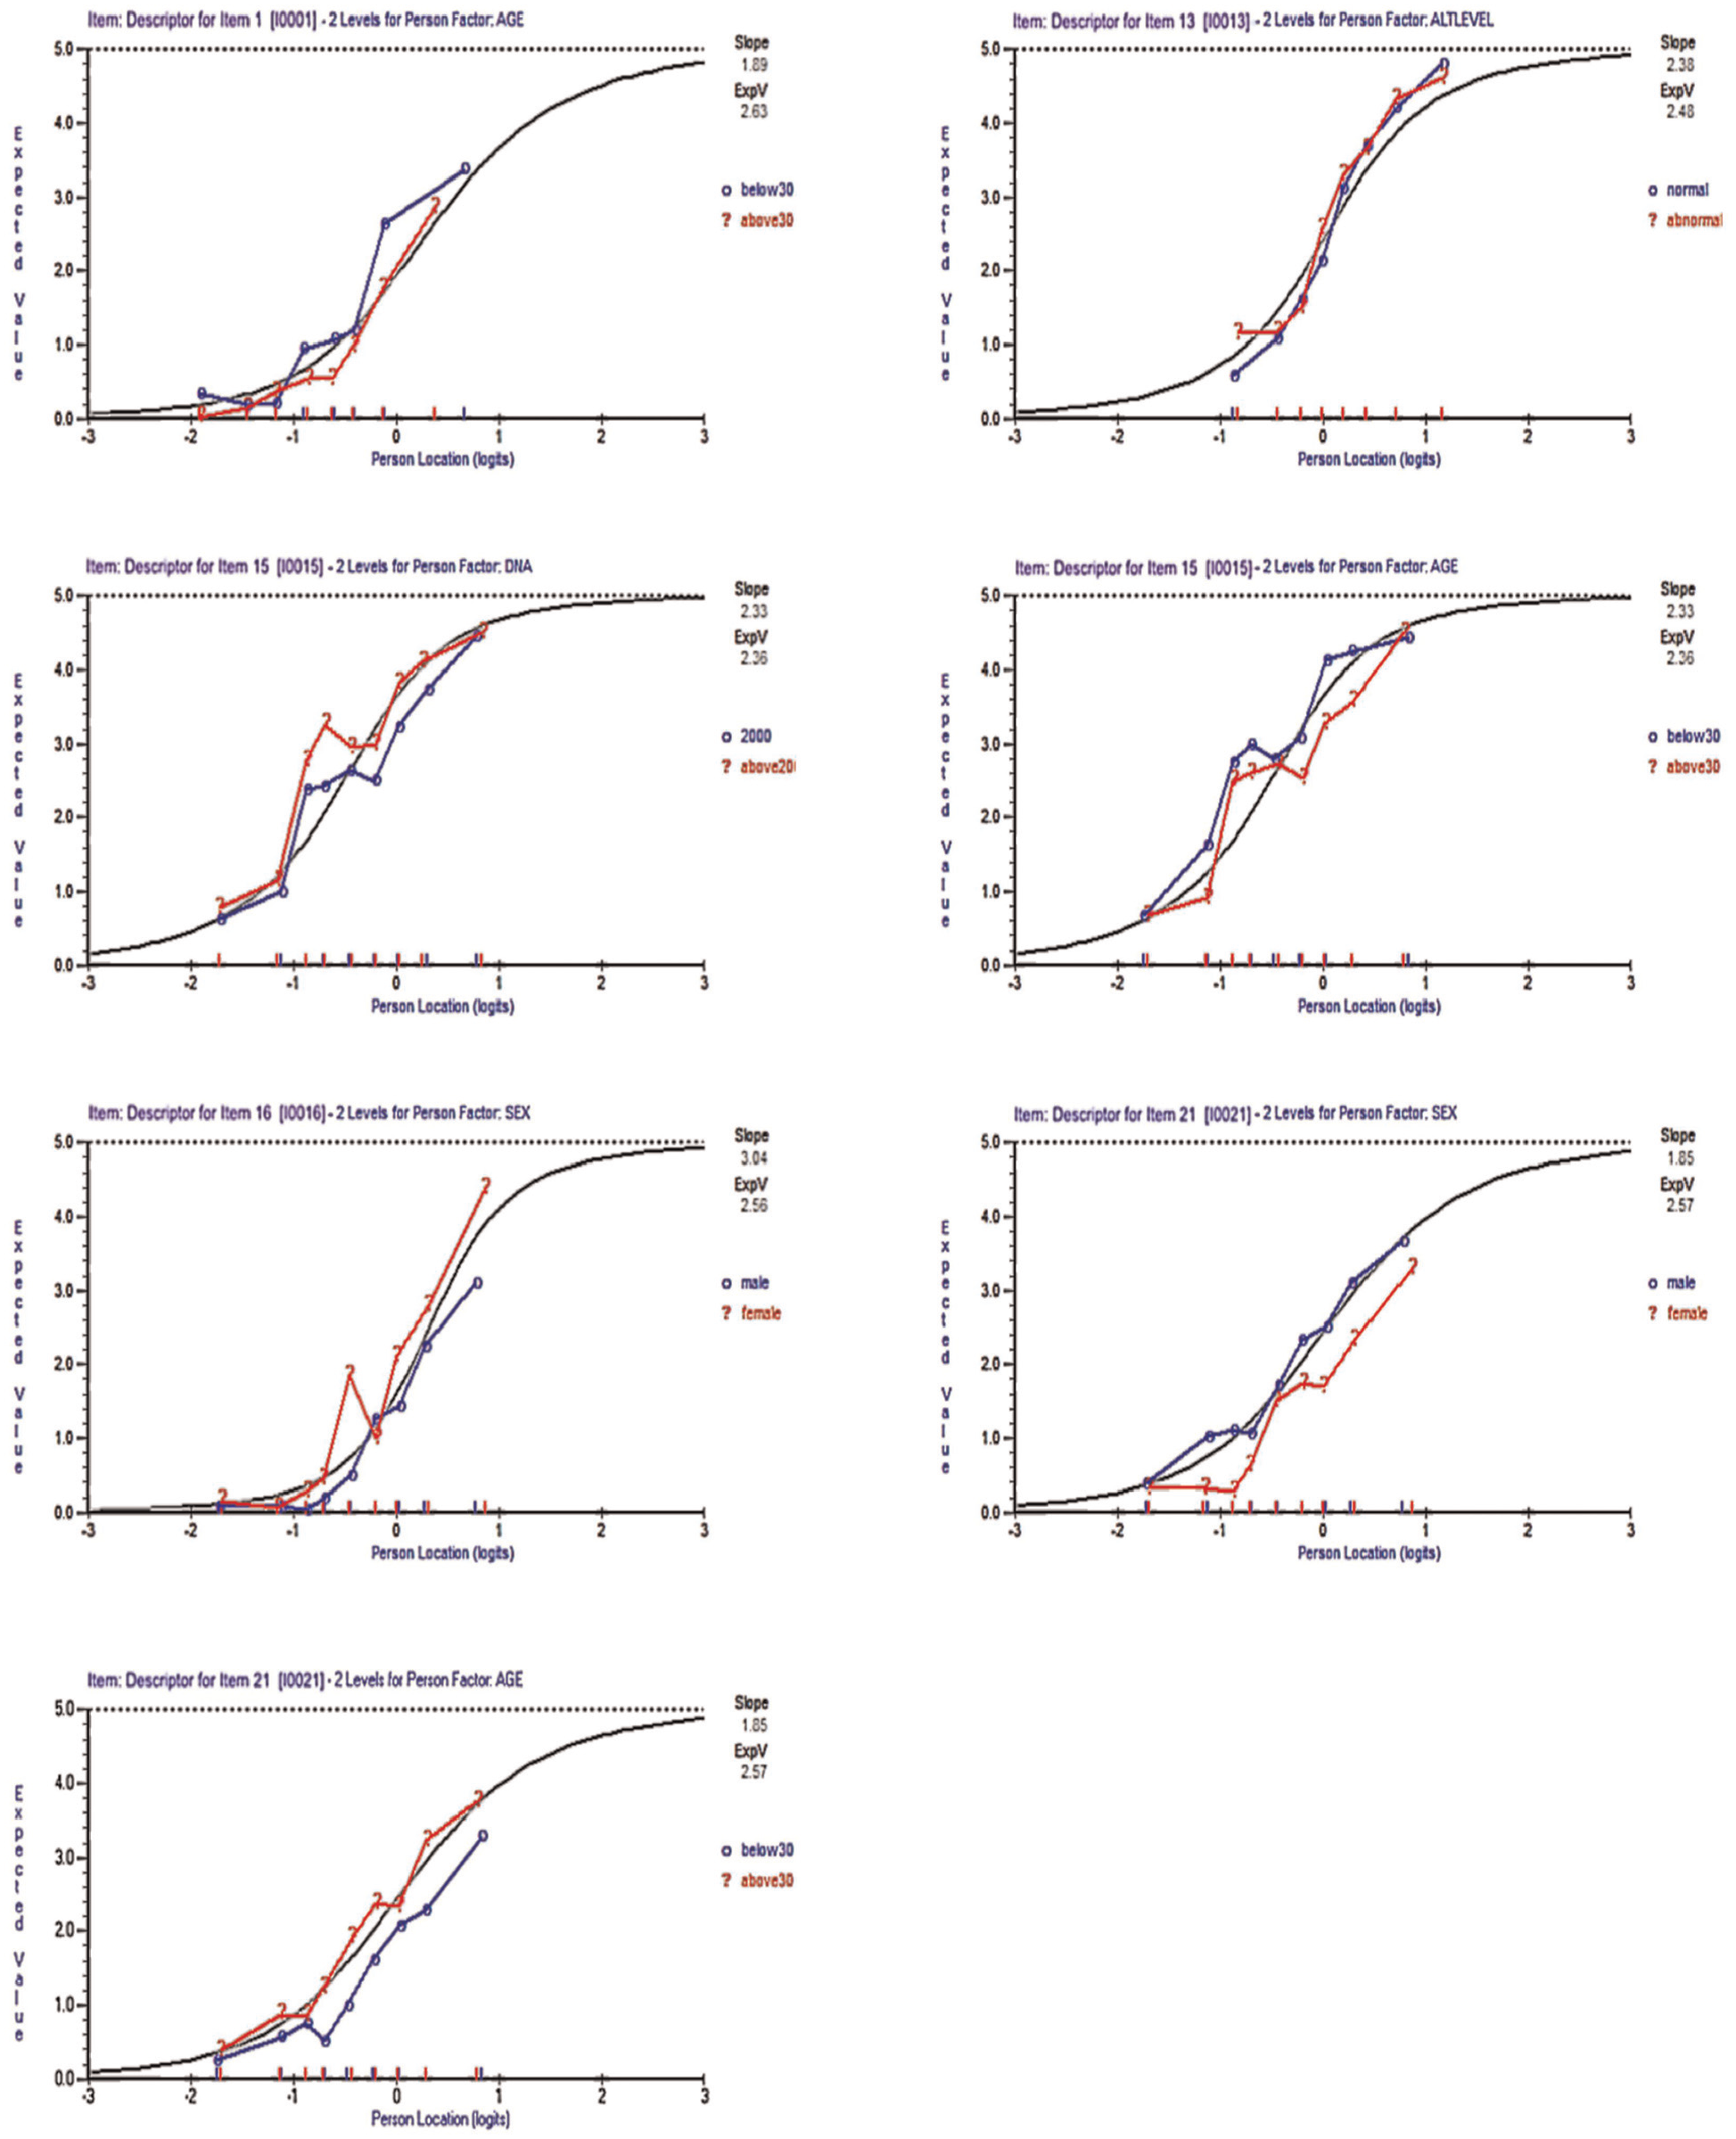
Uniform DIF Among Items 1, 13, 15, 16, and 21.
Upon examining, all items with uniform DIF had all three pseudo R2 < .13, it prompted that all uniform DIF’s effect was small (shown in Supplementary Figure 2). However, TCCs in somatic symptoms (Supplementary Figure 2 (2)) differed obviously with or without DIF on age group. It indicated that DIFs had significant impact on the test as a whole. So did TCCs in social stigma domain with or without DIF on the HBV-DNA status (Supplementary Figures 2 and 3). Thus, Items 1 and 15 were considered to be removed. TCCs of other items with uniform DIF showed the test responses characteristics in different subgroups in corresponding domains were similar, and DIF had negligible impact on the test as a whole.
Item Selection Results Based on IRT and the Rasch Model
This study removed Items 5, 15, 16, and 17 for the severely disordered thresholds. Furthermore, items with the absolute value of the FitResid > 2.50 were also removed (Items 8 and 12). Item 18 had an absolute value of the FitResid < 2.50 in the subsequent model fitting. In DIF analysis, Items 1 and 15 were prompted to remove. Therefore, 10 items were reserved in the CHBQOL-SF (see Table 5).
Rasch Analysis of Dimensionality and DIF for the Four Main Dimensions.

The absolute value of the Fit residual > 2.5 indicates the item fit not well.
DIF having obvious impact on the whole test of the corresponding domain.
indicated a more severe disordered threshold.
Degrees of freedom (329, 8), (334, 5), (212, 5), and (413, 67) respectively. bBonferroni adjustment with a probability base of 0.01 (p = .002 for Somatic symptoms, five items; p = .003 for Emotional symptoms, four items; p = .005 for Belief, two items; p = .008 for Social stigma, six items). cAge was split into two groups, like ≤ 30 and > 30 years old. dALT was split into normal and abnormal levels. eHBV-DNA was split into <2,000 and ≥2,000 IU/mL. fGender was split into male and female.
Overall Evaluation of CHBQOL-SF
The PCM was re-fitted, and parameters were estimated for the 10-item CHBQOL-SF. The overall model fit was good. The internal consistency reliability of CHBQOL-SF was .80, and the PSI was .76, both of which were >.70. It indicated that the reliability of the short form was substantial. Regarding each dimension, the reliability was also acceptable and the detailed information could be referred to Table 5. Meanwhile, the absolute value of the FitResid for each item was <2.5, and all items were free of disordered threshold, indicating an improved scale structure. Items threshold parameters of the CHBQOL-SF could refer to Supplementary Table 3. Overall, the average centralized thresholds were from −0.590 to 0.728, which was an appropriate range of item difficulty (Y. Kong & Zhang, 2009). Furthermore, the person-item maps of each dimension were used to compare the CHBQOL and the CHBQOL-SF (see Figure 4). It showed that the measurement ranges of the two versions were almost consistent. Thus, the CHBQOL-SF was more feasible since it reduced redundancy and maintained the accuracy of CHBQOL.
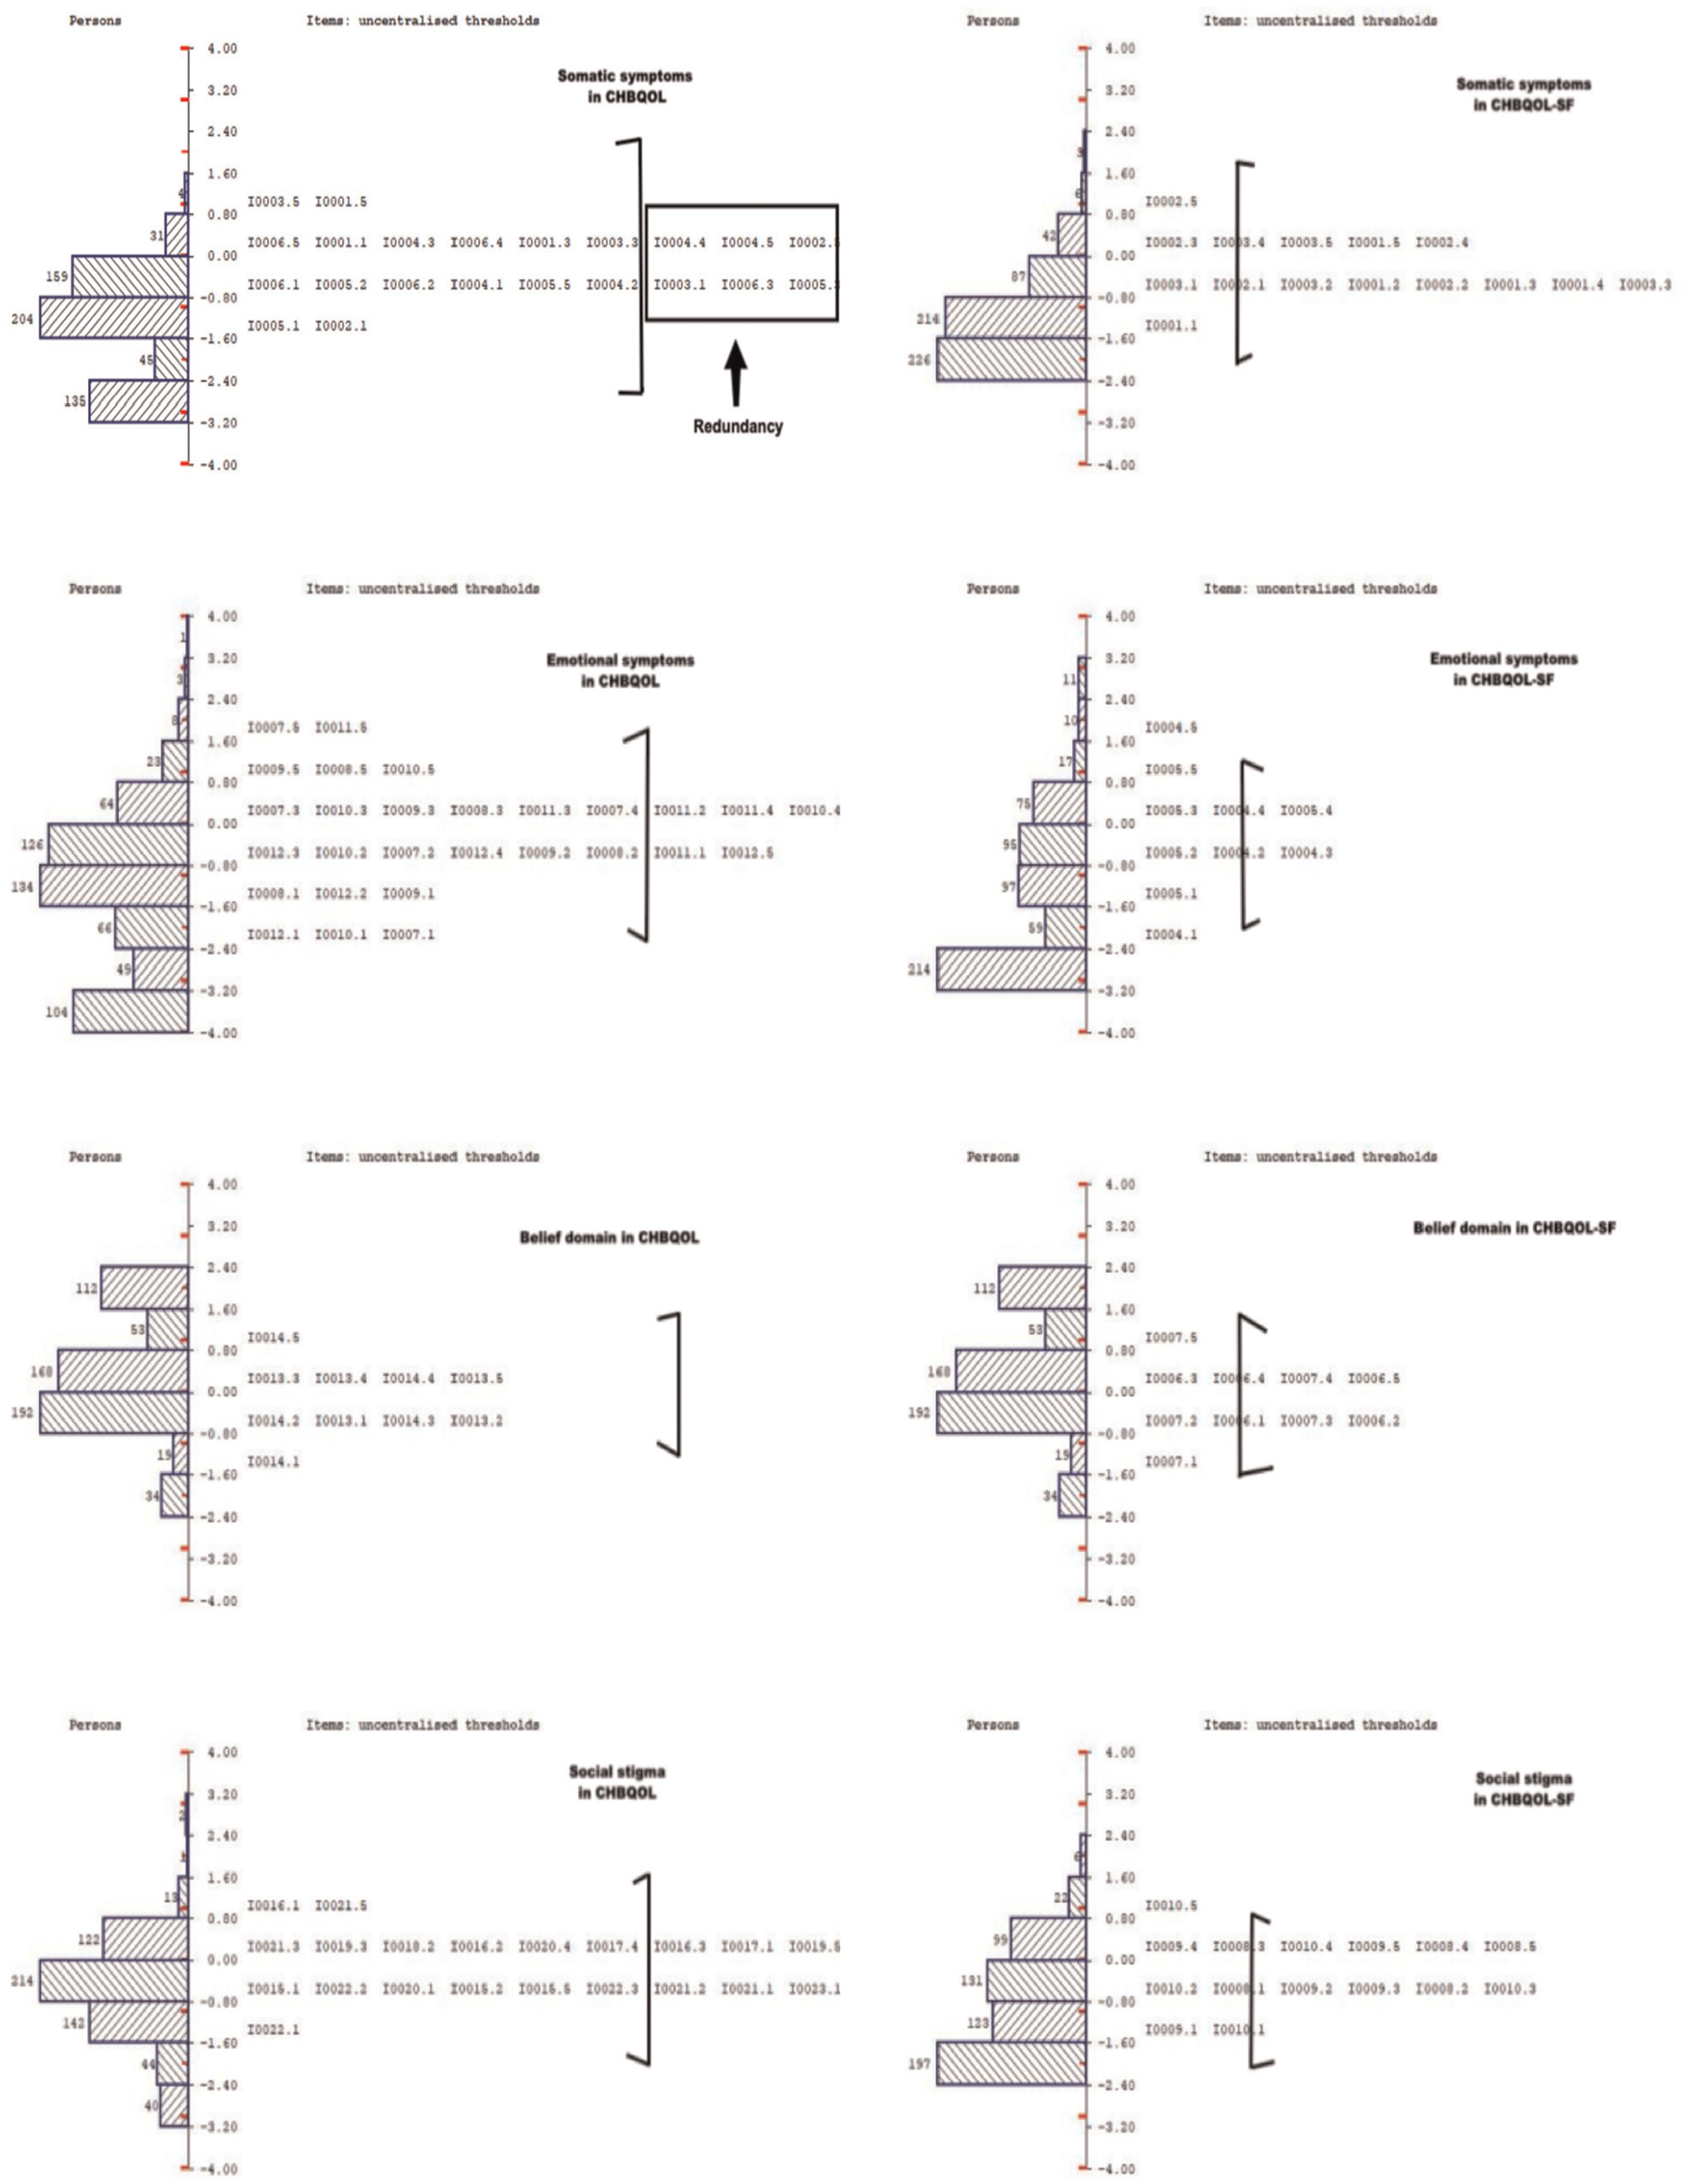
Comparisons of Measuring Ranges Between CHBQOL and CHBQOL-SF Among Four Dimensions.
From the professional perspective in the final Delphi round, the vast majority of the experts thought that the statistical analyses in the process of item screening were generally sound, with clear and reasonable procedures and layers of advancement. It could help the shorted measure obtain sufficient information. Only one expert suggested providing the item information indicator as another evaluation criteria, for which descriptions and analyses of IIC plots had been added in the previous analysis.
As a comparison and supplement, the GRM results finally retained nine items, while the overall model fit was moderate. From the comparisons in the present study, GRM results might be more conservative to the options’ categories settings and DIF analysis, while the majority of the items’ selection was the same within the two models. More detailed results of GRM, and the comparisons between GRM and PCM results could refer to the Supplementary Material 2.
Discussion
This study developed a 10-item CHBQOL-SF from both qualitative and quantitative perspectives, to meet the measuring needs of large-scale epidemiological or clinical monitoring. The qualitative perspective adopted the modified Delphi method and focused on the open and professional opinions of experts. Furthermore, the quantitative perspective performed the Rasch analysis on the cross-sectional data. Finally, 10 out of 23 items were selected as the CHBQOL-SF, which provided us with the richest information and kept the original four-dimension structure.
Item selection is an indispensable part of developing and refining measures. Holistic principles and perspectives would contribute to the retained items’ importance, sensitivity, independence, representativeness, and feasibility (Wan et al., 2016). The modified Delphi method is a subjective evaluation method. Experts were expected to evaluate the items’ importance with their clinical experiences and professional knowledge. This prior work would help avoid too much reliance on statistical results and enhance the content validity of CHBQOL-SF. In addition, quantitative statistics help evaluate the independence and sensitivity of the items. The modern measurement theory IRT allows for characterizing each item at the micro level. By selecting the most valuable items more efficiently, IRT methods such as Rasch analysis could help develop short forms of measures (Bjorner et al., 2004; Segawa et al., 2020; Younossi et al., 1999). It utilizes the nonlinear mathematical model to establish the relationship between subjects’ responses to items and their underlying traits (Reise & Henson, 2003). More detailed measurement and diagnostic information could be provided to identify problematic items and help improve the scale’s performance, in contrast to CTT (Petrillo et al., 2015). Thus, IRT and Rasch analysis could be more realistic and provide a microscopic perspective for exploring the quality of specific items (G. Chen & Chen, 2019). By carefully selecting better fitting items that maintain the scale properties within optimal parameters, Rasch item diagnostics reserve the ideal items of the original version and create a short form of the scale (Woudstra et al., 2019).
Nowadays, IRT is expected to be a basis for item selection. Some CTT-based measures can be further simplified with IRT, which helps reduce the burden on participants and enhance their clinical applicability (Galindo-Garre et al., 2015). Francis et al. shortened the knee and hip osteoarthritis quality of life measure (OAKHQOL) utilizing IRT. The short version, Mini-OAKHQOL, showed comparable psychometric properties to the original scale (Guillemin et al., 2016). Also, Lin et al. developed a 12-item brief version of the WHO Quality of Life Scale for Older Adults (WHOQOL-OLD-12) using IRT, retaining the structure of the original scale (Y. Li & Fang, 2011). A vital feature of the IRT in instrument development is to reflect the maximum amount of information with the most concise items. To optimize the overall measure and item quality, researchers tended to re-evaluate the dimensional structure and item quality of existing measures based on IRT. The increasing applications of IRT in patient-reported outcome research proved that it could facilitate scale development, item selection, and item quality analysis (W. L. Wang & Zhou, 2018).
It must be recognized that this study adopted the Rasch unidimensional measurement model while the brief scale is multidimensional and could yield a single score. Thus, a bi-factor model was estimated in the present study, which allowed the calculation of the coefficients omega and omegaH (Rodriguez et al., 2016). The two coefficients indicated that the general factor could determine the full scale to a large extent, justifying the use of a single score for CHBQOL-SF despite of the multidimensionality. However, the bi-factor model fit was ideal, representing the rationale of estimating the bi-factor model. Further comparisons found its better fit than the four-factor models of both the 17-item scale retained from the Delphi method and the original 23-item CHBQOL.
IRT has apparent advantages in item selection by restricting location parameters (Pang et al., 2014). In this study, the average thresholds of the items to be selected were from -0.735 to 0.711, with an appropriate range of items difficulty. Studies have suggested that the absolute value of the difficulty parameter >2.95 indicates the item is too difficult or too easy (Y. Kong & Zhang, 2009). Item 1 (Feel nauseated) had an enormous mean threshold, which meant that it was the most difficult for patients with CHB to obtain a higher score on the item. Item 13 (Believe hepatitis B can be cured) had the least mean threshold, representing that patients could obtain higher scores on this item more quickly. In the Rasch analysis, disordered thresholds are essential for item reduction or option setting adjustment. Item 16 (My family will despise me) was with the most disordered thresholds. The last centralized threshold for Item 16 was -0.14 (<0), indicating that the majority of patients with CHB tended to ignore the “very much” option in terms of “my family will despise me.” In other words, it reflected that they would not commonly worry about being despised by their families. On the contrary, families might be their primary source of social support, especially in Chinese culture (Y. Wang et al., 2003). Besides, Items 1 (Feel nauseated) and 21 (Decreased social activities) had disordered thresholds between options 1 and 2. It indicated that option 1 adequately represented both options to measure how much the item affected the patients’ daily lives. Thus, options 1 and 2 could be considered to be combined. In one previous study, Marie and colleagues found that only two items showed ordered thresholds under the original 6-point Likert-type settings when performing a Rasch analysis of the 10-item Major Depression Inventory (MDI). After option 2, 3, and 4 were combined as a 4-point options setting, all thresholds of the items were in order (Nielsen et al., 2017). Similarly, in a Rasch analysis of the Physical Function of the International Classification of Functioning, Disability and Health (ICF) for spinal cord injury care, K. Li et al. (2017) proved that the adjusted option setting contributed to the thresholds’ stepwise increasing trend. Therefore, adjusting the item option settings could effectively solve the problem of disordered thresholds and finally improve the overall fitting. In the future, the feasibility of the 5-point response category of CHBQOL-SF can be further explored.
Furthermore, due to the unidimensionality assumption, substantially different characteristics across different subgroups could reduce items’ internal validity in the Rasch analysis. Thus, DIF detection is also pivotal in optimizing the items and interpreting the measure (Amin et al., 2012; Lutomski et al., 2016). Silvia et al. removed three items with nonuniform DIF when developing a short version of the Illness Denial Questionnaire (IDQ) (Rossi Ferrario et al., 2019). As mentioned in the methods section, there are two types of DIF: uniform and nonuniform. In re-evaluating the parent proxy reported children’s quality of life scale, Leila et al. detected the uniform DIF among items of the physical functioning dimension across different age groups. Younger children indeed could not express health concerns to their parents as clearly as older children. As proxies, parents were less likely to report it, which resulted in biased responses (Amin et al., 2012). Researchers suggested that items with nonuniform DIF could be considered for removal. However, items with uniform DIF could be improved by weighting methods. However, it might be inherent among different populations rather than bias caused by the item (Lutomski et al., 2016; Pallant et al., 2006).
In this study, all DIFs detected were uniform DIFs. Upon examining by the pseudo R2 and TCC, Items 1 and 15 were suggested to remove and the existence of DIF had obvious impact on their overall domains’ test. Nevertheless, it is also necessary to try to figure out why the differences exist. Items 1 (Feel nauseated), 15 (Transmission to others), and 21 (Decreased social activities) with uniform DIF between two age groups. Older patients responded less to items 1 and 15 but more to Item 21. They were found to be more sensitive to nausea and vomiting symptoms and transmission to others. In contrast, they were less likely to worry about decreased social activities than patients ≤30 years old. It might be that older people (>30 years old) tend to take on more family and social responsibilities and pressures, which makes them more worried about somatic symptoms and transmissions. However, as they age, they might have less time and energy to engage in too many social activities. More attention might have been paid to their family and work. However, younger people had more enthusiasm for social activities and interactions and were more curious about the unknown. Even more activities tend to be geared toward young people. Thus, younger people could be more concerned about decreased social activities. Items 16 (My family will despise me) and 21 (Decreased social activities) had uniform DIF between gender subgroups. Females showed less sensitivity to family discrimination and could capture more of a family’s support than males. It might closely relate to a female’s delicate emotional perception (Samulowitz et al., 2018). In contrast, females worried more about decreased social activities in this study. Indeed, social activities and gatherings gave them chances to escape from household chores and express emotions (Cheng et al., 2014). Uniform DIFs were also found in items 13 (Believe hepatitis B can be cured) and 15 (Transmission to others) across different physiological indicators (ALT status and HBV-DNA). It must be acknowledged that the impact of DIF was not allowed to estimate in the software toward the domain with only two items. However, the brief scale originally aimed to retain at least two items in each domain for acceptable content validity and model structure. To be more rational, possible causes of DIF were discussed. Patients with abnormal ALT levels were more likely to believe that chronic hepatitis B can be cured. Besides, patients with HBV-DNA above the detection limit (2,000 IU/mL) were less concerned about transmission to others. It might be that patients with worse physiological status experienced psychological adjustments after frequent or long-term treatment and owned more confidence in treatment. Meanwhile, out of health concerns, they were more likely to take the initiative to acquire disease-related knowledge. Thus, they could reduce unnecessary worries such as transmission, obtain posttraumatic growth (Lau et al., 2018), and better cope with CHB, also known as the Response Shift phenomenon (Rapkin & Schwartz, 2004).
Overall, CHBQOL-SF retained three items in somatic symptoms, two items in emotional symptoms, two items in belief, and three items in social stigma. The four-dimension structure of CHBQOL-SF was consistent with that of the original version. In retrospect, we found all 10 items loaded highly in their respective dimensions in the exploratory factor analysis of the original version (Zhu et al., 2019). It also demonstrated the representation of items in the short form to some extent. We organized the Delphi group again to review the final shortened measure. The adequacy statistical analysis in the process of item screening was recognized to help the shorted measure obtain sufficient information. However, compared with the previous short-form measure of CHB patients (Plas et al., 2004), CHBQOL-SF also measures emotional status, beliefs about treating the disease, and social stigma domains. Despite containing only 10 items, it still could reflect CHB patients’ HRQoL from more comprehensive aspects. Thirteen Delphi experts, including clinical doctors, also agreed to the substantive value of CHBQOL-SF. It could help understand patients’ situations and HRQoL, and guide clinical practice such as disease diagnosis and prognosis. The development of the short form will aid the efficiency of measuring patient-reported outcomes in routine clinical practice and research. It will also have important and far-reaching significance in advancing the HRQoL involvement in clinical application.
Meanwhile, it must be acknowledged that the application of one-parameter model (e.g., PCM) or two-parameter model (e.g., GRM) always attracts controversy in PRO fields toward items’ evaluation and selection. The present study adopted a one-parameter model PCM analyzing items’ parameters. It is applicable on polytomous scoring items, and allows the CPCs and rankings of thresholds parameters (β i ) to be checked for categories’ order violations, which could not be estimated with GRM. However, PCM indeed could not provide another essential parameter, discrimination parameter, which could be provided in GRM results. For a dispassionate discussion, we conducted the item analysis and selection completely in GRM as a comparison in the Supplementary Material 2. Finally, GRM results retained nine items, and the main differences between GRM and PCM results were in three items (Items 9, 12, and 18). For the item analysis, GRM might be more conservative in options’ category settings evaluations compared with PCM results. The CCCs of Items 9 and 18 in GRM showed inversion, prompting inappropriate setting of options for the two items. However, Items 9 and 18 did not show options’ ordered violations in PCM, and they two were retained combined other acceptable indices. Item 12 was removed for its too large fit residual in PCM, which prompted poor item quality. However, CCCs, difficulty parameters (βi) and discrimination parameter of Item 12 were all ideal and it was retained in GRM results. Regarding other 14 items, GRM and PCM showed the same selection results. For DIF, seven items showed uniform DIF and three items showed nonuniform DIF in GRM results. However, PCM results just prompted five items showing uniform DIF and no item showed nonuniform DIF. Among these five items with uniform DIF in PCM results, four of them showed the same DIF in the GRM results. The remaining one was Item 13 in Belief domain, whose DIF could not be reported in R software due to only two items in one domain. Thus, GRM results might be more conservative. For the overall evaluation, both GRM results and PCM results had better model fit of the brief version than that of the original CHBQOL, whereas GRM results somehow showed moderate item quality. Relatively, the GRM results were more conservative than PCM results based on this study, while more evidence needs to be further explored. In summary, both GRM and PCM could be applied on polytomous scoring items, complied with the same assumptions, while one-parameter model PCM and two-parameter mode GRM could provide some different information from different perspectives. Thus, the choice of two models requires a comprehensive consideration of item options, dimension settings, the number of items, characteristics of sample populations, etc., depending on the particular research.
Several potential limitations of this study should be stated. First, this study used the RUMM software and selected the PCM in the Rasch model for parameter estimation in the IRT analysis. The discrimination parameter could not be estimated in such one-parameter model. For a supplement and comparisons of different results, we estimated a two-parameter model GRM in the Supplementary Material 2. Also, the Rasch model and PCM complied with the assumption of unidimensionality, which would ignore the correlation among dimensions. Multidimensional IRT analysis and nonparametric IRT models could be further explored. Second, the CHBQOL-SF developed in this study has only 10 items. It indeed could minimize the subjects’ response time and improve the adherence and efficiency of the clinical application of the measure. However, the short form was only screened based on the results of the expert consultants and IRT analysis. Its reliability, responsiveness, and equivalence with the full scale must be further verified in the independent sample population survey. Third, guided by the item difficulty analysis, response options’ settings could be revised and further explored about the feasibility, advantages, and disadvantages of 5-category option settings. Fourth, the minimal clinically important difference (MCID) for the CHBQOL-SF can also be explored to further illustrate its clinical significance.
Conclusion
In summary, this study developed the 10-item CHBQOL-SF based on the original version. The modified Delphi method provided the professional importance evaluation of the items, and six items were recommended to be removed. The Rasch analysis helped select better-fitting items while maintaining the scale properties within optimal parameters. After combining results from the item difficulty analysis, DIF analysis, and the fit of the unidimensional Rasch models, another seven items were removed. Applying the Rasch model increased the interpretation of scores for clinical decision-making by analyzing individual response patterns. The 10-item CHBQOL-SF would substantially reduce the measurement burden and promote its inclusion in large-scale epidemiological or clinical applications. However, its complete psychometric properties and equivalence with the original instrument could be further examined in an independent sample.
Supplemental Material
sj-docx-1-asm-10.1177_10731911251321922 – Supplemental material for Development of the Short Form for Chronic Hepatitis B Quality of Life Instrument (CHBQOL-SF) Using Delphi Method and Rasch Analysis
Supplemental material, sj-docx-1-asm-10.1177_10731911251321922 for Development of the Short Form for Chronic Hepatitis B Quality of Life Instrument (CHBQOL-SF) Using Delphi Method and Rasch Analysis by Renjun Gu, Lin Zhu, Jingxia Kong, Li Zhang, Mengna Song, Xiao Cheng, Donald L. Patrick and Hongmei Wang in Assessment
Footnotes
Acknowledgements
We wish to thank the patients for their participation. We are also thankful to physicians and nurses in the Department of Infectious Diseases of six cooperative hospitals for their kind help during data collection.
Declaration of Conflicting Interests
The author(s) declared no potential conflicts of interest with respect to the research, authorship, and/or publication of this article.
Funding
The author(s) disclosed receipt of the following financial support for the research, authorship, and/or publication of this article: This study was supported by National Natural Science Foundation of China (Grant No.71573226) and Clinical Research Project of Shanghai Municipal Health Commission (Grant No.202140314).
Ethical Approval
All procedures performed in studies were approved by Zhejiang University School of Public Health Ethics Committee (ZGL201501-1).
Consent to Participate
All patients provided written informed consent to participate in the study.
Availability of Data and Materials
The data sets used and/or analyzed during the current study are available from the corresponding author on reasonable request.
Supplemental Material
Supplemental material for this article is available online.
References
Supplementary Material
Please find the following supplemental material available below.
For Open Access articles published under a Creative Commons License, all supplemental material carries the same license as the article it is associated with.
For non-Open Access articles published, all supplemental material carries a non-exclusive license, and permission requests for re-use of supplemental material or any part of supplemental material shall be sent directly to the copyright owner as specified in the copyright notice associated with the article.