
Abstract
The Hierarchical Taxonomy of Psychopathology (HiTOP) has gained significant traction in clinical psychological science. However, HiTOP has not been extensively validated across diverse populations. This study tested measurement invariance—the degree to which latent constructs are measured with equivalence across groups—in HiTOP across racial and ethnic groups using the Child Behavior Checklist (CBCL) in the Adolescent Brain Cognitive Development (ABCD) Study. These models were followed with rigorous tests of construct validation (i.e., convergent, discriminant, and concurrent) on the latent factors using a Multitrait-Multimethod (MTMM) framework. Comparing across non-Hispanic White (n = 7,166), Hispanic (n = 2,411), and non-Hispanic Black (n = 1,862) youths, the five-factor model comprising Externalizing, Neurodevelopmental, Internalizing, Somatoform, and Detachment factors demonstrated configural, metric, scalar, and strict measurement invariance. While each of the five factors demonstrated good evidence of concurrent and convergent validity, evidence for their discriminant validity was not as robust. Establishing measurement invariance and construct validity of the HiTOP model has critical scientific and clinical implications, particularly if dimensions are to be used in addressing mental health disparities in minoritized populations.
The U.S. population is becoming increasingly racially and ethnically diverse. According to the 2020 U.S. Census, Hispanic or Latino and Black populations rose by 23% and 5.6% since 2010, now making up 18.7% and 12.4% of the total U.S. population, respectively (U.S. Census, 2020). Concurrently, rates of mental disorders continue to rise (Bitsko et al., 2018), disproportionately among racial and ethnic minority youths (Whitney & Peterson, 2019). These populations face unique challenges, including higher rates of co-occurring mental health conditions (Ahmed & Conway, 2020; Weller et al., 2018) and lower utilization of mental health services compared to non-Hispanic White populations (Merikangas et al., 2011; Wang et al., 2005). These issues are compounded by a relative scarcity of research that focuses on racial and ethnic minority mental health more generally (see review by Buchanan et al., 2021). For example, Rodriguez-Seijas, Li, and colleagues (2023) reviewed 543 articles published between 2013 and 2020 in a prominent clinical psychological science journal and found that only 23 (4.2%) focused on issues related to race or ethnicity. Research on the intersection of mental health and race and ethnicity is paramount considering the growing mental health needs among rapidly changing racial and ethnic demographics in the United States.
The Hierarchical Taxonomy of Psychopathology (HiTOP; Kotov et al., 2017, 2022) is an empirically driven framework that has gained significant traction in the clinical psychological sciences. It addresses many of the limitations associated with the Diagnostic and Statistical Manual of Mental Disorders (DSM; American Psychiatric Association, 2013), including that the diagnostic criteria often rely on arbitrary symptom thresholds, resulting in clinical samples with heterogeneous clinical presentations and excessively high rates of co-occurrence among disorders. Unlike the DSM, HiTOP empirically quantifies the covariation among symptoms, whereby higher-order dimensions subsume correlated lower-order dimensions (Kotov et al., 2017). Despite its promising utility for clinical science and practice (Kotov et al., 2022), there are some major shortcomings of the current model. First, there is a relative dearth of HiTOP research focused on child populations when compared to the amount of research conducted in primarily adult populations (Forbes et al., 2024; Michelini et al., 2024; Ringwald et al., 2023). This knowledge gap is further reflected in the fact that the new measure of HiTOP under development (Simms et al., 2022) is not designed to be applicable to youths (Tackett & Hallquist, 2022). Second, and following from the first shortcoming, whether HiTOP is generalizable across racially and ethnically diverse groups is also understudied, as most of the existing HiTOP research relies on samples comprised of predominantly White populations (see review by Rodriguez-Seijas, Li, et al., 2023). These growing scientific gaps are concerning because they clearly affect the equitable dissemination and implementation of HiTOP research into practice (Cicero et al., 2024).
Given the lack of an HiTOP-specific instrument to assess dimensions in youths, researchers often use the Child Behavior Checklist (CBCL; Achenbach & Rescorla, 2004) as a proxy measure due to its strong validity, high degree of reliability, as well as breadth of coverage with respect to assessing behavior, cognition, and temperament (Conway et al., 2023; Forbes et al., 2024; Moore et al., 2020). Indeed, prior research suggests that the factor structure of the CBCL maps onto most of the dimensions of the HiTOP model. Michelini and colleagues (2019) used baseline (9- to 10-year-olds, N = 9,987) data from the Adolescent Brain Cognitive Development (ABCD) Study® to show that items from the CBCL mapped onto five factors that were comparable to the HiTOP dimensions: Internalizing, Externalizing, Neurodevelopment, Somatoform, and Detachment. Specifically, the Internalizing dimension consisted of symptoms such as feeling sad, feeling fearful or anxious, and being easily embarrassed. The Externalizing dimension consisted of symptoms such as impulsive actions, destroying things, and being disobedient. The Neurodevelopment dimension consisted of symptoms such as strange behaviors, concentration problems, and failing to finish tasks. The Somatoform dimension consisted of symptoms such as being overtired without good reason, feeling dizzy or lightheaded, and feeling pain or aches. The Detachment dimension consisted of symptoms such as socially withdrawn, underactive, and secretive. Their study is noteworthy because it was among the first to use a large and well-characterized child study population to identify the HiTOP structure. However, ABCD is a racially and ethnically diverse sample, and the authors did not assess whether the HiTOP dimensions they identified exhibited meaningful measurement invariance across racial and ethnic subgroups.
Measurement invariance is a fundamental aspect of establishing validity (Cicero & Ruggero, 2021; He & Li, 2021). Testing for measurement invariance typically involves identifying differences in the factor structure, item loadings, item intercepts/thresholds, and error variances across groups. When measurement invariance is present, the measure can be assumed to reflect the same underlying construct or phenomenon across these groups. Failure to identify measurement invariance may lead to systematic measurement errors or biases by way of confounding observed group differences in the mean level of dimensions and their associations with other constructs (Borsboom, 2006; Fischer & Karl, 2019; Hillemeier et al., 2007). One example of this issue comes from a study examining the structure of the widely used Personality Inventory for DSM-5 (PID-5). Bagby et al., (2022) conducted tests of measurement invariance across White and Black Americans enrolled in college. While a five-factor solution was identified in the White American group, only a single-factor solution was identified in the Black American group, leading the authors to conclude that the PID-5 is not factorially invariant across Black and White Americans. Without establishing invariance of measurement scales or models, resulting observed group differences across race may be confounded by measurement issues (Kim & Yoon, 2011).
The literature on measurement invariance in HiTOP with respect to youths and across racial and ethnic subgroups is still nascent, but there is emerging evidence that the hierarchical structure of psychopathology exhibits invariance across race and ethnicity. However, these studies all feature some noteworthy limitations that warrant cautious interpretation. Hoffmann et al. (2021) tested 11 factor models from the CBCL in a cohort of youths and young adults (N=7,011, ages 5–22). They found invariance of all structural models in their diverse sample. However, the authors combined all individuals who identified as either of Asian, Black, Mixed, Native American, or other into a single “non-White” category, thereby assuming homogeneity among individuals of non-White racial and ethnic backgrounds. Another study conducted confirmatory factor analysis (CFA) of items across the eight-syndrome scales of the CBCL in 30 different societies (i.e., countries and regions; N = 61,703) and found that evidence of configural invariance of an eight-factor model across all societies (Ivanova et al., 2019). However, the researchers did not provide robust support for scalar invariance across societies (i.e., invariance of item loadings and thresholds), which may not be surprising when considering that some of the societies in their study were quite a bit more racially and ethnically heterogeneous (e.g., the United States) than others (e.g., Japan). He and Li (2021) tested for measurement invariance in the latent factor structure of 15 mental disorders ascertained by a computerized, semi-structured interview in a large sample of White (n = 5,147) and Black/African American (n = 3,088) youths and young adults aged 8–21 years (N = 8,235) in the Philadelphia Neurodevelopmental Cohort. They found evidence for configural invariance when comparing the bifactor model across White and Black/African American groups. However, this study utilized DSM-informed diagnoses as observed indicators in their models, which is a crucial limitation given the aforementioned shortcomings of the DSM (e.g., arbitrary symptom thresholds, heterogeneity of clinical presentations, excessive comorbidity among disorders, etc.).
Finally, Stewart and colleagues (2024) conducted tests of measurement invariance in non-Hispanic White, non-Hispanic Black/African American, non-Hispanic biracial White and Black/African American, and Hispanic White subgroups using items from the CBCL in the same ABCD Study® 9 to 11-year-old cohort as reported in Michelini et al. (2019). They found that the five-factor model that was identified in Michelini et al. (2019), comprising Externalizing, Detachment, Neurodevelopment, Internalizing, and Somatoform latent dimensions, demonstrated full measurement invariance (i.e., metric, scalar, residual, and latent variances) across the four racial and ethnic subgroups they studied. Furthermore, their study reported on several latent mean differences between racial and ethnic subgroups (e.g., non-Hispanic White and Hispanic White participants had lower latent mean scores on Externalizing than compared to Black/African American and biracial participants). However, an important limitation was that the latent CBCL dimensions for each racial and ethnic group were not validated (e.g., convergent, discriminant, and/or concurrent), leaving open the important question of whether HiTOP dimensions reflect conceptually meaningful indicators of risks across the racial and ethnic groups.
Crucially, testing for measurement invariance is only one step, albeit an important one, in validating constructs for cross-group comparisons (Cicero & Ruggero, 2021; Meredith, 1993; Vandenberg & Lance, 2000). Establishing convergent/discriminant validity and concurrent validity ensures that the construct not only operates similarly across groups but also meaningfully relates to theoretically relevant variables and remains distinct from unrelated constructs, thereby supporting its utility in clinical science research (Campbell & Fiske, 1959; Cronbach & Meehl, 1955). Thus, the overarching aims of our study are to rigorously (a) test for measurement invariance (i.e., configural, metric, scalar, and strict invariance) and (b) validate the resultant HiTOP models and dimensions using multiple methods in ABCD Study® data across three of the largest racial and ethnic subgroups in the data set: Hispanic, non-Hispanic White, and non-Hispanic Black participants. With respect to the first aim, we expect to replicate the hierarchical structure of HiTOP as previously identified from the CBCL (Michelini et al., 2019). We also expect to replicate the finding of full measurement invariance across the racial and ethnic groups (Stewart et al., 2024). Because of the dearth of literature as it pertains to HiTOP measurement invariance across race and ethnicity in youths, we focused our analysis on the baseline wave of data when participants were 9 to 10 years.
For our second aim, we tested the convergent/discriminant and concurrent validity of our resultant HiTOP models across racial and ethnic groups using the Multitrait-Multimethod (MTMM) framework (Campbell & Fiske, 1959; Cronbach & Meehl, 1955). Convergent validity is supported when a construct correlates with other validated measures of the same construct, including measurements assessed by different informants (Campbell & Fiske, 1959; De Los Reyes et al., 2015). Discriminant validity refers to the degree to which a construct is not strongly related to measures of different or putatively unrelated constructs (Campbell & Fiske, 1959). Our MTMM matrix is comprised of three methods (and different informants) to assess for the convergent and discriminant validity of our CBCL latent factors across race and ethnicity: caregiver ratings of eight psychiatric disorders from a semi-structured diagnostic interview (i.e., the Kiddie-Schedule for Affective Disorders and Schizophrenia for Diagnostic and Statistical Manual Disorder [K-SADS], and teacher and youth self report ratings for Internalizing, Externalizing, and Attention Problems factors from the Brief Problem Monitor [BPM]) (Achenbach et al., 2011). In line with expectations of convergent validity, we expect to observe robust correlations for the same/similar trait across different methods (i.e., “monotrait-heteromethod,” e.g., CBCL Externalizing vs. BPM Teacher and Youth Self Reports Externalizing and K-SADS oppositional defiant and conduct disorders). In line with discriminant validity, we expect that correlations between different traits measured with the same method (“heterotrait-monomethod,” e.g., correlation between CBCL Externalizing vs. Internalizing) to be lower than correlations observed between the same/similar trait measured with different methods (i.e., “monotrait-heteromethod,” e.g., CBCL Externalizing vs. BPM Teacher and Youth Self Reports Externalizing and K-SADS oppositional defiant and conduct disorder). In addition, we expect that correlations between different traits and different methods will be generally low (i.e., “heterotrait-heteromethod,” e.g., CBCL Externalizing vs. BPM Teacher and Youth Self Reports Internalizing and K-SADS major depressive disorder).
Finally, concurrent validity is supported when a construct correlates with theoretically related constructs from measures administered at the same time as the focal construct (Cronbach & Meehl, 1955). To test the concurrent validity of our latent constructs, we examined the correlations of CBCL latent factors with concurrently measured neurocognitive outcomes via the NIH Toolbox. There is well-established evidence of dysfunction across various aspects of neurocognition (e.g., intelligence quotient [IQ]) across each HiTOP dimension (Kotov et al., 2020; Krueger et al., 2021; Watson, Levin-Aspenson, et al., 2022). Some researchers have even posited that neurocognitive dysfunction, despite its clear cross-loadings across the HiTOP spectra, may itself be a unique construct within the HiTOP model (see meta-analysis by Ringwald et al., 2024). As such, we expect to observe negative correlations of the CBCL latent factors with Crystalized and Fluid Cognition scores from the NIH Toolbox across racial and ethnic groups.
Method
Sample
We report how we determined our sample size, all data exclusions, all manipulations, and all measures in the study. The ABCD Study® is a prospective longitudinal study of 9- to 10-year-old youths from 21 study sites across the United States. Participants were recruited from schools, selected based on age, gender, race and ethnicity, sociodemographic status, and urbanicity. The sample was recruited to closely reflect the socio-demographics of the United States population. An extensive array of data was collected, including brain imaging, genetics, neurocognitive outcomes, mental health, and family, community, and environment. The current release of the study contains the full data from baseline, 6-month, 12-month, 18-month, 2-year, 30-month, and 3-year follow-up as well as interim data from 42-month visits and 4-year follow-up. The present study utilized data from 9,456 youths collected at baseline. Based on parent report, the assigned sex was female for 47.59%, 47.30%, and 49.30% among the Hispanic, non-Hispanic White, and non-Hispanic Black groups, respectively (see Classification of Race and Ethnicity in ABCD for more details). The ABCD Study® is publicly available to researchers upon signing a research use agreement. Thus, this study was exempt from requiring approval from the Institutional Review Board of the University of Wisconsin-Madison.
Classification of Race and Ethnicity in ABCD
The ABCD Study® team categorizes individuals into one of five groups based on the parent and/or caregiver report of the youth’s race and ethnicity during the baseline visit: Hispanic (i.e., Hispanic, Latino, Latina), White, Black, Asian, and Other. Respondents could only select among White, Black, and Asian if Hispanic was not also selected. The Other category consisted of individuals who (a) selected Other and did not select Hispanic or (b) selected more than one race (i.e., White, Black, Asian) and did not select Hispanic. Using this scoring algorithm, the analytic sample in the current study consisted of 2,015 Hispanic youths, 6,021 non-Hispanic White youths, and 1,420 non-Hispanic Black youths (see Table 1 and Supplemental Table S1 for descriptives on these subsamples). Individuals in the Asian group were not included in the analysis due to their comparatively smaller sample size and corresponding concerns about statistical power and analytic convergence of the models (Asian n = 252). In addition, individuals in the Other group (n = 1,247) were also not included in the study due to their ambiguous racial and ethnic composition, heterogeneity, and consequently, unclear interpretation from a results standpoint. We acknowledge that race and ethnicity are complex social constructs, sometimes even considered as proxies for sociodemographic differences between groups (Brown et al., 2013; Cénat et al., 2024). Race and ethnicity also intersect with other social identities and processes such as socioeconomic status and gender, which together form cultural identities that are multidimensional and dynamic (Brown et al., 2013; Causadias & Cicchetti, 2018). Thus, we acknowledge that this approach to classification may not capture the full complexity of this construct.
Descriptives.
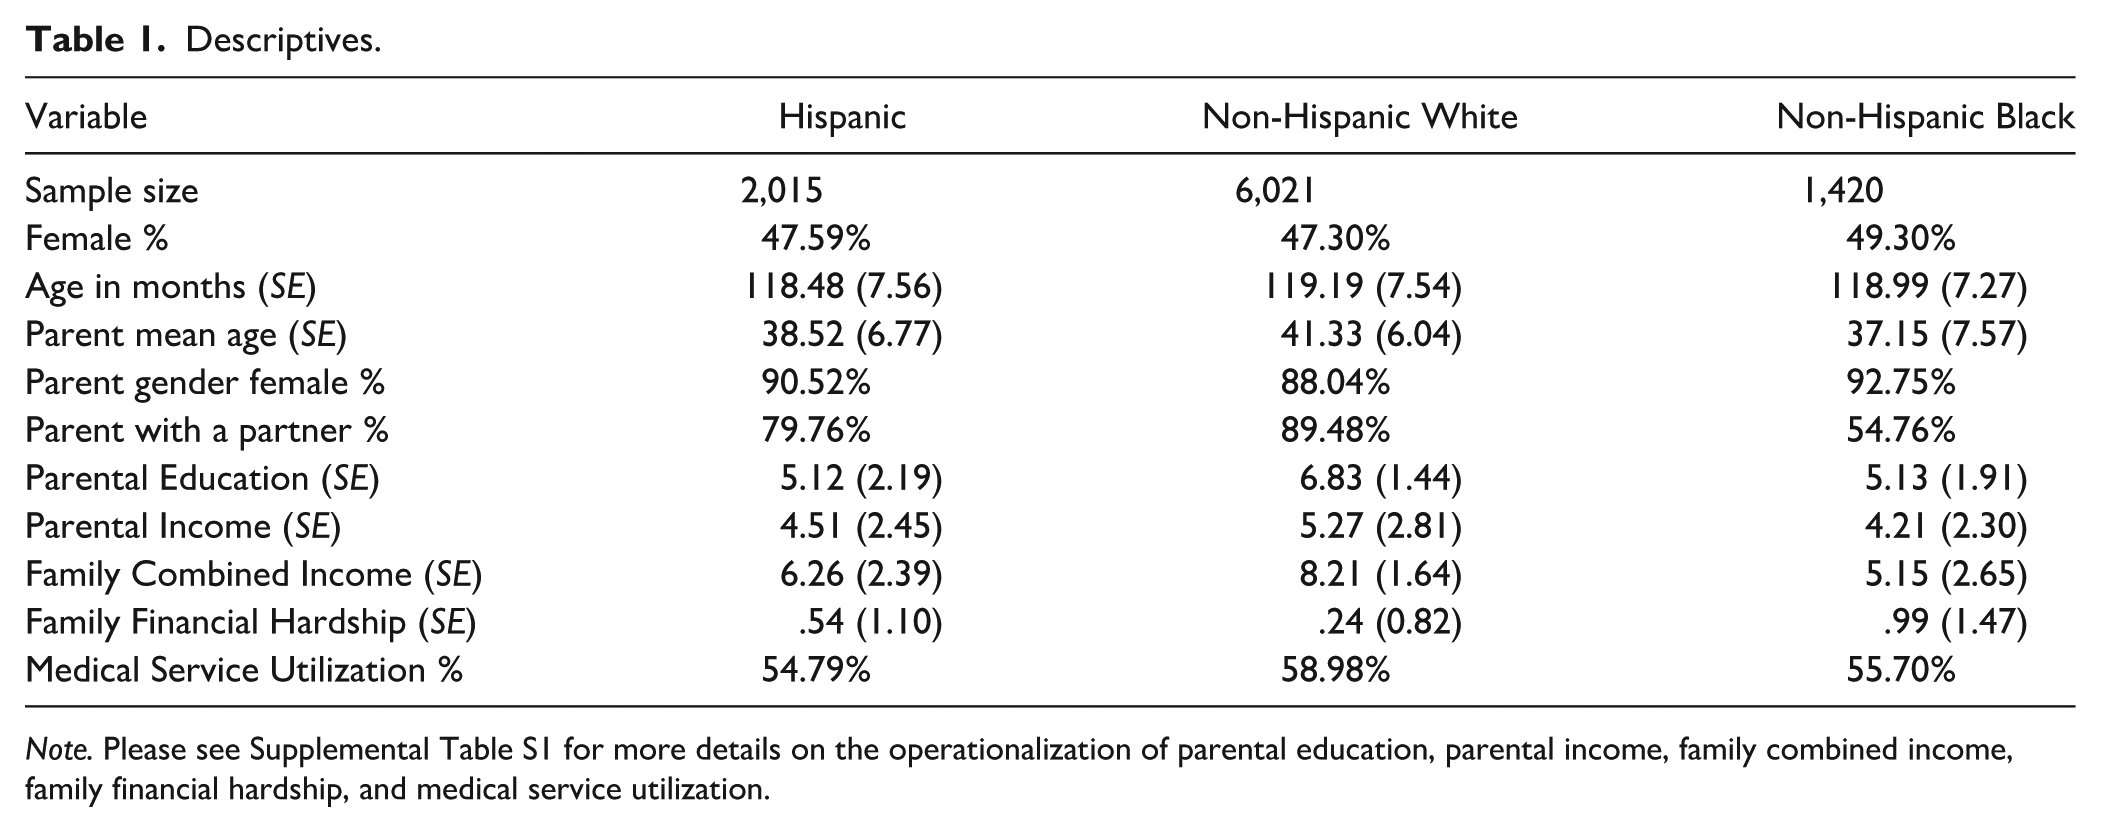
Note. Please see Supplemental Table S1 for more details on the operationalization of parental education, parental income, family combined income, family financial hardship, and medical service utilization.
Measures
CBCL
The CBCL is a standardized assessment measure developed as part of the Achenbach System of Empirically Based Assessment (ASEBA) (Achenbach, 1999). It assesses behavioral and emotional traits in children ranging from affective problems, anxiety, somatic problems, attention-deficit hyperactivity, opposition defiance, and conduct problems. Parents and/or caregivers are asked to rate the frequency of specific behaviors or problems exhibited by the child, using 113 three-point Likert-type scale items. Example items include “acts too young for his or her age” and “complains of loneliness,” to which parents or caregivers may respond with “not true” (coded as 0), “somewhat or sometimes true” (coded as 1), and “very true or often true” (coded as 2) (please also see the Supplemental Materials for additional details).
BPM—Teacher Report Form
The BPM—Teacher Report Form is a 19-item questionnaire for monitoring children’s mental health and functioning as rated by the teacher (Achenbach et al., 2011). It assesses symptoms and behaviors related to Internalizing, Externalizing, and Attention Problems using items worded similarly to the CBCL for Ages 6–18 years, the Teacher’s Report Form, and Youth Self Report (Achenbach et al., 2011). We used the BPM—Teacher Report Form at baseline (n = 3,634) in the validation analyses. Internal consistency for the Internalizing, Externalizing, and Attention Problems dimensions was excellent (Cronbach’s alphas = .84, .89, .89 respectively).
BPM—Youth Self Report
The BPM—Youth Self Report was administered to youth participants at the 6-month follow-up. Youths reported on the same set of 19 items as from the BPM—Teacher Report Form. The BPM—Youth Self Report also assesses the same three composite domains as from the BPM—Teacher Report Form—Internalizing, Externalizing, and Attention Problems scales in the validation analyses. Internal consistency for the Internalizing, Externalizing, and Attention Problems dimensions was acceptable (Cronbach’s alphas = .72, .67, .69, respectively).
K-sads
Parents completed the semi-structured and computerized K-SADS at baseline and every annual follow-up (Kaufman et al., 1997; Townsend et al., 2020). The K-SADS assessed mental disorders including major depressive disorder (MDD), generalized anxiety disorder (GAD), social anxiety disorder (SOC), separation anxiety disorder (SEP), specific phobias (PHB), panic disorder (PAN), eating disorders, obsessive-compulsive disorder (OCD), post-traumatic stress disorder (PTSD), attention-deficit/hyperactivity disorder (ADHD), oppositional defiant disorder (ODD), and conduct disorder (CD). We focused on the screening items for these disorders because they were administered to all parents (Townsend et al., 2020). Non-screener items for each disorder were only administered when parents endorsed at least one of the screening items. Including non-screener items would have significantly restricted the non-missing K-SADS item pool and sample sizes for our validation analyses.
On the K-SADS, parents rated the presence (yes/no) of a symptom at the present time (typically within a 2-week or 1-month period of the assessment date), as well as in the past (typically in the past 6–12 months prior to their assessment date). Composite scores for each disorder were calculated by summing the number of endorsed symptoms. Due to the limited number of items administered for the individual anxiety disorders (i.e., GAD, SOC, SEP, PHB, and PAN), symptoms for each were summed. We focused on K-SADS data from baseline (n= 10,866) and computed 16 composite scores reflecting present or past symptom counts for each of the eight aforementioned mental disorders. Internal consistencies were excellent (i.e., Cronbach’s alphas >.80) for both present and past symptom counts of MDD, anxiety disorders, PTSD, ADHD, and ODD, present symptom counts of OCD, and past symptom counts of eating disorder. Internal consistencies were adequate (i.e., Cronbach’s alphas >.70 but <.80) for present and past symptom counts of CD, present symptom counts of eating disorders, and past symptom counts of OCD.
NIH Toolbox
The NIH Toolbox is a computerized measure of neurocognitive function, including executive function, visual-spatial processing, language, and memory. The following seven test instruments were administered to eligible children in English at baseline: Picture Vocabulary Task, Oral Reading Recognition Task, Pattern Comparison Processing Speed Test, List Sorting Working Memory Test, Picture Sequence Memory Test, Flanker Task, and Dimensional Change Card Sort Task. Composite scores, including fluid and crystallized cognition, were computed based on individuals’ performances in each subtest (n = 9,991). Fluid cognition reflects abilities to solve problems, spontaneously respond to external stimuli, and encode episodic memories; it is argued to be influenced more by biological processes than learning and environmental exposure. Crystallized cognition, on the contrary, reflects the accumulation of knowledge and skills and is argued to be heavily influenced by experiences such as education and parenting (Akshoomoff et al., 2013). Internal consistency is not reported because the raw items comprising each composite score are not currently available to researchers.
Statistical Analyses
Exploratory Factor Analyses
We first replicated a previously published study on the hierarchical structure of youth psychopathology based on CBCL items in the full ABCD sample (Michelini et al., 2019). Following the procedures of that study, we ensured data quality in latent modeling by removing items with excessively low frequency (>98% of “0” being endorsed). Items that were highly correlated (polychoric r>.75) were aggregated into composite scores (see Supplemental Methods for details). A bass-ackward method was used for exploratory factor analyses (EFAs), specifying one to five factors. In addition, we did not perform separate item selection, quality controls, or EFA for each racial and ethnic group because there is no theoretical or empirical evidence that different items should be examined for different racial groups. Furthermore, doing so would have precluded the investigation of measurement invariance across groups given that each group would have featured a different item pool.
CFAs
Factor loading patterns in the CFA were derived from the bass-ackwards five-factor model (Supplemental Table S2). Items were removed if their loadings on all factors were lower than .35. This cut-off was chosen to ensure that our model contained the same set of indicators as Michelini et al. (2019) so that we could replicate their model before testing its invariance. For items that had cross-loadings of higher than .35 on more than one factor, we specified the item to load onto the strongest loading factor. A total of 71 items (out of 88) exhibited factor loadings larger than .35 without cross-loadings and were kept in the CFA model. In addition, Item 91 (“talks about killing self”) exhibited similar loadings (~.40) onto both Externalizing and Internalizing; we decided to specify the item to load onto Internalizing to avoid cross-loading in the model. Thus, 72 items (out of 88) were retained in the CFA model. We treated all items as ordinal and used the weighted least square mean and variance adjusted (WLSMV) estimator to fit the models (Flora & Curran, 2004). To scale and identify the models, we used theta parameterization, which sets the variances of the latent response variables to 1 and allowed us to estimate residual variances of indicators. We used the comparative fit index (CFI), Tucker–Lewis index (TLI), root mean squared error of approximation (RMSEA), and standardized root mean squared residual (SRMR) to assess model fit. Based on previously established conventions, CFI and TLI values greater than .95, RMSEA values less than .06, and SRMR values less than .08 generally indicate “good” fit (Hu & Bentler, 1999).
Measurement Invariance
We conducted tests of measurement invariance in five steps. First, we fit a baseline model in each of the three racial and ethnic groups separately. If a model fit well in all three groups, we fit a configural model in which factor loadings, item thresholds, and intercepts were freely estimated for each group in the same model. Good performance of the model indicates that the hypothesized factor structure has configural invariance. If the configural model fit well, we then fit a metric invariance model, constraining factor loadings and item thresholds to equivalence across groups. A CFI difference of less than .01 between the metric and the configural model indicates invariant factor loadings and/or item thresholds (Cheung & Rensvold, 2002). Metric invariance suggests that the relationships between items and their corresponding latent factors are equivalent across groups. Given metric invariance, we then tested scalar invariance, in which item intercepts were constrained to equivalence across groups. Evidence of scalar invariance indicates that observed mean differences in the latent factors are due to differences in levels of the latent factors rather than measurement errors. We then tested the final level of measurement invariance, strict invariance, which constrains item residual variance to equivalence. All invariance analyses were conducted using Mplus 8.10. Survey propensity weights and research site identification number were used to adjust the standard errors of parameter estimates according to the complex survey design of the ABCD Study.
Scholars have challenged the sole reliance on fit indices when evaluating latent factor models and their invariance (Ferrando & Lorenzo-Seva, 2018; Greene et al., 2019, 2022; Waldman et al., 2023). For instance, likelihood ratio tests (LRTs) were conducted and reported in the current study, because this aligns with current convention in measurement invariance research and because it is the only index of the absolute fit of the model, which may provide useful information for future meta-analytic work (Fischer & Karl, 2019; Putnick & Bornstein, 2016; Svetina et al., 2019). However, we note that chi-square statistics tend to be sensitive to large sample sizes such that minimal group discrepancies in model parameters can lead to significant chi-square differences (Cheung & Rensvold, 2002; Kyriazos, 2018). Therefore, we did not rely on LRT results when assessing measurement invariance. In addition to fit indices, we also examined item factor loadings and item thresholds from the configural model and conducted visual and statistical comparisons across groups. Specifically, we tested differences in loadings (and their standard errors) for each factor across groups using general linear models and computed bootstrapped confidence intervals around the standard deviation of loadings for each group. Standard errors are useful indicators of the statistical precision in which loadings are estimated within each group. Standard deviations, on the contrary, are useful in assessing the variability of loadings within each group. Partial eta-squared were reported as a measure of effect size. We also computed the Tucker’s Congruence Coefficient (TCC) (Lorenzo-Seva & ten Berge, 2006; Lovik et al., 2020) as a statistical measure of factor similarities across groups. The TCC was computed based on factor loadings in a common factor model, and a value larger than .95 indicates that the common factor is statistically identical across two groups.
Validation Analyses
To validate the latent factor models for each racial and ethnic group, we examined bivariate correlations among the latent factor scores and validators, including the Internalizing, Externalizing, and Attention Problems scores from the BPM—Teacher Report Form and from the BPM—Youth Self Report, Crystalized and Fluid Cognition scores from the NIH Toolbox, and past and present symptom counts for eight mental disorders from the K-SADS. We used structural equation modeling and added the validators into the model as exogenous variables, estimating their correlations with the CBCL latent factors. To adjust for the complex survey design, the correlation coefficients were estimated with research sites as a cluster variable and with propensity weights. The Benjamini and Hochberg method was used to adjust for multiple testing by controlling for the false discovery rate (Benjamini & Hochberg, 1995). To facilitate group comparisons in the correlations, we followed the recommended practice by transforming the correlation coefficients to Fisher’s z and computing Cohen’s q as the difference in Fisher’s z between any pair of two groups. Cohen’s q of .10, .30, and .50 were interpreted as small, medium, and large effect sizes (Cohen, 1988; Zager Kocjan et al., 2021). Cohen’s q of less than .10 reflects minimal differences in correlation coefficients between any pair of groups.
Results
Descriptive Statistics
As shown in Table 1, Hispanic, non-Hispanic White, and non-Hispanic Black youths did not differ in terms of their age (in months) (M = 118.48, 119.19, 118.99; SE = 7.56, 7.54, 7.27, respectively), sex assigned at birth (female = 47.59%, 47.30%, 49.30%, respectively), parental age (in years) (M = 38.52, 41.33, 37.15; SE = 6.77, 6.04, 7.57, respectively), and parental gender (female = 90.52%, 88.04%, 92.75%, respectively). However, compared to parents of Hispanic and non-Hispanic Black youths, parents of non-Hispanic White youths reported a higher likelihood of having a partner (partnered = 89.48% vs. 79.76% and 54.76%, respectively), a higher level of education (M = 6.83, 5.12, 5.13; SE = 1.44, 2.19, 1.91, respectively), higher parental income (M = 5.27, 4.51, 4.21; SE = 2.81, 2.45, 2.30, respectively), higher family combined income (M = 8.21, 6.26, 5.15; SE = 1.64, 2.39, 2.65, respectively), and higher likelihood of utilizing medical service (utilization = 58.98%, 54.79%, 55.70%, respectively). Please also see Supplemental Table S1 for more details about the sample characteristics, including operationalization of parental education, parental income, and family combined income.
EFA
We followed the procedures described in Michelini et al. (2019), where 18 items were removed due to low frequency (>98% of “0” being endorsed). A total of 88 CBCL items remained after quality control. We then conducted an EFA using the bass-ackwards method, specifying one factor to five factors. Consistent with the previous literature (Michelini et al., 2019) and based on a visual inspection of the scree plot and parallel analysis (Supplemental Figure S1), the five-factor (i.e., Externalizing, Neurodevelopmental, Internalizing, Somatoform, and Detachment) model emerged as the best-fitting model. We selected items that exhibited at least one factor loading that was larger than .35 and specified cross-loaded items to load onto the stronger-loading factor. In total, 72 items (out of 88) were retained in the CFA (Supplemental Table S2).
CFAs
The five-factor model (Figure 1) fit well in non-Hispanic Black youths (Table 2; CFI = .96, TLI = .96, RMSEA = .01, SRMR = .07), non-Hispanic White youths (CFI = .97, TLI = .97, RMSEA = .01, SRMR = .07), and Hispanic youths (CFI = .98, TLI = .98, RMSEA = .01, SRMR = .07), indicating that the five-factor model explained the covariation among the 72 CBCL items consistently well. The baseline model’s satisfactory performance in all three groups permitted us to test its invariance across race and ethnicity.
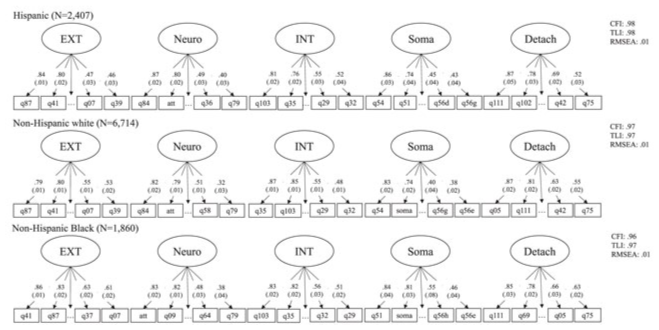
Five-Factor Latent Model.
Model Fit Indices.
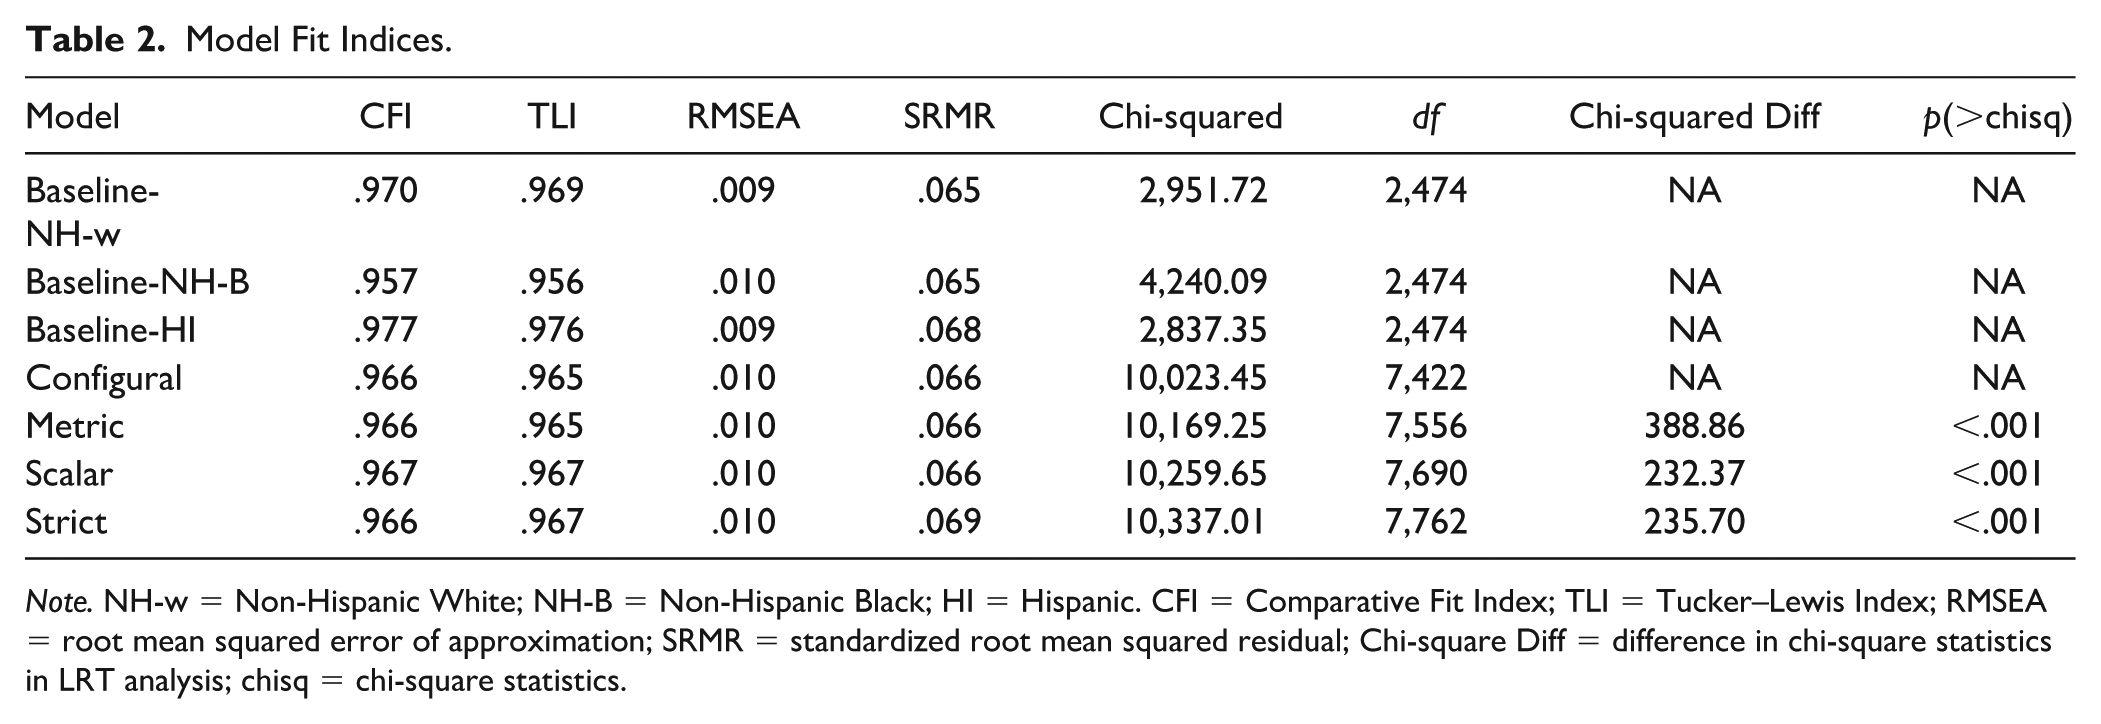
Note. NH-w = Non-Hispanic White; NH-B = Non-Hispanic Black; HI = Hispanic. CFI = Comparative Fit Index; TLI = Tucker–Lewis Index; RMSEA = root mean squared error of approximation; SRMR = standardized root mean squared residual; Chi-square Diff = difference in chi-square statistics in LRT analysis; chisq = chi-square statistics.
Tests of Measurement Invariance
Configural Invariance
The configural model performed well (CFI = .97, TLI = .97, RMSEA = .01, SRMR = .07, Table 2), suggesting that the same five-factor structure fit the data equally well in all three groups. We did not find significant loading differences across Hispanic, non-Hispanic White, and non-Hispanic Black youths, F(2,213) = 1.25, p = .29, partial etq-squared = .01, for Externalizing (M = .71, .71, .74; SE = .02, .02, .02, respectively), Neurodevelopmental (M = .66, .66, .67; SE = .02, .02, .03, respectively), Internalizing (M = .69, .72, .72; SE = .03, .02, .03, respectively), Somatoform (M = .60, .58, .65; SE = .04, .03, .04, respectively), and Detachment (M = .72, .72, .73; SE = .02, .02, .02, respectively) (also see Supplemental Table S3). We also examined the statistical precision in which loadings were estimated in each group using the standard errors of factor loadings. Loadings were estimated precisely in all three groups, indicated by the small average standard errors of .02, .01, and .03 in Hispanic, non-Hispanic White, and non-Hispanic Black, respectively. Loadings were estimated more precisely for non-Hispanic White than for Hispanic and non-Hispanic Black youths, F(2, 213) = 13.06, p < .001, partial eta-squared = .11; however, this is likely due to the larger sample size of the non-Hispanic White individuals.
Factor loadings varied within each group but not between groups, illustrated by the overlapping ranges and similar medians for each factor across groups in the boxplot of item loadings (Figure 2). In addition, the standard deviation of loadings for each group had overlapping bootstrapped confidence intervals (95% bootstrapped confidence interval [CI] = [.10, .13], [.10, .14], and [.08, .12]) in Hispanic, non-Hispanic White, and non-Hispanic Black youths, suggesting that the variability in factor loadings were similar across groups. The highest and lowest loaded items were generally the same in the three racial and ethnic groups (Supplemental Table S3). For instance, “sudden change in mood” ranked among the top loading items in the Externalizing factor for all three groups, and “speech problem” was the lowest loading item in the Neurodevelopmental factor in all three groups. TCCs were computed for each pair of group comparisons (i.e., Hispanic and non-Hispanic White, Hispanic and non-Hispanic Black, non-Hispanic Black and non-Hispanic White), and all TCCs were above .99 (Supplemental Table S4). This indicated that each of the factors did not differ significantly across the three groups based on item loadings.
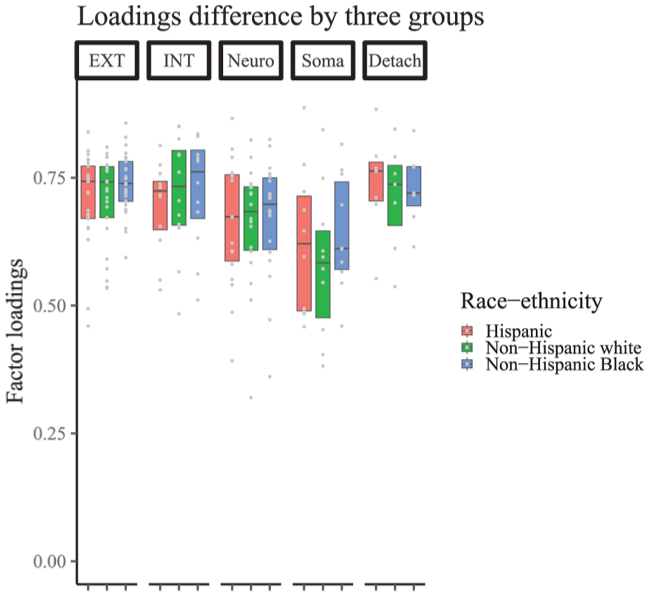
Item Loading Boxplot.
Item thresholds exhibited between-group similarities as well. No differences were observed among the Hispanic, non-Hispanic White, and non-Hispanic Black youths for threshold 1 (the level of latent trait required to endorse a “1” vs. “0”), M = 1.06, 1.09, 1.08; SE = .06, .04, .06, respectively; F(2, 213) = 0.09, p = .92, partial eta-squared < .01, and for threshold 2, M = 2.18, 2.20, 2.14; SE = .09, .06, .09, respectively; F(2,213) = 0.51, p = .60, partial eta-squared <.01, across items. Visual inspection of the boxplot of the item thresholds (Figure 3), the overlapping ranges, and the statistical non-significance of item threshold group comparisons provided evidence for within-group variations and between-group similarities in item thresholds.
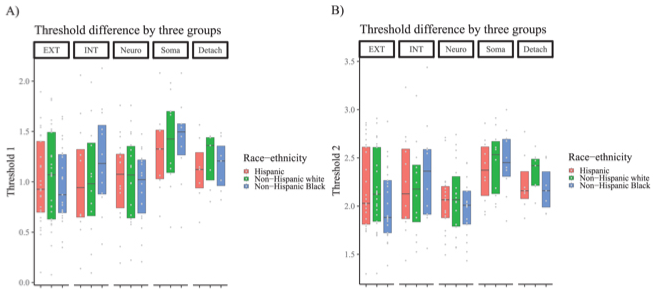
Item Threshold Boxplot.
Metric Invariance
The metric model fit the data very well (CFI = .97, TLI = .97, RMSEA = .01, SRMR = .07, Table 2). Importantly, the metric model exhibited a minimal difference in fit relative to the configural model (ΔCFI<.001, ΔTLI<.001, ΔRMSEA<.001, ΔSRMR<.001), indicating that item loadings and thresholds were statistically equivalent across groups. This is consistent with the high TCC values of each factor, the overlapping standard deviations of loadings across groups, and the non-significant differences in loadings and their standard errors across groups as reported in the Configural invariance section above. We also performed LRT tests to compare the absolute fit of the models at the four levels of invariance (Table 2). The metric invariance model fit worse than the configural model (Δχ2 = 388.86, Δdf = 134). As the chi-square statistic is an absolute fit index (Alavi et al., 2020; Hu & Bentler, 1999), significant LRT results could stem from model parameters that were not identical but likely to be interpretatively similar across the racial and ethnic groups. Indeed, Figures 2 and 3 provided evidence that item loadings and item thresholds were highly similar but not statistically identical across groups. For this reason, we chose to not discuss results from the LRT tests for the rest of the model comparisons; all results were still reported in Table 2 for completeness of reporting.
Scalar Invariance
The scalar invariance model fit the data well (CFI = .97, TLI = .97, RMSEA = .01, SRMR = .07, Table 2), exhibiting a minimal decrease in CFI relative to the metric model (ΔCFI = .001, ΔTLI = .002, ΔRMSEA < .001, ΔSRMR < .001).
We generated standardized latent means and latent factor correlations from the scalar model to aid the assessment and interpretation of the model. For model identification purposes, latent means were fixed at 0 for a reference group, which was the Hispanic group in our analyses. Latent means for the other two groups were estimated in comparison to the Hispanic youth group (Table 3). Non-Hispanic White youths exhibited higher latent mean for Internalizing (M = .20, SE = .08). Non-Hispanic Black youths, on the contrary, exhibited lower latent mean for Externalizing, Internalizing, Somatoform, and Detachment (M = −.27, −.32, −.44, and −.26; SE = .09, .09, .11, and .12, respectively).
CBCL Latent Factor Means and Correlation Coefficients.
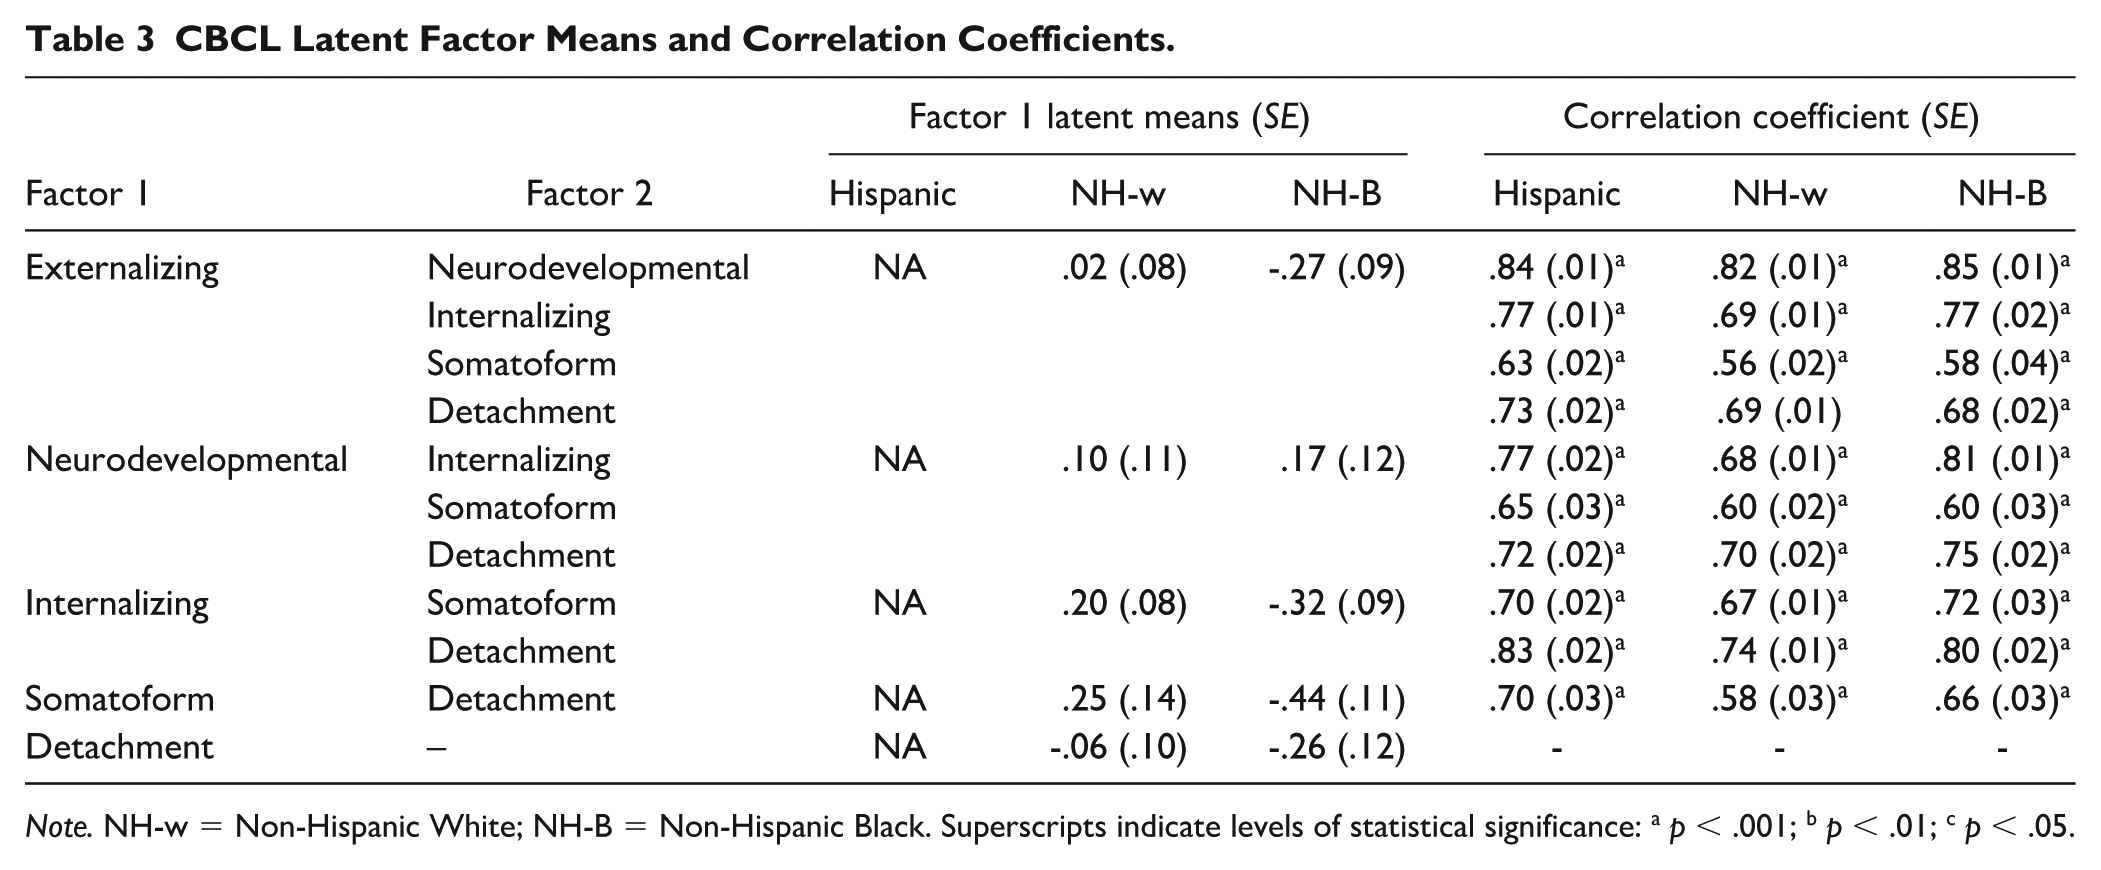
Note. NH-w = Non-Hispanic White; NH-B = Non-Hispanic Black. Superscripts indicate levels of statistical significance: a p < .001; b p < .01; c p < .05.
The five factors were strongly correlated with each other in Hispanic, non-Hispanic White, and non-Hispanic Black youths (Table 3), exhibiting average correlations (SE) of .73 (.02), .67 (.01), and .72 (.02), respectively. The strongest correlation was observed between Externalizing and Neurodevelopmental in the three groups (r = .84, .82, .85; SE = .01, .01, .01, respectively), whereas the weakest correlations were observed between Somatoform and Externalizing in the three groups (r = .63, .56, .58; SE = .02, .02, .04, respectively).
Strict Invariance
Strict invariance was supported by the model’s strong fit (CFI = .97, TLI = .97, RMSEA = .01, SRMR = .07, Table 2) and minimal difference relative to the scalar model (ΔCFI < .001, ΔTLI < .001, ΔRMSEA < .001, ΔSRMR = .003).
Validation Analyses
Convergent and Discriminant Validation
We conducted all validation analyses via structural equation modeling, with each validator construct added as an exogenous variable in the five-factor CBCL model. With respect to convergent validity, we expected to observe robust correlations for the same/similar trait across different methods (i.e., “monotrait-heteromethod”). Convergent validity was consistently supported in our models. The CBCL Internalizing, Externalizing, and Neurodevelopmental latent factors were robustly correlated with Internalizing, Externalizing, and Attention Problems scores from Teacher Report Form and Youth Self Reports of the BPM, respectively, across all three racial and ethnic groups (see gray-shaded cells in Table 4). These correlations did not significantly differ when compared across the three racial and ethnic groups, as all Cohen’s q absolute values were smaller than .1 (Supplemental Tables S4 and S5). Convergent validity was further supported through the robust correlations observed between the CBCL latent factors and past and present symptom counts assessed from K-SADS (see gray-shaded cells in Table 5). CBCL Externalizing was robustly correlated with both past and present symptom counts for ODD and CD, which are characterized as externalizing disorders. Similarly, CBCL Internalizing was robustly correlated with past and present symptom counts for eating disorders, MDD, anxiety disorders, OCD, and PTSD, which are all characterized as forms of internalizing disorders. And CBCL Neurodevelopmental was robustly correlated with ADHD, which is considered a neurodevelopmental disorder. Racial and ethnic differences in the correlations among the five latent factors and past and present symptom counts across eight mental disorders from the K-SADS were minimal to small, with most Cohen’s q values smaller than .1, and only three values larger than .2 (Supplemental Tables S4 and S6).
Correlations Between CBCL Latent Factors, BPM Teacher Report Form, BPM Youth Self Report, and NIH Toolbox Scores.
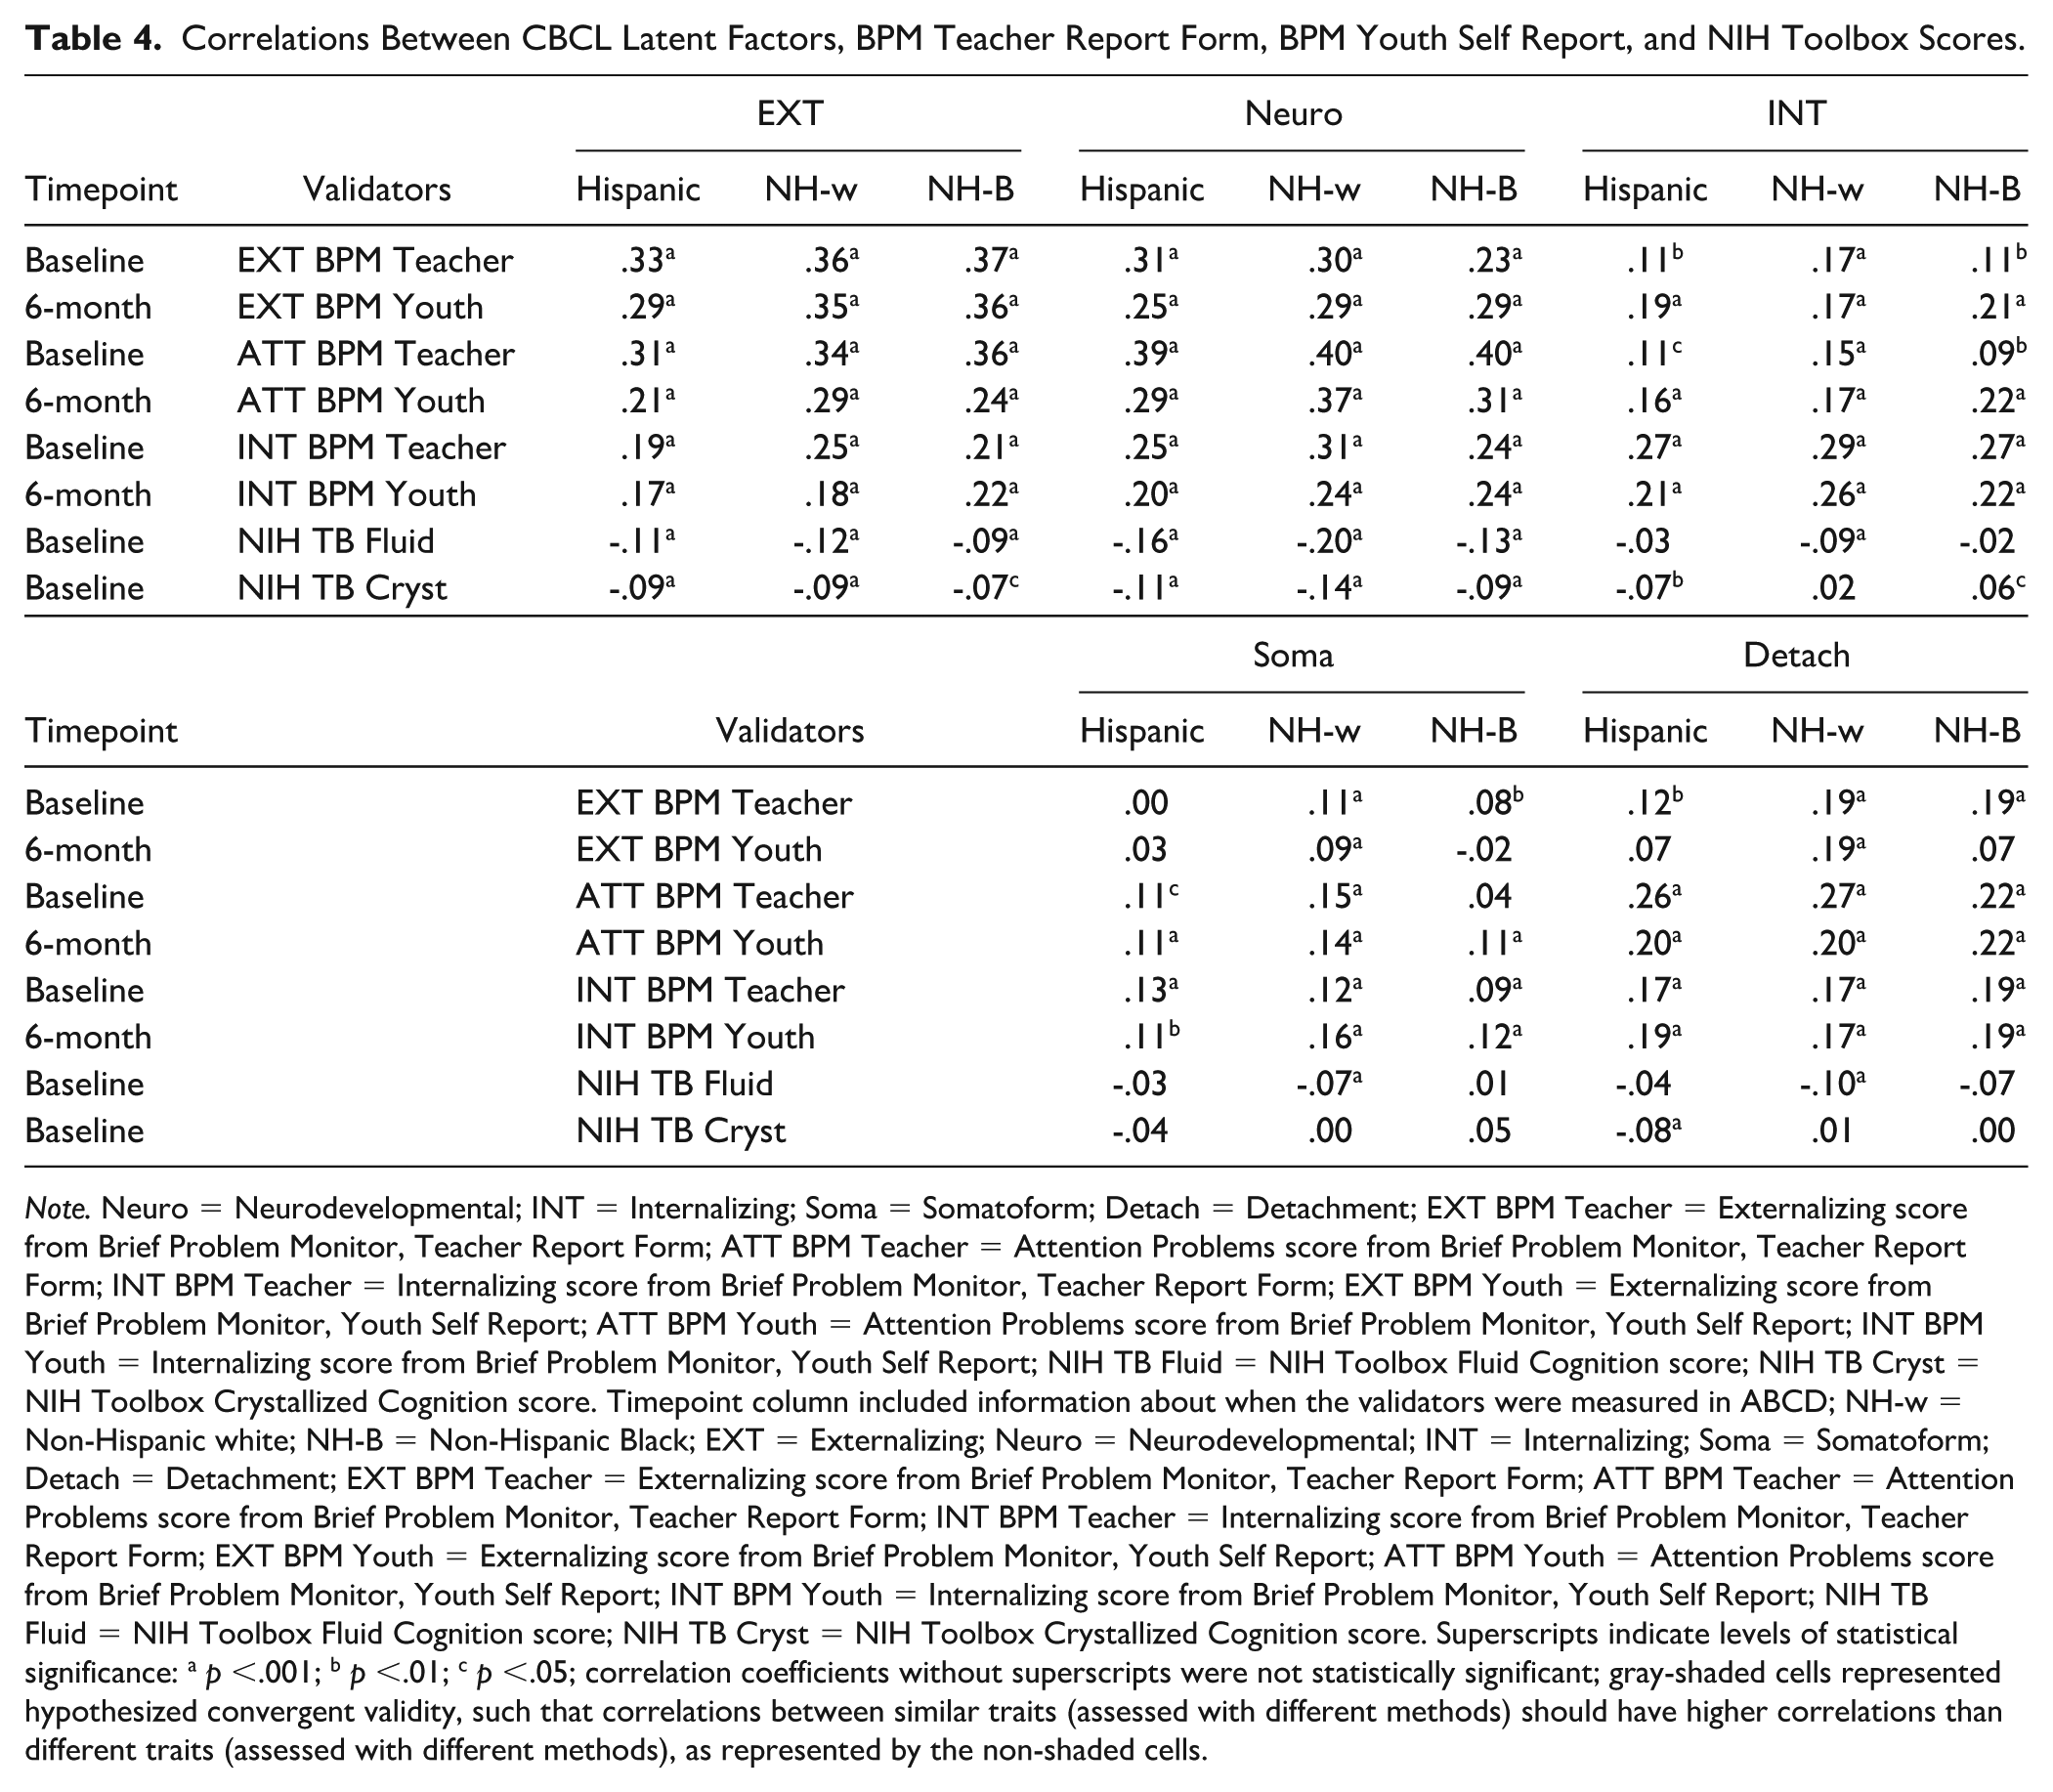
Note. Neuro = Neurodevelopmental; INT = Internalizing; Soma = Somatoform; Detach = Detachment; EXT BPM Teacher = Externalizing score from Brief Problem Monitor, Teacher Report Form; ATT BPM Teacher = Attention Problems score from Brief Problem Monitor, Teacher Report Form; INT BPM Teacher = Internalizing score from Brief Problem Monitor, Teacher Report Form; EXT BPM Youth = Externalizing score from Brief Problem Monitor, Youth Self Report; ATT BPM Youth = Attention Problems score from Brief Problem Monitor, Youth Self Report; INT BPM Youth = Internalizing score from Brief Problem Monitor, Youth Self Report; NIH TB Fluid = NIH Toolbox Fluid Cognition score; NIH TB Cryst = NIH Toolbox Crystallized Cognition score. Timepoint column included information about when the validators were measured in ABCD; NH-w = Non-Hispanic white; NH-B = Non-Hispanic Black; EXT = Externalizing; Neuro = Neurodevelopmental; INT = Internalizing; Soma = Somatoform; Detach = Detachment; EXT BPM Teacher = Externalizing score from Brief Problem Monitor, Teacher Report Form; ATT BPM Teacher = Attention Problems score from Brief Problem Monitor, Teacher Report Form; INT BPM Teacher = Internalizing score from Brief Problem Monitor, Teacher Report Form; EXT BPM Youth = Externalizing score from Brief Problem Monitor, Youth Self Report; ATT BPM Youth = Attention Problems score from Brief Problem Monitor, Youth Self Report; INT BPM Youth = Internalizing score from Brief Problem Monitor, Youth Self Report; NIH TB Fluid = NIH Toolbox Fluid Cognition score; NIH TB Cryst = NIH Toolbox Crystallized Cognition score. Superscripts indicate levels of statistical significance: a p <.001; b p <.01; c p <.05; correlation coefficients without superscripts were not statistically significant; gray-shaded cells represented hypothesized convergent validity, such that correlations between similar traits (assessed with different methods) should have higher correlations than different traits (assessed with different methods), as represented by the non-shaded cells.
Correlations Between CBCL Latent Factors and K-SADs Present and Past Symptom Counts.
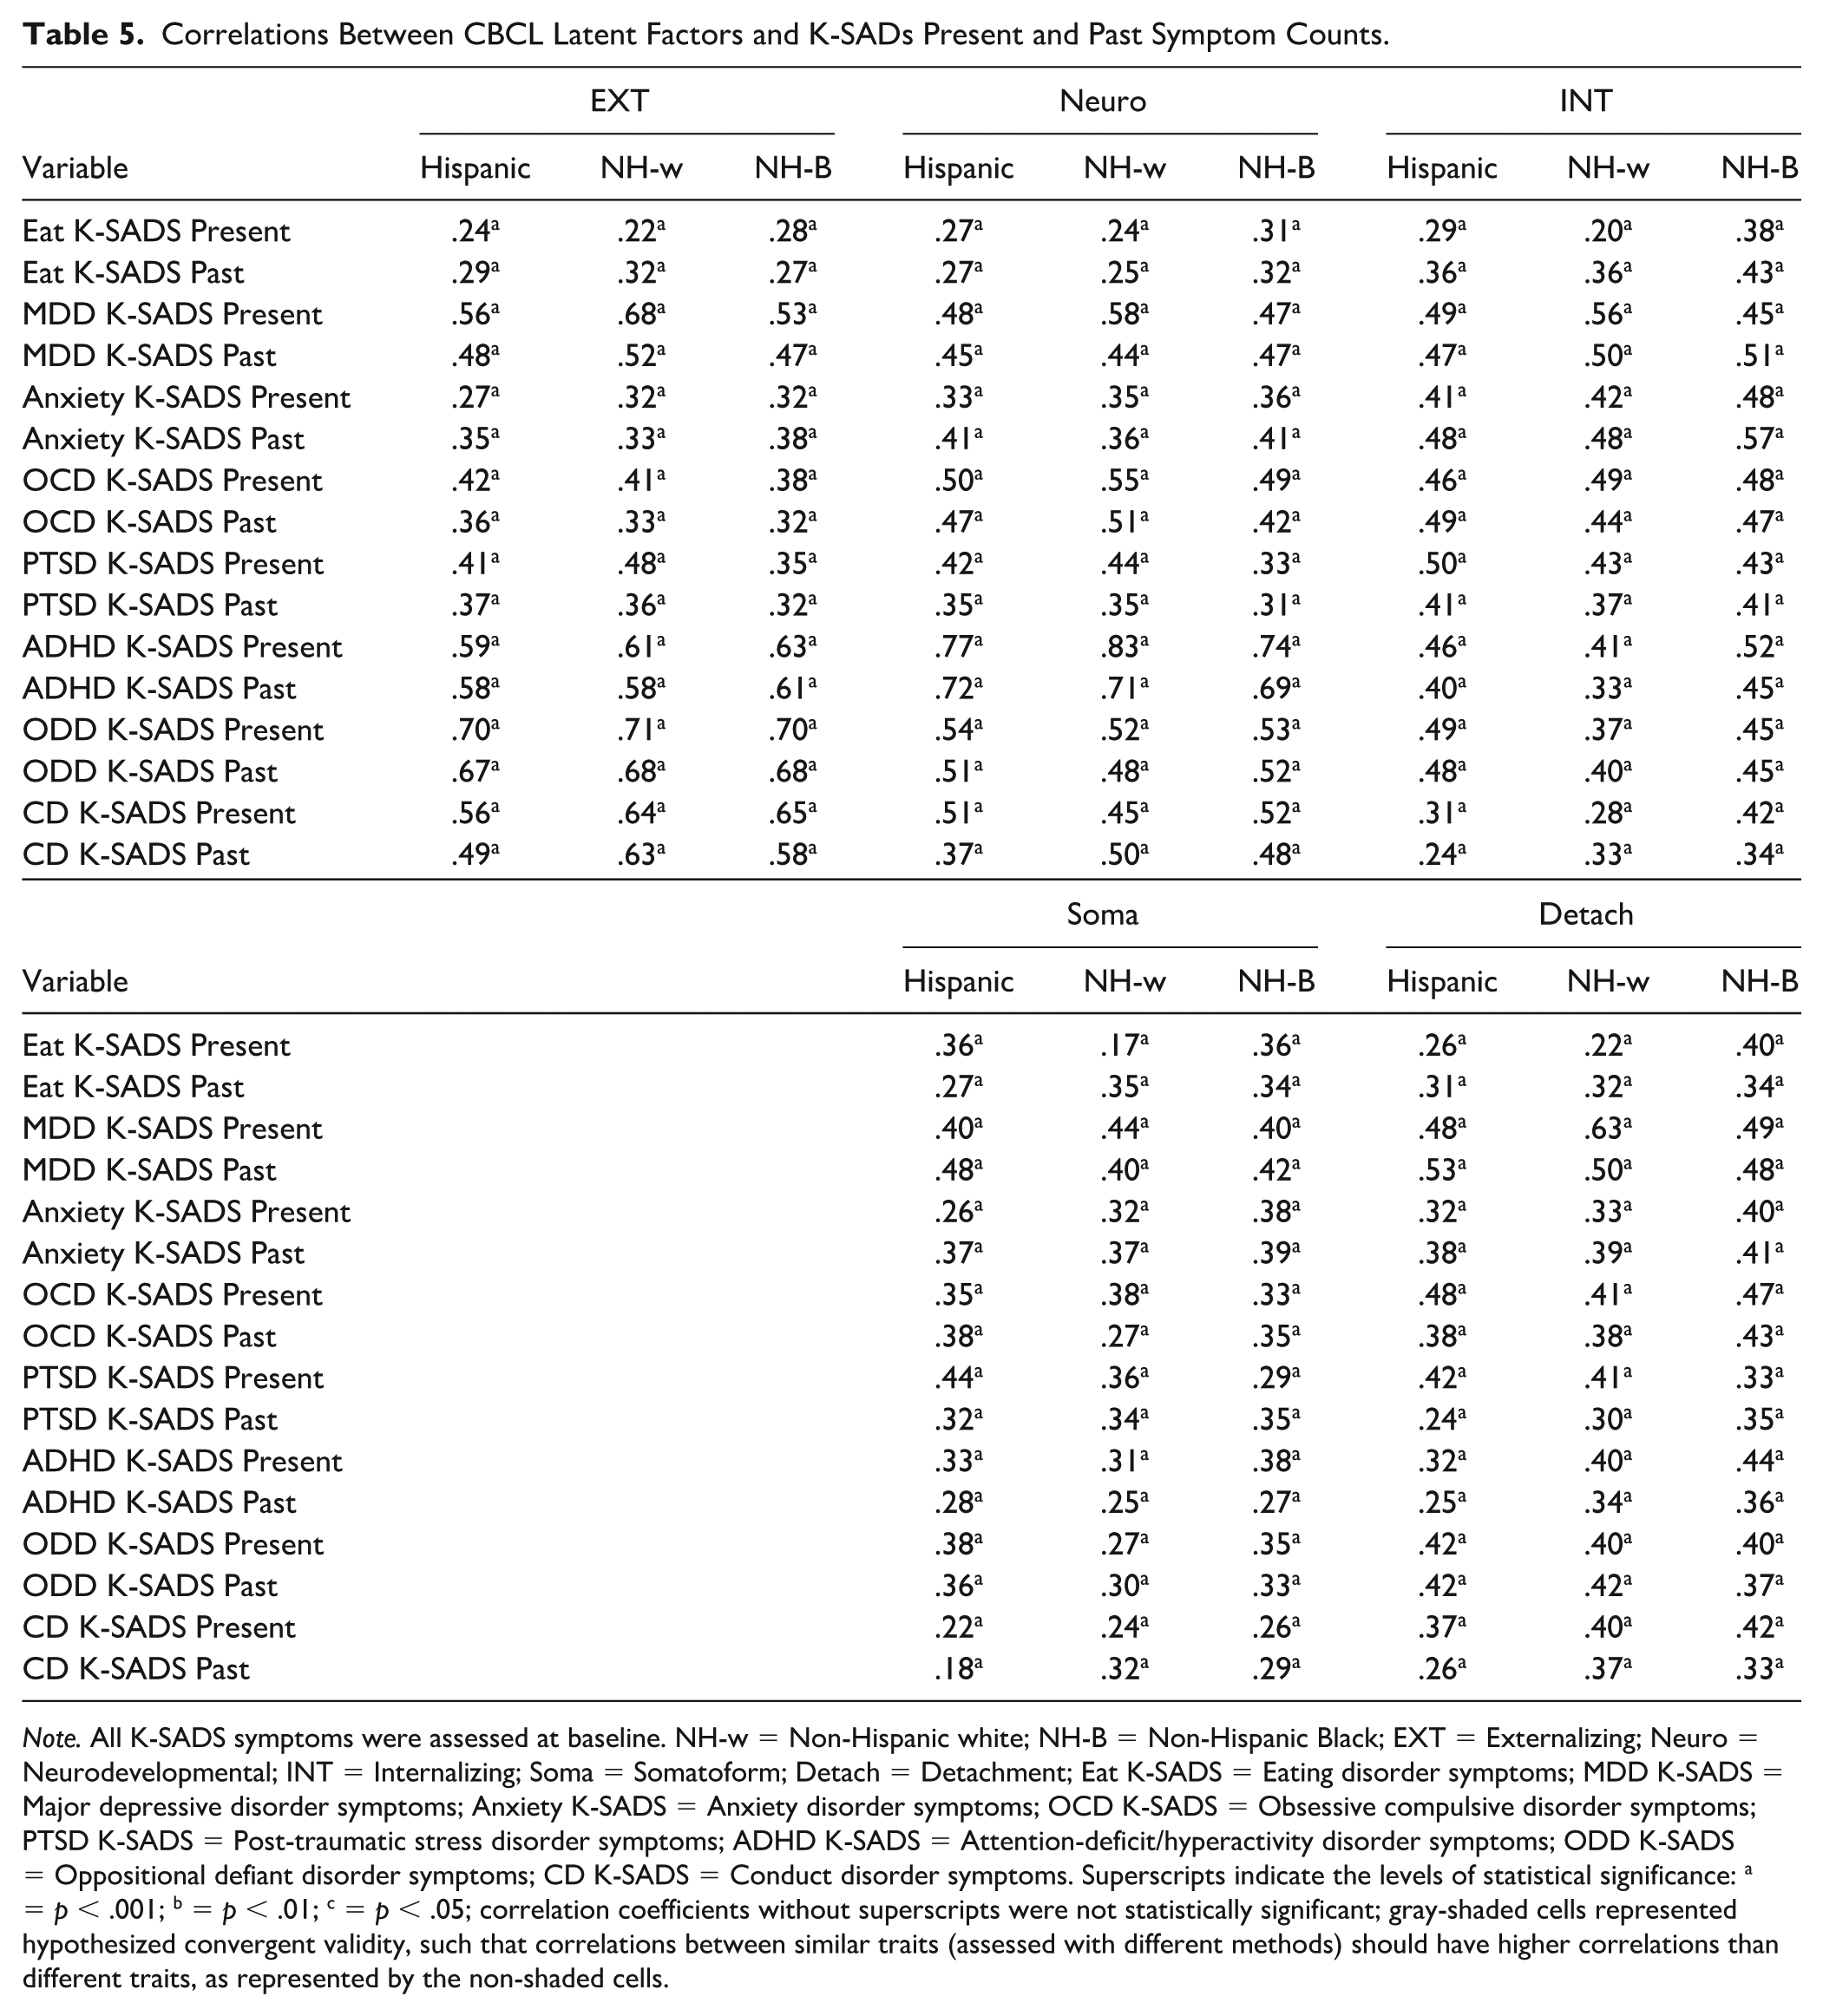
Note. All K-SADS symptoms were assessed at baseline. NH-w = Non-Hispanic white; NH-B = Non-Hispanic Black; EXT = Externalizing; Neuro = Neurodevelopmental; INT = Internalizing; Soma = Somatoform; Detach = Detachment; Eat K-SADS = Eating disorder symptoms; MDD K-SADS = Major depressive disorder symptoms; Anxiety K-SADS = Anxiety disorder symptoms; OCD K-SADS = Obsessive compulsive disorder symptoms; PTSD K-SADS = Post-traumatic stress disorder symptoms; ADHD K-SADS = Attention-deficit/hyperactivity disorder symptoms; ODD K-SADS = Oppositional defiant disorder symptoms; CD K-SADS = Conduct disorder symptoms. Superscripts indicate the levels of statistical significance: a = p < .001; b = p < .01; c = p < .05; correlation coefficients without superscripts were not statistically significant; gray-shaded cells represented hypothesized convergent validity, such that correlations between similar traits (assessed with different methods) should have higher correlations than different traits, as represented by the non-shaded cells.
Support for discriminant validity of the CBCL latent factors, however, was mixed. Once again, for discriminant validity, we expected correlations between different traits measured with the same method (“heterotrait-monomethod”) to be lower than correlations observed between the same/similar trait measured with different methods (i.e., “monotrait-heteromethod”). In addition, we expected that correlations between different traits and different methods would be generally low (i.e., “heterotrait-heteromethod”). Some of the CBCL latent factors did not exhibit consistently robust evidence for discriminant validity with respect to the heterotrait comparisons we made using the BPM—Teacher Report Form and Youth Self Report. For instance, the CBCL Neurodevelopmental latent factor did not appear to be more correlated (by virtue of stronger effect sizes and reaching more stringent levels of statistical significance) with the Attention Problems subscale (r’s all ranging from .29 to .40, p’s < .001) than with the Internalizing subscale (r’s all ranging from .20 to .31, p’s < .001) of the BPM—Teacher Report Form and Youth Self Report (Table 4). On the contrary, the CBCL Internalizing latent factor appeared to feature a consistently lower set of correlations with the Externalizing subscale of the BPM—Teacher Report Form and Youth Self Report (r’s all ranging from .09 to .22, p’s between .001 and .05) than the Internalizing subscale (r’s all ranging from .21 to .29, p’s < .001).
A mixed set of results also emerged with respect to our discriminant validity analyses using past and present symptom counts for eight mental disorders measured with the K-SADS (see Table 5). For example, while correlations between the CBCL Externalizing latent factor were robustly correlated with past and present symptom counts for ODD and CD as expected (r’s ranging from .49 to .71, p’s < .001), we also observed robust correlations between this latent factor and all non-externalizing disorder symptom counts as well (i.e., eating disorders, MDD, anxiety disorders, OCD, PTSD), with r’s as high as .68 for MDD and all p’s < .001. Similarly, the CBCL Internalizing latent factor did not appear to be consistently more correlated with other internalizing mental disorders than either ADHD (a neurodevelopmental disorder) or ODD (and externalizing disorder).
Concurrent Validity
Concurrent validity is supported when a construct correlates with theoretically related constructs from measures administered at the same time as the focal construct. With a few exceptions as noted herein, there was generally consistent evidence for the concurrent validity of each of the CBCL latent factors in that Crystalized and Fluid Cognition scores from the NIH Toolbox were significantly and negatively correlated with Externalizing and Neurodevelopmental latent factors across the three racial and ethnic groups (all p’s < .001) (see Table 4). Fluid Cognition was negatively correlated with the CBCL Internalizing latent factor in non-Hispanic White youths (p < .001), but not in Hispanic and non-Hispanic Black youths, and negatively correlated with Somatoform and Detachment factor in non-Hispanic White youths only (p < .001). The Crystalized Cognition score was significantly and negatively correlated with the CBCL Internalizing latent factor in Hispanic youths (p < .01) and in non-Hispanic Black youths (p < .05), and negatively correlated with Detachment factor in Hispanic youths only (p < .001). Racial and ethnic differences in the correlations among the five latent factors and Crystalized and Fluid Cognition scores from the NIH Toolbox were minimal to small, with only one Cohen’s q absolute value larger than .1 (Supplemental Tables S4 and S5).
Discussion
Replicating and extending upon prior findings (Michelini et al., 2019; Stewart et al., 2024), we first identified full measurement invariance of the five-factor model across Hispanic, non-Hispanic White, and non-Hispanic Black youths, in which the items loaded strongly onto the following factors: Externalizing, Neurodevelopmental, Internalizing, Somatoform, and Detachment. However, evidence for the overall construct validity of these models was mixed. The five CBCL latent factors demonstrated consistent evidence of convergent and concurrent validity across each racial and ethnic group but mixed evidence of discriminant validity. This calls into question the broader issue of whether our HiTOP latent factors are conceptually distinct enough from one another.
Findings from this study support HiTOP as a promising taxonomic framework of psychopathology across various demographics, groups, and methods, including racial and ethnic groups, age, gender, informants, and measurement tools (Eaton et al., 2012, 2013; He & Li, 2021; Hoffmann et al., 2022; Ivanova et al., 2019; Lahey et al., 2017; Ringwald et al., 2023; Stewart et al., 2024). Our study adds to a growing literature suggesting that the HiTOP model is robust across race and ethnicity among youths and adults. Critically, establishing measurement invariance provides HiTOP researchers greater confidence to interpret differences in etiological or psychosocial associations between groups and across the dimensions. In addition, the prevailing approach to assessing measurement invariance of psychopathology models has emphasized fit indices and their differences between models (e.g., Bieda et al., 2017; Eaton et al., 2013; He & Li, 2021; Zager Kocjan et al., 2021). Our study rigorously established measurement invariance by testing for configural, metric, scalar, and strict invariance and utilizing multiple indices to evaluate invariance including alternative fit indices, the TCC, and statistical tests of loading differences across groups. Relying solely on fit indices has several limitations, including their sensitivity to sample size and model complexity, the use of arbitrary cut-point values, inconsistent conclusions about model performance, and a bias toward bifactor models (Ferrando & Lorenzo-Seva, 2018; Fischer & Karl, 2019; Greene et al., 2019, 2022; Waldman et al., 2023). Furthermore, chi-square statistics are computed within a null hypothesis testing framework, providing information on the statistical significance of hypotheses rather than their magnitude or practical significance (Kirk, 1996; Peugh & Feldon, 2020). In our study, for instance, statistically significant LRT results likely reflect group variations in model parameters that are small and not practically meaningful. Therefore, in addition to reporting fit indices, we incorporated alternative criteria such as the TCC, effect sizes of group differences in item loadings and their standard errors and standard deviations, as well as group differences in item thresholds to assess the quality and equivalence of our latent model across groups. Examining and reporting these model characteristics are crucial for interpreting the validity and generalizability of a model.
Another significant contribution of our study was that we leveraged the classical Multitrait-Multimethod framework by Campbell and Fiske (1959) to rigorously test for convergent, divergency, and concurrent forms of validity with respect to our CBCL latent factors across racial and ethnic groups. Our validators included different measures and informants—i.e., Teacher and Youth Self Reports from the BPM, caregiver ratings from the K-SADS, and youth scores from the NIH Toolbox. While each of the CBCL latent factors exhibited consistent evidence of convergent and concurrent validity, the discriminant validity of the CBCL latent factors was not nearly as robust. We highlighted the example of the CBCL Neurodevelopmental latent factor, which did not appear to be any more correlated with the Attention Problems subscale (as would be expected) than with the Internalizing subscale as measured in either the BPM—Teacher Report Form or the Youth Self Report. The CBCL Internalizing latent factor did not appear to be any more correlated with K-SADS internalizing disorders (e.g., MDD, anxiety disorders) than externalizing ones (e.g., ODD, CD), as correlations were uniformly robust across each pairwise trait and across racial and ethnic groups. This may indicate the lack of conceptual distinction between these putatively distinct traits (i.e., neurodevelopmental and internalizing disorders), which may not be inherently surprising considering the omnipresence of the p-factor in HiTOP studies (Michelini et al., 2019; Watts et al., 2022). The p-factor may have significantly attenuated the uniqueness of any single latent factor in our models, resulting in the relatively weak evidence of discriminant validity for each of the CBCL latent factors across racial and ethnic groups. Supporting this conclusion is that our cross-factor bivariate correlations consistently show between-factor correlations above .50 across racial and ethnic subgroups. Given that our study aimed to replicate the factor structure from Michelini et al., it may be worth testing alternative factor models beyond the five-factor correlated factor model, as increasing the number of latent factors might yield more orthogonality between the latent dimensions.
The p-factor notwithstanding, the weak evidence of discriminant validity of the CBCL latent factor models raises the broader question of whether HiTOP latent factors are distinct enough from one another to have meaningful utility for clinical science research. As it stands, the relatively scant HiTOP-aligned studies that have rigorously tested the validity of their measures and models have produced rather uninspiring conclusions with respect to this aspect of validity. Funkhouser and colleagues (2021) raised concerns about the weak criterion and discriminant validity and the reliability of HiTOP models when estimated using a bifactor model in a community sample (N = 504). Zimmermann and colleagues (2022) developed preliminary scales for the HiTOP Detachment spectrum using an MTurk and university-based sample and found “lower, but still substantial associations” with putatively unassociated traits from a different questionnaire (i.e., heterotrait-heteromethod), leading them to conclude that their scale only showed “some evidence” of convergent and discriminant validity. Contending with weak discriminant validity was also prominent in the development of the HiTOP Internalizing measure (Watson, Forbes, et al., 2022). We note that discriminant validation is complicated by the fact that there is no scientific consensus as to how discriminant validity ought to be established, as some studies consider it as a matter of varying degrees (e.g., degree to which the absolute value of the correlation between two constructs differs from one), whereas others define it as a dichotomous attribute (e.g., complete absence of a significant correlation between two constructs) (see excellent review by Rönkkö & Cho, 2020). We found Campbell’s (1960) classical conceptualization of discriminant validity to be instructive for its simplicity and practicality: “tests [should] not correlate too highly with measures from which it is supposed to differ” (Campbell, 1960, p. 548). Through this lens, few HiTOP-aligned studies, including ours, have provided convincing evidence of discriminant validity. In addition, the p-factor does not entirely explain the weak discriminant validity in HiTOP measures and constructs. Measurement artifacts, such as common methods variance, excessive redundancy and overlapping items, and unmeasured third variable effects (e.g., sociodemographic factors, cognitive abilities), may also be at play.
It is important to note that the current study did not aim to test and explain group differences in latent factors and their correlations with relevant constructs. As noted by several others (Bernard et al., 2021; Causadias & Cicchetti, 2018; Coll et al., 1996; Rodriguez-Seijas, Li, et al., 2023; Schwartz & Meyer, 2010), careful follow-up research is needed to fully and rigorously contextualize these types of findings by systematically investigating plausible causal mechanisms underlying HiTOP dimensions within and between racial and ethnic groups. Establishing that the higher-order latent dimensions are invariant and valid across race and ethnicity is critical for establishing the clinical utility of HiTOP (Cicero & Ruggero, 2021).
Several limitations of the current study should be mentioned. First, we did not test for individual item-level invariance of the CBCL across groups. Such tests would entail extensive differential item functioning analyses and would have been beyond the scope of the current study, which aimed to examine invariance at the level of latent factors (i.e., factorial invariance) (D’Urso et al., 2022; Kim & Yoon, 2011). Items that exhibit non-invariance may introduce systematic measurement error if a small number of items are used to measure an underlying construct. Future studies can build on the current study and examine item-level invariance of measures of psychopathology. Second, contextual (e.g., sociodemographic) information was not accounted for in our models. For example, ABCD families of non-Hispanic White youths had higher incomes and greater educational attainment compared to families of Hispanic and non-Hispanic Black youths. Crucially, socioeconomic status may impact not only the experience and expression of youth mental health traits and conditions but also parents’ reporting of their offspring’s mental health (Crijnen et al., 1999). Follow-up studies focusing on measurement invariance should account for contextual factors, such as socioeconomic status, which may affect item response and subsequent model fit across groups. Third, our analyses only focused on the three most prevalent racial and ethnic groups in the dataset. Youths from other racial and ethnic backgrounds could not be included in the analyses due to a very limited sample size relative to a rather complex model. Thus, the question of whether the HiTOP model is invariant across all racial and ethnic groups in the United States remains largely unanswered. Fourth, we only focused our analysis on the baseline wave of data collection, when the participants were aged 9–10 years. It is possible that the model we identified here may not be invariant at follow-up assessments, thus necessitating replication of this work at later follow-ups.
In summary, our study conducted extensive tests to validate the HiTOP model across several (but not all) racial and ethnic youth groups in the United States. We provided strong evidence for racial and ethnic measurement invariance of the five-factor model, as well as its convergent and concurrent validity, but found weak evidence for discriminant validity. In line with recent calls for a more equitable clinical science (Gordon, 2020; Rodriguez-Seijas, McClendon, et al., 2023), our study highlights the importance of testing the construct validity of measures for mental health measures across diverse populations, especially if they are to be used and interpreted for minoritized populations.
Supplemental Material
sj-docx-1-asm-10.1177_10731911251391567 – Supplemental material for Invariance and Construct Validity of HiTOP Dimensions Across Race and Ethnicity in the Adolescent Brain and Cognitive Development (ABCD) Study
Supplemental material, sj-docx-1-asm-10.1177_10731911251391567 for Invariance and Construct Validity of HiTOP Dimensions Across Race and Ethnicity in the Adolescent Brain and Cognitive Development (ABCD) Study by James J. Li, Quanfa He, Irwin D. Waldman and Craig Rodriguez-Seijas in Assessment
Footnotes
Authors’ Note
A listing of participating sites and a complete listing of the study investigators can be found at ![]() . ABCD consortium investigators designed and implemented the study and/or provided data but did not necessarily participate in the analysis or writing of this report. This manuscript reflects the views of the authors and may not reflect the opinions or views of the National Institutes of Health (NIH) or ABCD consortium investigators.
. ABCD consortium investigators designed and implemented the study and/or provided data but did not necessarily participate in the analysis or writing of this report. This manuscript reflects the views of the authors and may not reflect the opinions or views of the National Institutes of Health (NIH) or ABCD consortium investigators.
Declaration of Conflicting Interests
The authors declared no potential conflicts of interest with respect to the research, authorship, and/or publication of this article.
Funding
The authors disclosed receipt of the following financial support for the research, authorship, and/or publication of this article: The ABCD Study® is supported by the National Institutes of Health and additional federal partners under award numbers U01DA041048, U01DA050989, U01DA051016, U01DA041022, U01DA051018, U01DA051037, U01DA050987, U01DA041174, U01DA041106, U01DA041117, U01DA041028, U01DA041134, U01DA050988, U01DA051039, U01DA041156, U01DA041025, U01DA041120, U01DA051038, U01DA041148, U01DA041093, U01DA041089, U24DA041123, and U24DA041147. A full list of supporters is available at ![]() . James J. Li was supported by grants from Wisconsin Alumni Research Foundation, the National Institute of Mental Health (R01 MH134039, R01 MH128371) and in part by a core grant to the Waisman Center from the Eunice Kennedy Shriver National Institute of Child Health and Human Development (P50 HD105353).
. James J. Li was supported by grants from Wisconsin Alumni Research Foundation, the National Institute of Mental Health (R01 MH134039, R01 MH128371) and in part by a core grant to the Waisman Center from the Eunice Kennedy Shriver National Institute of Child Health and Human Development (P50 HD105353).
Data Availability Statement
Data used in the preparation of this article were obtained from the Adolescent Brain Cognitive Development (ABCD) Study (https://abcdstudy.org), held in the NIMH Data Archive (NDA). This is a multisite, longitudinal study designed to recruit more than 10,000 children age 9–10 years and follow them over 10 years into early adulthood. The ABCD data repository grows and changes over time. The ABCD data used in this report came from https://nda.nih.gov/study.html?id=901. DOIs can be found at ![]() .
.
Supplemental Material
Supplemental material for this article is available online.
References
Supplementary Material
Please find the following supplemental material available below.
For Open Access articles published under a Creative Commons License, all supplemental material carries the same license as the article it is associated with.
For non-Open Access articles published, all supplemental material carries a non-exclusive license, and permission requests for re-use of supplemental material or any part of supplemental material shall be sent directly to the copyright owner as specified in the copyright notice associated with the article.