
Abstract
Future orientation encompasses positive expectations about the future, the presence of reasons for persevering, and the perceived ability to cope and pursue goals under hardship, and is associated with beneficial health outcomes. Using exploratory factor analysis (EFA) and confirmatory factor analysis (CFA), the psychometric properties of the six-item Future Orientation Scale (FOS) were evaluated among samples of predominantly racially and ethnically minoritized undergraduates (N = 3,219), individuals with fibromyalgia (N = 508), and sexual and gender minority (SGM) individuals (N = 496). A single-factor solution emerged in the developmental sample, and CFA indicated adequate fit in each sample. Multigroup CFA supported full configural, metric, and scalar invariance, allowing for meaningful latent mean comparisons. Undergraduates exhibited the highest latent future orientation, followed by the SGM and fibromyalgia samples, respectively. Findings demonstrate that the FOS shows strong measurement invariance and captures substantive variation in future orientation across three populations at elevated psychological and physical health risk.
Introduction
The ability to visualize the future underlies motivation and goal-directed behavior (Atance & O’Neill, 2001; Baumeister et al., 2016). Without insight into the possible outcomes of one’s actions, whether desired or feared, most individuals would likely expend little effort on planning and executing their activities (Andre et al., 2018). Broadly, the way one perceives the future determines motivation, self-regulation, goal setting and planning, actions, and outcomes; guides health behaviors (e.g., exercise and substance use); and influences affective experiences and work and school performance (Baird et al., 2021; Kooij et al., 2018). Multiple theoretical frameworks exist to describe one’s perception of time, with several prominent models highlighting the role of future-oriented thinking in shaping behavior and decision-making (Carstensen et al., 1999; Strathman et al., 1994; Zimbardo & Boyd, 1999). We evaluated the psychometric properties of a measure of future orientation, the Future Orientation Scale (FOS; Hirsch et al., 2006), in populations at risk for physical and psychological health conditions, specifically an undergraduate sample primarily composed of racially and ethnically minoritized students, persons with fibromyalgia, and sexual and gender minority (SGM) individuals.
Future Orientation and Its Measurement
Broadly, future orientation, also termed future time perspective, refers to the tendency to consider the future to inform current actions and decisions, although its operationalization varies (Andre et al., 2018). Subjective temporal experience comprises distinct, non-mutually exclusive future, present, and past perspectives (Joireman et al., 2008; Zimbardo & Boyd, 2008). Three conceptualizations of future orientation currently predominate the literature (Kooij et al., 2018).
First, future time perspective, one of the five factors of the Zimbardo Time Perspective Inventory (ZTPI), operationalizes time perspective as an individual’s views of the past, present, and future that organize experiences and influence decisions, goals, expectations, and actions (Zimbardo & Boyd, 1999). Scores on the ZTPI’s subscales, future, present-fatalistic, present-hedonistic, past-negative, and past-positive, form a temporal orientation profile (Zimbardo & Boyd, 1999, 2008). Future-oriented persons strive to attain their goals and realize rewards and are more likely to weigh the potential positive and negative outcomes of their actions (Zimbardo & Boyd, 1999; Zimbardo et al., 1997). However, healthy functioning may be compromised when temporal orientation becomes inflexibly anchored to one time frame, and individuals with excessive future orientation may sacrifice current enjoyment and social/community connections in favor of an idealized future outcome (Boniwell & Zimbardo, 2004). The ZTPI’s psychometric performance has been inconsistent, with studies reporting variable factor structures, low factor loadings, and suboptimal reliability (e.g., Davis & Cernas Ortiz, 2017; Milfont et al., 2008; Shipp et al., 2009; Worrell et al., 2018).
The second most common conceptualization of future-oriented thinking is consideration of future consequences (CFC), measured by the 12-item CFC Scale, and reflects how strongly individuals weigh present versus possible future consequences when guiding current behavior (Strathman et al., 1994). Individuals with low CFC scores tend to focus on satisfying immediate needs, while those high in CFC allow their distant goals to direct current actions and engage in health-promoting behaviors such as healthy eating and exercise (Joireman et al., 2012). Strathman et al. (1994) found support for a unidimensional factor structure, whereas subsequent studies support a two-factor structure capturing immediate and future consequences (Joireman et al., 2008; Petrocelli, 2003) or indicate that the factor structure is unclear (Rappange et al., 2009).
Third, the 10-item Future Time Perspective Scale (FTPS) measures perceived remaining lifespan and opportunities available within that timeframe (Carstensen & Lang, 1996). According to Carstensen et al.’s (1999) socioemotional selectivity theory, perception of time shapes social goal setting and pursuit, such that emotional goals are prioritized when time is viewed as limited and knowledge-related goals are prioritized with an open-ended perception of time. This construct is flexible, changing over time with age and health status (Carstensen & Fredrickson, 1998). The accepted factor structure of the FTPS also varies across studies, from one to three dimensions (Carstensen & Lang, 1996; Kooij et al., 2014; Przepiorka et al., 2021).
Theoretical Foundation of the FOS
Framed through the lenses of cognitive (A. T. Beck, 1979) and self-determination theories (Deci & Ryan, 1985), Hirsch et al. (2006) conceptualized future orientation as a broad construct encompassing positive perceptions and emotions regarding the future, the ability to prospectively imagine future states, reasons for living and persevering, and formulation of active strategies to attain goals, and we expand this original theoretical foundation to clarify the conceptual relevance of the FOS and distinguish it from other future-oriented instruments.
According to cognitive theory, expectations about the future shape appraisal of difficult experiences and organize emotional and behavioral responses to challenge (A. T. Beck, 1979) and, when rigidly negative, play a central role in depression and suicidal behavior by biasing interpretations of situations and contributing to withdrawal, inactivity, and loss of motivation (A. T. Beck, 1975; Clark et al., 1999). Hirsch et al. (2006) developed the FOS, comprising six future-oriented items from the Reasons for Living–Older Adults Scale (RFL-OA), to assess adaptive, temporally focused motivational contributors to resilience in the context of evaluating reasons for living as protection against suicidal behavior in patients with clinically significant depression (Edelstein et al., 2009), emphasizing endurance and meaning during periods of psychological distress. Given this, the FOS assesses constructive future-oriented cognitions, such as “No matter how badly I feel, I know it will not last” and “Tomorrow I may feel better,” that counter rigid negative beliefs by underscoring the transience of suffering and possibility of improvement (Hirsch et al., 2006; see the appendix for full scale), and other items characterizing beliefs about managing difficulties, including “I believe I can learn to adjust or cope with my problems” and “I have coped before and I can do it again,” evaluate expectations about problem-solving ability that inform goal-directed behavior (A. T. Beck, 1979).
Drawing from self-determination theory (SDT), the FOS is also intended to assess motivational processes that underpin psychological growth and well-being (Deci & Ryan, 2000; Ryan & Deci, 2000). SDT asserts that psychological growth depends on satisfying the basic psychological needs for autonomy (i.e., volitional action), competence (i.e., effectiveness and mastery), and relatedness (i.e., social connection), and that motivation is strongest when future pursuits are perceived as meaningful, attainable, and value/interest-congruent (Deci & Ryan, 1985; Ryan & Deci, 2000, 2017). Anticipating a personally meaningful future fuels behavior even when tasks are difficult or unpleasant (Ryan & Deci, 2017). The coping-related FOS items reflect perceived competence, while the item “I have future plans I am looking forward to carrying out” reflects autonomous, self-endorsed engagement with future goals (Ryan & Deci, 2000). Furthermore, “I have the hope that things will improve and the future will be happier” captures a sense of meaning connecting present experience to valued outcomes (Ryan & Deci, 2017). Supporting this motivational conceptualization of future orientation, prior work suggests that autonomy and competence are plausible mechanisms linking future orientation to less depression in multiethnoracial adults (E. C. Chang, Chang, et al., 2019).
Differentiation From Related Constructs
Conceptually, the FOS represents a distinct approach to assessing future-oriented cognition and motivation. Future time perspective, as operationalized by the ZTPI, focuses on temporal orientation and the extent to which the future is habitually considered when planning behavior (Boniwell & Zimbardo, 2004). Furthermore, the CFC scale involves weighing immediate versus delayed behavioral outcomes when making decisions (Strathman et al., 1994), whereas the FTPS centers on perceptions of remaining time and future opportunities (Carstensen & Lang, 1996). Although these measures depict discrete aspects of temporal thinking and anticipation of future outcomes, they do not explicitly assess the personal meaning or emotional relevance the future holds, nor beliefs about capacity to cope with distress while remaining oriented toward future plans (Carstensen & Lang, 1996; Strathman et al., 1994; Zimbardo & Boyd, 1999).
Although related prospective constructs such as optimism and hope share conceptual similarities with future orientation, they are operationalized within expectancy-value models of motivation and differ regarding how future expectancies are theorized to influence behavior (Eccles et al., 1983; Eccles & Wigfield, 2002; Snyder et al., 2001). According to hope theory, continuous reciprocal feedback between the efficacy expectancy of agency (perceived capacity to successfully pursue goals) and the outcome expectancy of pathways (perceived ability to devise strategies to achieve goals) guides goal-directed behavior (Snyder, 2002; Snyder et al., 1991). Within the dispositional optimism framework, in contrast, generalized favorable expectancies (akin to hope’s agency thinking; Snyder et al., 2001) are the primary drivers of goal pursuit, such that confidence in reaching the desired outcome supports continued effort even when encountering significant obstacles (Carver et al., 2010; Scheier & Carver, 1985). Both constructs primarily reflect cognitive processes that activate once a goal of significant personal value is identified (Snyder, 2002). Conversely, the FOS captures a broad, more foundational prospective outlook that subsumes efficacy and outcome expectancies, assessing beliefs that are necessary for establishing, planning for, and attaining meaningful goals (Hirsch et al., 2006). Specifically, future orientation, per the FOS, functions as a sustaining motivational resource catalyzing current goal-directed engagement and perseverance under stress by connecting perceived coping capacity to the expectation of improved future circumstances (Hirsch et al., 2006, 2015).
By encompassing both why the future is worth striving for (believing improvement is meaningful and sustaining) and how one can persevere (believing in coping ability and control over outcomes), the FOS assesses a form of future orientation that is theoretically relevant to resilience under prolonged stress and health risk, both mental and physical; that is, the FOS conceptualizes that the future serves as a reason for continued, adaptive engagement with life and stressors rather than merely a target of forecasting or planning (Hirsch et al., 2006, 2007). As such, future orientation predicts lower depressive symptoms above and beyond optimism and may interact with optimism to reduce depression and suicidal behavior in both clinical (i.e., primary care patients) and non-clinical populations (i.e., college students; E. C. Chang et al., 2013; Yu & Chang, 2016). Furthermore, via its beneficial impact on vitality, interpersonal functioning, and treatment adherence, future orientation is linked to decreased pain severity in patients with fibromyalgia and better health-related quality of life in primary care patients (E. C. Chang, Lucas, et al., 2019; Hirsch et al., 2015; Nsamenang & Hirsch, 2015). By focusing on future-directed beliefs and meaning without evaluating present behavior, as the ZTPI and CFC do, the FOS may also reduce measurement confounds related to delay discounting (i.e., choosing smaller immediate rewards over larger future rewards) and impulsive or high-risk behaviors common in clinical populations, while still acknowledging present context alongside belief in a better future (Joireman et al., 2012; Odum et al., 2020; Zimbardo & Boyd, 1999).
Clinical Relevance
These theoretical distinctions highlight the value of the FOS as a brief, conceptually focused measure of future-directed beliefs. For example, although a specialized intervention based on the ZTPI, time perspective therapy (Zimbardo et al., 2012), has demonstrated improvements in anxiety, depressive, and post-traumatic stress symptoms in small samples (Mirzania et al., 2022; Sword et al., 2015), time perspective is generally conceptualized as embodying rather stable, trait-like temporal biases or individual differences that are not targeted as primary mechanisms of change in standard cognitive and behavioral treatments (Zimbardo & Boyd, 1999). Similarly, the Trait Hope Scale (Snyder et al., 1991) and the Life Orientation Test (Scheier et al., 1994) were designed as dispositional indices and, therefore, individual scores are expected to remain relatively consistent over time; thus, they are not typically used to assess change processes in clinical care (Scheier & Carver, 1985; Snyder et al., 2001). Notably, the State Hope Scale was later developed to measure momentary goal-related agency and pathway thoughts, yet it still assumes that goals have already been determined (Snyder et al., 1996).
In contrast, the FOS represents a more dynamic, integrated prospective orientation that taps into modifiable cognitive-motivational processes amenable to standard clinical intervention (O. D. Chang et al., 2020; E. C. Chang, Chang, et al., 2019). Rather than presuming active goal pursuit, the FOS evaluates whether an individual believes the future is worth striving toward at all and current distress can be endured long enough for change to occur (Hirsch et al., 2006). These beliefs are especially relevant in circumstances of demoralization, chronic stress or health problems, or suicidal behavior, in which goal identification and agency may be compromised (Bobevski et al., 2022; O’Connor et al., 2012). The FOS items articulate a sense of striving and anticipation, or motivational pull, toward the future, capturing readiness for and elements of potential change that can be built upon to galvanize and perpetuate goal-directed behavior, once engagement becomes possible (Hirsch et al., 2007, 2015; Yu & Chang, 2016).
Through techniques such as cognitive restructuring, goal setting, and activity scheduling, cognitive behavioral therapy (CBT) strengthens adaptive future-oriented appraisals and confidence in coping ability, thereby promoting behavioral engagement (J. S. Beck, 2011). In addition, CBT for suicide prevention links present coping to future survival and recovery through relapse prevention and safety planning, which involve preparing and rehearsing coping responses for high-risk situations (Stanley et al., 2009). Furthermore, motivational interviewing elicits future-focused “change talk” by highlighting discrepancies between current behavior and desired prospective outcomes, bolstering motivation to actively pursue longer-term goals (W. R. Miller & Rollnick, 2023). From a health behavior change perspective, future-directed beliefs are central to theories such as the health belief model and protection motivation theory, in which expectations about future health outcomes shape intentions and adherence to health-promoting behaviors (Maddux & Rogers, 1983; Rosenstock, 1974). Finally, the FOS items evaluating expected improvement in circumstances, eagerness to execute future plans, and distress tolerance align with acceptance and commitment therapy, which helps individuals clarify values and commit to meaningful future pursuits, even when managing chronic health conditions or ongoing hardship (Hayes et al., 2016).
Together, these approaches underscore the applied value of the FOS as a measure of foundational, future-oriented cognitive–motivational processes that precede and enable goal pursuit, are clinically malleable, and are central to adaptive functioning under prolonged stress. Next, we provide a brief overview of the development of the parent scales of the FOS, the Reasons for Living Inventory (RFL; Linehan et al., 1983), and the RFL-OA (Edelstein et al., 2009).
Lineage and Development of the FOS
Future-oriented positive expectations and beliefs have long been considered protective factors for suicidal behavior (A. T. Beck et al., 1989; Linehan & Nielsen, 1981; Teismann et al., 2018). The original RFL (Linehan et al., 1983) was developed, first, by asking adults to list reasons for staying alive and, then, via content analysis and exploratory factor analysis (EFA) across two additional samples, yielding 48 items representing six clusters of adaptive beliefs (e.g., responsibility to family, survival, and coping beliefs). Recognizing that reasons for living may differ by age (J. S. Miller et al., 2001), Edelstein et al. (2009) adapted the RFL for older adults (RFL-OAs), incorporating new items generated from older community-dwelling adults to enhance content validity and retaining RFL items that closely approximated their responses. For the validation study, clinical participants in treatment for depression were selected through expert consensus on mood disorder diagnoses, based on the expectation that they would endorse fewer reasons for living, an assertion that was supported. The RFL-OA showed strong psychometric properties, including moderate, negative correlations with depression and suicide measures (convergent validity), no correlation with physical or mental functioning (discriminant validity), incremental validity with suicide ideation (SI), criterion validity with suicidal behavior, and excellent internal consistency in both community (α = .96) and clinical (α = .98) samples (Edelstein et al., 2009). Later, factor analyses revealed a five-factor structure characterizing distinct categories of reasons for living (Lutz et al., 2019).
While the RFL and RFL-OA included a variety of adaptive beliefs, no single subscale and relatively few items directly assessed a prospective temporal orientation. Thus, to isolate this construct within a clinical depression sample, Hirsch et al. (2006) selected a subset of RFL-OA items for the FOS based on their face validity for future-focused beliefs. Inpatients and outpatients aged 50 and older with depression rated each item’s significance in preventing suicide attempts on a Likert-type scale ranging from 1 (extremely unimportant) to 6 (extremely important). Greater endorsement of future orientation was associated with lower probability of past suicide attempts, lower current SI, and less severe worst-point SI (Hirsch et al., 2006). By focusing specifically on future-directed thinking, the FOS addressed a conceptual limitation of the broader RFL frameworks and provided a more targeted measure of protective cognitive beliefs.
The Present Study: Psychometric Goals and Rationale
Factorial Validity and Reliability
Although prior studies have calculated internal consistency reliability of the FOS as part of standard methodological reporting alongside other study variables, this is the first study to comprehensively evaluate its psychometric properties, including its factor structure via exploratory and confirmatory factor analysis (CFA). Of note, the FOS cannot be considered a subscale of the RFL-OA, as its six items span multiple RFL-OA subscales. McDonald’s (1999) omega total was calculated to assess internal consistency reliability, and inter-item and corrected item-total correlations were used to evaluate whether all items cohesively measure the same construct across samples (Boateng et al., 2018). We predicted the FOS would demonstrate good internal consistency and acceptable item-level statistics, based on good to excellent reliability in prior studies (e.g., E. C. Chang et al., 2017; Hirsch et al., 2006, 2015).
Sample Justification and Measurement Invariance
Across studies, FOS scores have demonstrated meaningful associations with physical health outcomes, quality of life, treatment adherence, and psychological well-being in primary care patients, individuals with fibromyalgia, and multiethnoracial adults (e.g., E. C. Chang, Lucas, et al., 2019; Hirsch et al., 2015; Nsamenang & Hirsch, 2015; Yu & Chang, 2016). These findings provided the basis for our sample selection. To evaluate the psychometric performance and generalizability of the FOS across populations that vary in medical status, sociodemographic characteristics, and minority stress exposure, we selected three distinct groups: an undergraduate sample in which a majority of participants (i.e., 83%) identified as members of racially and ethnically minoritized groups (Sample 1), individuals with fibromyalgia (Sample 2), and SGM individuals (Sample 3).
A dearth of research exists exploring resilience factors among SGM individuals, and future orientation offers promise as a buffer against minority stress and poor health outcomes (Kirtley et al., 2018; Kwon, 2013). Likewise, undergraduate students experience heightened vulnerability to emerging mental health conditions and suicidal behavior due to group-specific developmental, financial, and academic stressors (Mofatteh, 2021; Paiva et al., 2025), which, among racially and ethnically minoritized students, are exacerbated by institutional and interpersonal discrimination (Bravo et al., 2023; Qeadan et al., 2022). Finally, in individuals with fibromyalgia, future orientation is associated with improvement in psychosocial factors (e.g., social isolation) contributing to pain severity (E. C. Chang, Lucas, et al., 2019), but its protective role remains relatively unexplored in the literature. Assessing the FOS’ measurement properties across these samples supports examination of its broader applicability in diverse clinical (e.g., primary care) and research contexts. If psychometrically sound, the FOS may offer a brief alternative to longer time perspective measures with less consistent measurement performance.
It is essential to evaluate measurement invariance to determine whether scale items function equivalently across populations and ensure valid and unbiased group comparisons (R. Fischer & Karl, 2019). Based on current guidelines, to assess a measure’s basic structure and ability to detect true mean differences among diverse populations, full configural, partial metric, and partial scalar invariance are required (Hair et al., 2018). Configural invariance indicates that the basic factor structure is similar across samples, metric invariance refers to the equivalence of factor loadings across samples, and scalar invariance pertains to the equivalence of item thresholds or intercepts (Putnick & Bornstein, 2016). Of note, full scalar invariance requires that all factor loadings and intercepts are constrained across samples; thus, it is difficult to establish and generally considered unrealistic and excessively strict when comparing diverse groups, and partial invariance is the accepted alternative (Boer et al., 2018).
Although prior studies report good internal consistency reliability (e.g., Hirsch et al., 2007; Kelliher Rabon et al., 2019), the latent structure and measurement invariance of the FOS have not been systematically evaluated. We hypothesized that the FOS would demonstrate a consistent factor structure across groups, supporting full configural and metric invariance, but that partial scalar invariance would be found. Specifically, we anticipated that some item thresholds might vary across groups due to contextual factors affecting how respondents interpret and rate certain items, rather than a true mean difference in the underlying future orientation construct. For example, individuals with fibromyalgia report elevated psychological distress and poorer future-related cognitions, including lower optimism and self-efficacy and greater pain catastrophizing, compared with non-clinical peers (Arrayás-Grajera et al., 2021; Estévez-López et al., 2018; Galvez-Sánchez et al., 2019). Thus, they may endorse lower scores on items that reference short-term improvement (e.g., “Tomorrow I may feel better”) because of realistic expectations about persistent illness-related symptoms, while providing responses comparable with other groups on the remaining FOS items. If scalar invariance was supported, indicating equivalence of item thresholds across samples such that any group differences in FOS item means would reflect true differences in the underlying future orientation construct rather than measurement bias, we would then test latent mean differences across the three populations (Meredith, 1993).
Convergent and Discriminant Validity
Construct validity was further evaluated by examining convergent and discriminant validity (Boateng et al., 2018). We hypothesized that convergent validity would be demonstrated via moderate correlations with conceptually similar, but distinct, future-oriented constructs, and discriminant validity via non-significant or negligible correlations with theoretically unrelated constructs (Gregory, 2016). To evaluate convergent validity, we used measures of related prospective constructs, specifically hope (Rand & Fischer, 2020), optimism (Carver et al., 2010), future self-rated health (i.e., expected health at a fixed future time point; Ferraro & Wilkinson, 2015), and the ZTPI–Future subscale (ZTPI-F; Zimbardo & Boyd, 1999). Future orientation shares approximately 31% variance with hope, and is moderately associated with hope, optimism, and pessimism among primary care patients (Nsamenang & Hirsch, 2015; Snyder et al., 1991).
To evaluate discriminant validity, in Sample 1, we used measures of physical health-related quality of life (PHRQL) and rumination, as the FOS was unrelated to PHRQL in Hirsch et al. (2015), and rumination is considered to embody a past-focused temporal orientation (Goring & Papageorgiou, 2008). Measures of physical functioning were chosen for Sample 2, as they were unrelated to the RFL-OA in Edelstein et al.’s (2009) study. In Sample 3, perceived gender and sexual orientation-based discrimination and community connectedness measures were selected because future-oriented constructs were unrelated to perceived gender discrimination (Sia et al., 2015) and weakly correlated with social acceptance (Coudin & Lima, 2011) in prior studies.
Method
This study included three distinct samples, each differing in recruitment approach and study design, as outlined below.
Sample 1: Undergraduates
Participants
Students from a public urban university in New York, United States were recruited to complete an online survey. The university’s institutional review board (IRB) approved the study, participants provided informed consent, and participation fulfilled a research requirement. The large (N = 3,219) undergraduate sample was predominantly Hispanic (n = 1,289; 40.0%) and, in descending frequency, White (n = 551; 17.1%), Black (n = 454; 14.1%), Asian (n = 363; 11.3%), biracial (n = 324; 10.1%), other (n = 227; 7.1%), and Indian (n = 11; 0.3%). Most participants identified as female (n = 2,366; 73.5%), while 848 (26.3%) were male and 5 (0.2%) participants did not respond. Respondents were between the ages of 18 and 65, with a mean age of 20.6 years (SD = 4.0).
Measures
Internal consistency estimates (McDonald’s omega total) for all measures in each sample are presented in Table 1.
Descriptives and Reliability for Study Measures by Complete Sample.
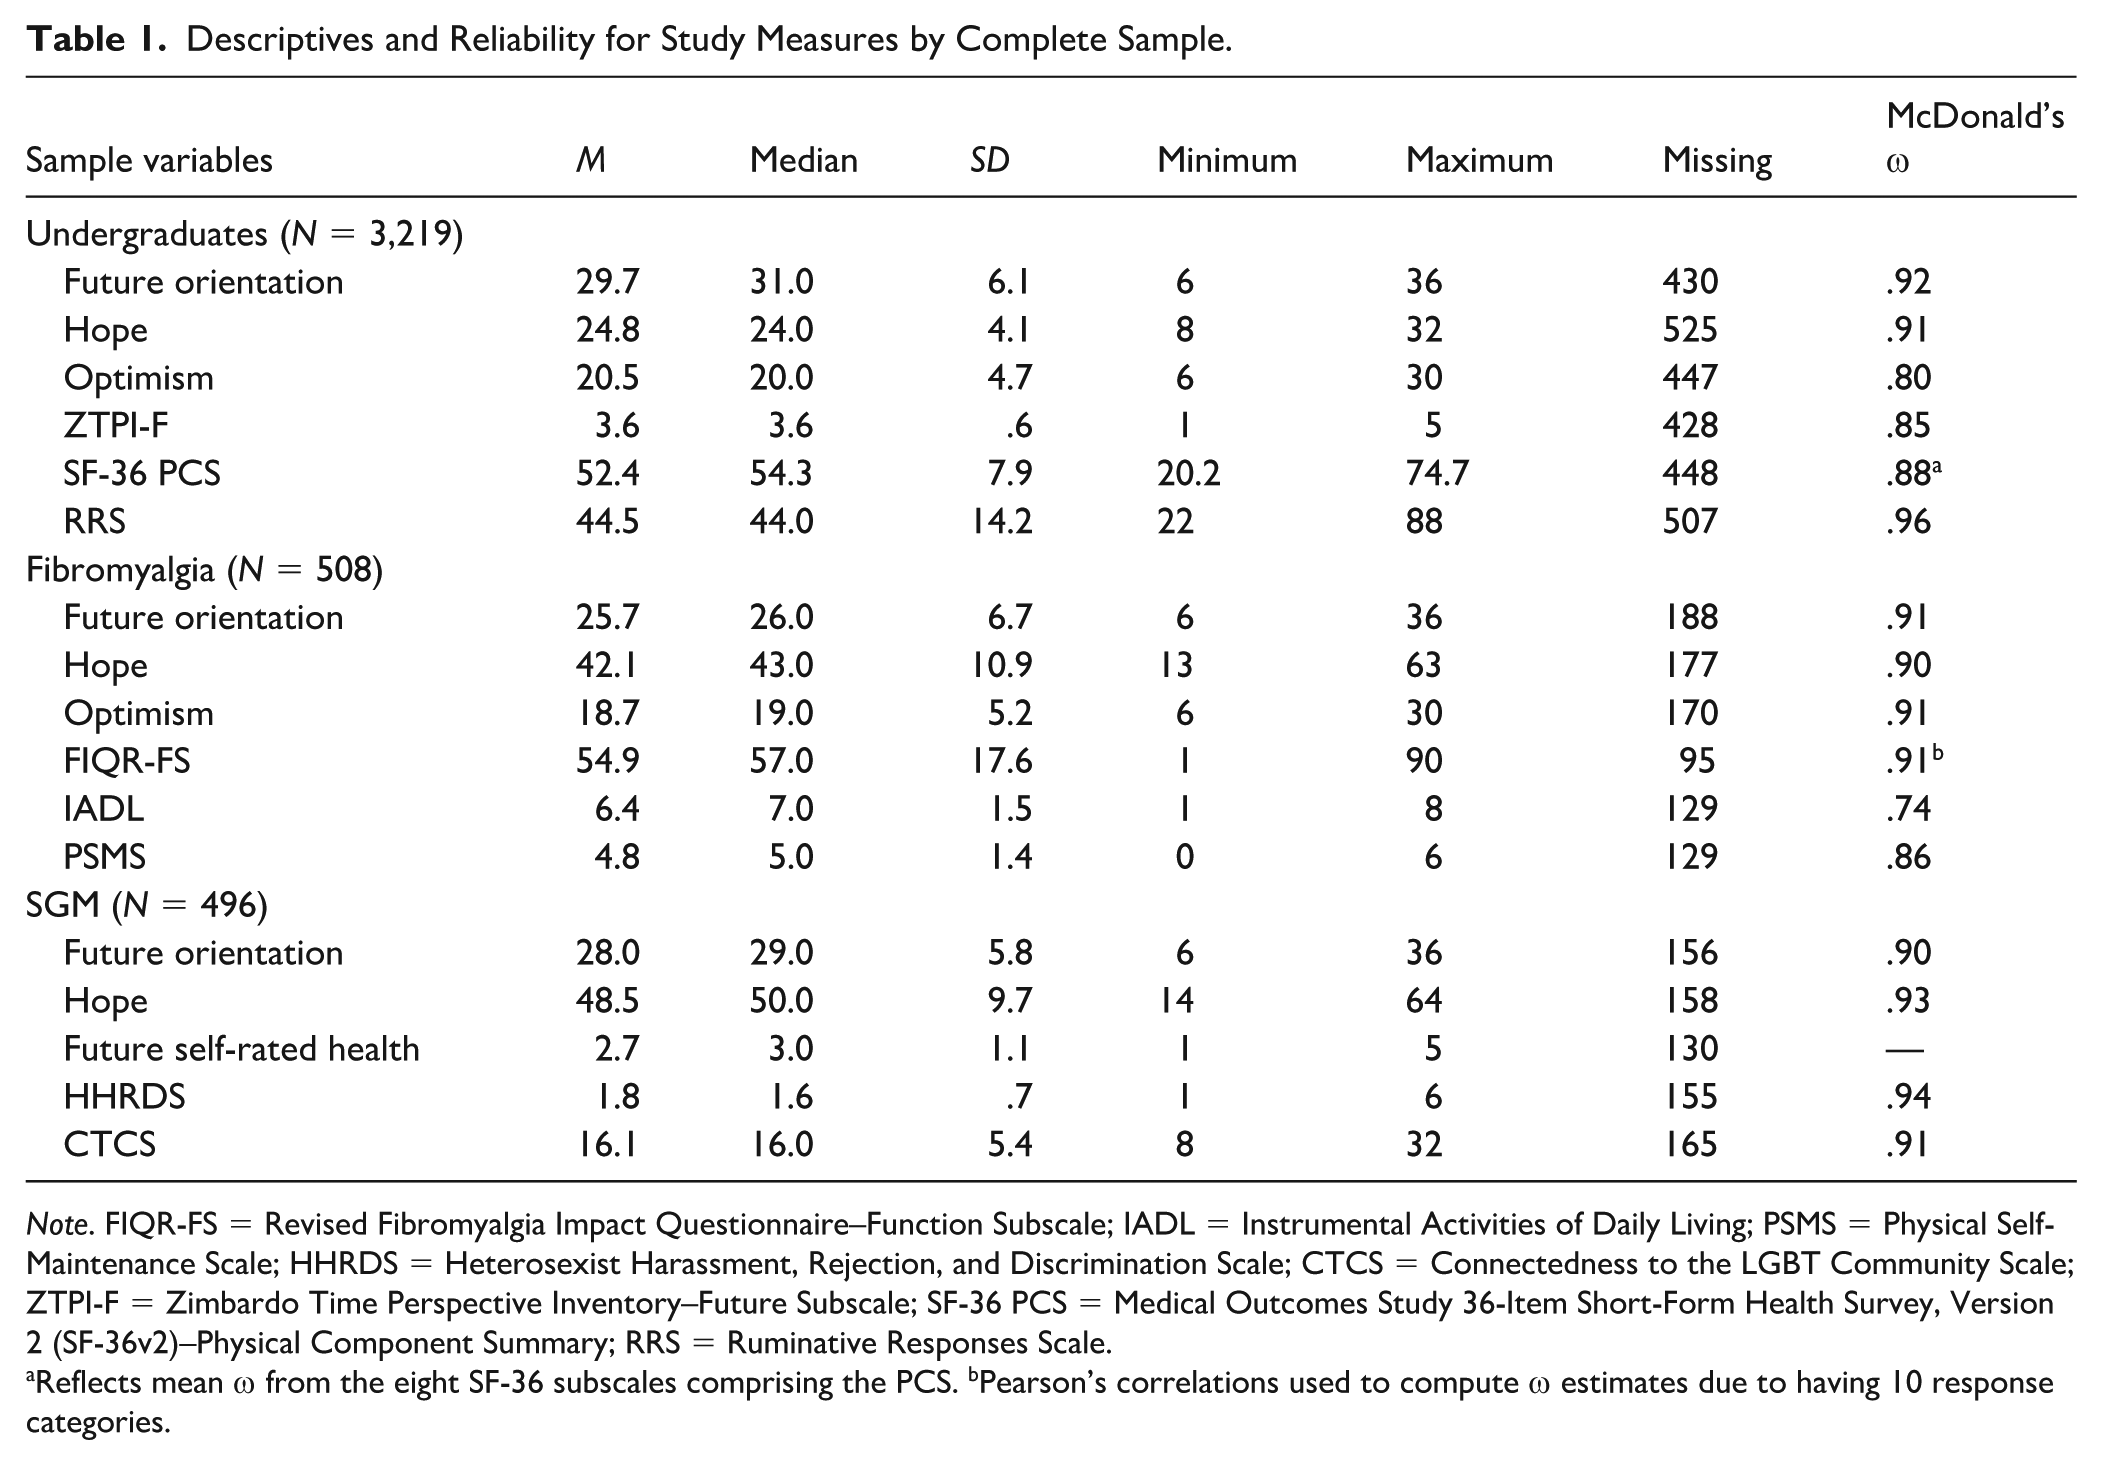
Note. FIQR-FS = Revised Fibromyalgia Impact Questionnaire–Function Subscale; IADL = Instrumental Activities of Daily Living; PSMS = Physical Self-Maintenance Scale; HHRDS = Heterosexist Harassment, Rejection, and Discrimination Scale; CTCS = Connectedness to the LGBT Community Scale; ZTPI-F = Zimbardo Time Perspective Inventory–Future Subscale; SF-36 PCS = Medical Outcomes Study 36-Item Short-Form Health Survey, Version 2 (SF-36v2)–Physical Component Summary; RRS = Ruminative Responses Scale.
Reflects mean ω from the eight SF-36 subscales comprising the PCS. bPearson’s correlations used to compute ω estimates due to having 10 response categories.
Future Orientation Scale
The six-item FOS (Hirsch et al., 2006) evaluates future orientation using a 6-point scale (1 = extremely unimportant; 6 = extremely important). Total scores range from 6 to 36, with higher scores indicating greater FO. In prior samples, internal consistency was good to excellent (α = .85–.91; O. D. Chang et al., 2020; Hirsch et al., 2006; Kelliher Rabon et al., 2019) and moderately related to depression (r = −.48, p < .001; O. D. Chang et al., 2020) and optimism (r = .47, p < .01; E. C. Chang et al., 2013), supporting construct validity.
Trait Hope Scale
The Trait Hope Scale (THS; Snyder et al., 1991) is a two-factor scale that includes eight scored items and four filler items, assessing agency (goal-directed determination) and pathways (generating strategies for meeting goals). The four agency (e.g., “I energetically pursue my goals”) and four pathways (e.g., “There are lots of ways around any problem”) items are rated from 1 (definitely false) to 8 (definitely true) and summed to generate a total hope score ranging from 8 to 64, with higher scores indicating greater hope. In five chronic illness and non-clinical samples, internal consistency was good to excellent (α = .84–.93), and hope was moderately related to optimism, anxiety, and depression, supporting construct validity (I. C. Fischer et al., 2018; Hirsch & Sirois, 2016; Kelberer et al., 2018).
Life Orientation Test-Revised
The Life Orientation Test-Revised (LOT-R; Scheier et al., 1994) measures generalized optimism and includes six scored items (e.g., “I’m always optimistic about my future”) and four filler items rated on a 5-point Likert-type scale (1 = strongly disagree; 5 = strongly agree). After reverse scoring the three negatively worded items, scores range from 6 to 30, with higher values indicating greater optimism. In clinical and non-clinical samples, the LOT-R shows acceptable to good internal consistency (α = .78–.85) and convergent validity with measures of hope, life satisfaction, personal growth, and purpose in life (Gallagher & Lopez, 2009; Thompson et al., 2018).
Zimbardo Time Perspective Inventory–Future Subscale
The 13-item future subscale of the ZTPI (Zimbardo & Boyd, 1999) assesses future time perspective (e.g., “You can’t really plan for the future because things change so much”) on a 5-point scale (1 = very untrue; 5 = very true). After reverse scoring three items, a mean score is calculated, with higher scores indicating greater future time perspective. Although the five-factor structure of the ZTPI has been questioned, the future subscale showed acceptable reliability (α = .79) and moderate correlations with hope in college students (Davis & Cernas Ortiz, 2017).
Medical Outcomes Study 36-Item Short-Form Health Survey, Version 2 (SF-36v2): Physical Component Summary
The Medical Outcomes Study 36-Item Short-Form Health Survey, Version 2 (SF-36v2; Ware, 2004) measures perceived health and quality of life across eight subscales using 36 items (e.g., “Compared to one year ago, how would you rate your health in general now?”) rated on 2- to 6-point Likert-type scales. The Physical Component Summary (PCS) incorporates weighting of each subscale and T-score transformations to calculate a physical health summary score (range = 0–100), with higher scores denoting better perceived physical health. The PCS demonstrates incremental validity via poorer scores in adults with more physical comorbidities (Bayliss et al., 2012). In over 25 samples, reliability for each subscale ranges from acceptable to excellent, with a median alpha >.80 for all scales except social functioning (McDowell, 2006).
Ruminative Responses Scale
The 22-item Ruminative Responses Scale (RRS) of the Response Styles Questionnaire (Nolen-Hoeksema et al., 1999) assesses the tendency to ponder the meanings, causes, and consequences of distress, rather than solutions, by evaluating the frequency of ruminative responses (e.g., “Think about how sad you feel) on a 4-point scale (1 = almost never; 4 = almost always). The RRS comprises three subscales: brooding, reflection, and depressive cognitions. Total scores range from 22 to 88 points, with higher scores indicating greater rumination. The RRS demonstrated excellent reliability (α = .94) and moderate correlations with hopelessness, anxiety, and depression in a college student sample (Starr & Davila, 2012).
Sample 2: Individuals With Fibromyalgia
Participants
This study was approved by a university IRB and invitations were sent to state, regional, and national organizations and support groups to recruit individuals with fibromyalgia. Participants (N = 508) provided informed consent and completed self-report surveys online, via a secure server, and received no compensation. The sample was predominantly female (n = 401; 78.9%; male: n = 18; 3.5%) and White (n = 383, 75.4%); however, many respondents did not report their sex (n = 89; 17.5%) or race/ethnicity (n = 91; 17.9%). Thirteen (2.6%) participants identified as Black or African American, 11 (2.2%) as multiracial, 6 (1.2%) as Asian, and 1 (.2%) as Native Hawaiian or Other Pacific Islander. The mean age of the sample was 47.8 (SD = 13.0), with a range of 15 to 76 years.
Measures
Participants completed the FOS, THS, and LOT-R, as well as the following measures.
Revised Fibromyalgia Impact Questionnaire – Function Subscale
The Revised Fibromyalgia Impact Questionnaire – Function Subscale (FIQR-FS; Bennett et al., 2009) assesses difficulty performing daily activities over the past 7 days due to fibromyalgia symptoms. Nine items (e.g., “Brush or comb your hair”) are rated on an 11-point Likert-type scale (0 = no difficulty; 10 = very difficult) and summed (range = 0–90), with higher scores indicating greater impairment. The FIQR demonstrated construct validity through moderate to strong correlations with SF-36 physical health subscales, showed good internal consistency (α = .95), and distinguished fibromyalgia from other conditions and controls in the validation study (Bennett et al., 2009).
Instrumental Activities of Daily Living Scale
The eight-item Instrumental Activities of Daily Living (IADL; Lawton & Brody, 1988a) measures functional independence across activities of daily living (ADLs; e.g., shopping, handling finances, laundry) through 3 to 5 potential responses per item, ranging from highest to lowest functional level. Each response is scored as either 1 (independent) or 0 (dependent), with total scores ranging from 0 to 8, where higher scores denote greater independence. The IADL has demonstrated excellent interrater (r = .99) and test–retest reliability (r = .93) in geriatric inpatients (Edwards, 1990) and, among rural outpatients, good internal consistency (α = .84) and convergent validity with mental status, psychosocial functioning, and living situation (Vittengl et al., 2006).
Physical Self-Maintenance Scale
The six-item Physical Self-Maintenance Scale (PSMS; Lawton & Brody, 1988b) evaluates ability to complete basic ADLs (e.g., feeding, dressing, and grooming) via five possible responses per category. Each item is scored either 1 (independent) or 0 (dependent), with total scores ranging from 0 to 6 and higher scores indicating greater independence. The PSMS was moderately related to and predicted pain severity, malnutrition risk, and cognitive scores (Tanaka et al., 2020) and reliability was excellent (α = .90–92) in clinical populations (Rosenblum & Tamar Weiss, 2010; Sun, 2011).
Sample 3: Sexual and Gender Minority Individuals
Participants
Individuals identifying as a member of an SGM group were invited via state, regional, and national support groups and advocacy organizations to participate in this online study. The study was approved by a university IRB, participants provided electronic informed consent, and no compensation was provided. Most of the sample (N = 496) identified as female (n = 201; 44.8%), while the remainder identified as male (n = 135; 30.1%), genderqueer (n = 21; 4.7%), transgender male (n = 21; 4.7%), non-binary (n = 17; 3.8%), transgender female (n = 14; 3.1%), genderfluid (n = 8; 1.8%), agender (n = 6; 1.3%), two-spirit (n = 5; 1.1%), and intersex (n = 2; 0.4%). Participants were predominantly White (n = 365, 81.7%), followed by multiracial (n = 22; 4.9%), Hispanic/Latinx (n = 19; 4.3%), other (n = 19; 4.3%), Asian (n = 10; 2.2%), Black (n = 7; 1.6%), and American Indian/Alaskan Native (n = 2; 0.4%). The mean age of respondents was 34.7 years (SD = 16.2), with a range of 15 to 76 years.
Measures
Participants completed the FOS and THS as in Samples 1 and 2, as well as the following measures.
Future Self-Rated Health Scale
Future self-rated health was measured with the future-focused item from the Midlife in the United States Survey (MIDUS; Brim et al., 2020), which inquires “Looking ahead ten years into the future, what do you expect your health will be like at that time?” Responses ranged from 1 (excellent) to 5 (poor) and were reverse scored so higher values denote better expected health. In the 18-year MIDUS longitudinal study, this item showed moderate correlations with physical health and daily health-related limitations, supporting convergent validity (Bunda & Busseri, 2019).
Heterosexist Harassment, Rejection, and Discrimination Scale
This 14-item measure (Szymanski, 2006) examines perceived harassment, rejection, and discrimination related to non-heterosexual identity, relationships, or behaviors over the past year. Responses range from 1 (never) to 6 (almost all the time), with a higher mean score (range = 1–6) indicating greater perceived harassment, rejection, and discrimination. For the current study, items were adapted to refer to “an LGBTQ individual” instead of “lesbian” (e.g., “How many times have you been rejected by friends because you are an LGBTQ individual?”). The Heterosexist Harassment, Rejection, and Discrimination Scale (HHRDS) exhibited excellent internal consistency (α = .90), and evidence of construct and predictive validity in prior samples (Dunn & Szymanski, 2018; Reitzel et al., 2017).
Connectedness to the LGBT Community Scale
The 8-item Connectedness to the LGBT Community Scale (CTCS; Frost & Meyer, 2012) assesses sense of connection to the LGBT community (e.g., “You feel a bond with the LGBT community”) on a 4-point scale (1 = agree strongly; 4 = disagree strongly). Responses were recoded so that higher total scores (range = 8–32) reflect greater connectedness. Among sexual minority individuals, the CTCS showed good reliability (α = .81), was moderately correlated with collective self-esteem, sexual orientation group identity, and LGBT community participation, and was uncorrelated with racial identity and social network size, supporting its construct validity (Frost & Meyer, 2012).
Statistical Analyses
All analyses were conducted in R (R Core Team, 2018). First, descriptive statistics and internal consistency reliability, using McDonald’s omega total (ω), were calculated for all study measures with the psych package (Revelle, 2020). McDonald’s ω provides a more accurate polychoric correlation-based reliability estimate for ordinal indicators than Cronbach’s alpha, which is calculated using a Pearson correlation matrix (Gadermann et al., 2012; McDonald, 1999). As no widely accepted interpretive guidelines exist for McDonald’s ω total beyond minimal recommendations based on test stakes (Kalkbrenner, 2024), we adopted standard internal consistency benchmarks (ω < .50: unacceptable; .50 < ω ≤ 60: poor; 60 < ω ≤ 70: questionable; .70 < ω ≤ 80: acceptable; .80 < ω ≤ 90: good; ω < .90: excellent; George & Mallery, 2022).
To determine the latent structure of the FOS, we split the undergraduate sample (N = 3,219) into exploratory and confirmatory subsets using stratified random sampling. Respondents with complete missingness on all FOS items (n = 428), consistent with survey noncompletion, were excluded from factor analyses. The remaining participants were sorted within race x gender strata and then ordered using unique, randomly generated numbers to ensure matching demographic distributions across subsamples. The lowest 60% of ranked cases were allocated to the exploratory subset and the remaining 40% to the confirmatory subset. We then verified that race and gender groups were proportionally and equally represented in each subsample, and that skewness and kurtosis of the FOS items were comparable.
Because the FOS items are 6-point Likert-type indicators, all exploratory analyses were based on polychoric correlations to appropriately model ordinal response distributions. Descriptive statistics, item-total correlations, and item-level statistics were analyzed for the developmental sample. Any item with inter-item and corrected item–total correlations below .30 would be excluded from the scale (Boateng et al., 2018). The Kaiser–Meyer–Olkin measure of sampling adequacy (MSA; Kaiser, 1974) was calculated to evaluate the shared variance among items, with an overall MSA value of ≥.70 indicating a factorable correlation matrix (Watkins, 2018).
Then, EFA was conducted with the R package psych (Revelle, 2020) and using principal axis factoring to estimate latent structure. Oblique rotation via the promax method was planned, but not utilized, as the FOS items did not load strongly onto multiple factors. Standardized factor loadings above .50 were considered evidence of convergence on a factor (Hair et al., 2018). The screen test was used to assist in determining the number of factors to retain, as it has been shown to outperform the eigenvalue ≥ 1 rule (Carpenter, 2018). Factor retention was further evaluated using parallel analysis (Horn, 1965) based on the 95th percentile of 1,000 simulated data sets. In the social sciences, a factor solution consistent with the construct’s theoretical structure that accounts for approximately 60% of the variance is typically considered satisfactory (Hair et al., 2018).
CFAs were conducted on the confirmatory sample of the undergraduate student sample and the full fibromyalgia and SGM samples to evaluate the factor structure in each population, using the R package lavaan (Rosseel, 2012) with weighted least squares mean- and variance-adjusted (WLSMV) estimation. Items were treated as ordinal indicators, and polychoric correlations and item thresholds were computed, as recommended for ordinal CFA (Kline, 2016; Rosseel, 2012). As the chi-square statistic is sensitive to large sample sizes (Hair et al., 2018; Pendergast et al., 2017), we reported additional fit indices to evaluate model fit, including χ2/degrees of freedom (df), comparative fit index (CFI), Tucker–Lewis index (TLI), root mean square error of approximation (RMSEA), and standardized root mean square residual (SRMR). Furthermore, most researchers report at least three to four fit indices, including at least one absolute and one incremental index (Hair et al., 2018; Knekta et al., 2019), because the recommended cutoffs vary widely across sources, typically ranging from 2 to 5 for χ2/df, .90 to .95 for the CFI and TLI, .05 to .10 for the RMSEA, and .05 to .08 for the SRMR (R. Fischer & Karl, 2019; Hooper et al., 2008; MacCallum et al., 1996; McNeish et al., 2018; Niemand & Mai, 2018).
Importantly, the estimation method substantially influences RMSEA and CFI when modeling ordinal data, such that traditional cutoff values derived under maximum-likelihood estimation do not generalize to least squares estimators such as WLSMV (Shi & Maydeu-Olivares, 2020). RMSEA tends to penalize models with fewer df, fewer items, strong factor loadings, or ordinal indicators, often inaccurately indicating a well-specified model has poor fit and producing wide 90% confidence intervals (Kenney et al., 2015; Shi et al., 2019; Shi, Maydeu-Olivares, & Rosseel, 2020). Therefore, following recommended practices for assessing model fit, prior to interpreting fit indices, we examined correlation (Bollen) residuals and considered absolute residuals >.10 evidence of localized misfit (Kline, 2016; Stone, 2021).
Next, if single-sample CFAs demonstrated satisfactory fit, we planned to test measurement invariance across the three samples using multigroup confirmatory factor analysis (MGCFA) with WLSMV estimation in lavaan (Rosseel, 2012), comparing nested configural, metric, and scalar invariance models. We used Chen’s (2007) criteria for a total sample size >300, specifying that invariance would be rejected if the change (Δ) in CFI ≥ –.010 plus either ΔRMSEA ≥ +.015 or ΔSRMR ≥ +.030 for the metric model, and ΔCFI ≥ –.010 plus either ΔRMSEA ≥ +.015 or ΔSRMR ≥ +.010 for the scalar model. Because chi-square and RMSEA behave unreliably with ordinal indicators, and RMSEA is particularly prone to inflation in low df models (Kenney et al., 2015; Xia & Yang, 2018), we prioritized ΔCFI for evaluating invariance, using ΔSRMR as a supplementary criterion (Chen, 2007). Following established guidelines (Putnick & Bornstein, 2016; Vandenberg & Lance, 2000), latent mean differences were examined only if scalar invariance was supported.
Finally, we utilized Pearson’s bivariate correlations to evaluate the convergent and discriminant validity of the FOS. Convergent and discriminant validity would be demonstrated through moderate correlations of r ≥ ± 0.3 to < ± 0.5, and non-significant or weak correlations of r < ± 0.3, respectively (Cohen, 1988). For convergent validity, correlations between the FOS and the THS, LOT-R, and ZTPI-F in Sample 1; the THS and LOT-R in Sample 2; and THS and Future Self-Rated Health scale in Sample 3 were calculated, and for discriminant validity, between the FOS and the SF-36v2 PCS and RRS in Sample 1; FIQR-FS, IADL, and PSMS in Sample 2; and HHRDS and CTCS in Sample 3.
Results
Descriptive Statistics and Reliability
Descriptives and internal consistency reliability (McDonald’s ω) for all study measures are provided in Table 1, by full sample. The FOS demonstrated excellent reliability in all three full samples (Sample 1: ω = .92; Sample 2: ω = .91; Sample 3: ω = .90). All other measures exhibited good or excellent reliability, except for the IADL in the fibromyalgia sample, which showed acceptable reliability (ω = .74).
The undergraduate sample was then split into developmental and confirmatory subsamples using random stratified sampling, as previously outlined. Because some respondents discontinued the survey before reaching the FOS, 428 participants were removed from Sample 1, 181 from Sample 2, and 156 from Sample 3. Missing value analysis using Little’s MCAR test (Little, 1988) indicated that data were likely missing completely at random (MCAR). Among respondents who reached the FOS, item-level missingness was extremely low in each sample (i.e., <1% per item) and showed no systematic pattern, signifying that missingness primarily reflected whole-scale nonresponse rather than selective omission of specific items. Accordingly, factor analyses were conducted using pairwise deletion rather than multiple imputation because, with ordinal models under MCAR conditions, both methods produce results similar to those observed with no missing data (Shi, Lee, et al., 2020). Furthermore, imputation can increase variance of parameter estimates, distort inter-item correlations, and lead to multiple factor solutions, particularly when working with ordinal indicators (Goretzko, 2022; Leite & Beretvas, 2010; Xia & Havan, 2024). Missingness data for all study variables are also provided in Table 1.
Demographic characteristics for all samples are presented in Table S-1 in the Supplemental Materials. The full undergraduate sample was predominantly female (n = 2,038; 73.0%) and Hispanic (n = 1,114; 39.9%), with a mean age of 20.6 (SD = 3.9). Each demographic group was proportionately represented in the matched subsamples. The fibromyalgia sample was primarily female (n = 303; 94.7%) and White (n = 278; 86.9%), with a mean age of 48.1 (SD = 12.4). The SGM sample was also predominantly female (n = 145; 42.9%) and White (n = 275; 81.4%), with a mean age of 35.5 (SD = 16.7).
Item-Level Statistics for the Developmental Sample
Next, item-level statistics of the FOS in the undergraduate developmental sample were examined to ensure the measure was appropriate for EFA (see Table 2). The responses were slightly skewed toward higher values (Mrange = 4.83–5.18); however, skewness and kurtosis were not excessively elevated and fell below established cutoff values (≥2.0 and ≥7.0, respectively) at which Pearson’s correlation coefficient should not be utilized (Watkins, 2018). Nonetheless, polychoric correlations were used instead because they are more appropriate for ordinal indicators (Kline, 2016). All inter-item correlations were well above the acceptable cutoff of >.30, ranging from .55 to .80. All MSA sampling adequacy values were between .85 (good; “meritorious”) and .91 (very good; “marvelous”), including the overall value (.88), which is beyond the recommended .70 threshold desired to proceed with factor analysis (Kaiser, 1974). Corrected item-total correlations ranged from .72 to .83. Internal consistency reliability was excellent (ω = .92), and reliability would not improve if any items were deleted.
Item Descriptives and Item-Level Statistics for the Undergraduate Developmental Sample.
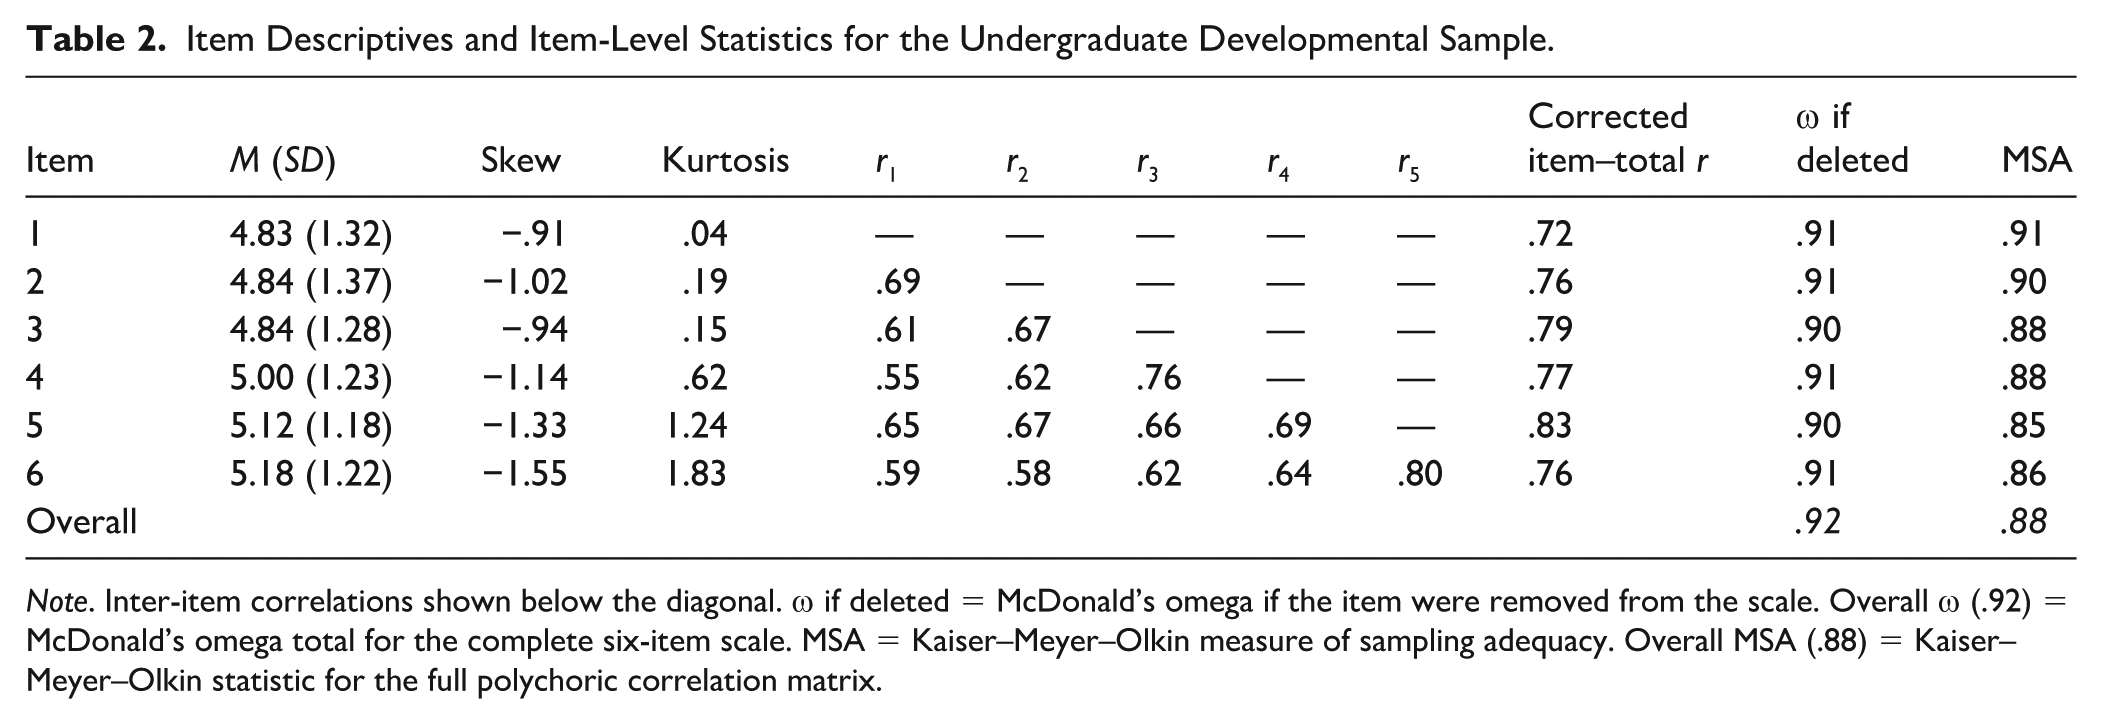
Note. Inter-item correlations shown below the diagonal. ω if deleted = McDonald’s omega if the item were removed from the scale. Overall ω (.92) = McDonald’s omega total for the complete six-item scale. MSA = Kaiser–Meyer–Olkin measure of sampling adequacy. Overall MSA (.88) = Kaiser–Meyer–Olkin statistic for the full polychoric correlation matrix.
Exploratory Factor Analyses
After determining that the FOS was appropriate for EFA, an EFA using principal axis factoring was conducted in the undergraduate developmental sample (see Table 3 for detailed statistics). The first eigenvalue was 4.27, accounting for 71.2% of the total variance. Eigenvalues for the five remaining factors ranged from .18 to .52. Inspection of the scree plot also suggested a single dominant factor (see Figure 1). The sum of squared loadings for the first factor was 3.93, with the latent future orientation construct accounting for 65.5% of the variance across items and exceeding the 60% threshold typically considered acceptable (Hair et al., 2018). Factor loadings were well above .50 (range = .75–.87), demonstrating strong loadings on the factor. Parallel analysis based on polychoric correlations indicated retention of a single factor (see Table S-2 in the Supplemental Materials), as only the first observed eigenvalue exceeded the 95th percentile of simulated eigenvalues. These findings provide support for the unidimensionality of the FOS and the retention of all six items.
Factor Eigenvalues and Variance Explained for the Undergraduate Developmental Sample.
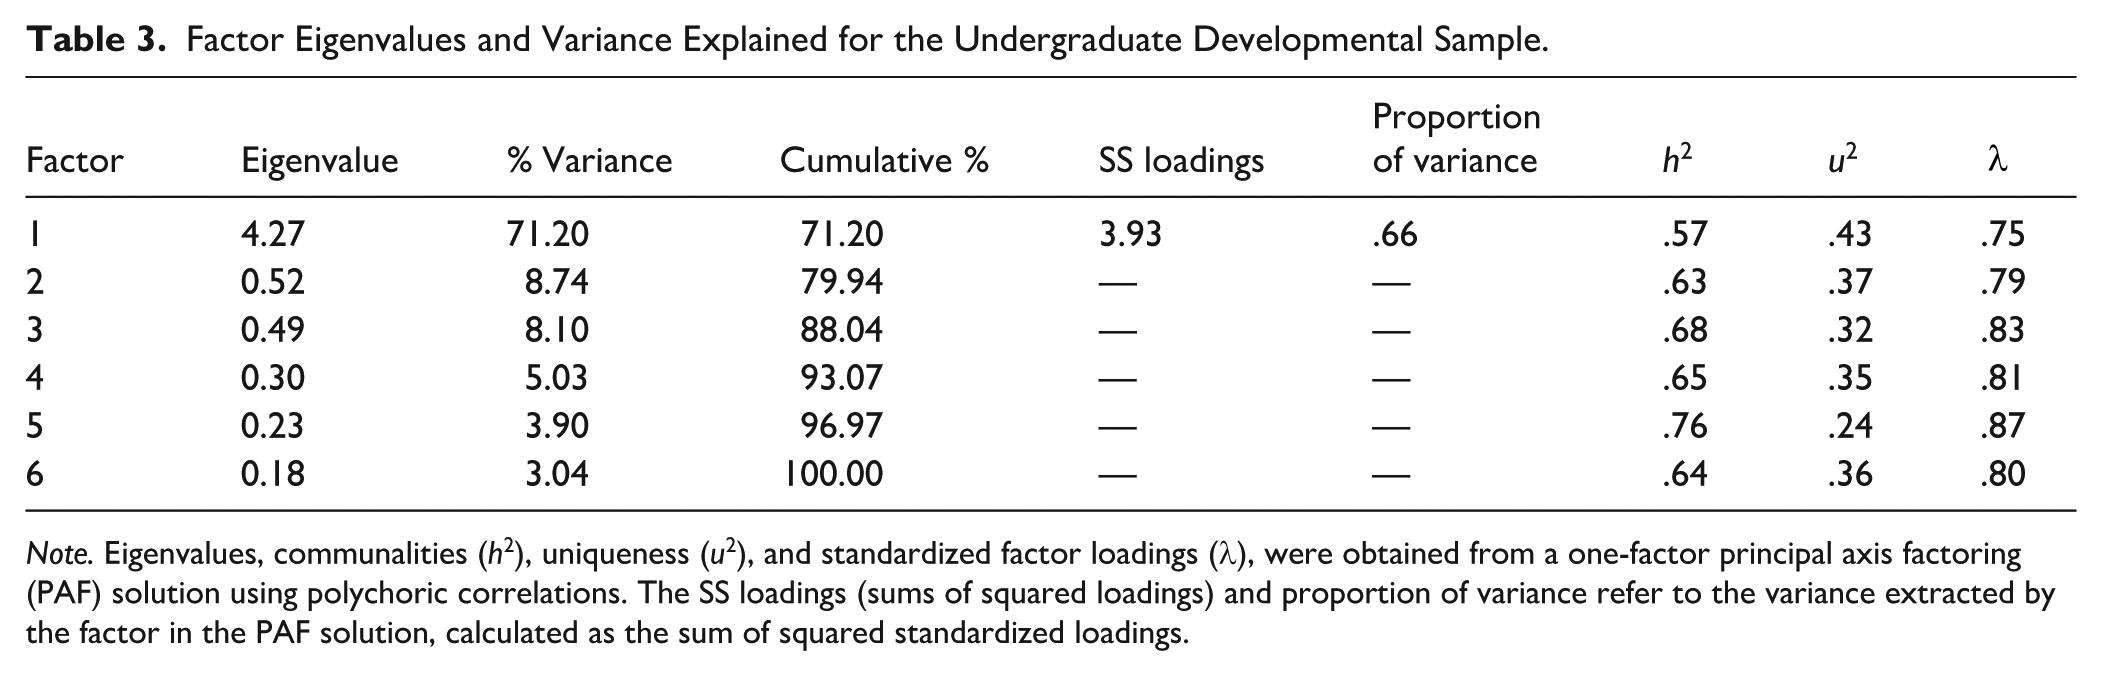
Note. Eigenvalues, communalities (h2), uniqueness (u2), and standardized factor loadings (λ), were obtained from a one-factor principal axis factoring (PAF) solution using polychoric correlations. The SS loadings (sums of squared loadings) and proportion of variance refer to the variance extracted by the factor in the PAF solution, calculated as the sum of squared standardized loadings.
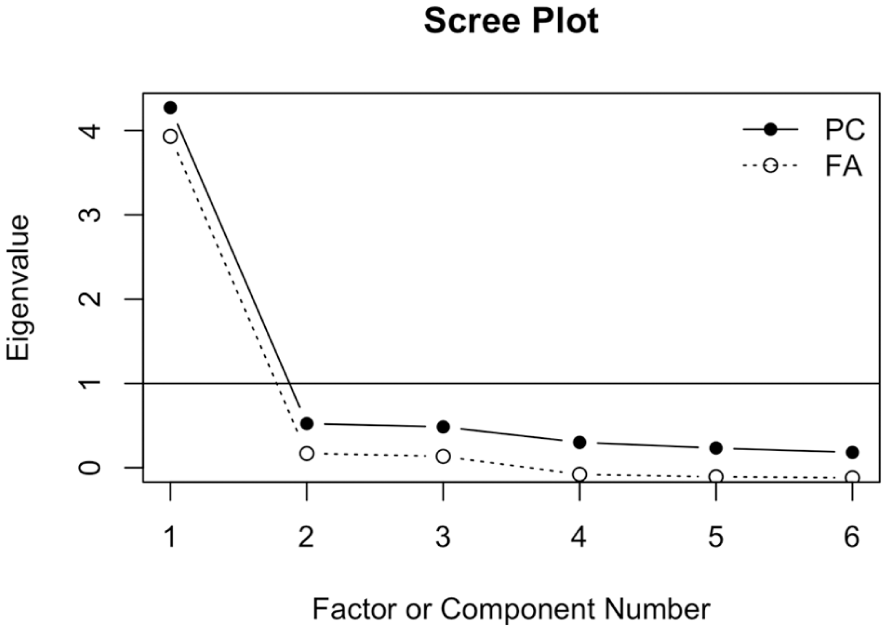
Scree Plot for the Undergraduate Developmental Sample.
Confirmatory Factor Analyses
Similar to the undergraduate developmental sample, participants in the confirmatory samples generally endorsed higher response options on the FOS items, yet skewness and kurtosis remained within acceptable ranges (see Table 4). As with the full, confirmatory fibromyalgia and SGM samples, reliability was also excellent in the undergraduate confirmatory sample (ω = .93). CFA models were estimated separately on each confirmatory sample using WLSMV estimation. Based on the EFA results, one factor was specified when building the models. As shown in Table 5, all correlation (Bollen) residuals were minimal, with none equaling or exceeding|.10|. This pattern suggests that the latent future orientation factor adequately accounted for the shared variance among the FOS items in each sample and no localized areas of misfit were present (Kline, 2016; Stone, 2021).
Item Descriptives and Item-Level Statistics by Confirmatory Sample.
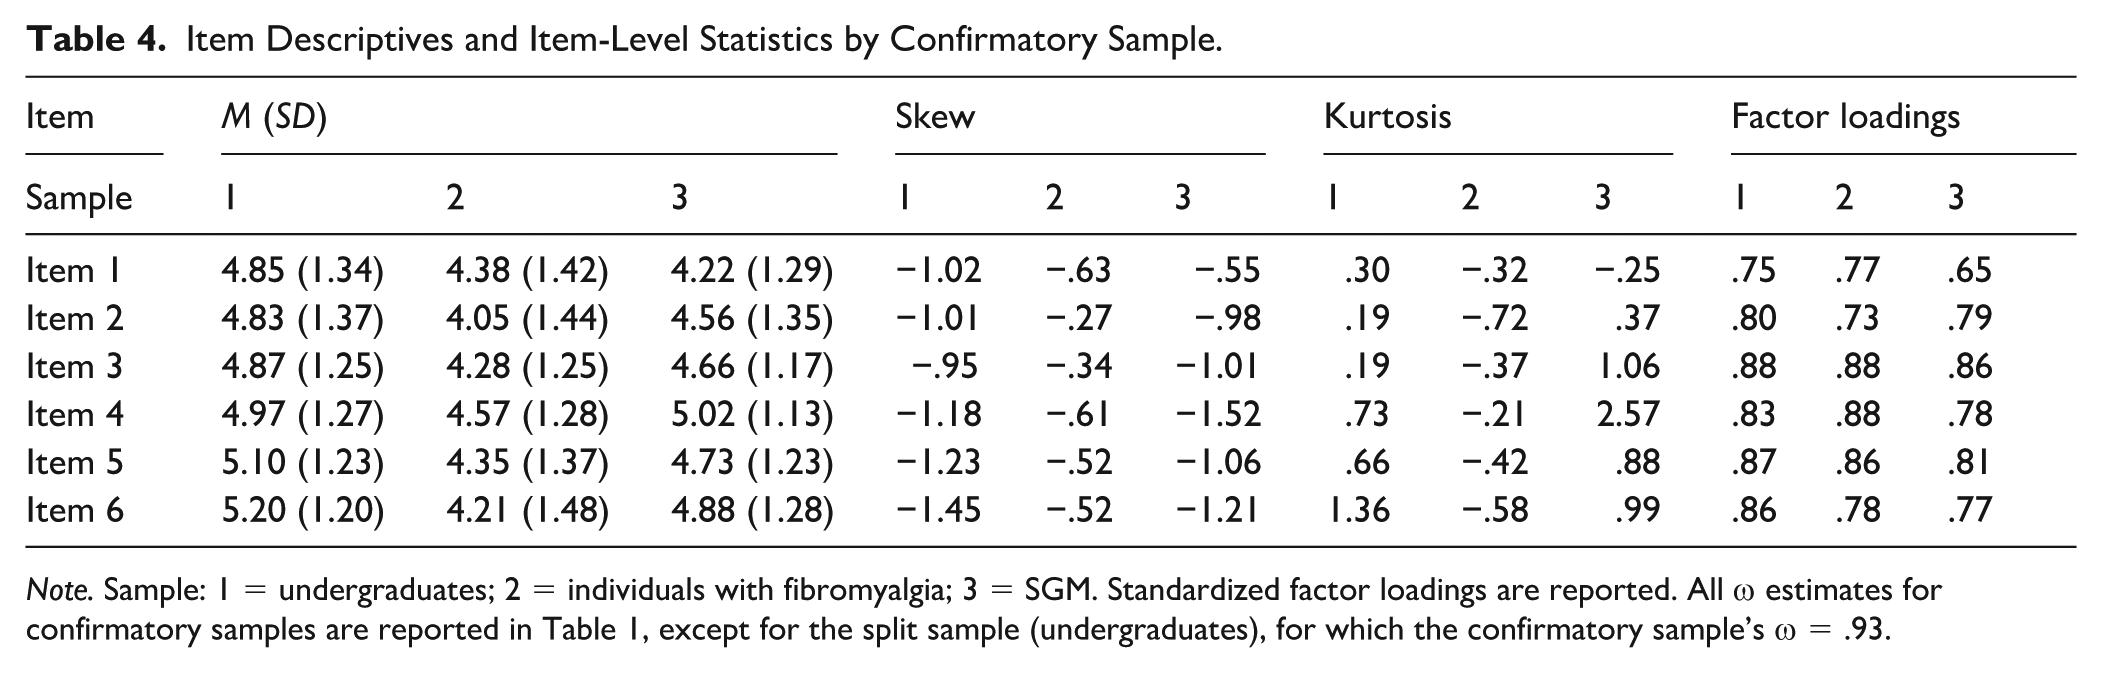
Note. Sample: 1 = undergraduates; 2 = individuals with fibromyalgia; 3 = SGM. Standardized factor loadings are reported. All ω estimates for confirmatory samples are reported in Table 1, except for the split sample (undergraduates), for which the confirmatory sample’s ω = .93.
Residual Correlation Matrices (Bollen Residuals) by Confirmatory Sample.
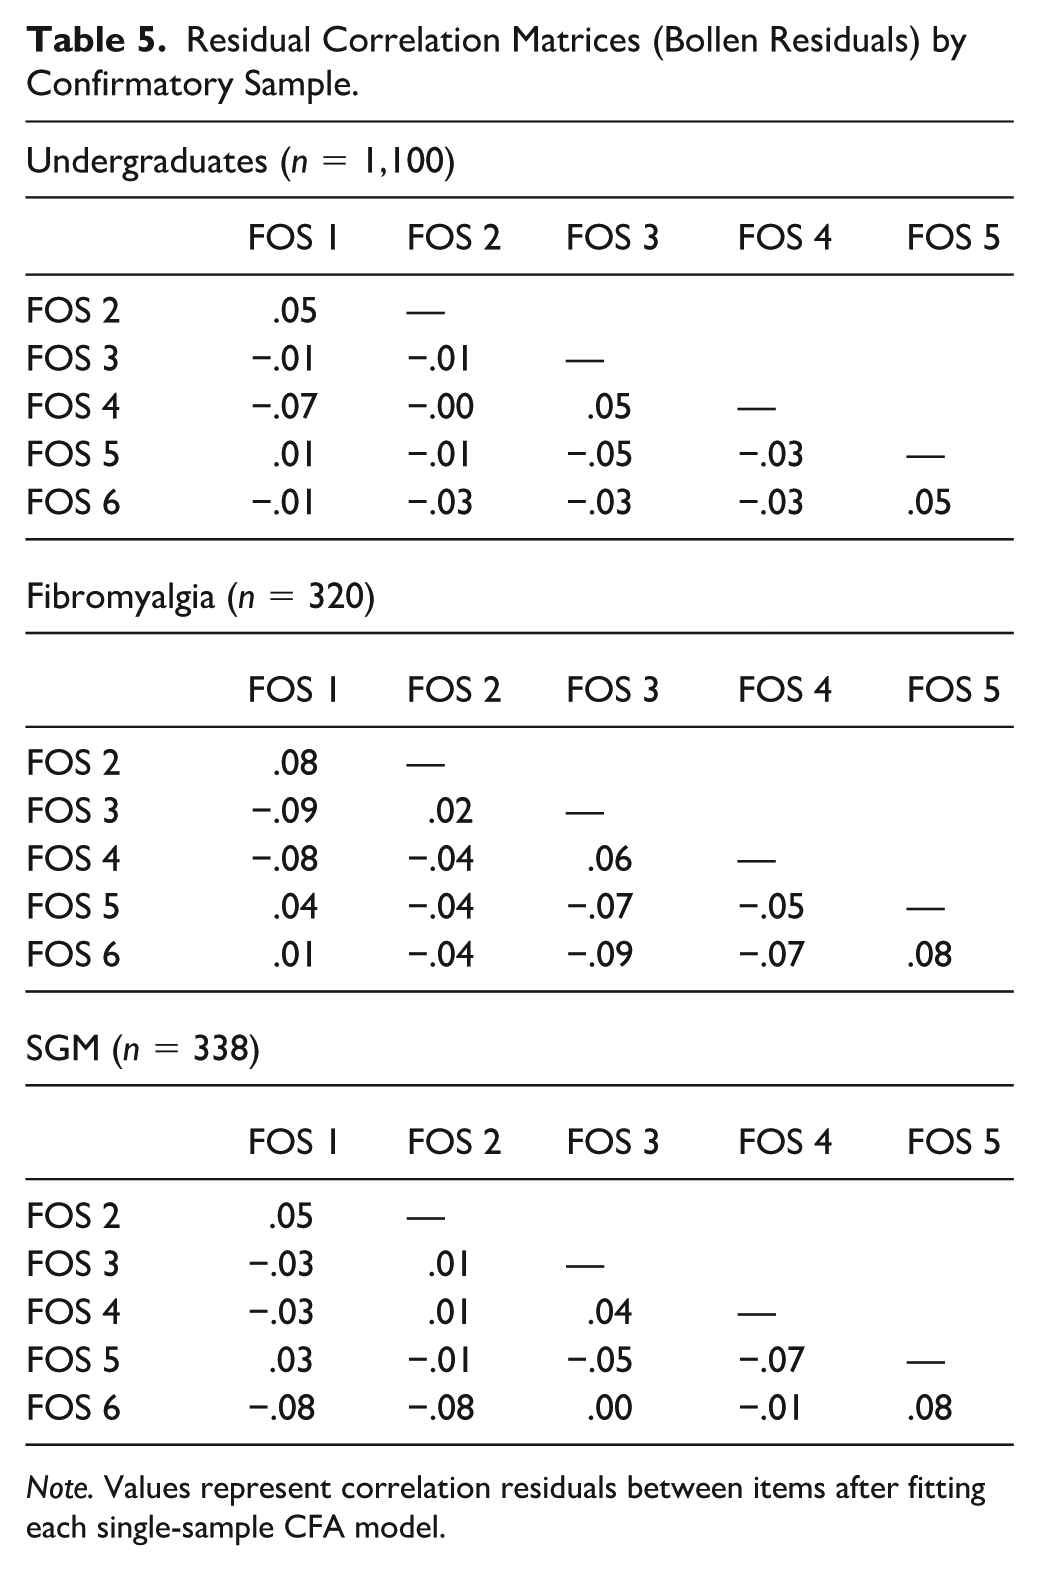
Note. Values represent correlation residuals between items after fitting each single-sample CFA model.
Fit statistics are summarized in Table 6. All three models demonstrated acceptable fit. In all samples, the incremental fit indices, CFI and TLI, exceeded recommendations (range = .993–.998), and SRMR values also fell within acceptable limits (range = .029–.052). In the fibromyalgia sample, the RMSEA exceeded the most liberal typical cutoff, at .137 (90% CI [0.106, 0.170]). However, RMSEA is known to over-penalize parsimonious models with fewer degrees of freedom and large factor loadings, with researchers advising caution when interpreting models with 10 or fewer observed variables and factor loadings approaching .80 (Kenney et al., 2015; Shi et al., 2019). Notably, the present model contains only six items and exhibited strong standardized loadings, meeting both conditions under which RMSEA tends to underestimate fit (Shi et al., 2019); nearly all loadings across models approached or exceeded .80, demonstrating strong associations with the FOS factor (e.g., fibromyalgia sample range = .73–.88; see Table 4 for all loadings across samples).
Single and Multigroup CFA Model Fit Statistics.
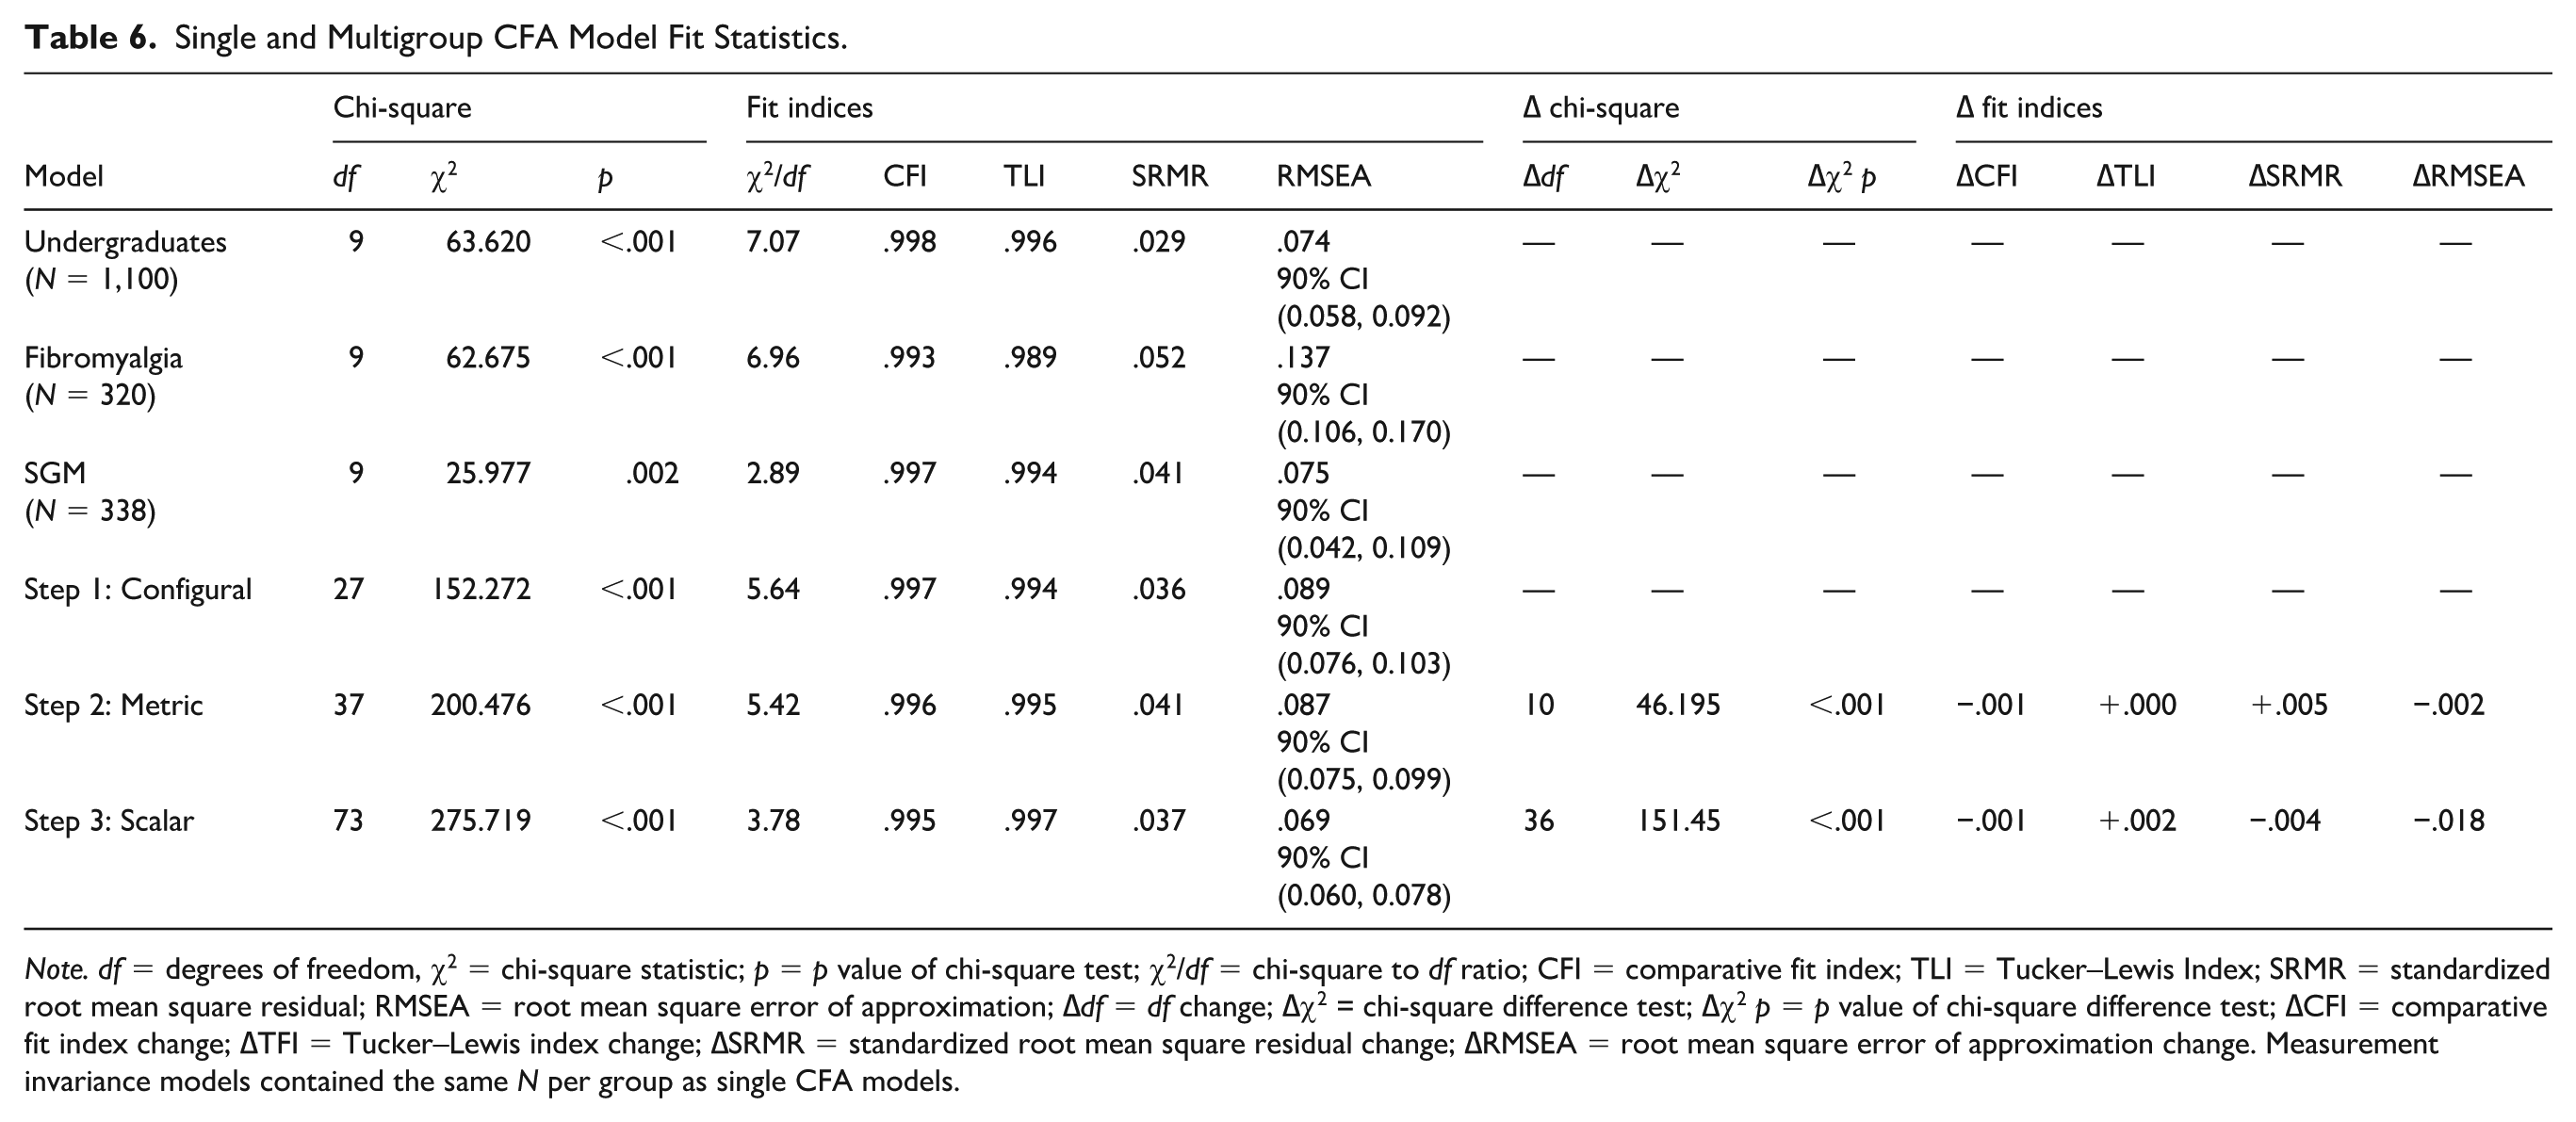
Note. df = degrees of freedom, χ2 = chi-square statistic; p = p value of chi-square test; χ2/df = chi-square to df ratio; CFI = comparative fit index; TLI = Tucker–Lewis Index; SRMR = standardized root mean square residual; RMSEA = root mean square error of approximation; ∆df = df change; ∆χ2 = chi-square difference test; ∆χ2 p = p value of chi-square difference test; ∆CFI = comparative fit index change; ∆TFI = Tucker–Lewis index change; ∆SRMR = standardized root mean square residual change; ∆RMSEA = root mean square error of approximation change. Measurement invariance models contained the same N per group as single CFA models.
Measurement Invariance
Measurement invariance was then assessed using multigroup CFA. The configural model, in which factor loadings and thresholds were freely estimated across groups, demonstrated good fit (comparative fit index [CFI] = .997, Tucker–Lewis index [TLI] = .994, standardized root mean square residual change [SRMR] = .036, root mean square error of approximation change [RMSEA] = .089, 90% confidence interval [CI] [0.076, 0.103]; see Table 6), supporting a consistent one-factor structure across samples.
Metric invariance was then tested by constraining all factor loadings to equality across samples. The change in fit was negligible (ΔCFI = −.001, ΔSRMR = +.005, ΔRMSEA = −.002), well within recommended equivalence cutoffs (Chen, 2007). Adding threshold constraints to test scalar invariance similarly resulted in minimal change in fit (ΔCFI = −.001, ΔSRMR = −.004, ΔRMSEA = −.018). These findings support full metric and scalar invariance across the three samples.
Finally, as scalar invariance was established, observed score differences across samples are not attributable to measurement bias at the item or threshold level, but instead reflect substantive variation in future orientation across populations (Meredith, 1993; Vandenberg & Lance, 2000). Using the fibromyalgia group as the reference (μ = 0), we compared latent factor means. Relative to the fibromyalgia group, the SGM sample exhibited modestly higher future orientation (Δμ = 0.24, SE = 0.06, 95% CI [0.12, 0.35], z = 3.91, p < .001), and the undergraduate sample demonstrated the highest latent mean (Δμ = 0.66, SE = 0.06, 95% CI [0.53, 0.78], z = 10.59, p < .001). A Wald test indicated that the undergraduate latent mean was also significantly higher than the SGM latent mean (Δμ = 0.42, χ2(1) = 34.60, p < .001). These latent mean differences can be interpreted as standardized effect sizes (Putnick & Bornstein, 2016), reflecting modest differences between the SGM and fibromyalgia groups, moderately larger differences between the undergraduate and SGM groups, and the largest differences between the undergraduate and fibromyalgia groups. Consistent with the latent mean results, observed FOS total scores were lowest in the fibromyalgia group (M = 25.7, SD = 6.7), higher in the SGM group (M = 28.0, SD = 5.8), and highest in the undergraduate group (M = 29.7, SD = 6.1), F(2, 1,757) = 54.79, p < .001, η2 = .06.
Convergent and Discriminant Validity
Convergent and discriminant validity were assessed with Pearson’s bivariate correlations (see Table 7 for full results). As hypothesized, FOS scores were moderately, positively related to hope (r = .43, p < .001), optimism (r = .36, p < .001), and future time perspective (r = .31, p < .001) in Sample 1; to hope (r = .34, p < .001) and optimism (r = .32, p < .001) in Sample 2; and to hope (r = .40, p < .001) and future self-rated health (r = .37, p < .001) in Sample 3. These findings support the FOS’s convergent validity with related constructs.
Convergent and Discriminant Validity of the Future Orientation Scale Across Samples.
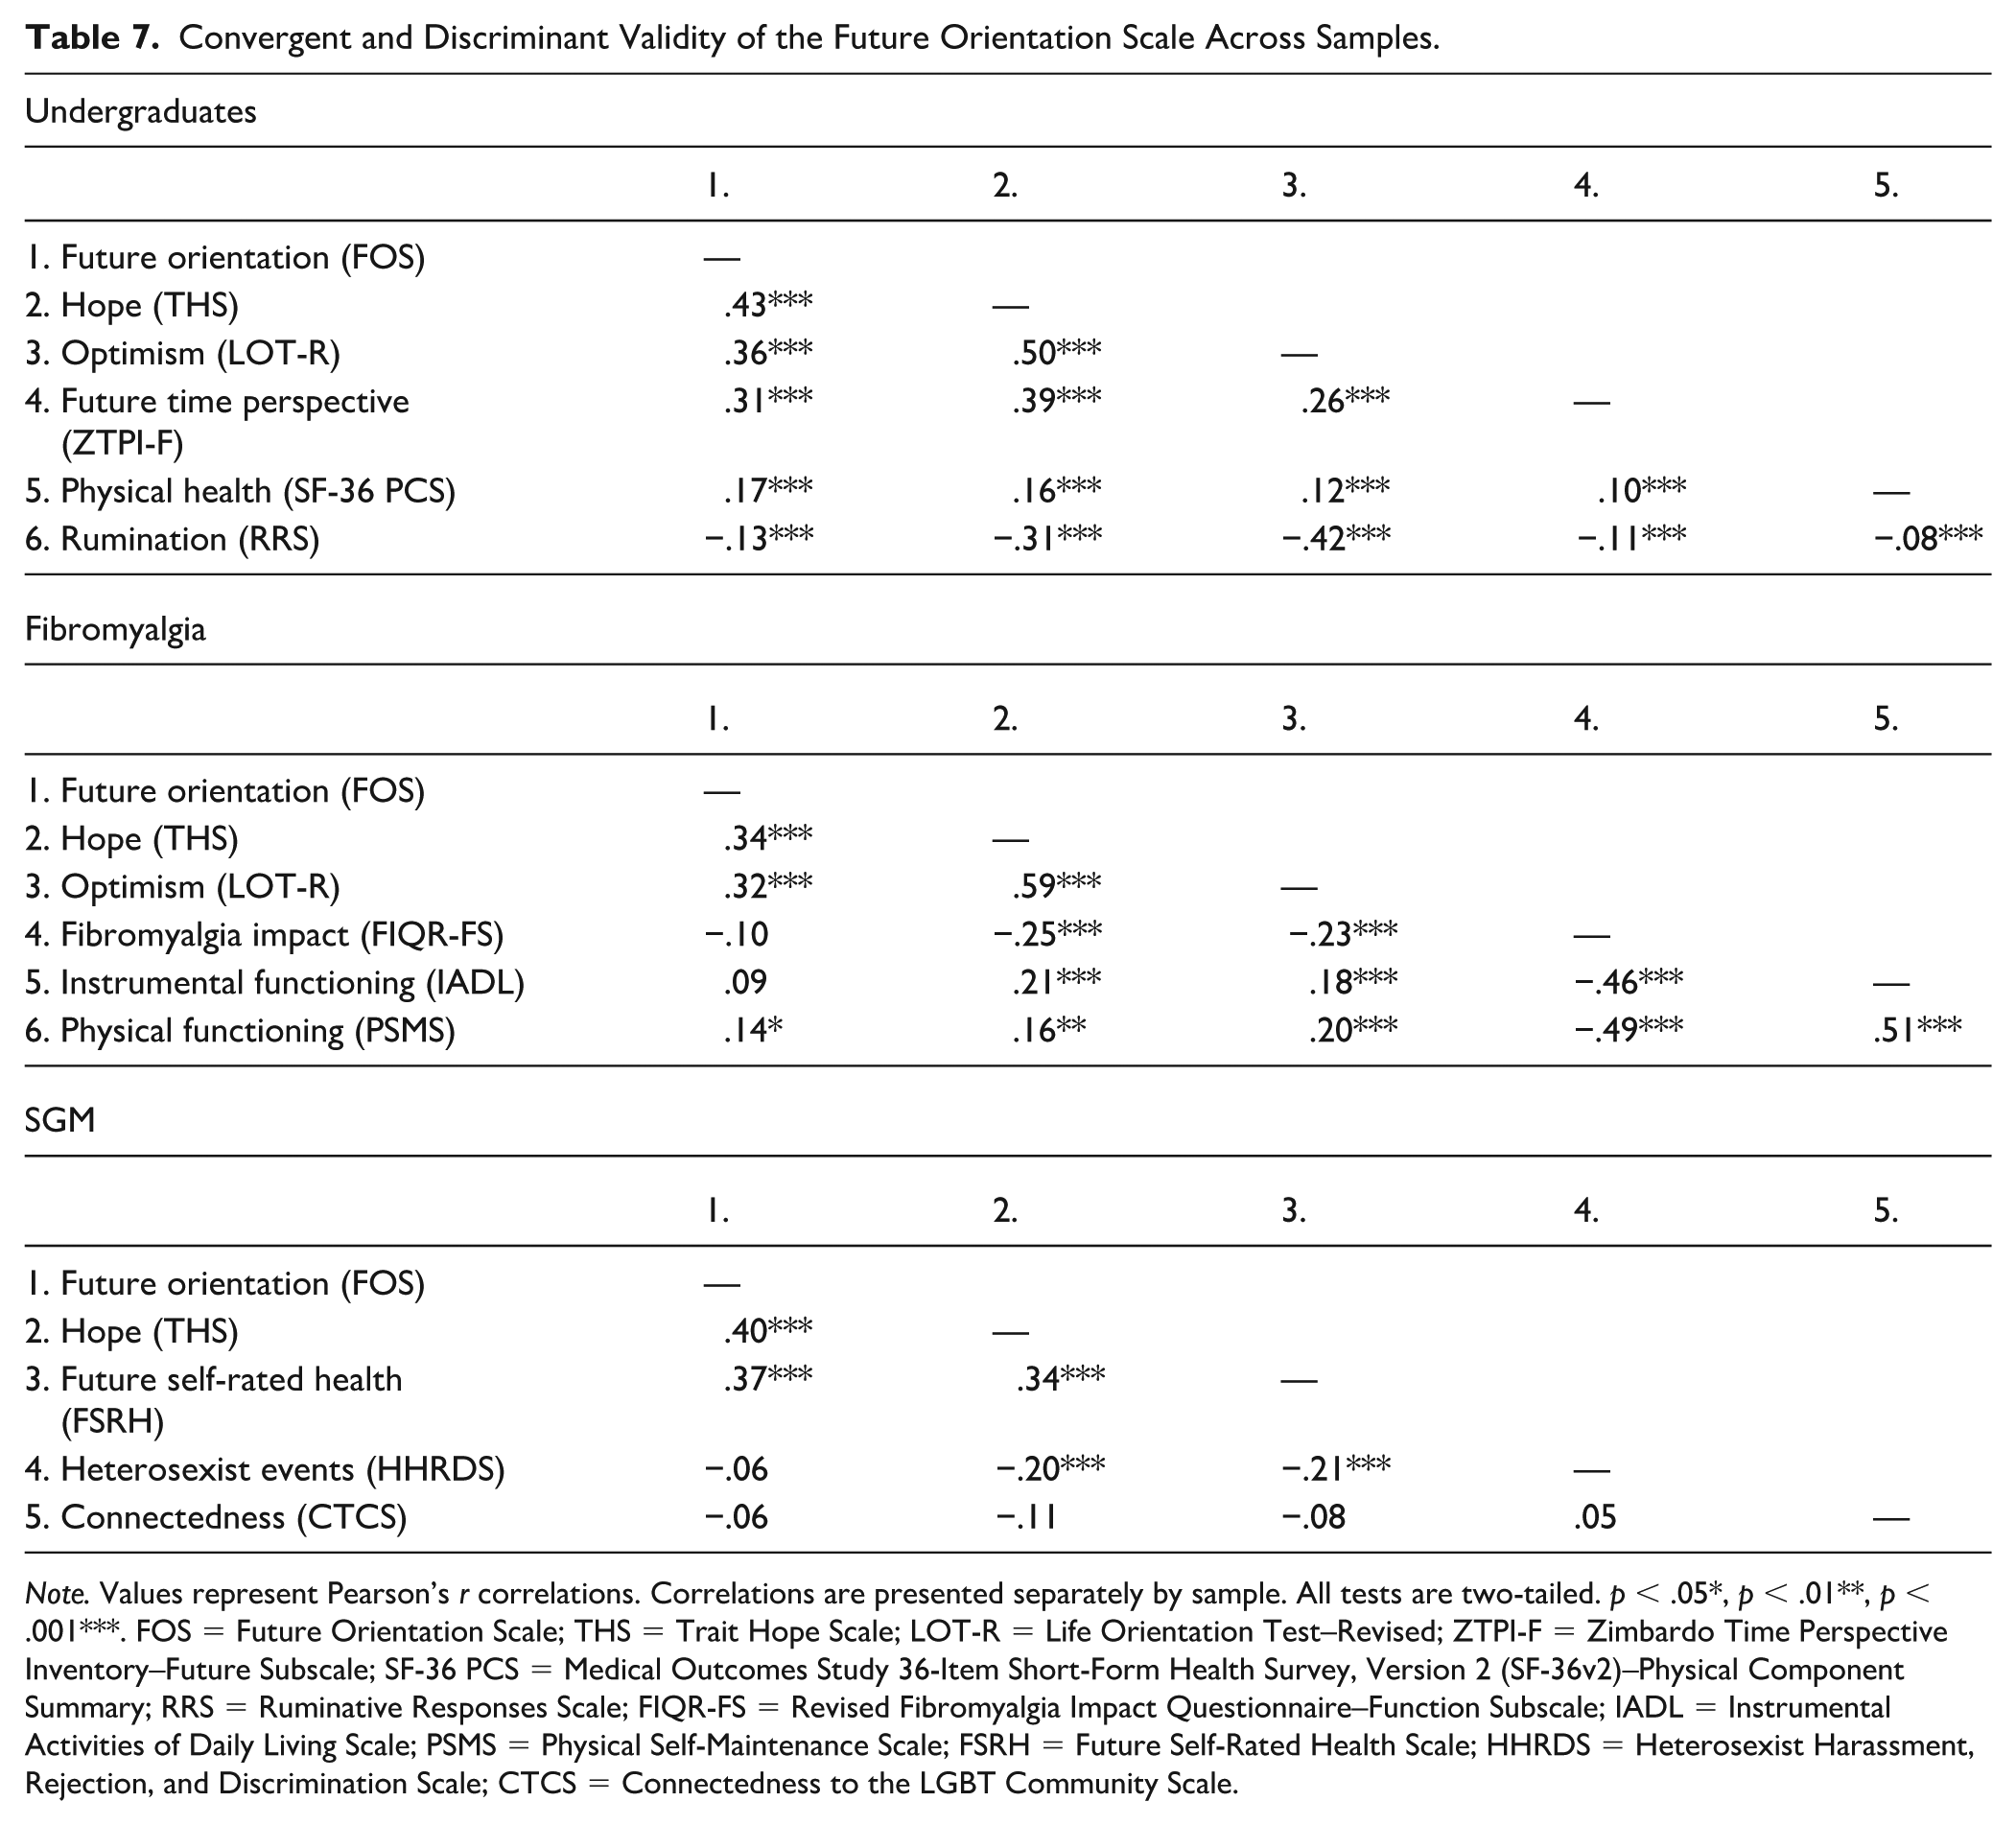
Note. Values represent Pearson’s r correlations. Correlations are presented separately by sample. All tests are two-tailed. p < .05*, p < .01**, p < .001***. FOS = Future Orientation Scale; THS = Trait Hope Scale; LOT-R = Life Orientation Test–Revised; ZTPI-F = Zimbardo Time Perspective Inventory–Future Subscale; SF-36 PCS = Medical Outcomes Study 36-Item Short-Form Health Survey, Version 2 (SF-36v2)–Physical Component Summary; RRS = Ruminative Responses Scale; FIQR-FS = Revised Fibromyalgia Impact Questionnaire–Function Subscale; IADL = Instrumental Activities of Daily Living Scale; PSMS = Physical Self-Maintenance Scale; FSRH = Future Self-Rated Health Scale; HHRDS = Heterosexist Harassment, Rejection, and Discrimination Scale; CTCS = Connectedness to the LGBT Community Scale.
Discriminant validity of the FOS was also supported. The FOS was weakly correlated with physical health (r = .17, p < .001) and rumination (r = −.13, p < .001) in Sample 1; weakly correlated with the PSMS (r = .14, p < .05) and uncorrelated with the FIQR-FS (r = −.10, p = .07) and IADL (r = .09, p = .10) in Sample 2; and uncorrelated with the HHRDS (r = −.06, p = .29) and CTCS (r = −.06, p = .26) in Sample 3.
Discussion
This is the first study to evaluate the psychometric properties of the FOS. As hypothesized, the FOS demonstrated excellent reliability, as expected based on prior research among medical (Nsamenang & Hirsch, 2015) and non-medical (E. C. Chang et al., 2017) samples. McDonald’s ω values were similar in the full and undergraduate developmental samples, and in all confirmatory samples. All inter-item and corrected item-total correlations and MSA values were well above the recommended cutoffs in the developmental sample, indicating all items should be retained for factor analysis.
In the undergraduate developmental sample, a single-factor solution emerged during EFA and parallel analysis. Among standalone measures of future orientation and scales measuring overall time perspective, future orientation is typically captured in one factor (e.g., CFC, ZTPI; Hevey et al., 2010; Zimbardo & Boyd, 1999). CFA supported the unidimensional factor structure and conveyed adequate fit in all samples; thus, measurement invariance analyses were conducted. Full configural, metric, and scalar invariance were found, indicating that the FOS’s basic factor structure is similar, and mean differences can be meaningfully interpreted, across samples (Boer et al., 2018). Establishing full scalar invariance also strengthens the interpretability of prior findings comparing FOS scores across groups (e.g., E. C. Chang et al., 2025; Yu & Chang, 2016), which relied on the standard assumption of equivalent item functioning, a requirement for valid mean-level comparisons (Putnick & Bornstein, 2016; Vandenberg & Lance, 2000).
Notably, although we predicted only partial scalar invariance, the FOS demonstrated full scalar invariance across groups. Thus, observed group differences represent true variation in future orientation shaped by contextual and psychological processes rather than differential item functioning. A consistent pattern of latent means emerged, with the fibromyalgia sample demonstrating the lowest future orientation, the SGM sample the next highest, and undergraduates the highest. These differences ranged from small (i.e., SGM-fibromyalgia) to large (i.e., undergraduate-fibromyalgia). Despite mean-level differences, the sizable standard deviations within each group indicate meaningful within-group variability. Each sample, however, reported moderate to high levels of future orientation, consistent with prior findings in multiethnoracial college students and patients with fibromyalgia (E. C. Chang, Chang, et al., 2019; E. C. Chang, Lucas, et al., 2019).
Interpreting these differences in light of each population’s characteristics provides context for understanding how the FOS functions across groups, likely reflecting the broader psychosocial conditions in which future expectations are formed. Perhaps, for example, for minoritized undergraduates, reactions to discrimination (e.g., poor self-esteem, stereotype threat) and systemic barriers to success (e.g., financial, occupational, and medical) that are known to significantly impact physical and psychological health, also contribute to future-directed motivation and may vary by ethnoracial group based on disparate sociocultural pressures (Williams & Mohammed, 2013). Aligning with this interpretation, future orientation and optimism independently predicted depression and suicidal ideation in African American and Latino American, but not Asian American, college students (Yu & Chang, 2016). Similarly, among subgroups of U.S. Latinx adults, future orientation uniquely predicted life satisfaction alongside optimism, hope, and problem orientation, with the relative contribution of each construct varying across groups (E. C. Chang et al., 2025).
To our knowledge, the FOS has not been evaluated previously with SGM samples; the FOS score was high for our SGM sample, but whether this pattern is typical is unknown. However, a related future-oriented construct, hope, was lower among SGM college students and, in turn, was associated with greater depression and suicidal behavior (Hirsch et al., 2017). These findings are not necessarily inconsistent. Hope and optimism depend heavily on identifying meaningful goals and perceiving clear pathways for attaining them (Scheier & Carver, 1985; Snyder, 2002), processes that may be constrained among SGM individuals due to structural (e.g., rights infringement) and interpersonal (e.g., rejection) stigma and discrimination (Brooks et al., 2023; Hendricks & Testa, 2012; Katz-Wise et al., 2017; Meyer & Frost, 2013). In contrast, the FOS assesses a broader prospective orientation grounded in meaning, perceived ability to persevere under distress, and the belief that the future is worth investing in, capacities that may remain intact even when goal setting and pathways thinking are disrupted (Hirsch et al., 2006, 2015). This framework aligns with the tenets of SDT pertaining to the basic psychological needs of competence, relatedness, and autonomy (Ryan & Deci, 2000), the satisfaction of which may be threatened under such psychosocial contextual stressors; however, the presence of future orientation may sustain competence and autonomy, as in prior research with minoritized populations (E. C. Chang, Chang, et al., 2019; Hirsch et al., 2006; Ryan & Deci, 2017).
Notably, similar patterns occur in other health-vulnerable populations, including individuals with chronic illnesses. For example, for our fibromyalgia sample, which had the lowest FOS score, it may be that factors such as chronic pain, stress, functional limitations, and illness prognosis deleteriously impact perceived competence, self-efficacy, and expectations related to goal attainment (Galvez-Sánchez et al., 2019). The experience of disease may be disruptive and isolating; yet, in previous fibromyalgia research, future orientation was associated with less isolation and, in turn, to lower pain severity (E. C. Chang, Lucas, et al., 2019). When present, a sense of thriving and coping efficacy may enhance expectations for future growth, over and above disease-related factors (Sirois & Hirsch, 2013), suggesting that mental and physical health status and perception of illness may be inextricably tied to perspectives of the future. In sum, the motivational principles outlined in cognitive and self-determination theories, and which underpin the development of the FOS, may be a plausible explanation for the significant differences in latent mean scores between our samples.
These population-level patterns complement the correlational evidence, which further clarifies the FOS’s position within the broader nomological network of future-oriented constructs. As hypothesized, in our samples, the FOS was moderately correlated with other future-oriented constructs, providing evidence for convergent validity. The FOS broadly evaluates a prospective, growth-oriented perception of the future while accounting for circumstances and goals (O. D. Chang et al., 2020; Hirsch et al., 2006), while hope, optimism, future self-rated health, and future time perspective measure different aspects of future-oriented thinking. Also as predicted, the FOS was uncorrelated or weakly correlated with instruments measuring theoretically distinct constructs, supporting discriminant validity.
Limitations and Future Directions
Our study had several limitations. First, the FOS items were originally extracted from the RFL-OA solely based on face validity; the use of expert raters to evaluate items would have been preferred (Boateng et al., 2018; DeVellis & Thorpe, 2021). Second, given our use of secondary data, we were unable to utilize the same measures to evaluate convergent and discriminant validity across samples, which would have provided stronger evidence of validity (Campbell & Fiske, 1959). Third, because our samples were drawn from specific populations based in the United States, generalizability to broader cultural or demographic groups remains uncertain (Henrich et al., 2010). Finally, test–retest reliability could not be assessed without longitudinal data. To provide additional psychometric support for the FOS, future multi-sample and cross-cultural research evaluating its factor structure in large, representative, equally sized samples, and using the same measures to assess for construct validity, is recommended. Ideally, briefer survey batteries that contain only the measures of interest should be included, to improve response and completion rates (Kost & Correa da Rosa, 2018), and administered at multiple time points to evaluate test–retest reliability.
Although measurement invariance of the FOS was supported in three disparate samples, its psychometrics should also be evaluated among other chronic illness populations (e.g., patients with other chronic pain conditions, heart disease, diabetes, and sleep problems), inpatient and outpatient psychiatric patients, and older adults, for example, to substantiate its widespread use. While the FOS demonstrated strong measurement invariance, indicating that group differences are not driven by measurement bias, the latent mean differences point to meaningful variation in future-oriented beliefs across psychosocial and health contexts. Future research should clarify whether the mechanisms that contribute to these disparities, such as discrimination, socioeconomic constraints, and health-related psychological and physical impairment, similarly influence future orientation in other minoritized and chronic disease populations, and cross-culturally (Guthrie et al., 2009; Hicks et al., 2012; Kooij & Van De Voorde, 2011; Pitoňák, 2017). Furthermore, intersectionality among these groups may compound any detrimental effects on future orientation level (Mink et al., 2014; Rosenthal, 2016). Longitudinal and intervention studies will be especially important for clarifying how future orientation develops and changes over time, if it predicts treatment response and functional outcomes, and the extent to which it operates as a cognitive resilience resource across diverse groups.
Implications and Conclusion
Overall, our findings indicate that the FOS is a reliable and valid measure of future orientation across clinical and non-clinical populations. Compared with other measures of future-oriented thinking, the FOS offers several practical advantages. First, it more broadly evaluates the perception that circumstances will change for the better, and that goals will be attained, without incorporating evaluation of current behaviors, which may be impacted by unmeasured factors. For example, individuals with impulse-control or emotion regulation difficulties may score differentially on action-oriented ZTPI-F (e.g., “I am able to resist temptations when I know that there is work to be done”) and CFC (e.g., “I only act to satisfy immediate concerns, figuring the future will take care of itself”) items, based on prior research linking impulsivity and delay discounting to these scales (Daugherty & Brase, 2010; Wittmann et al., 2011). Second, the unidimensional factor structure of the FOS was clear and consistent across samples, while the factor structures of the three predominant future orientation measures, the ZTPI, CFC, and FTPS, are under debate (Joireman & King, 2016; Kooij et al., 2014; Worrell et al., 2018). Third, the FOS’s brief nature supports its usefulness in assessing future orientation in medical and research settings, as longer questionnaires can negatively impact engagement and missingness (Booker et al., 2021). Furthermore, administering the FOS to individuals with chronic illness, including fibromyalgia and other rheumatic, musculoskeletal, and pain-related diseases, during medical appointments may provide useful information about protective factors for treatment adherence (Nsamenang & Hirsch, 2015), management of pain (E. C. Chang, Lucas, et al., 2019), functional impairment (Hirsch et al., 2007), and depression and suicide risk (O. D. Chang et al., 2020). In clinical (i.e., medical and psychotherapy) and research settings with primary care patients and minoritized groups, evaluating and promoting future orientation may strengthen resilience, bolstering one’s sense of self-efficacy (O’Neill et al., 2020; Park & Jung, 2015), hopefulness for the future (E. C. Chang et al., 2013), health-related quality of life (Hirsch et al., 2015), and psychological health (E. C. Chang, Chang, et al., 2019; Kwon, 2013). The FOS offers researchers in the fields of positive psychology and health psychology, and beyond, the flexibility to assess future-oriented thinking as a resilience factor in health-vulnerable populations without sacrificing valuable questionnaire space or contributing to participant burden.
Supplemental Material
sj-docx-1-asm-10.1177_10731911261451782 – Supplemental material for Future Orientation Scale: A Psychometric Evaluation Across Health-Vulnerable Samples
Supplemental material, sj-docx-1-asm-10.1177_10731911261451782 for Future Orientation Scale: A Psychometric Evaluation Across Health-Vulnerable Samples by Heather R. Altier, Fuschia M. Sirois, Elizabeth L. Jeglic and Jameson K. Hirsch in Assessment
Footnotes
Appendix
Ethical Considerations
This study received ethical approval for all three samples from their respective institutional review boards. Samples 1 (approval #0413.8e) and 2 (approval #c1116.12e) were approved by the Institutional Review Board of East Tennessee State University on June 4, 2013, and December 2, 2016, respectively. Sample 3 was approved (approval #292733-1) by the Institutional Review Board of John Jay College, City University of New York on January 25, 2012. No identifiable data will be shared with third parties.
Consent to Participate
All participants provided informed consent prior to participating, which was documented via electronic consent forms stored on a secure server.
Funding
The authors received no financial support for the research, authorship, and/or publication of this article.
Declaration of Conflicting Interests
The authors declared no potential conflicts of interest with respect to the research, authorship, and/or publication of this article.
Data Availability Statement
The data sets generated during and/or analyzed during the current study are available from the corresponding author on reasonable request.
Supplemental Material
Supplemental material for this article is available online.
References
Supplementary Material
Please find the following supplemental material available below.
For Open Access articles published under a Creative Commons License, all supplemental material carries the same license as the article it is associated with.
For non-Open Access articles published, all supplemental material carries a non-exclusive license, and permission requests for re-use of supplemental material or any part of supplemental material shall be sent directly to the copyright owner as specified in the copyright notice associated with the article.