






Abstract
Attention-deficit/hyperactivity disorder (ADHD) is a common neurodevelopmental condition requiring early and accurate identification to optimize outcomes. The Swanson, Nolan, and Pelham Rating Scale (SNAP-IV) is widely used to assess ADHD symptoms; however, its length may limit feasibility in large-scale screening. This study applied a multi-algorithm machine-learning framework to refine the 18 core ADHD items of the SNAP-IV by identifying the most predictive items through cross-model consensus ranking while preserving balanced symptom construct representation. Data were drawn from the Taiwan National Epidemiological Study of Child Mental Disorders (410 ADHD, 3,607 controls) and an independent National Taiwan University Hospital cohort (676 ADHD, 374 controls). Across ten classifiers optimized for screening with priority on sensitivity, reduced subsets comprising 4 parent-reported and 6 teacher-reported items retained robust predictive performance across cohorts. Confirmatory factor analysis supported the structural validity of the two-factor (Inattention/Hyperactivity-Impulsivity) shortened scales, with strong latent reliability (McDonald’s omega). A machine learning-derived, construct-balanced SNAP-IV short form provides an efficient and psychometrically sound tool for ADHD screening.
Introduction
Attention-deficit/hyperactivity disorder (ADHD) is among the most prevalent neurodevelopmental disorders, with a global prevalence of 7.6% in children and 5.6% in adolescents (Salari et al., 2023). It is characterized by persistent patterns of inattention and/or hyperactivity-impulsivity (American Psychiatric Association, 2013), leading to significant academic, social, and functional impairments (Wolraich et al., 2019). In addition, ADHD is associated with adverse health outcomes, including increased risks of suicidality (Mulraney et al., 2021) and accidental injuries (Brunkhorst-Kanaan et al., 2021). Timely initiation of treatment, particularly pharmacotherapy, has been shown to improve clinical outcomes and significantly reduce mortality from unnatural causes (Caye et al., 2019; Li et al., 2024). These findings underscore the critical importance of early and efficient identification to facilitate timely intervention and optimize long-term outcomes.
The diagnosis of ADHD relies not only on clinical assessment but also on behavioral questionnaires completed by multiple informants across different settings. A persistent challenge lies in the heterogeneity of ADHD symptom presentations and the variability of reports between observers, such as parents and teachers (Caselles-Pina et al., 2024). Discrepancies often arise, as certain behaviors may manifest more prominently in one setting, such as home or school, but not in both. Moreover, conventional scoring methods typically involve summing item responses without accounting for the relative diagnostic value of individual symptoms. To overcome these limitations, machine learning offers a data-driven framework for identifying the most informative symptom items, assigning differential weights based on their predictive value, and excluding less relevant items, thereby improving diagnostic precision while reducing the burden of questionnaire completion (Gonzalez, 2021).
The Swanson, Nolan, and Pelham Teacher and Parent Rating Scale (SNAP-IV) is widely used to assess ADHD symptoms (Bussing et al., 2008; Gau et al., 2009; Gau et al., 2008). The 26 items are derived from DSM-IV criteria for ADHD and oppositional defiant disorder (ODD) in children and adolescents (American Psychiatric Association, 2013). Administering the SNAP-IV to parents/caregivers and teachers comprehensively evaluates a child’s behavior across different settings. Given the clinical utility and broad adoption of SNAP-IV, this study aims to determine whether the predictive efficiency of this tool for ADHD diagnosis can be enhanced by identifying the most informative items, thereby improving accuracy and utility. To address this objective, we aim to leverage machine learning to uncover complex patterns in behavioral data, thereby generating clinically relevant insights for mental health assessment (Madububambachu et al., 2024). Among various algorithms, deep neural networks (DNNs) are particularly advantageous because they can handle high-dimensional input and capture intricate nonlinear associations among variables. We systematically compare the performance of DNNs with alternative machine-learning algorithms to ensure analytical robustness. In addition, we identify the most discriminative ADHD symptom items that contribute significantly to model performance, aiming to inform the development of a more streamlined and efficient screening tool. Our approach has the potential to improve the assessment process, promote broader awareness, and support earlier identification of individuals at risk for ADHD by emphasizing simplified, high-yield symptom items.
Method
Datasets, Samples, and Procedure
This study utilized two independent datasets. The first dataset was obtained from the Taiwan National Epidemiological Study of Child Mental Disorders (TNESCMD), a nationwide, school-based survey conducted between June 1, 2015, and January 31, 2017, designed to estimate the prevalence of child mental disorders. The survey included 6,242 children (3,181 boys, 51%) in grades 3, 5, and 7 from 45 elementary schools and 24 junior high schools across 19 counties. Among these, 617 children had immigrant mothers, while 5,625 had native Taiwanese mothers; all fathers were native Taiwanese. All participants were fluent in Mandarin Chinese, which was the primary language used for the assessments. For the present study, participants were classified into the ADHD and typically developing (TD) groups, which were selected according to the Chinese version of the Kiddie Epidemiologic Version of the Schedule for Affective Disorders and Schizophrenia (K-SADS-E) assessment based on DSM-5 criteria (Chen et al., 2017; Gau et al., 2005). The final sample comprised 410 children diagnosed with DSM-5 ADHD (302 boys, 73.6%) and 3,607 TD children (1,665 boys, 46.2%) without ADHD or other major psychiatric disorders, as shown in the exclusion criteria. Inclusion in the ADHD group required a confirmed diagnosis of ADHD for both past and present years, while TD children had no psychiatric diagnoses across both time points.
The second dataset (NTUH dataset) consists of 676 children and adolescents diagnosed with ADHD (583 boys, 86.2%) according to DSM-IV or DSM-5 criteria and 374 TD children (295 boys, 78.9%). ADHD participants were recruited from the child psychiatric clinic at NTUH in Taipei, Taiwan. TD participants, with no lifetime diagnosis of ADHD, were recruited from the same school districts as ADHD via school principals and teachers. All participants and their parents were interviewed using the Chinese version of the K-SADS-E to confirm ADHD diagnoses and other psychiatric conditions. Participants (both ADHD and TD groups) with major medical illnesses or major psychiatric conditions—including psychotic disorders (e.g., schizophrenia, bipolar disorder), major depression, autism spectrum disorder, and intellectual disability—were excluded from the data analyses.
This study was approved by the Research Ethics Committee of National Taiwan University Hospital, Taipei, Taiwan (Approval Nos: 200612114R, 200812153M, 200903062R, 201701033RIND, 201411056RIN, 202303071RINB). Written informed consent was obtained from all participants included in the study (or their parent/legal guardian for minors). The clinical trials relevant to this manuscript were registered at ClinicalTrials.gov (Identifiers: NCT00529906, NCT00916851, NCT00916786, NCT02707848, NCT03679403).
Measures
The Chinese Version of K-SADS-E
The K-SADS-E is a semi-structured interview scale designed to systematically assess past and current mental disorders in children and adolescents (Gau et al., 2005). It was modified to meet the DSM-IV (Gau et al., 2005) and DSM-5 (Chen et al., 2017) diagnostic criteria, demonstrating good reliability and validity. The K-SADS-E has been widely used in various studies regarding childhood mental disorders in Taiwan (e.g., Chen et al., 2019; Chiang et al., 2023; Tung et al., 2021).
The Chinese Version of the SNAP-IV
The SNAP-IV is a 26-item scale evaluating three domains: inattention (Items 1–9), hyperactivity/impulsivity (Items 10–18), and oppositional defiant disorder (ODD; Items 19–26). Items are rated on a four-point Likert-type scale (0 = not at all, 1 = just a little, 2 = quite a bit, 3 = very much). To ensure alignment with ADHD-focused screening and minimize potential confounding from comorbid symptom overlap, analyses were restricted to the 18 core ADHD items (Inattention 1–9; Hyperactivity/Impulsivity 10–18), with ODD items excluded (Ollendick et al., 2008). Both parent (SNAP-IV-P; Gau et al., 2008) and teacher (SNAP-IV-T; Gau et al., 2009) versions have demonstrated established reliability and validity.
Deep Learning and Machine-Learning Models
Models
Deep Neural Networks (DNNs) are a class of machine-learning models designed to capture complex, nonlinear relationships through multiple layers of interconnected neurons. In this study, we developed a DNN architecture optimized for ADHD screening using the 18 SNAP-IV ADHD items, excluding the 8 ODD items to maintain a focus strictly on core neurodevelopmental symptoms.
The input layer was organized into three subblocks: demographic variables (age, sex) and two SNAP-IV subscales—Inattention (IA) and Hyperactivity/Impulsivity (HI). This modular structure enables dimension-specific feature extraction prior to integration. As illustrated in Supplemental Figure 1, inputs were processed through hidden layers with Leaky ReLU activation to mitigate the “dying ReLU” problem. To enhance generalizability and reduce overfitting, dropout (rate = 0.5) was applied. The output layer used a sigmoid activation function to generate a probability for binary classification (ADHD present vs. absent), rather than for item reduction.
To benchmark the performance of our proposed DNN model, we implemented a range of machine-learning algorithms widely used in binary classification. These models were selected for their methodological diversity and proven effectiveness in binary classification tasks. Support Vector Machine (SVM) identifies an optimal hyperplane that separates classes (Cortes & Vapnik, 1995), while Naïve Bayes (NB) applies Bayes’ theorem for probabilistic classification (Webb et al., 2010). Linear Discriminant Analysis (LDA) is a dimensionality reduction and classification technique that finds a linear combination of features maximizing class separation, assuming Gaussian-distributed classes with equal covariance matrices (Hastie et al., 2009). We used Logistic Regression (LR) for binary outcome prediction, which estimates the probability of a binary outcome based on a set of input features (Wright, 1995). We also included ensemble learning methods like Random Forest (RF), which constructs multiple decision trees and aggregates their predictions to enhance accuracy (Ho, 1995).
In addition, we included K-Nearest Neighbors (KNN), a nonparametric method that classifies data points based on the majority class among their nearest neighbors in the feature space (Altman, 1992). We also evaluated gradient boosting methods, including eXtreme Gradient Boosting (XGBoost; Chen et al., 2015), Light Gradient Boosting Machine (LightGBM; Ke et al., 2017), and CatBoost (Dorogush et al., 2018). These algorithms iteratively construct decision trees to minimize prediction error. LightGBM is optimized for computational efficiency and scalability with large datasets, while CatBoost is designed to handle categorical features effectively and reduce prediction bias.
Hyperparameter Tuning
Appropriate hyperparameter tuning is crucial for optimizing machine-learning model performance. Hyperparameter optimization significantly affects a machine-learning model’s output and is a decisive step in model development. However, many researchers approach it incorrectly by randomly selecting hyperparameters and repeatedly training and evaluating models, leading to substantial inefficiencies. We employed OPTUNA, a widely recognized, fast, and efficient hyperparameter tuning framework (Akiba et al., 2019). OPTUNA automates optimization via its “create_study” function, systematically exploring hyperparameter combinations via iterative model training and evaluation. To align with the clinical priority of ADHD screening, we implemented a multi-metric, screening-oriented objective function for the OPTUNA search strategy. Rather than relying solely on the Area Under the Curve (AUC), the optimization process prioritized maximizing Sensitivity while enforcing a minimum threshold for Specificity, with AUC serving only as a secondary tie-breaking criterion (Habibzadeh et al., 2016). In this study, we focused on optimizing the following hyperparameters: for SVM, the regularization parameter (C) ranging from 1 to 10 and kernel types (linear, polynomial, radial basis function, and sigmoid); for LDA, solvers including singular value decomposition, least squares solution, and eigenvalue decomposition; for LR, tolerance between 10-10 to 0.1 and inverse regularization strength between 1 to 10; for RF, number of trees (1 to 1,000), maximum depth of the trees (1 to 100), minimum number of samples to split an internal node (2 to 100), and minimum number of sample at a leaf node (1 to 100); for KNN, number of neighbors (1 to 100), weight functions (uniform, distance), and search algorithms (BallTree, KDTree, brute-force); for NB, the portion of largest feature variance added for calculating stability (10-10 to 0.1); for XGBoost, number of gradient-boosted trees (10 to 1,000), maximum tree depth (2 to 8), minimum loss reduction (0.01 to 1), and subsample ratio (0.1 to 1); for LightGBM, number of trees (10 to 1,000), tree depth (2 to 8), and number of leaves (2 to 256); and for CatBoost, number of trees (10 to 1,000) and tree depth (2 to 8). Systematically exploring these hyperparameters enabled us to identify optimal configurations for each model, ultimately improving model performance.
Feature Selection and Progressive Item Reduction
Importance Analysis
For each of the 10 models, item-level importance was first quantified using permutation feature importance (PFI), defined as the absolute change in Sensitivity resulting from random permutation of each item (1,000 permutations per item). To derive a model-agnostic consensus, item importances were converted to within-model ranks (rank 1 = most important) and averaged across models using a Borda-like aggregation. Specifically, the consensus score for item (
Confirmatory Factor Analysis
Construct validity of the selected reduced SNAP-IV short forms was examined using confirmatory factor analysis (CFA) within a two-factor structure, comprising Inattention (IA) and Hyperactivity/Impulsivity (HI). For each informant scale, the final reduced item sets were tested in both the TNESCMD and NTUH cohorts. Model fit was evaluated using Chi-square (
Data Preprocessing and Workflow
Raw data from the TNESCMD and NTUH datasets were preprocessed separately for parent and teacher scales. Missing values were addressed using listwise deletion at the analysis-input level. The TNESCMD dataset served as the primary development cohort and was partitioned into stratified training and test subsets, whereas the NTUH dataset was reserved as an independent external validation cohort. Model training utilized the 18 core SNAP-IV ADHD items (with age and sex included as covariates). To address class imbalance while preserving real-world prevalence, no synthetic resampling was applied. Instead, stratified 10-fold cross-validation was conducted on the training data, with class weighting incorporated during model fitting. This approach mitigates majority-class bias while maintaining the original class distribution in held-out and external datasets.
Feature importance was evaluated using PFI, defined as the absolute reduction in Sensitivity following feature permutation (1,000 permutations per feature on the external test set). A t-test with false discovery rate (FDR) correction (α = .05) assessed statistical significance. Features were ranked via consensus across 10 machine-learning models, and subsets of 1–18 items were systematically evaluated. The optimal reduced feature set was selected based on maximal Sensitivity and Specificity, minimal feature count, and preservation of construct representation (≥2 items each for IA and HI). Finally, CFA with a two-factor structure (IA/HI) was conducted in both TNESCMD and NTUH cohorts to validate the construct validity of the selected short forms.
Results
Model Performance Comparison
The comprehensive performance of all ten models (the DNN and nine machine-learning baselines) across the internal cross-validation, internal test, and external NTUH datasets is presented in Table 1. In the context of ADHD screening, maximizing sensitivity while maintaining acceptable specificity is critical. For the parent-reported external data, the DNN model achieved high sensitivity (0.88) and a precision-recall area under the curve (PR-AUC) of 0.93. In contrast, baseline models such as SVMs demonstrated an excellent balance (Sensitivity = 0.85, Specificity = 0.85, PR-AUC = 0.95). Similarly, for teacher-reported external data, SVM achieved the highest sensitivity (0.89) alongside a PR-AUC of 0.94. Given that several algorithms exhibited highly competitive screening utility rather than a single dominant model, we did not restrict the feature selection process to the DNN. Instead, all 10 trained classifiers were used in the permutation-based feature importance analysis to derive a robust, cross-model consensus ranking.
Full Model Comparison of the Swanson, Nolan, and Pelham Teacher and Parent Rating Scale (SNAP-IV).
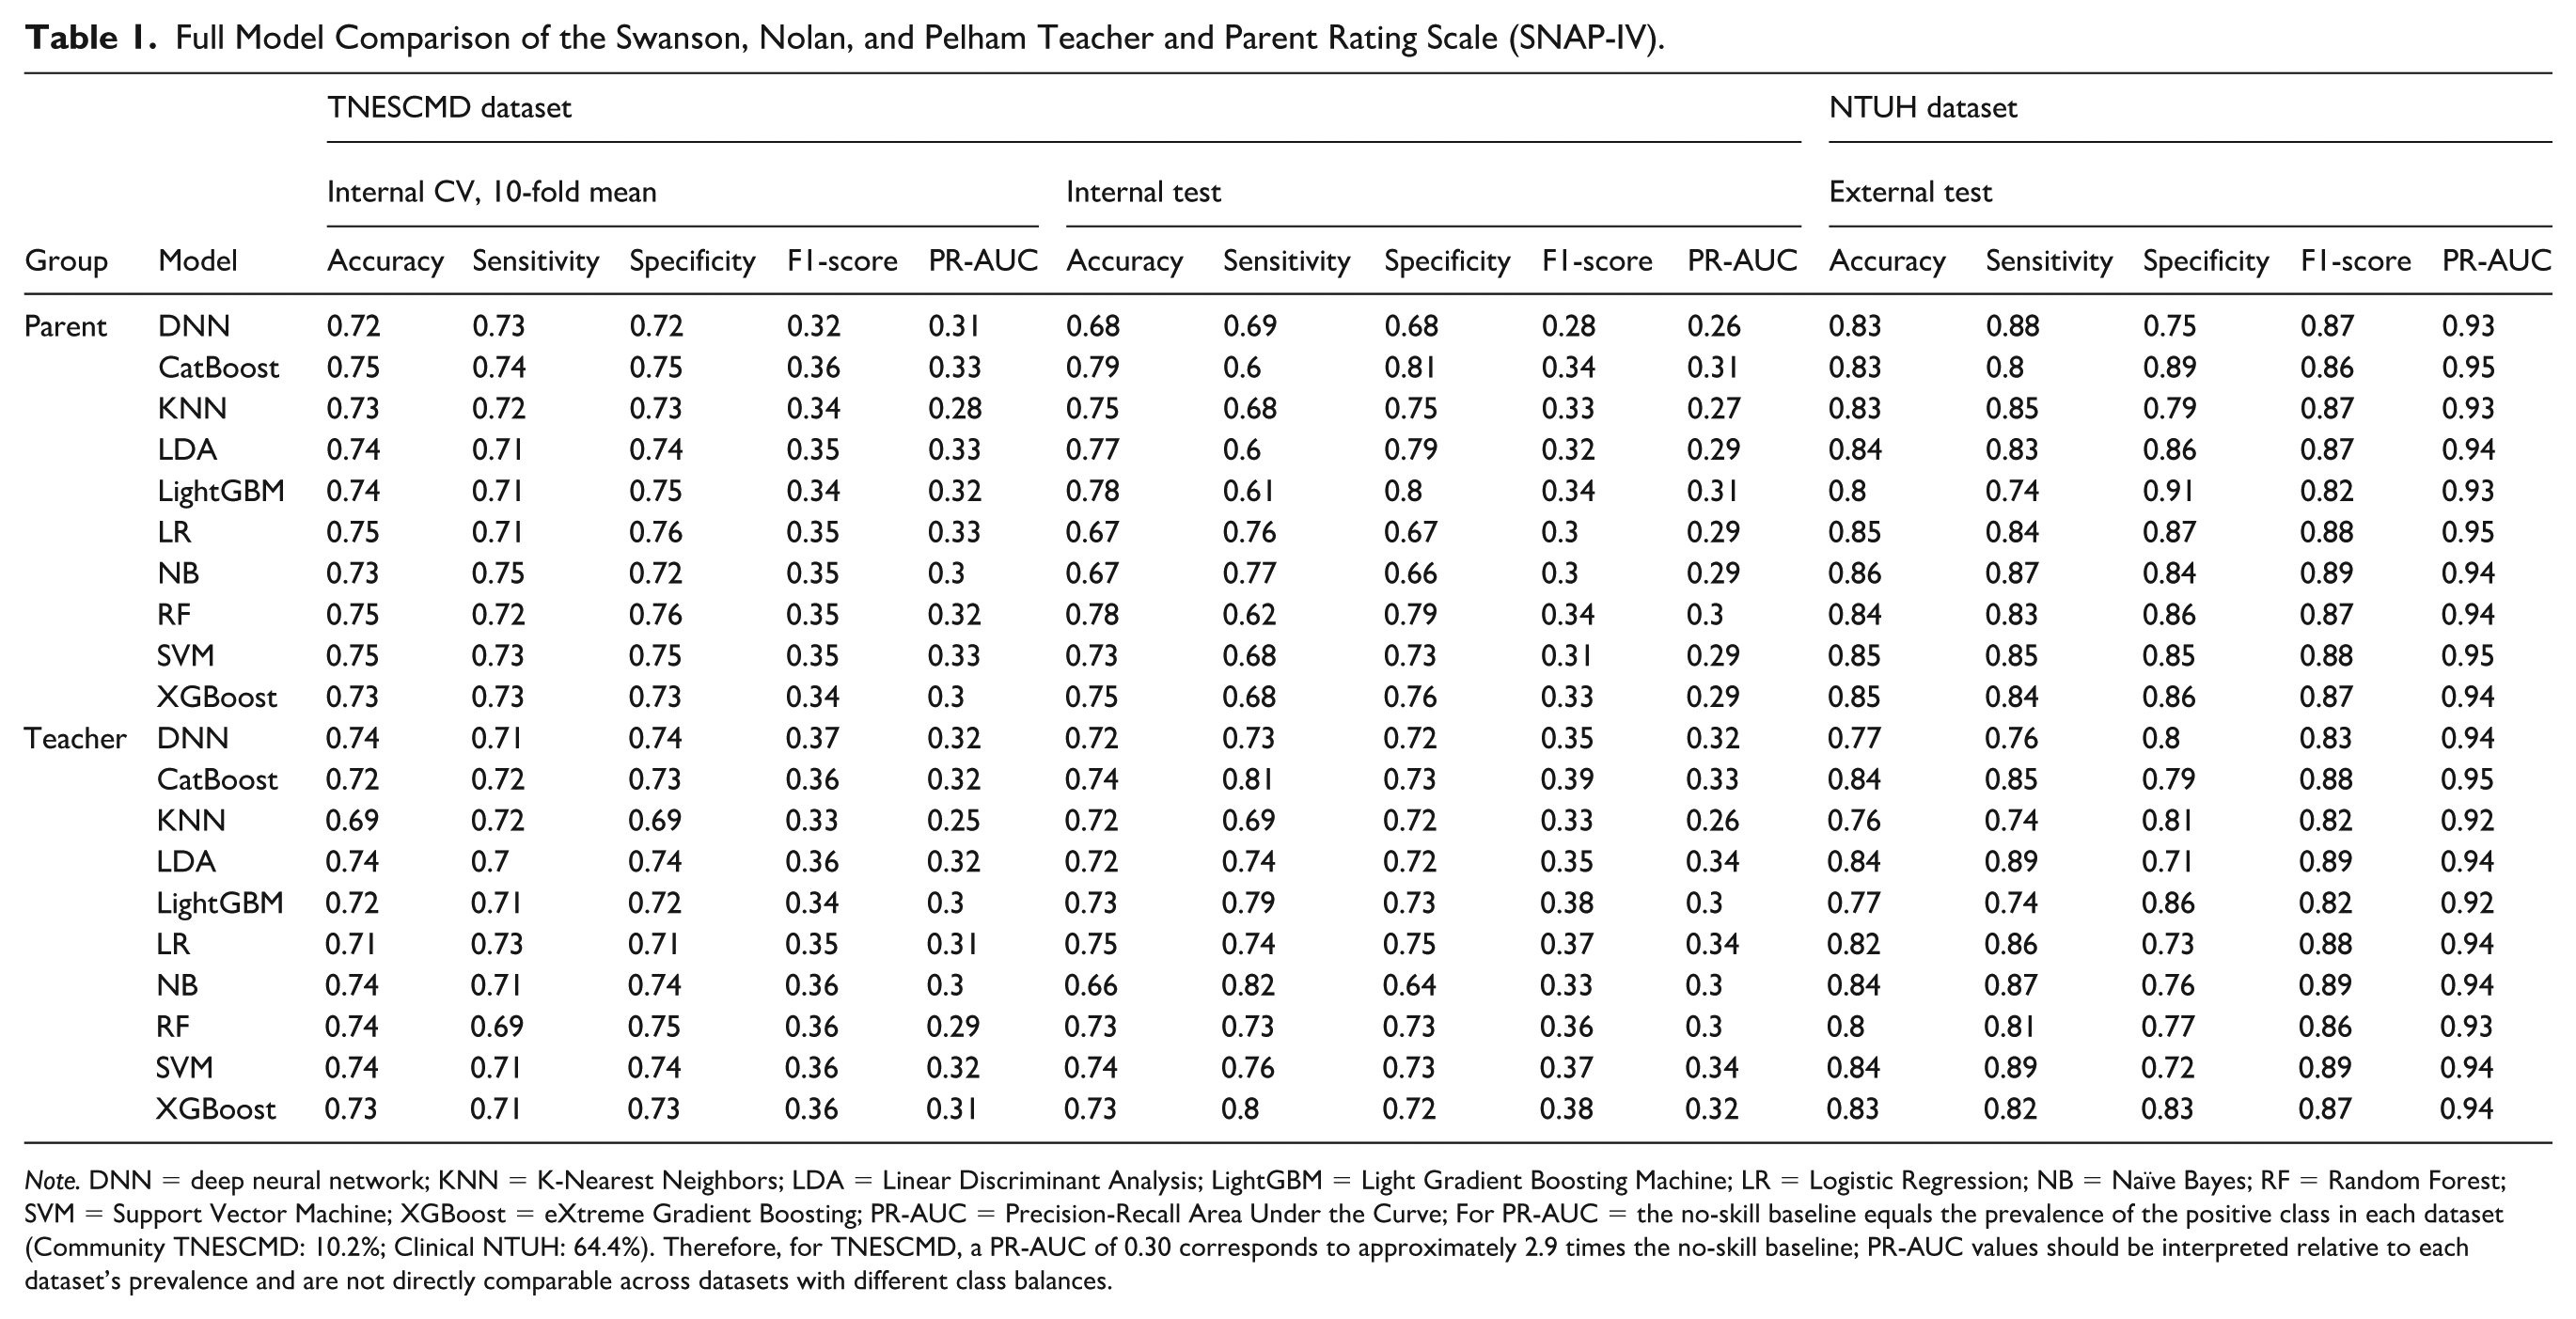
Note. DNN = deep neural network; KNN = K-Nearest Neighbors; LDA = Linear Discriminant Analysis; LightGBM = Light Gradient Boosting Machine; LR = Logistic Regression; NB = Naïve Bayes; RF = Random Forest; SVM = Support Vector Machine; XGBoost = eXtreme Gradient Boosting; PR-AUC = Precision-Recall Area Under the Curve; For PR-AUC = the no-skill baseline equals the prevalence of the positive class in each dataset (Community TNESCMD: 10.2%; Clinical NTUH: 64.4%). Therefore, for TNESCMD, a PR-AUC of 0.30 corresponds to approximately 2.9 times the no-skill baseline; PR-AUC values should be interpreted relative to each dataset’s prevalence and are not directly comparable across datasets with different class balances.
Key SNAP-IV Items for ADHD Classification
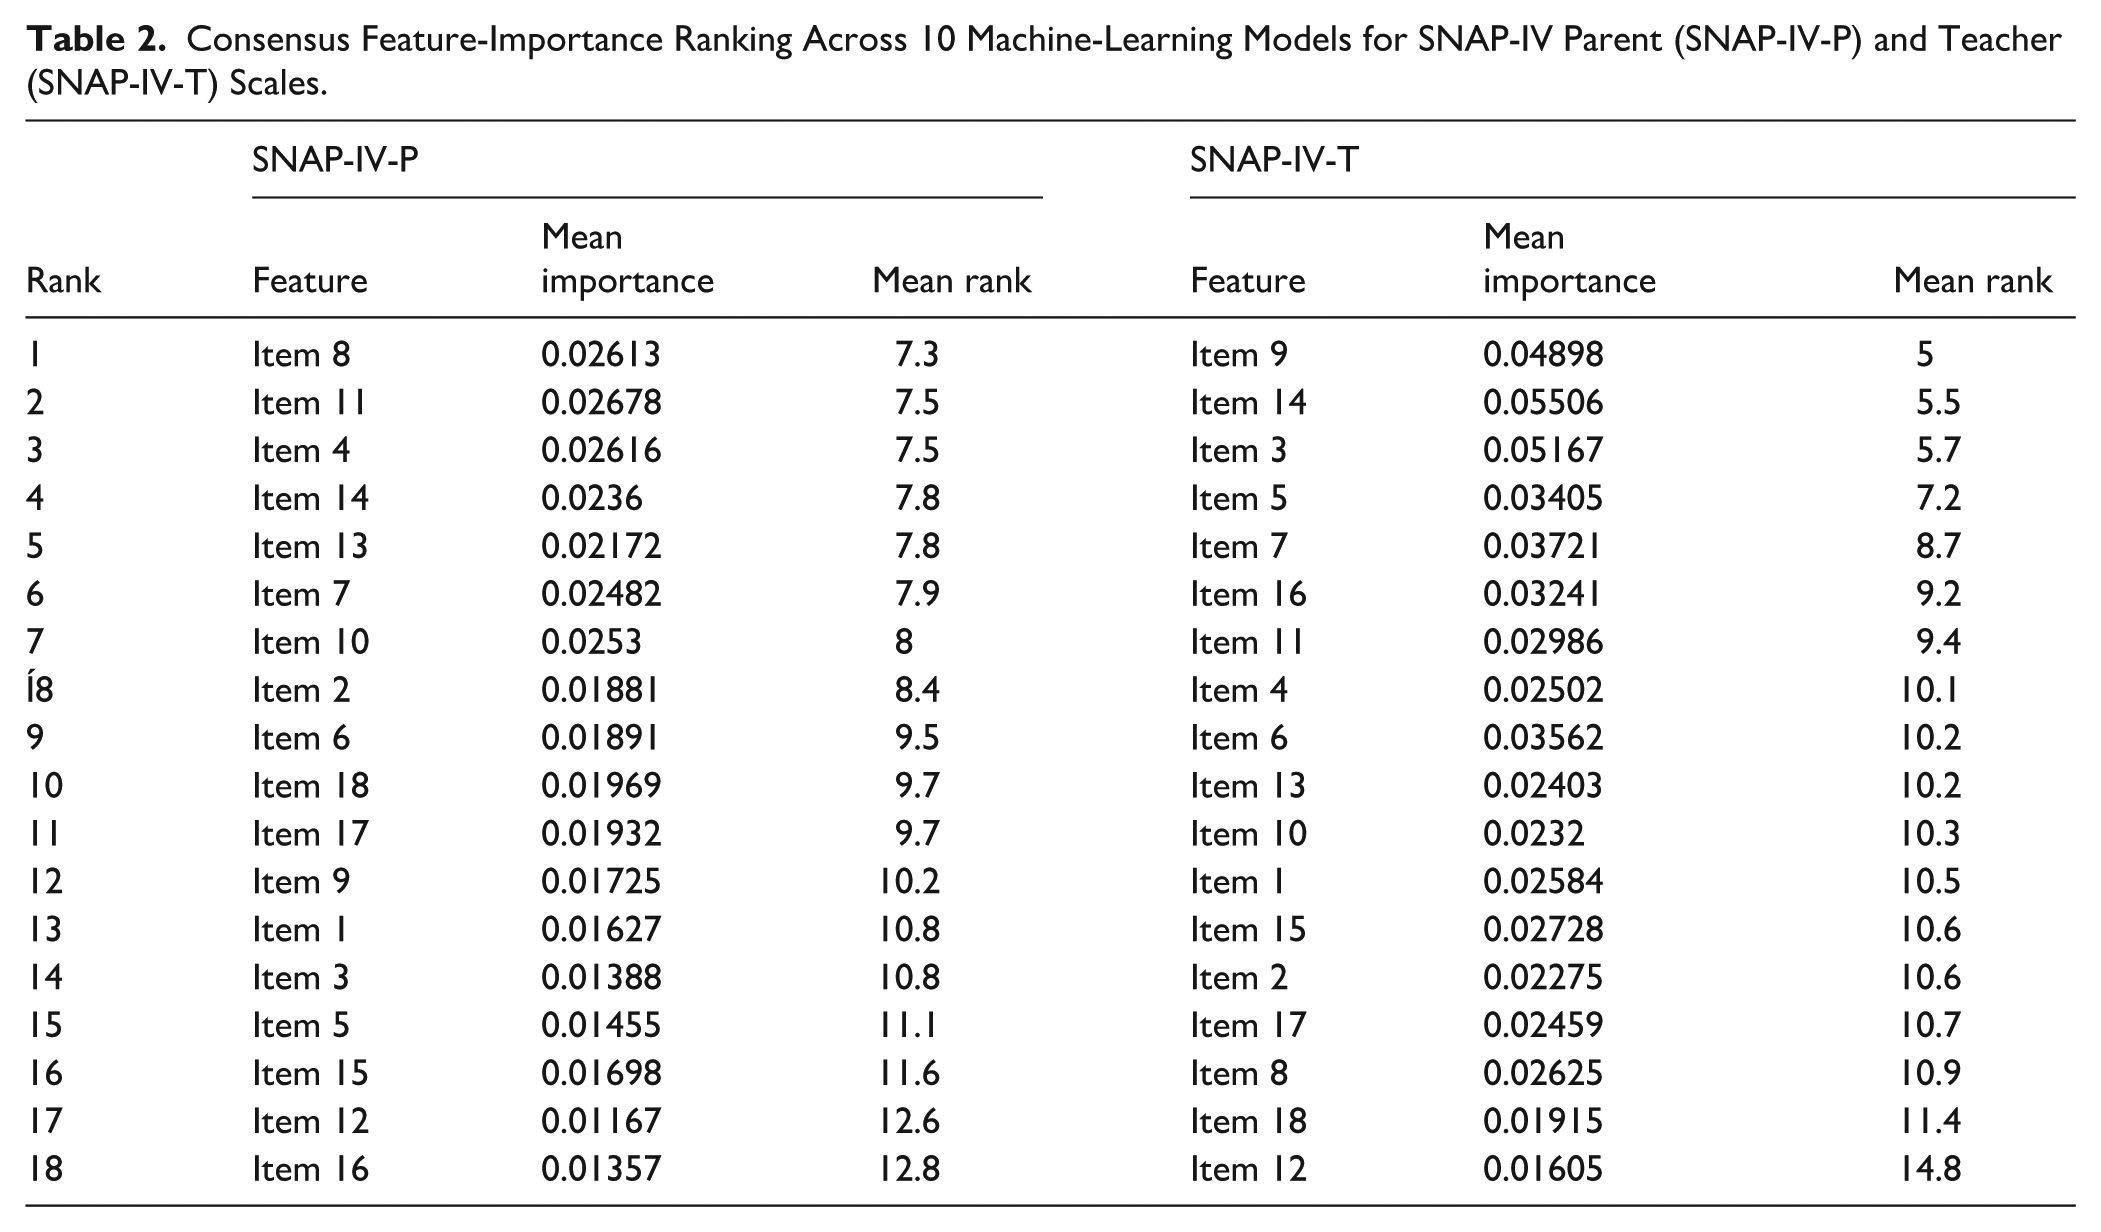
We first evaluated the permutation feature importance (PFI) for all 18 core ADHD items across the 10 machine-learning models to ensure robust feature selection (Performance of top N items in Figure 1; complete PFI results, including importance scores and FDR-adjusted q-values, are provided in Supplemental Table 1; cross-model importance heatmaps are shown in Figure 2). Based on the cross-model consensus ranking (Table 2) derived from these evaluations and the strict IA/HI construct-balance audit, we identified the optimal abbreviated screening subsets. For the parent scale (SNAP-IV-P), a 4-item subset satisfied the constraints and achieved robust balanced accuracy and sensitivity. This subset comprises two inattention items—“fails to finish work” (Item 4) and “distractible” (Item 8)—and two hyperactivity/impulsivity items—“leaves seat” (Item 11) and “driven/on the go” (Item 14). Similarly, for the teacher scale (SNAP-IV-T), a six-item subset provided the most reliable multidimensional screening performance. It comprises four inattention items—“doesn’t listen” (Item 3), “disorganized” (Item 5), “loses things” (Item 7), and “forgetful” (Item 9)—and two hyperactivity/impulsivity items—“driven/on the go” (Item 14) and “blurts out answers” (Item 16). For these optimized short forms evaluated on the external dataset, baseline models maintained excellent screening utility (e.g., SVM achieved a Sensitivity of 0.85 and a PR-AUC of 0.91 for the parent short form, while the DNN achieved a Sensitivity of 0.82 and a PR-AUC of 0.85 for the teacher short form).
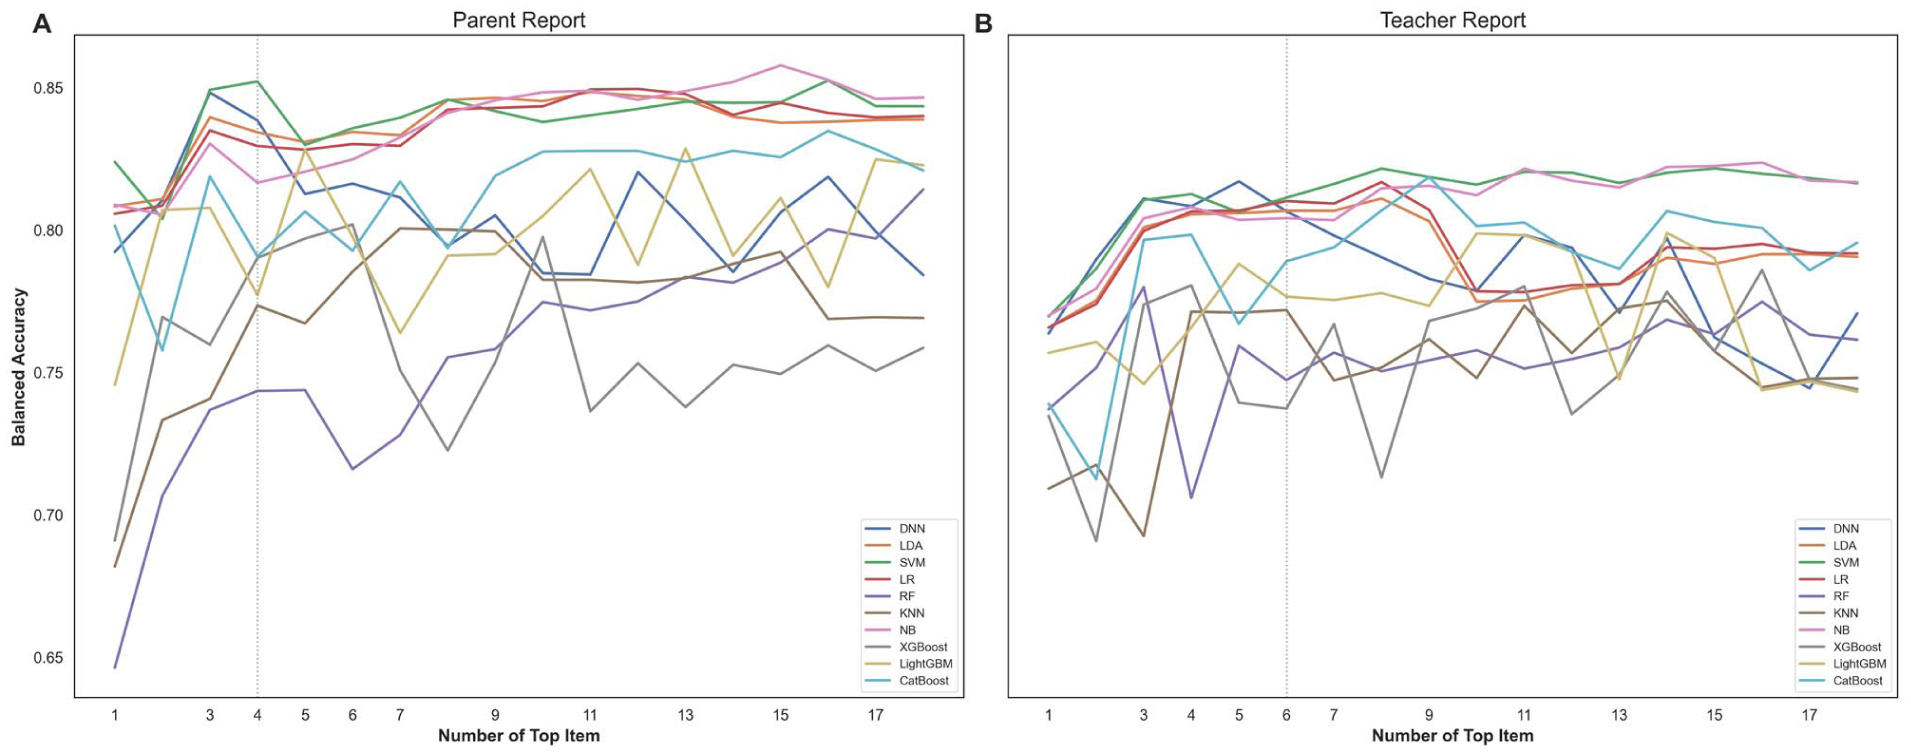
Performance of top N items in the Swanson, Nolan, and Pelham teacher and Parent Rating Scale (SNAP-IV). (A) Parent report. (B) Teacher report.
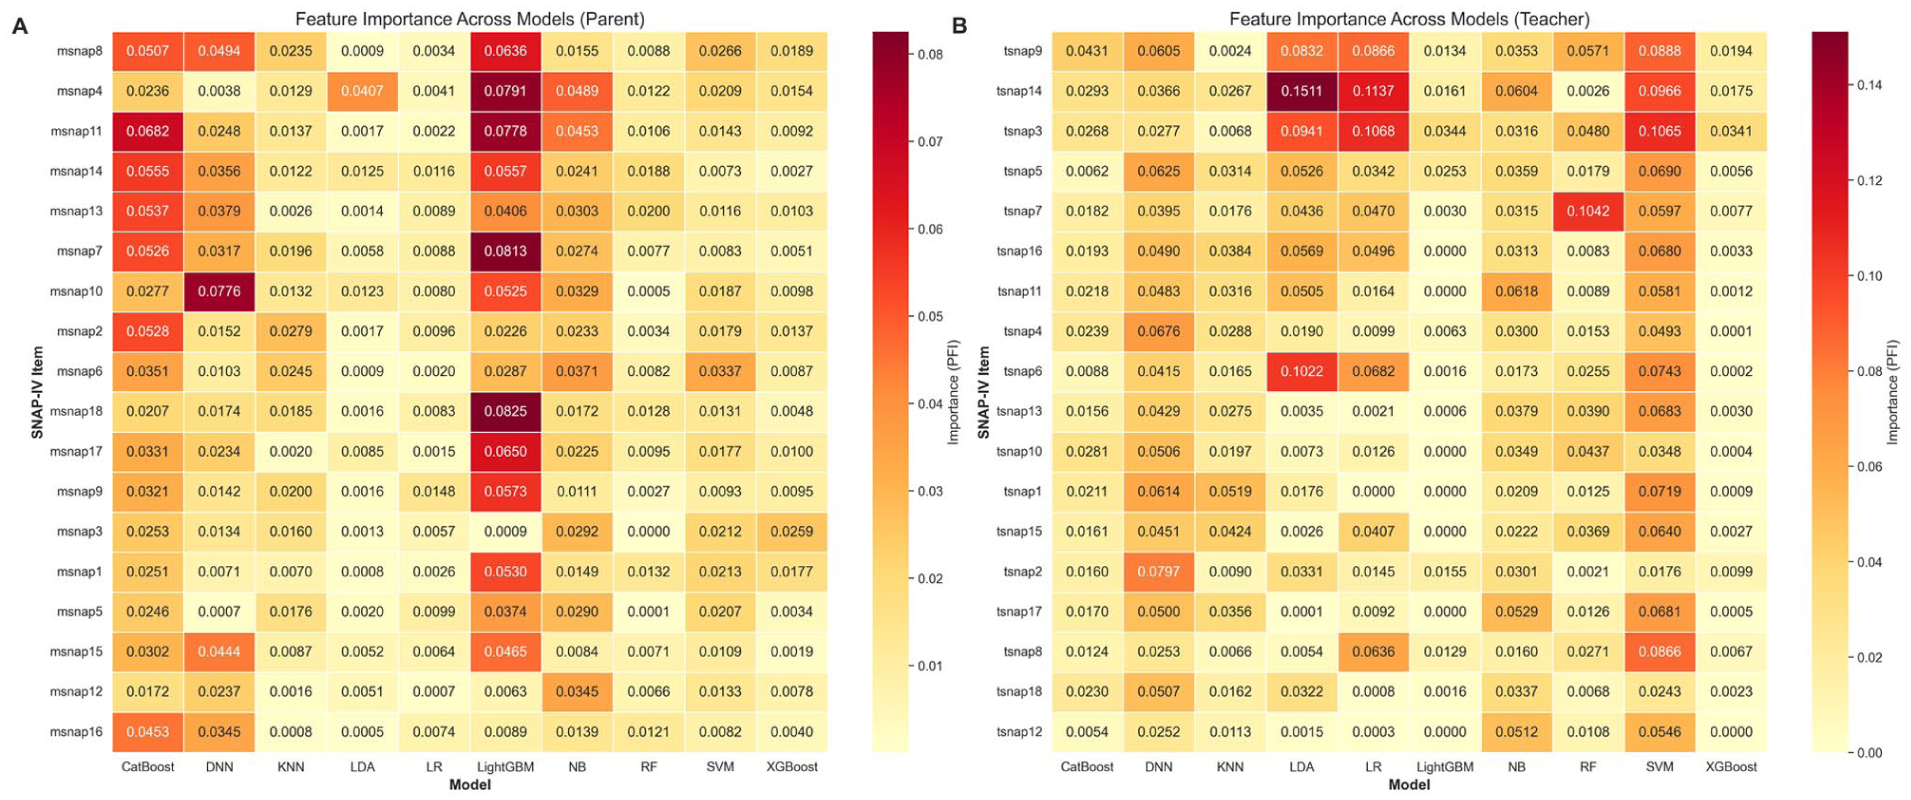
Cross-model permutation feature-importance heatmaps for SNAP-IV ADHD items in parent and teacher scales. (A) Parent scale and (B) Teacher scale. Each cell shows permutation feature importance (PFI) for one SNAP-IV ADHD item in one model, defined as the absolute decrease in sensitivity after permuting that item while keeping other variables unchanged, averaged over 1,000 permutation repeats.
Consensus Feature-Importance Ranking Across 10 Machine-Learning Models for SNAP-IV Parent (SNAP-IV-P) and Teacher (SNAP-IV-T) Scales.
Validation of the Reduced SNAP-IV Items
We conducted CFA specifying a two-factor structure (Inattention and Hyperactivity/Impulsivity) for the optimal reduced item sets. As shown in Table 3, for the parent scale (SNAP-IV-P, 4 items), the model demonstrated excellent fit in both the TNESCMD dataset (CFI = 0.993, TLI = 0.957, SRMR = 0.017, RMSEA = 0.081) and the NTUH dataset (CFI = 0.996, TLI = 0.978, SRMR = 0.012, RMSEA = 0.071). For the teacher scale (SNAP-IV-T, 6 items), the models showed acceptable structural fit in the TNESCMD (CFI = 0.957, SRMR = 0.044) and NTUH (CFI = 0.960, SRMR = 0.044) datasets, although the RMSEA values were slightly elevated (0.131 and 0.124, respectively).
Model Fit of Factor Model of the Swanson, Nolan, and Pelham Teacher and Parent Rating Scale (SNAP-IV)-Short.
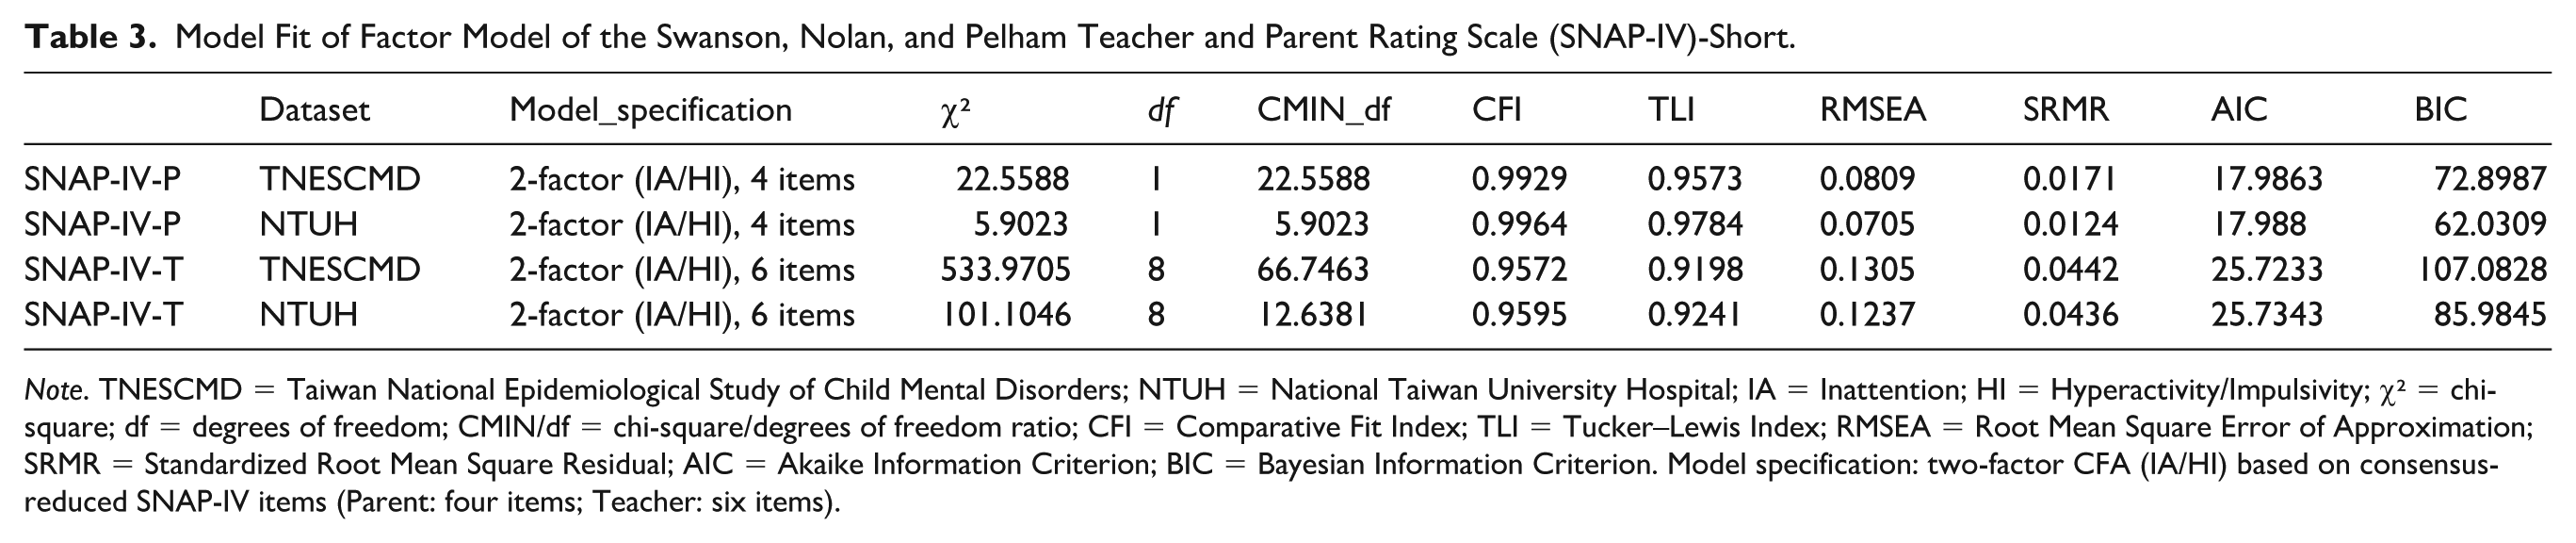
Note. TNESCMD = Taiwan National Epidemiological Study of Child Mental Disorders; NTUH = National Taiwan University Hospital; IA = Inattention; HI = Hyperactivity/Impulsivity; χ² = chi-square; df = degrees of freedom; CMIN/df = chi-square/degrees of freedom ratio; CFI = Comparative Fit Index; TLI = Tucker–Lewis Index; RMSEA = Root Mean Square Error of Approximation; SRMR = Standardized Root Mean Square Residual; AIC = Akaike Information Criterion; BIC = Bayesian Information Criterion. Model specification: two-factor CFA (IA/HI) based on consensus-reduced SNAP-IV items (Parent: four items; Teacher: six items).
To appropriately evaluate latent-model internal consistency, we computed McDonald’s Omega (
Discussion
This study demonstrates that a multi-algorithm machine-learning framework, rather than reliance on a single model, can effectively differentiate children with ADHD from TD peers using both parent- and teacher-reported SNAP-IV data. Through cross-model permutation feature importance and construct-balance auditing, we identified highly abbreviated item subsets—4 items for the parent scale and 6 items for the teacher scale—that optimally preserved screening accuracy while maintaining the multidimensional clinical construct of ADHD (inattention/hyperactivity-impulsivity). These reduced forms retained robust predictive performance, with an emphasis on sensitivity, and achieved strong PR-AUCs across independent external validation datasets.
In time-constrained primary care and school settings, administering the full 18- or 26-item SNAP-IV may be burdensome, potentially reducing the uptake and delaying referrals. The abbreviated SNAP-IV-P and SNAP-IV-T scales address this limitation by substantially reducing respondent burden while preserving the high sensitivity required for first-line screening. Given that the SNAP-IV is best conceptualized as a highly sensitive screening instrument rather than a definitive diagnostic tool (Bussing et al., 2008), item selection prioritized sensitivity to ensure efficient identification of potential ADHD cases, thereby enhancing the feasibility of large-scale screening (Gonzalez, 2021).
Our findings are partially consistent with prior network analytic studies identifying highly central symptoms—those strongly interconnected within symptom networks—in children aged from 6 to 8 years with ADHD and TD peers (Silk et al., 2019). Specifically, Silk et al. (2019) reported high centrality for “loses things” within the inattentive domain and “interrupts,” “driven by motor,” and “leaves seat” within the hyperactive/impulsive domain. Notably, “on the go/driven by a motor” (item 14) emerged as a key feature in both our parent- and teacher-based abbreviated scales, functioning as a trans-situational indicator. This convergence across informants and cultural contexts underscores the clinical salience of Item 14 as a distinct and observable marker of hyperactivity. Its presence across both structured classroom and home environments further supports its utility as a robust behavioral indicator for rapid screening, regardless of the environments or informants.
However, beyond this shared core, divergence between the parent- and teacher-reported scales highlights informant-specific sensitivities to distinct symptom domains. The teacher-reported scale emphasized executive function and organizational deficits, including “disorganized” (Item 5), “loses things” (Item 7), and “forgetful” (Item 9). In structured academic environments that require managing multiple materials and adhering to schedules, such executive impairments are particularly salient to teachers (Brosco & Bona, 2016). The inclusion of “doesn’t listen” (Item 3) and “blurting out answers” (Item 16) further reflects the high self-regulatory demands of the classroom, where deficits in sustained attention and impulse control directly violate behavioral expectations and serve as strong indicators for school-based screening.
In contrast, the parent-reported scale captured symptom expression in less-structured home environments, emphasizing difficulties with the regulation of daily routines and task persistence. Key items included “fails to finish work” (Item 4) and “distractible” (Item 8), which commonly emerge during homework or transitions between activities. The inclusion of “leaves seat” (Item 11), alongside Item 14, underscores overt motor restlessness that disrupts daily routines and parental supervision. These behaviors are primary sources of parent-child conflict and increased domestic tension (Lifford et al., 2009), making them particularly salient markers for parents in identifying children at risk for ADHD.
Several limitations warrant consideration. First, the abbreviated scales were constrained to the 18 core ADHD items to avoid diagnostic confounding, focusing specifically on ADHD screening and excluding detection of ODD comorbidity detection. Second, because clinician-assigned ADHD presentation subtypes (e.g., Predominantly Inattentive, Hyperactive/Impulsive, or Combined) precluded formal subtype-level false-negative analyses; thus, any symptom-pattern stratification should be interpreted as exploratory rather than a validated proxy for clinical subtypes. Third, although the cross-model consensus approach reduces reliance on any single “black-box” model, permutation feature importance captures marginal changes in sensitivity and may show minor ranking variability across iterations. In addition, PFI may also underestimate the contribution of highly correlated features, which are common in behavioral rating scales such as the SNAP-IV. Nonetheless, consensus aggregation enhances the stability and reliability of item selection. Finally, the use of a Mandarin-speaking Taiwanese cohort may limit generalizability, and cross-cultural validation is needed across diverse linguistic contexts.
In conclusion, this study demonstrates that a multi-algorithm machine-learning framework can effectively distill the 18-item SNAP-IV into abbreviated, construct-balanced screening tools. By achieving high sensitivity with only four parent-reported and six teacher-reported items, these abbreviated scales substantially reduce respondent burden without compromising the identification of children at risk for ADHD. Our findings highlight the value of machine-learning consensus in capturing both trans-situational core symptoms and informant-specific behavioral patterns across home and school environments. These abbreviated scales offer a scalable and efficient approach for large-scale ADHD screening, supporting earlier detection and more timely clinical intervention, particularly in resource-limited primary care and educational settings.
Supplemental Material
sj-docx-1-asm-10.1177_10731911261458744 – Supplemental material for Enhancing the Effectiveness of Attention-Deficit/Hyperactivity Disorder Screening Using the SNAP-IV: A Deep Learning Approach
Supplemental material, sj-docx-1-asm-10.1177_10731911261458744 for Enhancing the Effectiveness of Attention-Deficit/Hyperactivity Disorder Screening Using the SNAP-IV: A Deep Learning Approach by Chung-Yuan Cheng, Huey-Ling Chiang, Chi-Yung Shang and Susan Shur-Fen Gau in Assessment
Footnotes
Acknowledgements
The authors thank all the participants, their parents, and school teachers who participated in our study and the research assistants for their help in data collection. The authors also thank the National Center for High-performance Computing (NCHC) for providing computational and storage resources.

Ethical Considerations
All authors complied with the ethical standards in treating their participants, and the Research Ethics Committee of National Taiwan University Hospital, Taipei, Taiwan (Approval Nos: 200612114R, 200812153M, 200903062R, 201701033RIND, 201411056RIN). The clinical trials relevant to this manuscript were registered at ClinicalTrials.gov (Identifiers: NCT02707848, NCT03679403, NCT00916851, NCT00916786). Written informed consent was obtained from all participants and their parents after a detailed explanation of the study.
Author Contributions
Funding
The authors disclosed receipt of the following financial support for the research, authorship, and/or publication of this article: This work was supported by grants from the National Science Council (NSC)/Ministry of Science and Technology (MOST), Taiwan (NSC96-2628-B-002-069-MY3, NSC98-2314-B-002-051-MY3, NSC99-2627-B-002-015, NSC100-2627-B-002-014, NSC101-2627-B-002-002, NSC101-2321-B-002-079, MOST106-2314-B-002-104-MY3) and the Ministry of Health and Welfare (MOHW), Taiwan (M03B3374). Chen-Yung Foundation and National Science and Technology Council, Taiwan (NSTC112-2314-B-002-106-MY3) partially support data management and analysis.
Declaration of Conflicting Interests
The authors declared no potential conflicts of interest with respect to the research, authorship, and/or publication of this article.
Supplemental Material
Supplemental material for this article is available online.
References
Supplementary Material
Please find the following supplemental material available below.
For Open Access articles published under a Creative Commons License, all supplemental material carries the same license as the article it is associated with.
For non-Open Access articles published, all supplemental material carries a non-exclusive license, and permission requests for re-use of supplemental material or any part of supplemental material shall be sent directly to the copyright owner as specified in the copyright notice associated with the article.
