






Abstract
Both positive and adverse developmental experiences have significant impacts across the lifespan. Psychometric measurement of adversity serves multiple conceptual frameworks for parsing experiences; however, existing measurements of positive experiences largely serve count-based frameworks. We present the POS-DEV scale, a retrospective measure of positive experiences with caregivers, close friends, and adult role models across experience dimensions of psychosocial predictability, opportunity, and safety. Exploratory factor analyses (Study 1, n = 406; Study 2, n = 316) reduced items while a confirmatory factor analysis (Study 3, n = 289) confirmed a final factor structure for POS-DEV across childhood and adolescent windows with excellent psychometric properties and construct validity. Six-month test–retest reliability (Study 4, n = 203) was excellent for total scores. Positive experiences explained variation in adult mental health above and beyond adversity effects (Study 5, n = 1,021), highlighting the POS-DEV scale’s utility for capturing important but under-measured promotional aspects of the early psychosocial environment.
Keywords
Introduction
The early psychosocial environment profoundly influences brain, behavior, and health over the lifespan (Bick & Nelson, 2016; Cunha et al., 2025; Han et al., 2023; Marshall & Kenney, 2009; Miguel et al., 2019; Nelson et al., 2019). Psychosocial environments in development are both dynamic and complex, and experiences can be parsed according to multiple conceptual frameworks, including those that consider adverse experiences (here, defined as aspects of psychosocial and/or biological environmental inputs that have negative or maladaptive impacts on an individual) and positive experiences (here, defined as psychosocial and/or biological aspects of environmental inputs that have promotional, buffering, and/or adaptive impacts on an individual; see recent discussions of experiential conceptual frameworks in Humphreys & King, 2025, Nelson & Gabard-Durnam, 2020, Stallworthy et al., 2025). Both adverse and positive developmental experiences are robustly linked to individual differences in biological and behavioral adult outcomes (Appleton et al., 2013; Cosco et al., 2019; D’Amico et al., 2022; Dregan et al., 2011; Friedman et al., 2015; Gershon et al., 2013; Gunay-Oge et al., 2020; Saleptsi et al., 2004). For example, there is a rich literature demonstrating the lasting impacts of early adverse experiences on a variety of health outcomes, including increased psychopathology across the lifespan (Clark et al., 2010; M. M. Davis et al., 2023; Jaffee, 2017; Nelson et al., 2025), both adaptive and maladaptive effects on cognitive and socio-emotional functioning (D. Johnson et al., 2021; Mittal et al., 2015; Wade et al., 2022; Zhou et al., 2022), altered brain structure and function (Callaghan & Tottenham, 2016; Holz et al., 2023; Kraaijenvanger et al., 2023), and physical health changes, such as immune system dysfunction and changes in gut microbiome function (Callaghan et al., 2019, 2020; Elwenspoek et al., 2017; O’Mahony et al., 2017). Evidence also demonstrates widespread, beneficial effects of positive early life experiences into adulthood, with outcomes encompassing decreased psychopathology and stress (Bethell et al., 2019; Narayan et al., 2018; Qu et al., 2022; Wang et al., 2021), increased social and emotional support (Bethell et al., 2019), changes in brain structure (Moored et al., 2020), and better physical health later in life (Slopen et al., 2017).
Importantly, while both early positive and adverse experiences may impact developing and adult function and co-occur within individuals, a majority of the existing literature on the effects of early experiences has focused on measuring the impact of early life adversity (Callaghan & Tottenham, 2016; Cowan et al., 2016; Duffy et al., 2018; Nelson & Gabard-Durnam, 2020; Wade et al., 2022). We join others in calling for a more holistic approach in studying the early environment that incorporates measurement of both positive and adverse childhood experiences within an individual (Han et al., 2023; Merrick & Narayan, 2020). Without measuring both types of experiences, the field obscures a significant proportion of the psychosocial environment of an individual that cannot be directly inferred from adversity measures alone. For example, the absence of abuse does not implicitly indicate close emotional relationships with caregivers, and the presence of abuse in the home does not contradict the possibility of supportive, buffering role models outside of the home (Figure 1). These measurement omissions impede progress in understanding and supporting individuals by failing to characterize adaptive development, paths to resilience, and unique predictors of poor mental health and wellness.
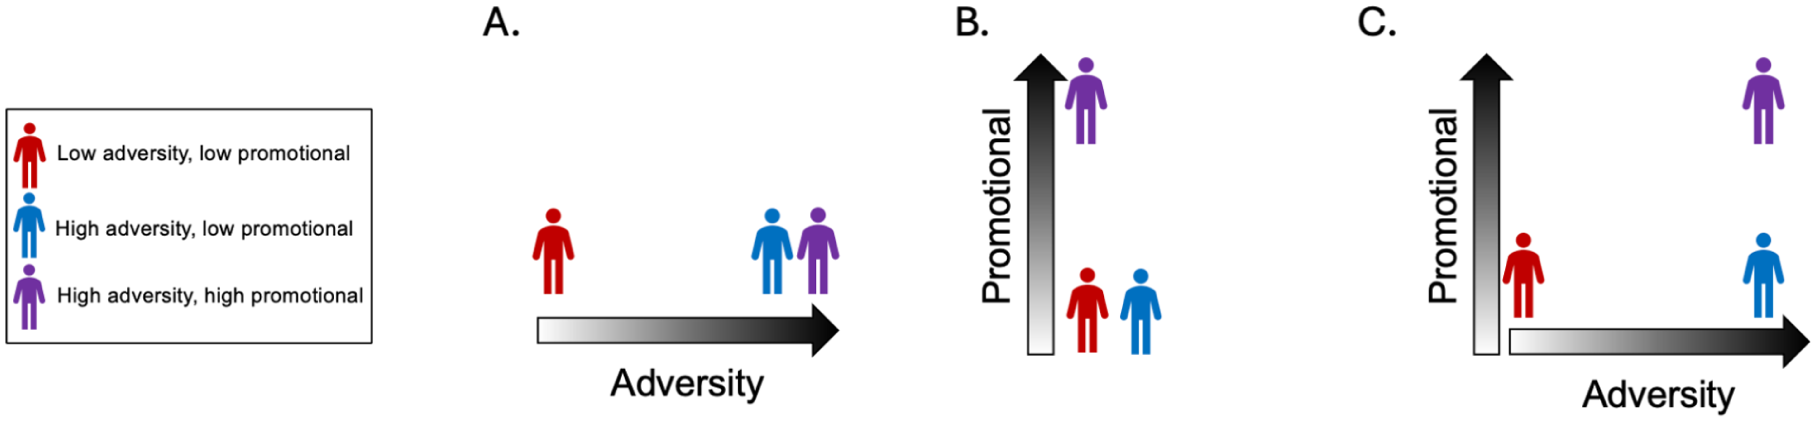
Conceptual schematic emphasizing the need to measure both adverse and positive experiences to accurately capture individual differences in the early psychosocial environment. (A) Demonstrates how the developmental environment is represented when only early adverse experiences are considered in empirical studies. (B) Demonstrates how the developmental environment is represented when only early promotional experiences are considered in empirical studies. (C) Demonstrates how the developmental environment is represented when both early adverse and promotional experiences are considered in empirical studies, more accurately representing the environments for each individual.
Research focusing on the protective and/or buffering roles of positive experiences in the face of adversity demonstrates the importance of measuring the spectrum of experiences (Powell et al., 2021). For example, positive caregiving experiences can buffer a range of adverse environments across species (Gee & Cohodes, 2023; Gunnar et al., 2015; Humphreys et al., 2022; Luby et al., 2022). More broadly, studies measuring a range of both positive and adverse experiences within individuals have found moderating and promotional effects of positive experiences on outcomes associated with early adversity (Bethell et al., 2019; Crandall et al., 2019, 2020; Han et al., 2023; Kemp et al., 2024; König et al., 2023; Narayan et al., 2018; Powell et al., 2021; Qu et al., 2022; Wang et al., 2021). In a recent empirical study, Smith Carson et al. (2026) found that when considering the co-occurrence of positive and adverse experiences in children and adolescents, positive experiences moderate the association between early adversity and negative mental health outcomes in these individuals. However, this effect was strongest among those with a lower incidence of adverse events (Smith Carson et al., 2026). This study illustrates how acknowledging and measuring the varied and nonuniformly valenced early environment better equips researchers to understand multifinality in mental health outcomes.
In parallel, there has been significant focus on how to conceptualize and operationalize adverse psychosocial experiences in childhood. Specifically, the field of early adversity research has broadened beyond traditional cumulative risk and count-based measurements of adversity (e.g., Dube et al., 2003; Felitti et al., 1998) to include dimensional frameworks (Machlin et al., 2025; McLaughlin et al., 2021). Dimensional frameworks facilitate considering differential effects of experience beyond dose-response relations as well as acknowledging the shared elements and co-occurrences among adversity types (Berman et al., 2022; McLaughlin et al., 2021, 2014; Sheridan & McLaughlin, 2014; Farkas & Jacquet, 2025). Dimensions of adverse experiences commonly studied include unpredictability, deprivation, and threat, with each dimension implicated in differential effects on development and adult outcomes (D. Johnson et al., 2021; Lee et al., 2025; Machlin et al., 2023; Maner et al., 2023; McLaughlin et al., 2014; Miller et al., 2018; Spadoni et al., 2022; though see also research related to environmental harshness, Belsky et al., 2012). To accurately measure these dimensions of experience continuously as a function of severity and chronicity, a number of scales have been developed for each dimension (Unpredictability: CHAOS [Matheny et al., 1995], QUIC [Glynn et al., 2019]; Deprivation and Threat: DT-AS [Tsai et al., 2025]; Multi-dimensional: DISTAL and DISTAL-E [Cohodes, Mandell, et al., 2023; Cohodes, McCauley, et al., 2023]). This conceptualization of adversity better equips researchers and practitioners to inform targeted interventions based on underlying dimensions that are present across a number of adverse exposures (McLaughlin & Sheridan, 2016).
While scales measuring early life adversity have emerged to fit evolving conceptualizations of the early environment, scales measuring positive early life experiences have yet to include dimensional frameworks and remain largely count-based measures (Bethell et al., 2019; Moored et al., 2020; Narayan et al., 2018). The most frequently cited measures of positive experiences are count-based scales, specifically the Positive Childhood Experiences Scale (PCEs; Bethell et al., 2019) and the Benevolent Childhood Experiences Scale (BCEs; Narayan et al., 2018). Both scales have been instrumental in helping shift the field toward measuring positive experiences that children may encounter, but they are limited to giving count-based scores that treat each experience as equal and additive. Further, given the brevity of these scales (PCEs: 7 items, BCEs: 10 items), they do not provide the opportunity to assess more deeply different domains, social contexts, or quality of experiences. Additional extant scales individually focus on specific types of early positive experiences in limited contexts, such as the home environment (Home Observation for Measurement of the Environment [HOME] Scale, Caldwell & Bradley, 1984; Multiple Indicator Cluster Surveys [MICS] Supportive Environment in the Home, Frongillo et al., 2022), family routines (The Family Routines Inventory [FRI], Jensen et al., 1983), friendships (Montreal Friendship Questionnaire [MFQ], Mendelson & Aboud, 1999), the neighborhood (Buckner Neighborhood Cohesion, Buckner, 1988), and the emotional atmosphere of the family (Centeredness Scale, Narayan et al., 2023). Other scales more broadly capture positive experiences at the individual, family, and community levels, such as the Resilience Protective Factors Checklist (RPFC; Powell et al., 2021), but these experiences have not been dimensionalized. Nascent efforts to consider dimensions of positive experiences include the Health Outcomes from Positive Experiences (HOPE; Guo et al., 2022). Three core dimensions of positive developmental experiences were identified within their longitudinal cohort, specifically nurturing and supportive relationships, safe and protective environments, and constructive social engagement and connectedness. This study’s findings show promise for dimensionalizing positive experiences but have yet to be translated into a measurement scale.
There are multiple limitations to these current approaches to measure positive early life experiences. First, existing measures target specific experiences and contexts. Although a handful of existing scales provide a richer characterization of positive developmental experiences than count-based scales by addressing experiences in the home, the neighborhood, and with friends (separately), the practice of including multiple questionnaires in a single study session carries a higher participant burden and does not provide measurements capturing dimensions of early experiences across social contexts. Further, existing positive experiences scales do not look at the effects of developmental timing of experiences, as no measure to date is validated in both childhood and adolescence. This is particularly important because certain experiences may be more prevalent or impactful in one developmental time period compared to the other (Bosch et al., 2012; Gabard-Durnam & McLaughlin, 2019; Kessler et al., 2023; Tottenham & Sheridan, 2010). For example, friendships may play a particularly formative role in adolescence for identity formation (Jones et al., 2014), feelings of belonging (Barr, 1997), and adjustment (Waldrip et al., 2008). Even if a particular experience is equally common in both time periods, an individual’s situation may change between childhood and adolescence. Therefore, developmental timing requires consideration in both scale development and scale application in study populations. Finally, extant scales often assess a nuclear family structure that is prevalent in Western cultures by asking about caregivers within the home, missing the important roles that extended family and other adult role models can play in youths’ lives (Pilkauskas & Cross, 2018).
The Present Study
We propose and validate the Predictability, Opportunity, and Safety Dimensions of Environmental Variability (POS-DEV) Retrospective Scale to address these gaps in the positive experience literature and align measurement to the multi-dimensional framework that has proven useful for operationalizing early adversity. First, we aimed to offer a dimensional framework of positive psychosocial early life experiences by focusing on socio-emotional predictability (Predictability), opportunity for close connection (Opportunity), and psychosocial safety and support (Safety) to dovetail current dimensional frameworks of adversity (e.g., unpredictability, deprivation, and threat). Second, we aimed to examine the developmental psychosocial environment beyond the primary caregiver(s). We measure each dimension in relation to the social figure that served as the source of these experiences: primary caregiver(s), close friends, and other positive adult role models (such as grandparents, neighbors, teachers, coaches, etc.) Third, we aimed to make our scale sensitive to developmental timing by measuring experiences separately in childhood and adolescence. Following the validation approach of the BCEs and PCEs scales, we administered the questionnaire to adults as a retrospective report to evaluate sequelae of positive early life experiences in adulthood. Here we describe POS-DEV scale development and validation and demonstrate its utility in understanding variation in adult outcomes.
Study 1: Exploratory Factor Analysis 1
Method
Developing Items for the Predictability, Opportunity, and Safety in Development Scale
Our first step in creating the Predictability, Opportunity, and Safety in Development (POS-DEV) scale was developing items that assessed positive early life experiences across the dimensions of Predictability, Opportunity, and Safety in relation to three social figures (primary caregiver(s), close friend(s), and positive adult role model(s)) to test with exploratory factor analysis. We created items that aligned with questions/domains on existing questionnaire measures of positive early life experiences as well as the breadth of lived experiences reported in focus groups of adults. We considered items/domains from the Home Observation for Measurement of the Environment (HOME) Inventory (Caldwell & Bradley, 1984), Multiple Indicator Cluster Surveys (MICS) Supportive Environment in the Home (Frongillo et al., 2022), the Positive Childhood Experiences Scale and Benevolent Childhood Experiences Scale (Narayan et al., 2018), and Buckner’s Neighborhood Cohesion Scale (Buckner, 1988). We also created items to measure constructs not yet indexed by existing measures. The same list of items was created to measure childhood (ages 6–12 years old) and adolescent (ages 13–18 years old) positive early life experiences but was submitted to separate testing and item reduction processes. Response options for all items used a four-point agreement scale, with 1 meaning the scale item is “not at all true” and 4 meaning it is “very true.” Finally, we included several additional questions for close friends and role model social figures that were not evaluated for the experience dimensions tested but provide additional context for the duration and quantity of these experiences in development that may be helpful for future research questions. Specifically, these items probed the number of close friends/adult role models who were present and the length of time they were present within the given time window. Prior to exploratory factor testing, we piloted and revised items according to feedback across multiple sites in the United States in the targeted age range (adults aged 18+) for item clarity and relevance to each dimension and social figure (See Supplements A and B for items included in testing). A total of 78 items were tested for each developmental window. We report how we determined our sample size, all data exclusions, and all measures in the study in the following sections.
Participants
A total of 414 English-speaking adult Prolific workers from the United States took part in Study 1 on the online survey platform Qualtrics (Table 1). Sample size was selected following exploratory factor analysis guidance of having at least 10 participants per question to be validated (POS-DEV caregiver scale was the longest with 37 questions to be tested), anticipating approximately 10% drop-out during testing (Dixon, 2005). Of these, eight participants were removed prior to exploratory factor analysis for not completing any portion of the study (see Table 1 for demographic information for all studies). Some individuals only completed certain dimensions of the POS-DEV questionnaire due to drop-out, while others did not endorse having a close friend or role model during these developmental windows (which we probed before participants responded to items related to each social figure at each time period). In the case where participants did not endorse having a close friend or role model for a given developmental window, they received an overall score of zero for that social figure during that period. Accordingly, the following are the final sample sizes of individuals with non-zero scores suitable for exploratory factor testing for each social figure and developmental window: 406 for caregivers in childhood, 403 for caregivers in adolescence, 352 for friends in childhood, 331 for friends in adolescence, 291 for an adult role model in childhood, and 255 for an adult role model in adolescence.
Studies 1–4 Sample Demographics.
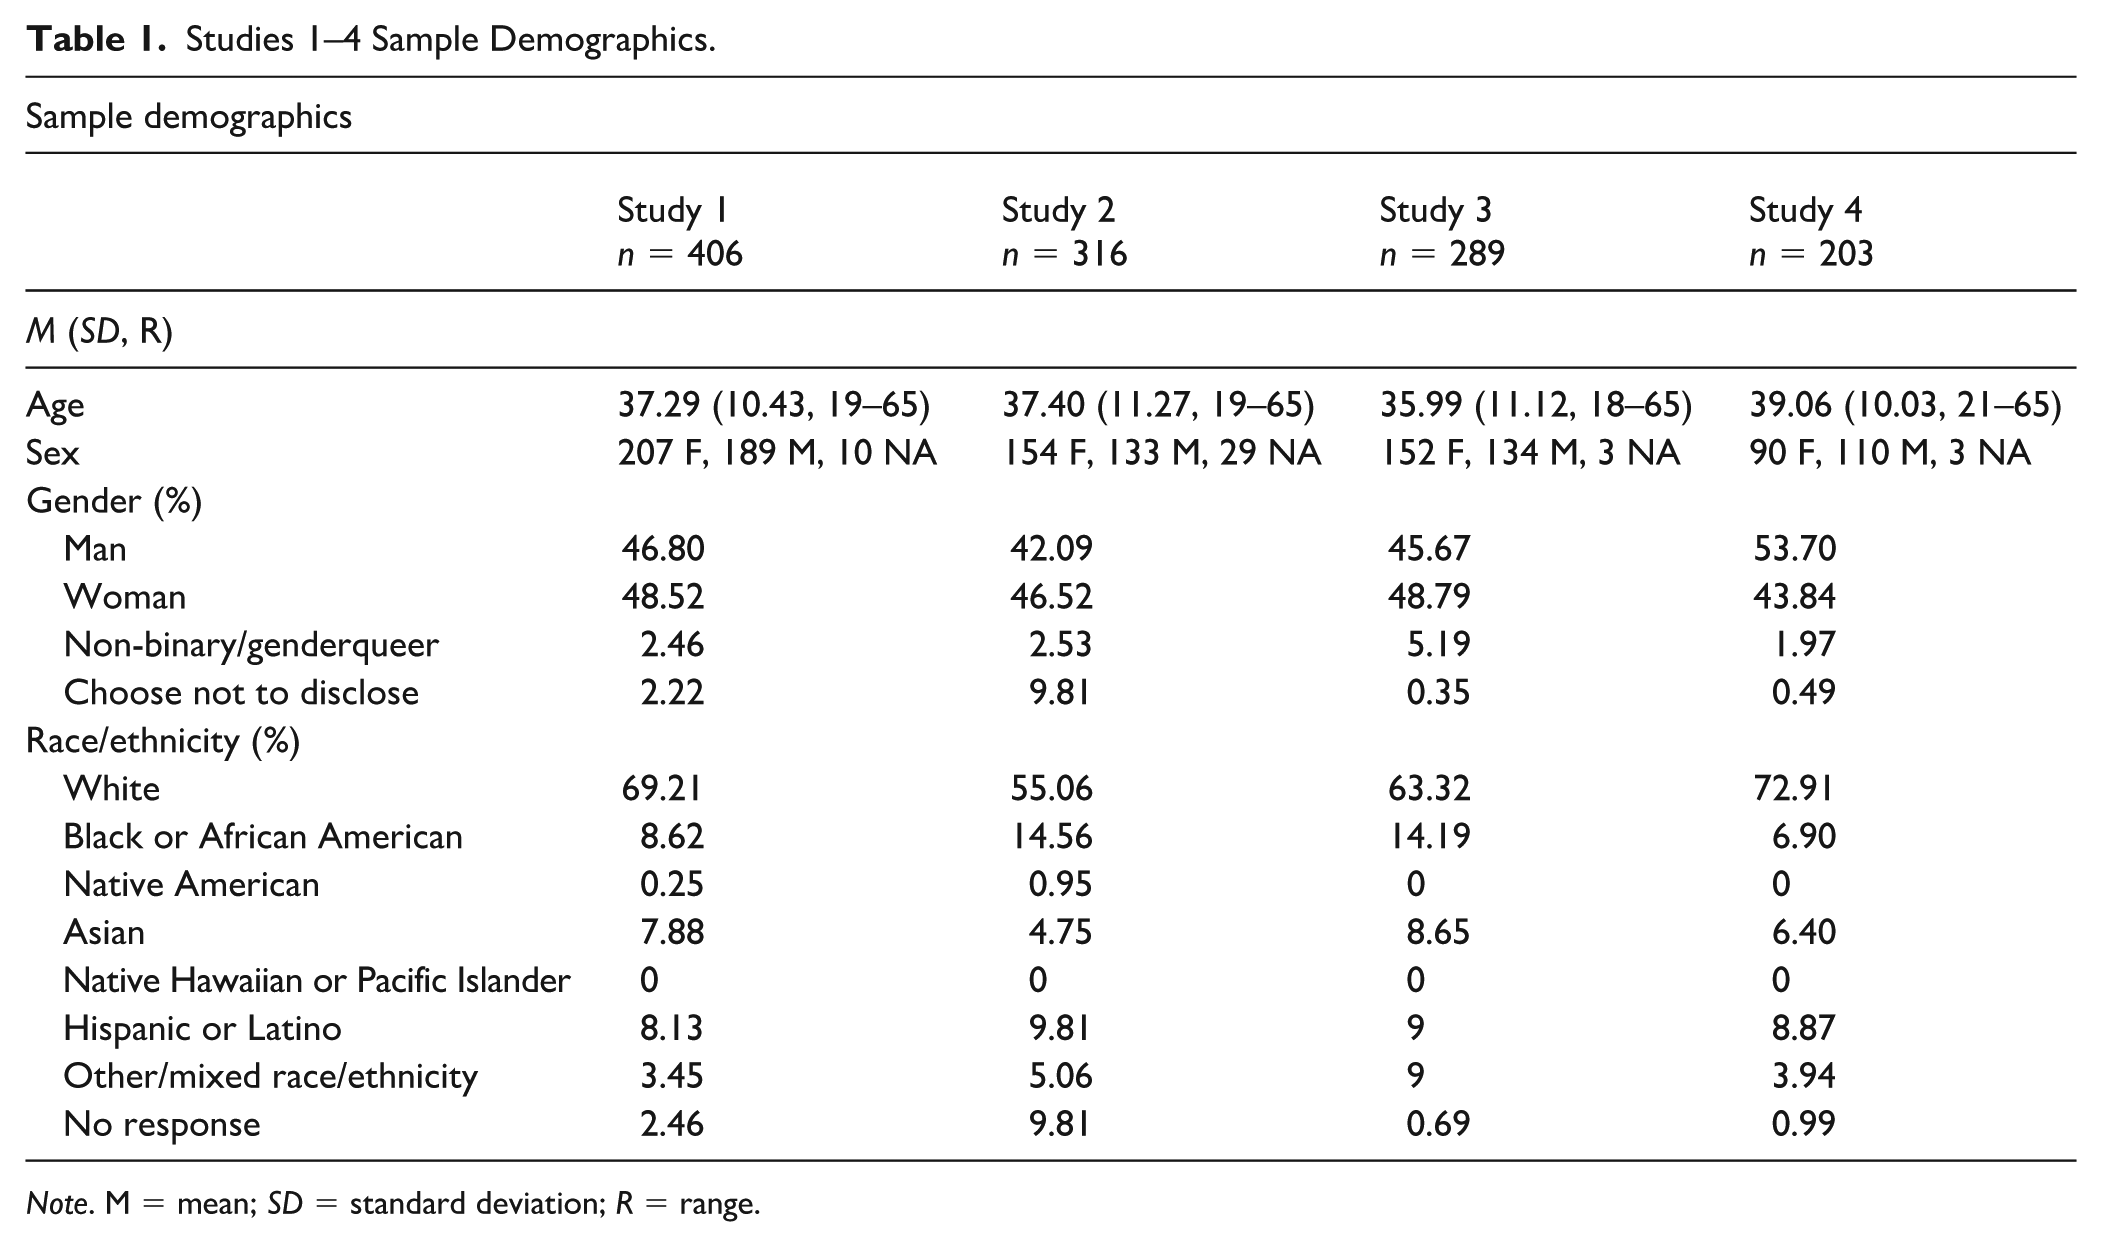
Note. M = mean; SD = standard deviation; R = range.
Materials and Procedure
Across all studies, participants completed the POS-DEV questionnaire on the online survey platform Qualtrics. They were first prompted to recall their childhood (6–12 years old) and answer questions about their primary caregiver(s), followed by close friends, and then adult role models. They were then asked to recall their adolescence (13–17 years) and were prompted with items about the same three types of social figures during this window. If participants reported that they did not recall having close friends or positive adult role models during each developmental time period, Qualtrics logic skipped items aimed at measuring experiences with that social figure during that window.
The purpose of Study 1 was to perform exploratory factor testing and reduce items from the first iteration of the POS-DEV scale. Participants were directed to the Qualtrics online survey tool to complete the 156-item POS-DEV scale (78 items for the childhood window and 78 items for the adolescent window) as part of a larger questionnaire battery. Study 1 took an average of 66 min to complete.
Analysis Plan
Study 1 aimed to (a) test for the existence of a general POS-DEV factor, (b) reveal the POS-DEV factor structure, and (c) reduce the number of items included in the POS-DEV scale for each social figure and developmental time period as needed. Exploratory factor analysis (EFA) on the POS-DEV scale was performed using the psych:fa function within the psych 2.2.9 package (Revelle, 2024) in R version 4.2.1 (2022-06-23; R Core Team, 2022). We tested a three-factor solution for items per social figure for each developmental time period separately (i.e., factor solutions were tested separately on items indexing experiences with childhood caregivers vs. adolescent caregivers vs. childhood close friend(s)). This approach enables future studies to separately administer the POS-DEV scale based on which social figure(s) and developmental time window(s) are of interest. We chose to test a bifactor model fit to our data. In contrast to higher-order models, bifactor models consist of items that uniquely contribute to the measure’s general score, as well as to an individual factor. As a result, our first step in conducting exploratory factor analyses for POS-DEV items was testing a bifactor model to confirm the presence of a general factor using the McDonald coefficient test separately for each social figure and time period, such that a coefficient above a predetermined threshold indicates the presence of a general factor (McDonald, 1999, threshold for general factor: ωh > 0.6). Because this test requires an a priori factor solution, we tested this fit using a three-factor solution for each scale based on our three proposed dimensions (predictability, opportunity, and safety). We chose to take a data-driven approach to determining the factor structure for each social figure within each developmental window because, while we proposed three dimensions, we did not have clear hypotheses that all three dimensions would be suitable for each of the social figures for each developmental window. As a result, we let the data inform us what the best possible factor structure was for each social figure and developmental window combination.
If a general factor was confirmed, to then extract and interpret a factor solution, we performed an oblique rotation on the data with our proposed three-factor solution. Because we did not expect the factors to be independent, an oblique rotation was used as it allows for correlation among the factors. We used the Schmid–Leiman factor analysis solution with maximum likelihood estimation to orthogonalize the data for item reduction. This approach is used for item reduction on bifactor models because it results in a factor solution that accounts for factor loadings per item that are independent of each items’ relation with the general factor (and vice versa; Wolff & Preising, 2005). Items were subsequently removed if: (a) they did not load onto the general factor (had a loading <0.2), (b) they had a high uniqueness value (>0.7), or (c) they cross-loaded onto two factors (had loadings between 0.2 and 0.4 for two factors). This process was completed iteratively until all items met the aforementioned criteria.
Results
POS-DEV: Childhood
For each social figure within the childhood window, a McDonald coefficient omega test using the proposed three-factor structure suggested the presence of a general factor, providing evidence that each model is bifactor (ωh = 0.71–0.89). Of the 78 items for the childhood window, 17 items were removed across the three social figures. For the childhood caregiver, two items were removed for cross-loading onto two factors, an additional two items were removed for not loading strongly onto a single factor, and one item was removed for its high uniqueness value. For childhood close friend(s), three items were removed due to not loading onto a factor. For childhood positive adult role model(s), four of these items were removed due to high uniqueness values, three did not load onto a factor, and two were removed due to cross-loading onto multiple factors (see Figure 12 for a flowchart of item reduction and Supplement A for a list of removed items).
POS-DEV: Adolescence
For each social figure within the adolescent window, a McDonald coefficient omega test using the proposed three-factor structure suggested the presence of a general factor, providing evidence that each model is bifactor (ωh = 0.74–0.90). Of the 78 items for the adolescent window, 21 items were removed across the three social figures. For adolescent caregivers, five items were removed due to not loading onto a factor, three items were removed for cross-loading onto two factors, and two additional items were removed due to high uniqueness values. For adolescent close friend(s), one item was removed due to its high uniqueness value, another was removed because it did not load onto a factor (outside the general factor), and the third item was removed due to cross-loading on multiple factors. For adolescent positive role model(s), five items were removed due to high uniqueness values and an additional three were removed for cross-loading onto more than one factor (see Figure 12 for a flowchart of item reduction and Supplement B for a list of removed items).
Interim Summary
In Study 1, we tested the structure of the POS-DEV scale, including the existence of a general POS-DEV factor, and reduced the number of items included in the POS-DEV scale for each social figure and developmental time period. Following item reduction, 32 items remained for childhood caregiver, 16 for childhood close friend(s), and 13 for childhood positive role model(s), for a total of 61 items for the childhood developmental window. In addition, 27 items remained for adolescent caregivers, 16 for adolescent close friend(s), and 14 for adolescent positive role model(s), for a total of 57 items for the adolescent developmental window. While a substantial number of items were removed during this first EFA, participant burden remained a concern as the length of the questionnaire was still considerably long. To further reduce items so that the most robust and generalizable questions remained for capturing positive early experiences, a second EFA was run with a second sample of participants on the newly reduced POS-DEV scale.
Study 2: Exploratory Factor Analysis 2
Method
Participants
An independent sample of 319 English-speaking adult Prolific workers from the United States took part in Study 2 on the online survey platform Qualtrics (Table 1). Sample size was determined as in Study 1 with the reduced items after EFA 1. Of these, three participants were removed prior to exploratory factor analysis for not completing any portion of the study. The following are the final sample sizes for each social figure and time window: 316 for caregivers in childhood, 309 for caregivers in adolescence, 280 for friends in childhood, 267 for friends in adolescence, 264 for adult role model in childhood, and 217 for adult role model in adolescence.
Materials and Procedure
The purpose of Study 2 was to perform a second exploratory factor analysis (EFA) and further reduce items following the initial EFA in Study 1. Participants were directed to the Qualtrics online survey tool to complete the 118-item POS-DEV scale as part of a larger questionnaire battery (61 items for childhood window and 57 items for adolescent window). Study 2 took an average of 92 min to complete.
Analysis Plan
The same EFA steps as in Study 1 were carried out for the second EFA on the now item-reduced questionnaire. However, additional item removal criteria were introduced, such that items were removed if they loaded onto a different factor than they did in the Study 1 EFA and/or if an item had a factor loading of less than 0.3 on both Study 1 and Study 2. Further, if fewer than three items remained for a single factor, these items were removed and the model was then run with a two-factor solution with an oblique rotation and no Schmid–Leiman transformation for additional item reduction steps. Stricter criteria were introduced in the second EFA to ensure that all items that remained were the best representations of each of the dimensions and would generalize highly across samples. Otherwise, all other tests of bifactor model fit and item reduction were consistent between the two samples.
Results
POS-DEV: Childhood
For the caregiver social figure within the childhood window, a McDonald coefficient omega test using the proposed three-factor structure suggested the presence of a general factor, providing evidence that each model is bifactor (ωh = 0.89). However, for the other two social figures, after reducing items on the proposed three-factor structure, only two items were maintained on the Predictability factor for close friend(s) and only one item was maintained on the Predictability factor for positive role model(s). Therefore, we concluded that this factor was not robust, and we removed the remaining items on this factor for both social figures. However, running a Schmid–Leiman factor analysis solution with only two factors led to an underdefined model. As a result, we proceeded without a bifactor model. For this reason, we completed the item reduction procedure using an oblique factor rotation with two factors and no general factor (i.e., no Schmid–Leiman transformation) for close friend(s) and positive role model(s). With our updated item removal procedure for Study 2 (i.e., additional criteria of removing any items with <0.3 loadings on both studies and items that loaded onto a different factor across studies), 29 items were removed from the initial 61 items across all social figures for the childhood window. For childhood caregivers, seven items were removed due to loading onto their respective factors by <0.3 across both studies, an additional eight items were removed because they did not load onto a factor, three items were removed because they loaded onto different factors than in Study 1, and one item was removed due to its high uniqueness value. For childhood close friend(s), three items were removed for cross-loading onto two factors and the other two items were removed due to being the only remaining items on the Predictability factor. For childhood positive role model(s), three items were removed due to cross-loading onto two factors, one item was removed for having a loading of <0.3 across both studies, and the final item was removed for being the only remaining item on the Predictability factor (see Figure 12 for a flowchart of item reduction and Supplement A for a list of removed items).
POS-DEV: Adolescence
For the caregiver social figure within the adolescent window, a McDonald coefficient omega test using the proposed three-factor structure suggested the presence of a general factor, providing evidence that each model is bifactor (ωh = 0.85). However, similar to the childhood window, after reducing items on the proposed three-factor structure for the other two social figures, only two items were maintained on the Predictability factor for close friend(s) and only one item was maintained on the Predictability factor for positive role model(s). As a result, we once again proceeded without a bifactor model for these social figures and completed the item reduction procedure using an oblique factor rotation with two factors and no general factor for close friend(s) and positive role model(s). With our updated item removal procedure for Study 2, 24 of the initial 57 items were removed. For adolescent caregiver, four items were removed for not loading onto their respective factors by <0.3 across both studies, one was removed for cross-loading onto two factors, two items were removed for loading onto a different factor than in Study 1, and a final item was removed for its high uniqueness value. For adolescent close friend(s), three items removed were due to not loading onto a factor, one item was removed for having a loading of <0.3 across both studies, one item was removed for cross-loading onto two factors, one item was removed for loading onto a different factor than in Study 1, and the remaining two items were removed because they were the only remaining on the Predictability factor. For adolescent positive role model(s), three items were removed because they did not load onto a factor, two items were removed due to loading onto a different factor than in Study 1, one item was removed because it cross-loaded onto two factors, one item was removed for having a loading of <0.3 across both studies, and the final item was removed because it was the only remaining on the Predictability factor (see Figure 12 for flowchart of item reduction and Supplement B for a list of removed items).
Interim Summary
In Study 2, we further reduced items on the POS-DEV scale to ensure that the most robust, generalizable items remained prior to running the confirmatory factor analysis. Following item reduction, 13 items remained for childhood caregiver, 11 for childhood close friend(s), and 8 for childhood positive role model(s), for a total of 32 items for the childhood developmental window. In addition, 19 items remained for adolescent caregiver, 8 for adolescent close friend(s), and 6 for adolescent positive role model(s), for a total of 33 items for the adolescent developmental window. Further, in the second EFA, we found that a bifactor model was not best suited for close friend(s) and positive role model(s) within both the childhood and adolescent window and therefore completed the item reduction procedure using an oblique factor rotation with two factors and no general factor for these social figures. As a result, the Predictability factor was dropped for close friend(s) and positive role model(s). Meanwhile, the Predictability factor remained for both childhood and adolescent caregiver. The next step was to perform a confirmatory factor analysis (CFA) to evaluate model fit on the newly reduced items of the scale.
Study 3: Confirmatory Factor Analysis
Method
Participants
A total of 289 English-speaking adult Prolific workers from the United States took part in the CFA and construct validity portions of Study 3 on the online survey platform Qualtrics (Table 1). Sample size was determined as before (with 24 items on the longest scale to be validated in the study). An additional 70 Prolific participants completed only the role model items to achieve a sufficient sample size for CFA. The following are the final sample sizes for each social figure and time window: 289 for childhood caregivers, 289 for adolescent caregivers, 253 for childhood friends, 244 for adolescent friends, 293 for childhood role model, and 254 for adolescent role model.
Materials and Procedure
The purpose of Study 3 was to perform a confirmatory factor analysis on the 65-item POS-DEV scale (32 items for childhood window and 33 items for adolescent window) and to assess construct validity against validated scales measuring positive and adverse early experiences. Participants were directed to the Qualtrics online survey tool to complete the 65-item POS-DEV scale alongside a larger survey battery that was used for construct validity. These surveys included retrospective reports of the Benevolent Childhood Experiences Scale (BCEs; Narayan et al., 2018), the Positive Childhood Experiences Scale (PCEs; Bethell et al., 2019), the McGill Friendship Questionnaire (MFQ; Mendelson & Aboud, 1999), the Confusion, Hubbub, and Order Scale (CHAOS; Matheny et al., 1995), Questionnaire of Unpredictability in Childhood (QUIC; Glynn et al., 2019), and the Deprivation and Threat—Adult Self-report (DT-AS; Tsai et al., 2025). All items were presented in the past tense to elicit recall from these developmental windows. Study 3 took an average of 50 min to complete.
Analysis Plan
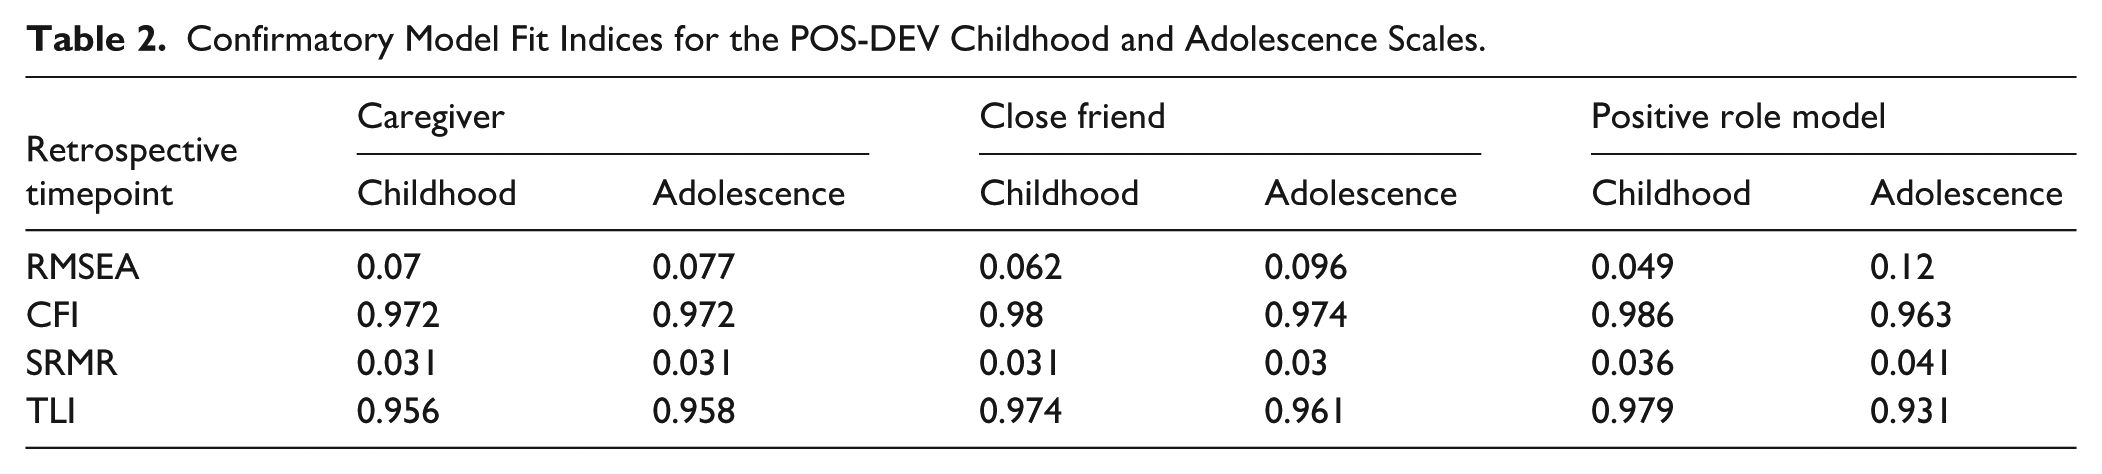
Confirmatory factor analysis (CFA) on the POS-DEV scale was performed using the cfa function within the lavaan 0.6.15 package (Rosseel, 2012) in R version 4.2.1 (2022-06-23) for each social figure and developmental time period separately. The confirmatory fit of the model to the data was tested using the following statistical tests: Root Mean Square Error of Approximation (RMSEA), Bentler’s comparative fit index (CFI), standardized root mean square residual (SRMR), and Tucker–Lewis Index (TLI). Stringent thresholds from Hu and Bentler (1999) were used to determine model fit (“a cutoff value close to 0.06 for RMSEA,” “close to 0.95 for CFI,” “close to 0.08 for SRMR,” and “close to 0.95 for TLI”). The general score and factors were set to be uncorrelated (in the case where there was a general score; otherwise, this step is not necessary), while residual variances of factors were indicated as 1 (determined as best for bifactor models by Chen et al., 2006). Items were removed at this stage only if they had a negative variance estimate. One item was removed from the Childhood Caregiver scale and six items were removed from the Adolescent Caregiver scale for meeting this criteria. The CFA was then rerun without this item and model fit was re-assessed.
A second set of goals of Study 3 were to assess the internal consistency and construct validity of the POS-DEV scale. The internal consistency of items within each dimension per social figure in the two developmental time periods was calculated using Cronbach’s alpha (Cronbach, 1951). Construct validity was assessed via correlations between POS-DEV subscales or total score and existing positive experience questionnaires. Dimensions of the POS-DEV scale were correlated with retrospective reports of positive early experiences via the BCE, PCE, MFQ scales and retrospective reports of adverse early experiences via the CHAOS, QUIC, and deprivation and threat scales. Bivariate correlations for associations between scales were assessed using the cor.test function within the stats 4.2.1 package in R. Post hoc corrections for multiple comparisons were applied for bivariate correlations using the Holm–Bonferroni method. Effect sizes for correlations were evaluated based on thresholds set by Cohen (1988), specifically small: r = .10, medium: r = .30, and large: r = .50.
Results
Confirmatory Factor Analysis
POS-DEV: Caregiver in Childhood
Confirmatory factor analysis (CFA) supported a bifactor model with three factors in addition to a general factor. Statistical tests revealed a relatively good fit of the model to the data based on Hu and Bentler (1999) thresholds (see Table 2 for model fit indices). A total of 12 items were included for assessing experiences with the caregiver during childhood (Figure 2). The first factor measured experiences of safety/comfortability around and emotional support from caregivers in childhood (e.g., “I felt safe sharing my feelings and problems with my caregiver(s).”). For this reason, we named this factor “Safety.” The second factor included items indexing the degree to which participants were encouraged to engage in cognitively enriching activities (e.g., “My caregiver(s) encouraged me to read and/or instilled an enjoyment of reading in me.”). We named this factor “Opportunity.” The third factor included items which measured the extent to which caregivers followed a consistent routine and/or habits (e.g., “I typically knew which caregiver(s) would care for me at any time.”) We thus named this factor “Predictability.”
Confirmatory Model Fit Indices for the POS-DEV Childhood and Adolescence Scales.
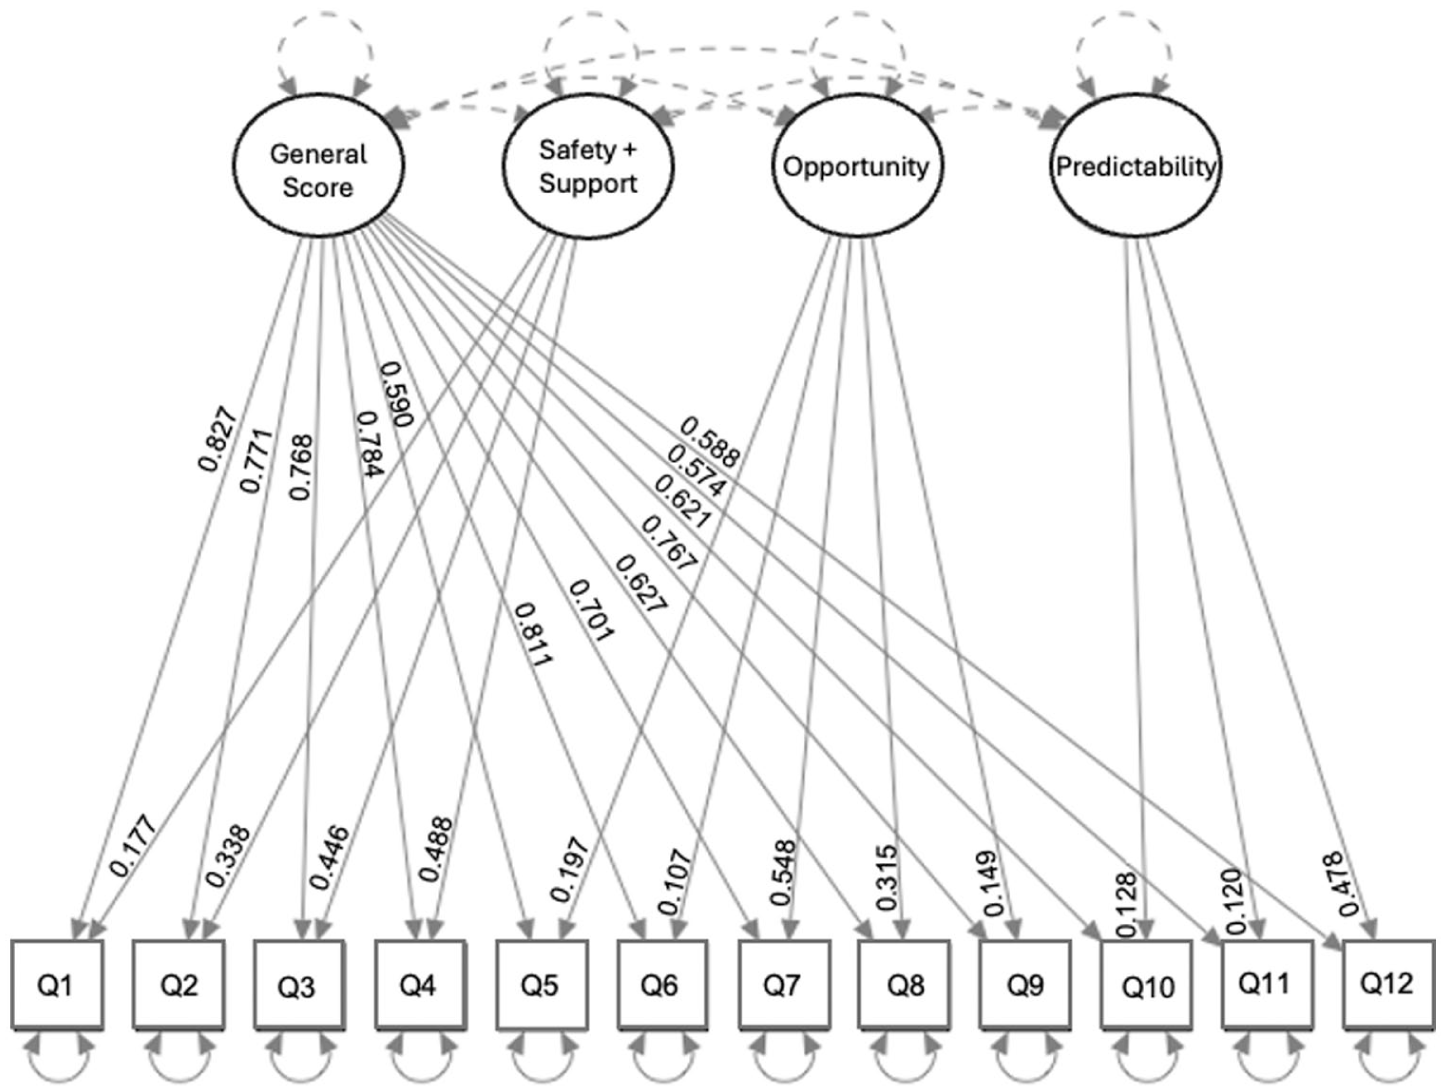
Factor analysis of the POS-DEV scale for experiences with a caregiver in childhood. Straight lines indicate item loadings onto both the general score and their respective factor. Dotted lines indicate restrictions applied to the confirmatory factor analysis model: residual variances (shown with curved lines) of factors were set to 1, and factors were set to be uncorrelated (shown with lines in between factors; Chen et al., 2006). Loadings are derived from the CFA.
POS-DEV: Caregiver in Adolescence
CFA confirmed a bifactor model with three factors in addition to a general factor. Statistical tests revealed a relatively good fit of the model to the data (see Table 2 for model fit indices). A total of 13 items were included for assessing experiences with the caregiver during adolescence (Figure 3). The first factor measured the degree to which participants’ caregivers encouraged them to engage in cognitively stimulating activities, which we labeled “Opportunity” as for the Childhood scale. The next factor was akin to the third factor of the Childhood Caregiver scale, measuring “Predictability.” The final factor again measured the amount of emotional support and security participants felt from their caregivers during adolescence, which we labeled “Safety.”
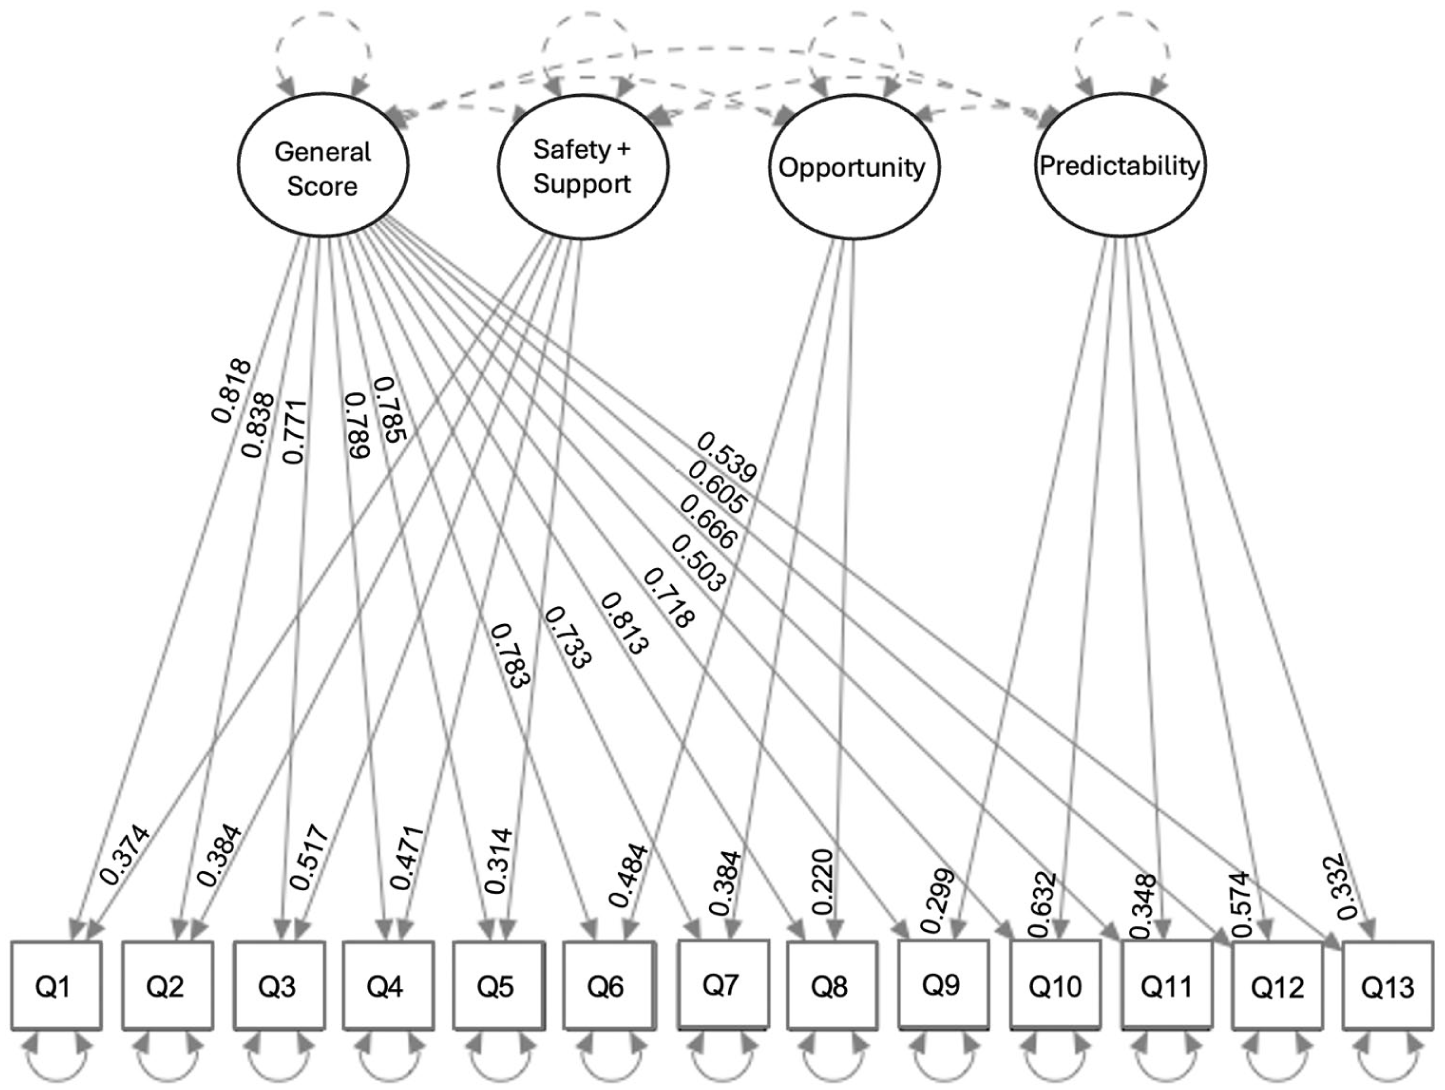
Factor analysis of the POS-DEV scale for experiences with a caregiver in adolescence. Straight lines indicate item loadings onto both the general score and their respective factor. Dotted lines indicate restrictions applied to the confirmatory factor analysis model: residual variances (shown with curved lines) of factors were set to 1, and factors were set to be uncorrelated (shown with lines in between factors; Chen et al., 2006). Loadings are derived from the CFA.
POS-DEV: Close Friend(s) in Childhood
The CFA confirmed a model with two factors and no general factor. Statistical tests revealed a relatively good fit of the model to the data (see Table 2 for model fit indices). A total of 11 items were included for assessing experiences with friends during childhood (Figure 4). The first factor indexed how comfortable participants felt with their close friend(s) (e.g., “I felt safe with my close friend(s).”). We thus labeled this factor “Safety.” The second factor measured how close a connection participants felt to their friend(s) (e.g., “I could tell my close friend(s) anything on my mind.”). As a result, we labeled this factor “Opportunity” to reflect the socio-emotional enrichment opportunities provided by close connection (although we note the Caregiver opportunity scores reflect cognitive rather than socio-emotional enrichment).
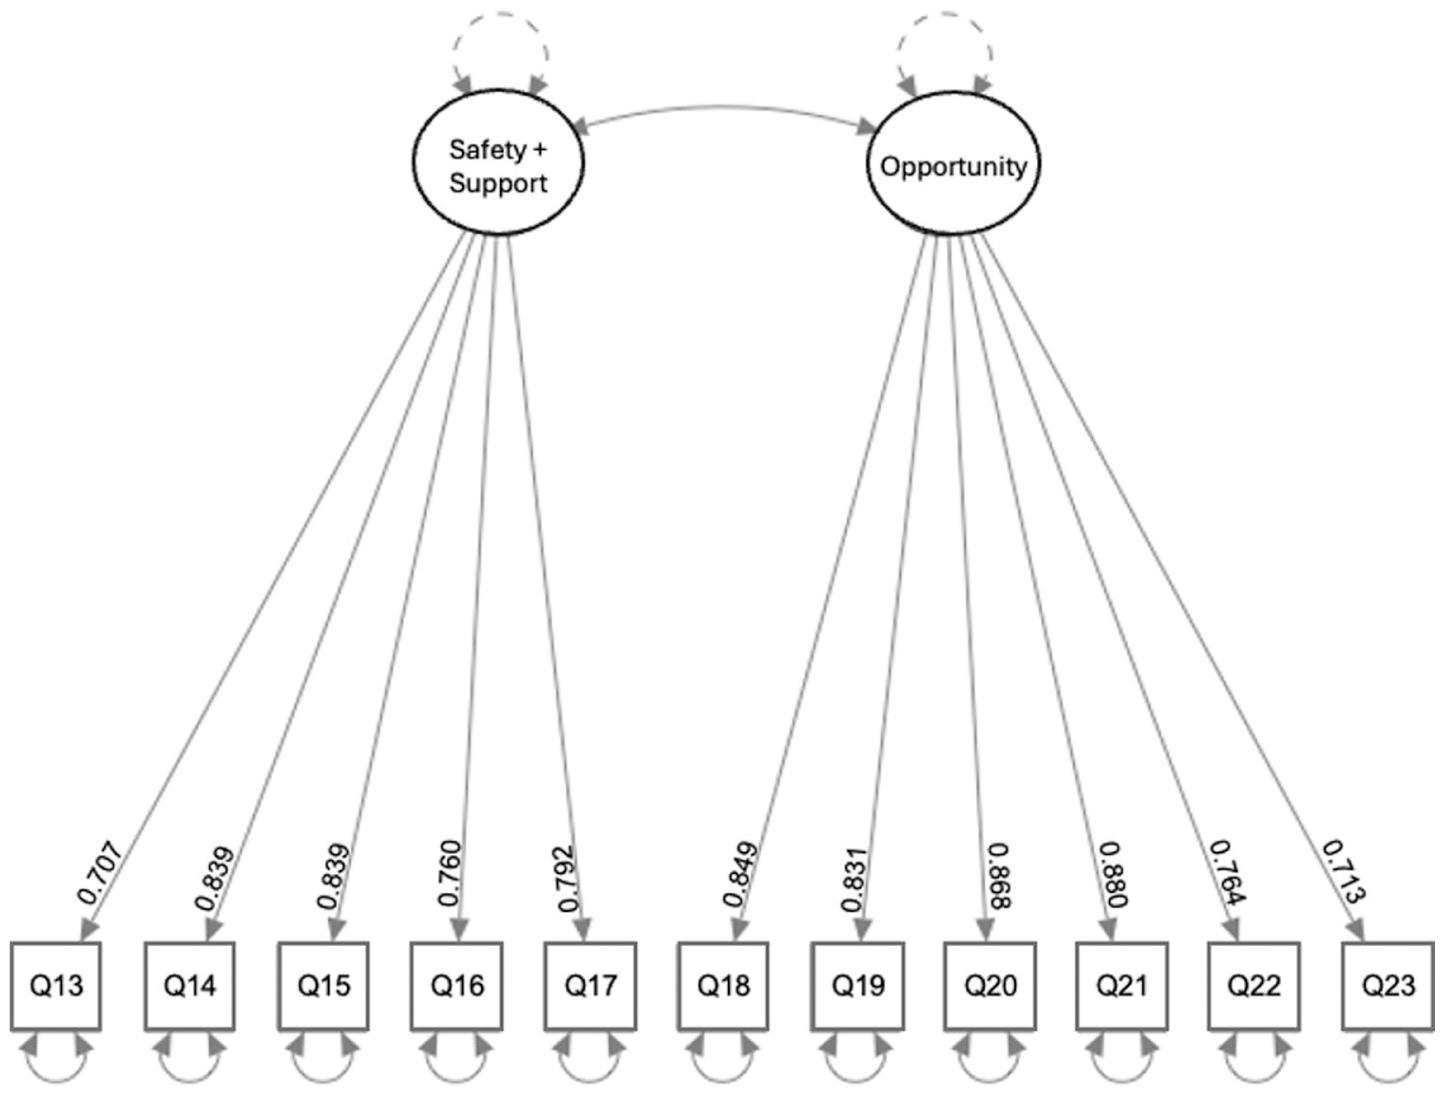
Factor analysis of the POS-DEV scale for experiences with a close friend in childhood. Straight lines indicate item loadings onto their respective factor. Dotted lines indicate restrictions applied to the confirmatory factor analysis model: residual variances (shown with curved lines) of factors were set to 1. Loadings are derived from the CFA.
POS-DEV: Close Friend(s) in Adolescence
CFA confirmed a model with two factors and no general factor. Statistical tests revealed a relatively good fit of the model to the data (Table 2). A total of 8 items were included for assessing experiences with friends during adolescence (Figure 5). The first factor measured the degree to which participants felt comfortable being with their close friend(s) in adolescence (similar to the first factor of the Childhood Close Friend scale). We thus named this factor “Safety.” The second factor, similar to Factor 1 of the Childhood Close Friend scale, included items which measured the degree to which they felt close to their friend(s). We named this factor “Opportunity.”
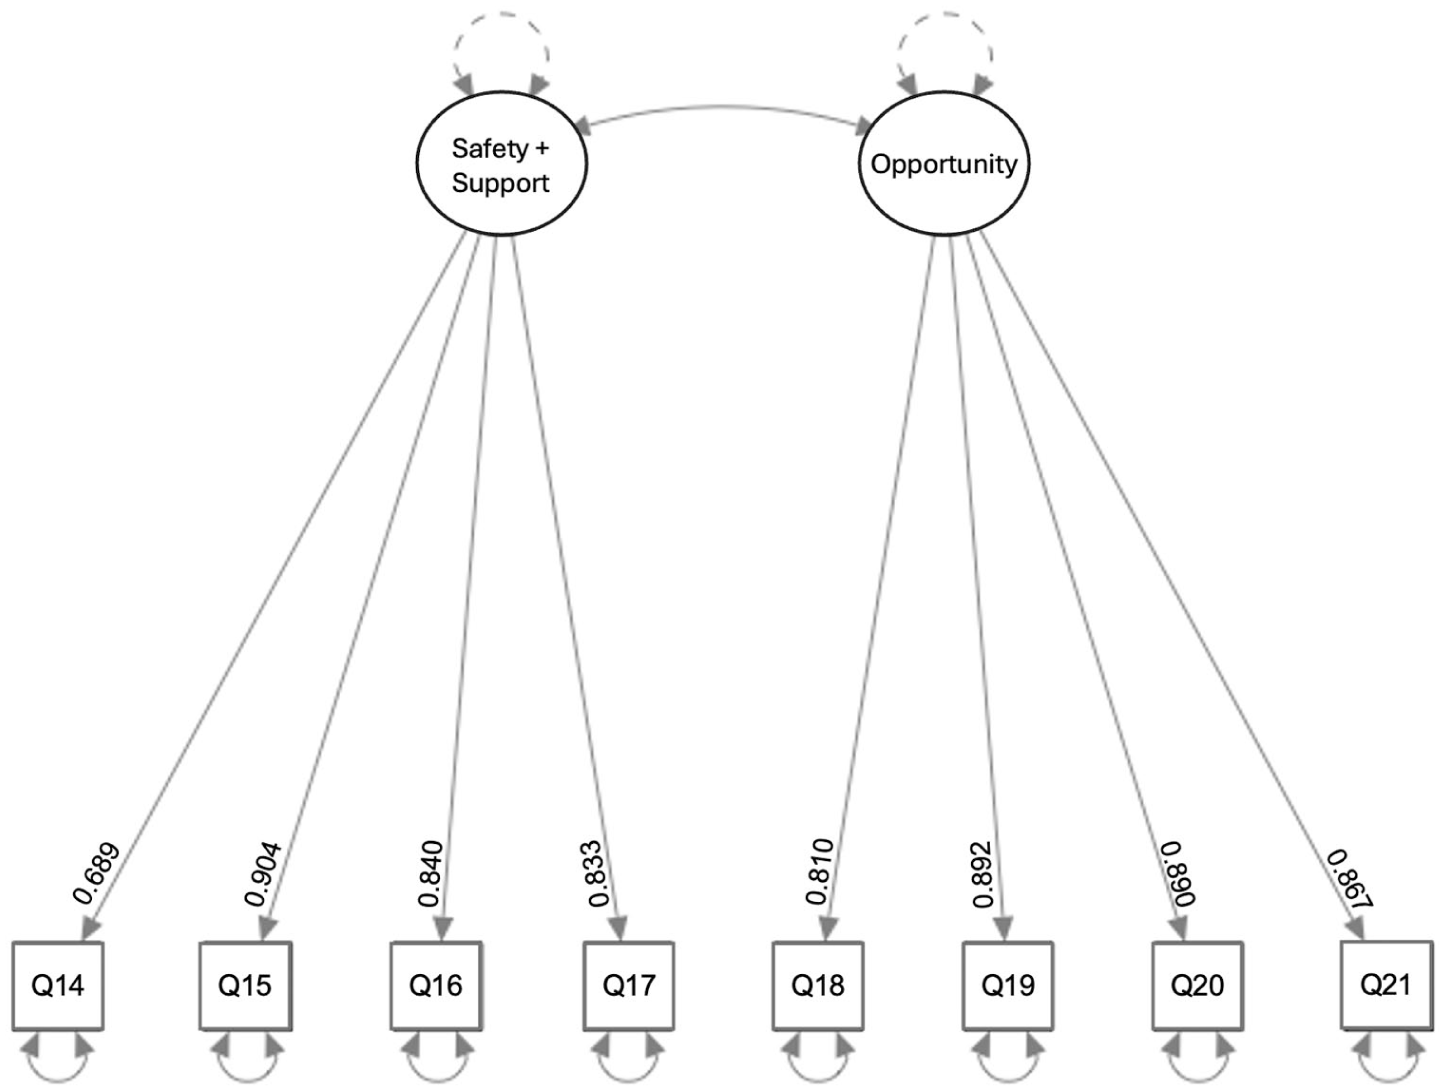
Factor analysis of the POS-DEV scale for experiences with a close friend in adolescence. Straight lines indicate item loadings onto their respective factor. Dotted lines indicate restrictions applied to the confirmatory factor analysis model: residual variances (shown with curved lines) of factors were set to 1. Loadings are derived from the CFA.
POS-DEV: Positive Role Model(s) in Childhood
CFA confirmed a model with two factors and no general factor. Statistical tests revealed a relatively good fit of the model to the data (Table 2). A total of 8 items were included for assessing experiences with positive role models during childhood (Figure 6). Qualitative responses for the endorsed role model during childhood for each individual are depicted in Figure 7. The first factor included items that indexed the degree to which the participant felt supported by and trusted an adult role model (e.g., “I could trust this positive role model.”). We thus labeled this factor “Safety.” The other factor included items which captured the degree to which the participant perceived opportunity to connect closely to this adult role model (e.g., “I was encouraged to talk to this positive role model about anything on my mind.”). We named this construct “Opportunity.”
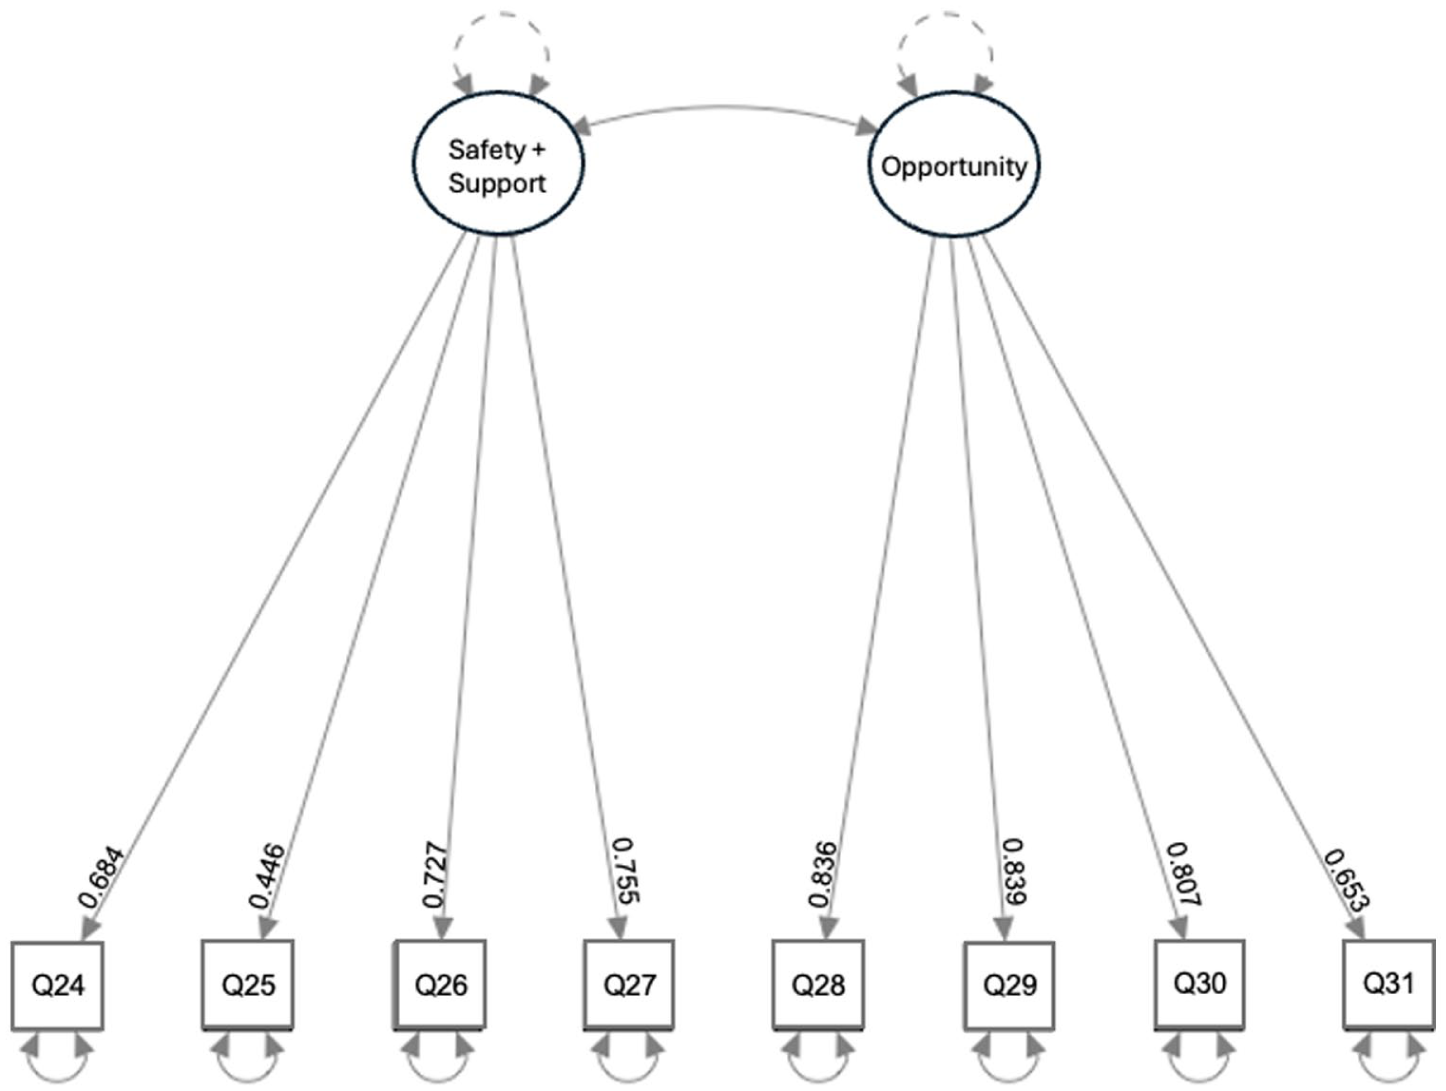
Factor analysis of the POS-DEV scale for experiences with a positive role model in childhood. Straight lines indicate item loadings onto their respective factor. Dotted lines indicate restrictions applied to the confirmatory factor analysis model: residual variances (shown with curved lines) of factors were set to 1. Loadings are derived from the CFA.
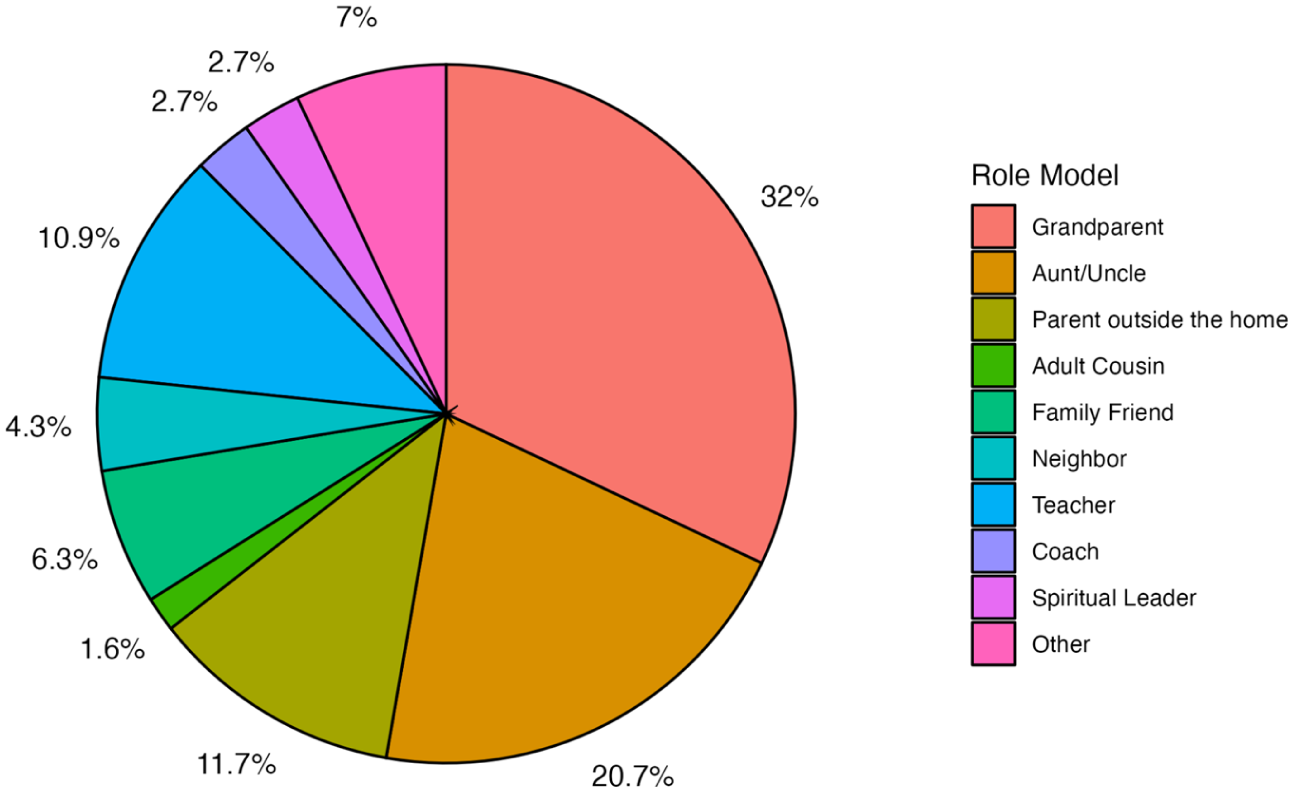
Qualitative responses for the endorsed role model during childhood.
POS-DEV: Positive Role Model(s) in Adolescence
The CFA confirmed a model with two factors and no general factor. Statistical tests revealed a relatively good fit of the model to the data (see Table 2 for model fit indices). A total of 6 items were included for assessing experiences with positive role models during adolescence (Figure 8). Qualitative responses for the endorsed role model during adolescence for each individual are depicted in Figure 9. The first factor, similar to the second factor of the Child Positive Role Model scale, had items that measured the support and security participants felt with this positive role model. As a result, we named this factor “Safety.” The other factor measured how comfortable the participant felt relying on this positive role model for emotional support. We thus named this factor “Opportunity.”
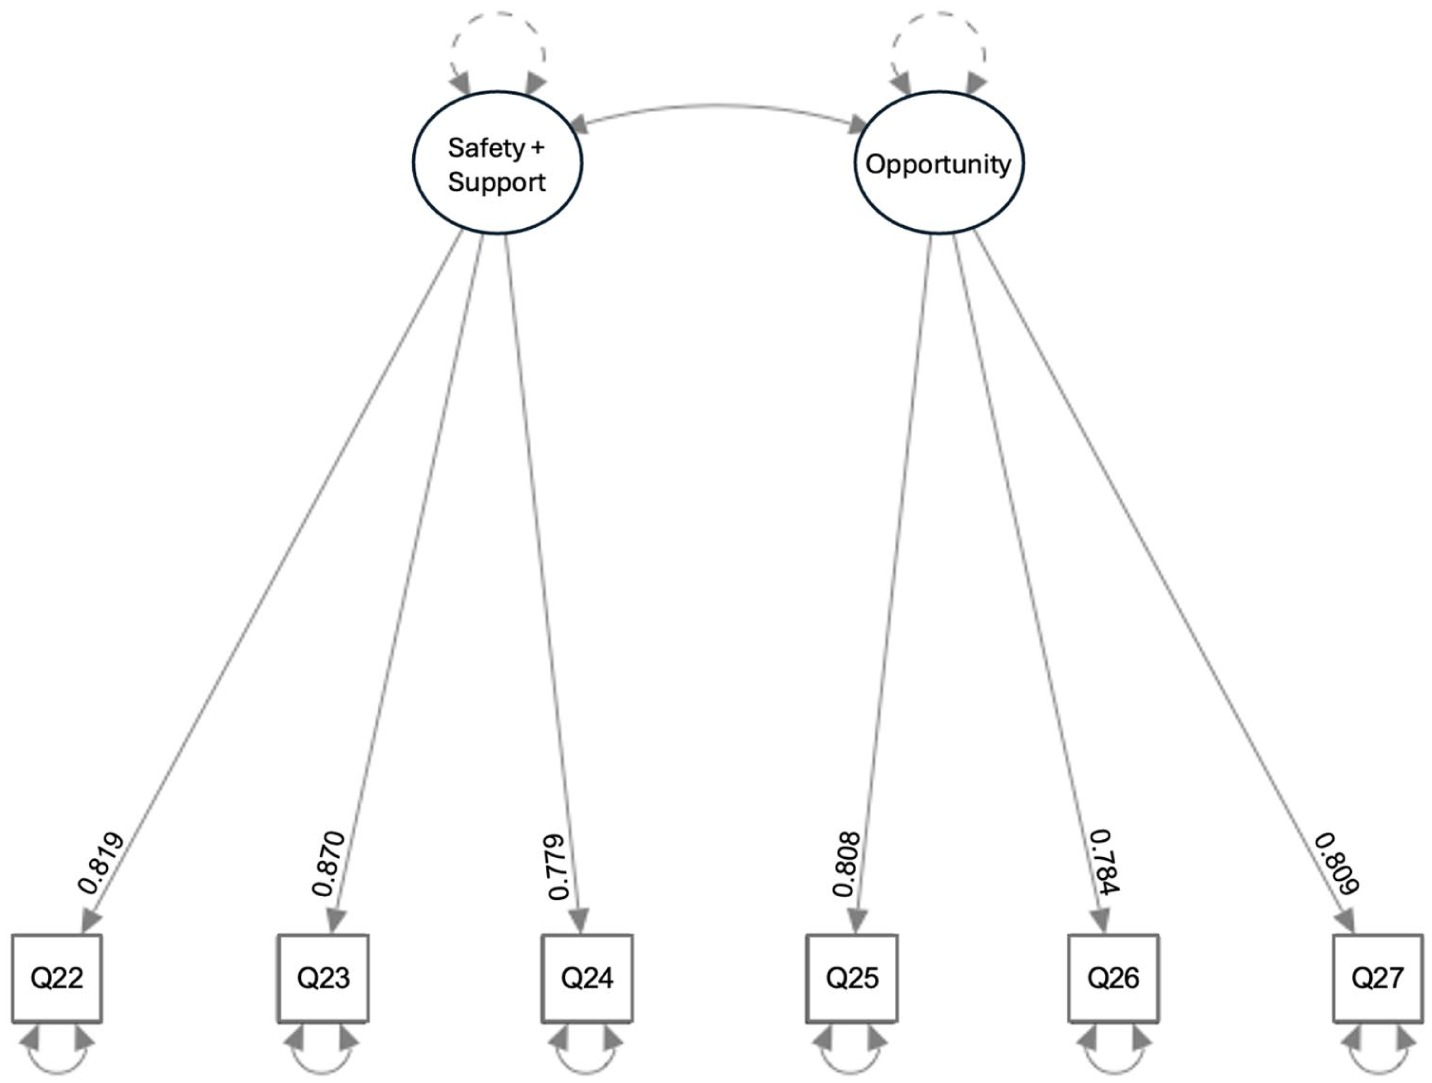
Factor analysis of the POS-DEV scale for experiences with a positive role model in adolescence. Straight lines indicate item loadings onto their respective factor. Dotted lines indicate restrictions applied to the confirmatory factor analysis model: residual variances (shown with curved lines) of factors were set to 1. Loadings are derived from the CFA.
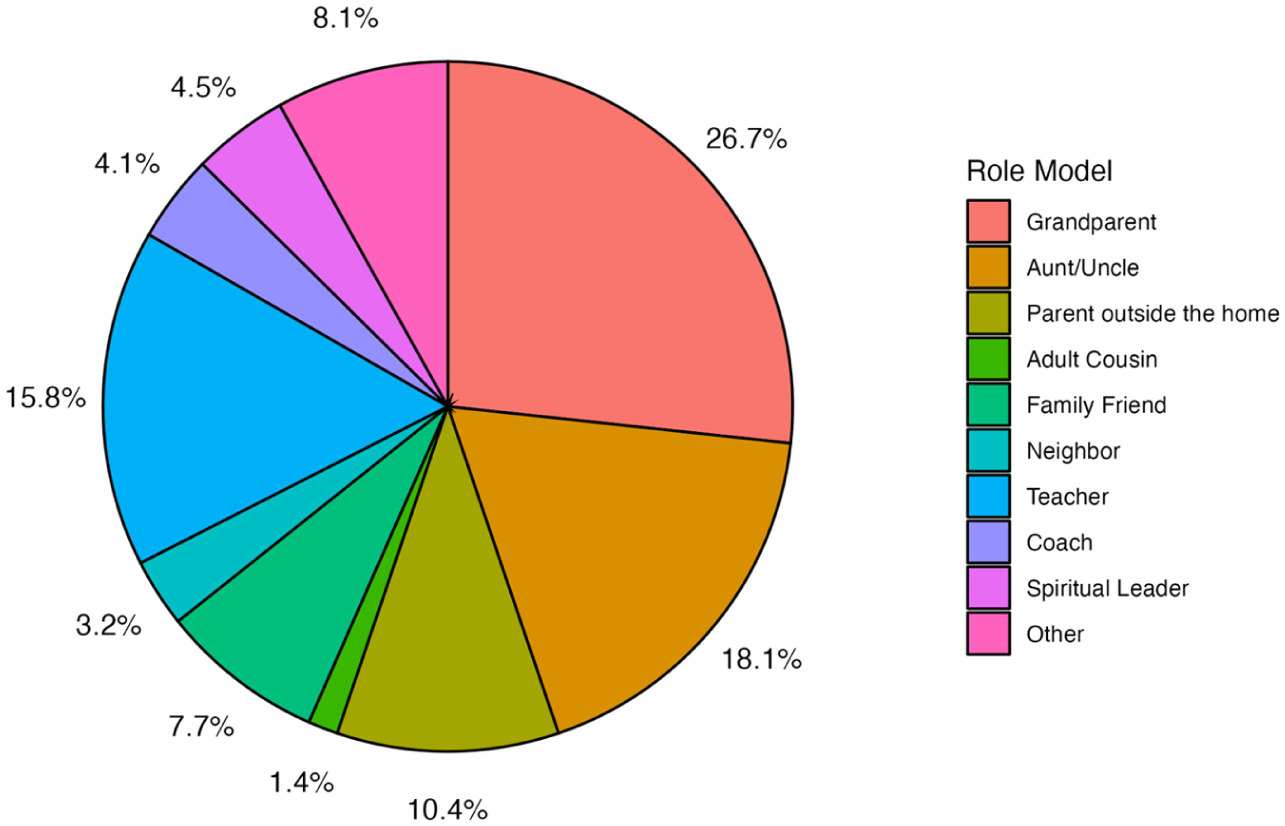
Qualitative responses for the endorsed role model during adolescence.
Internal Consistency of POS-DEV Scale
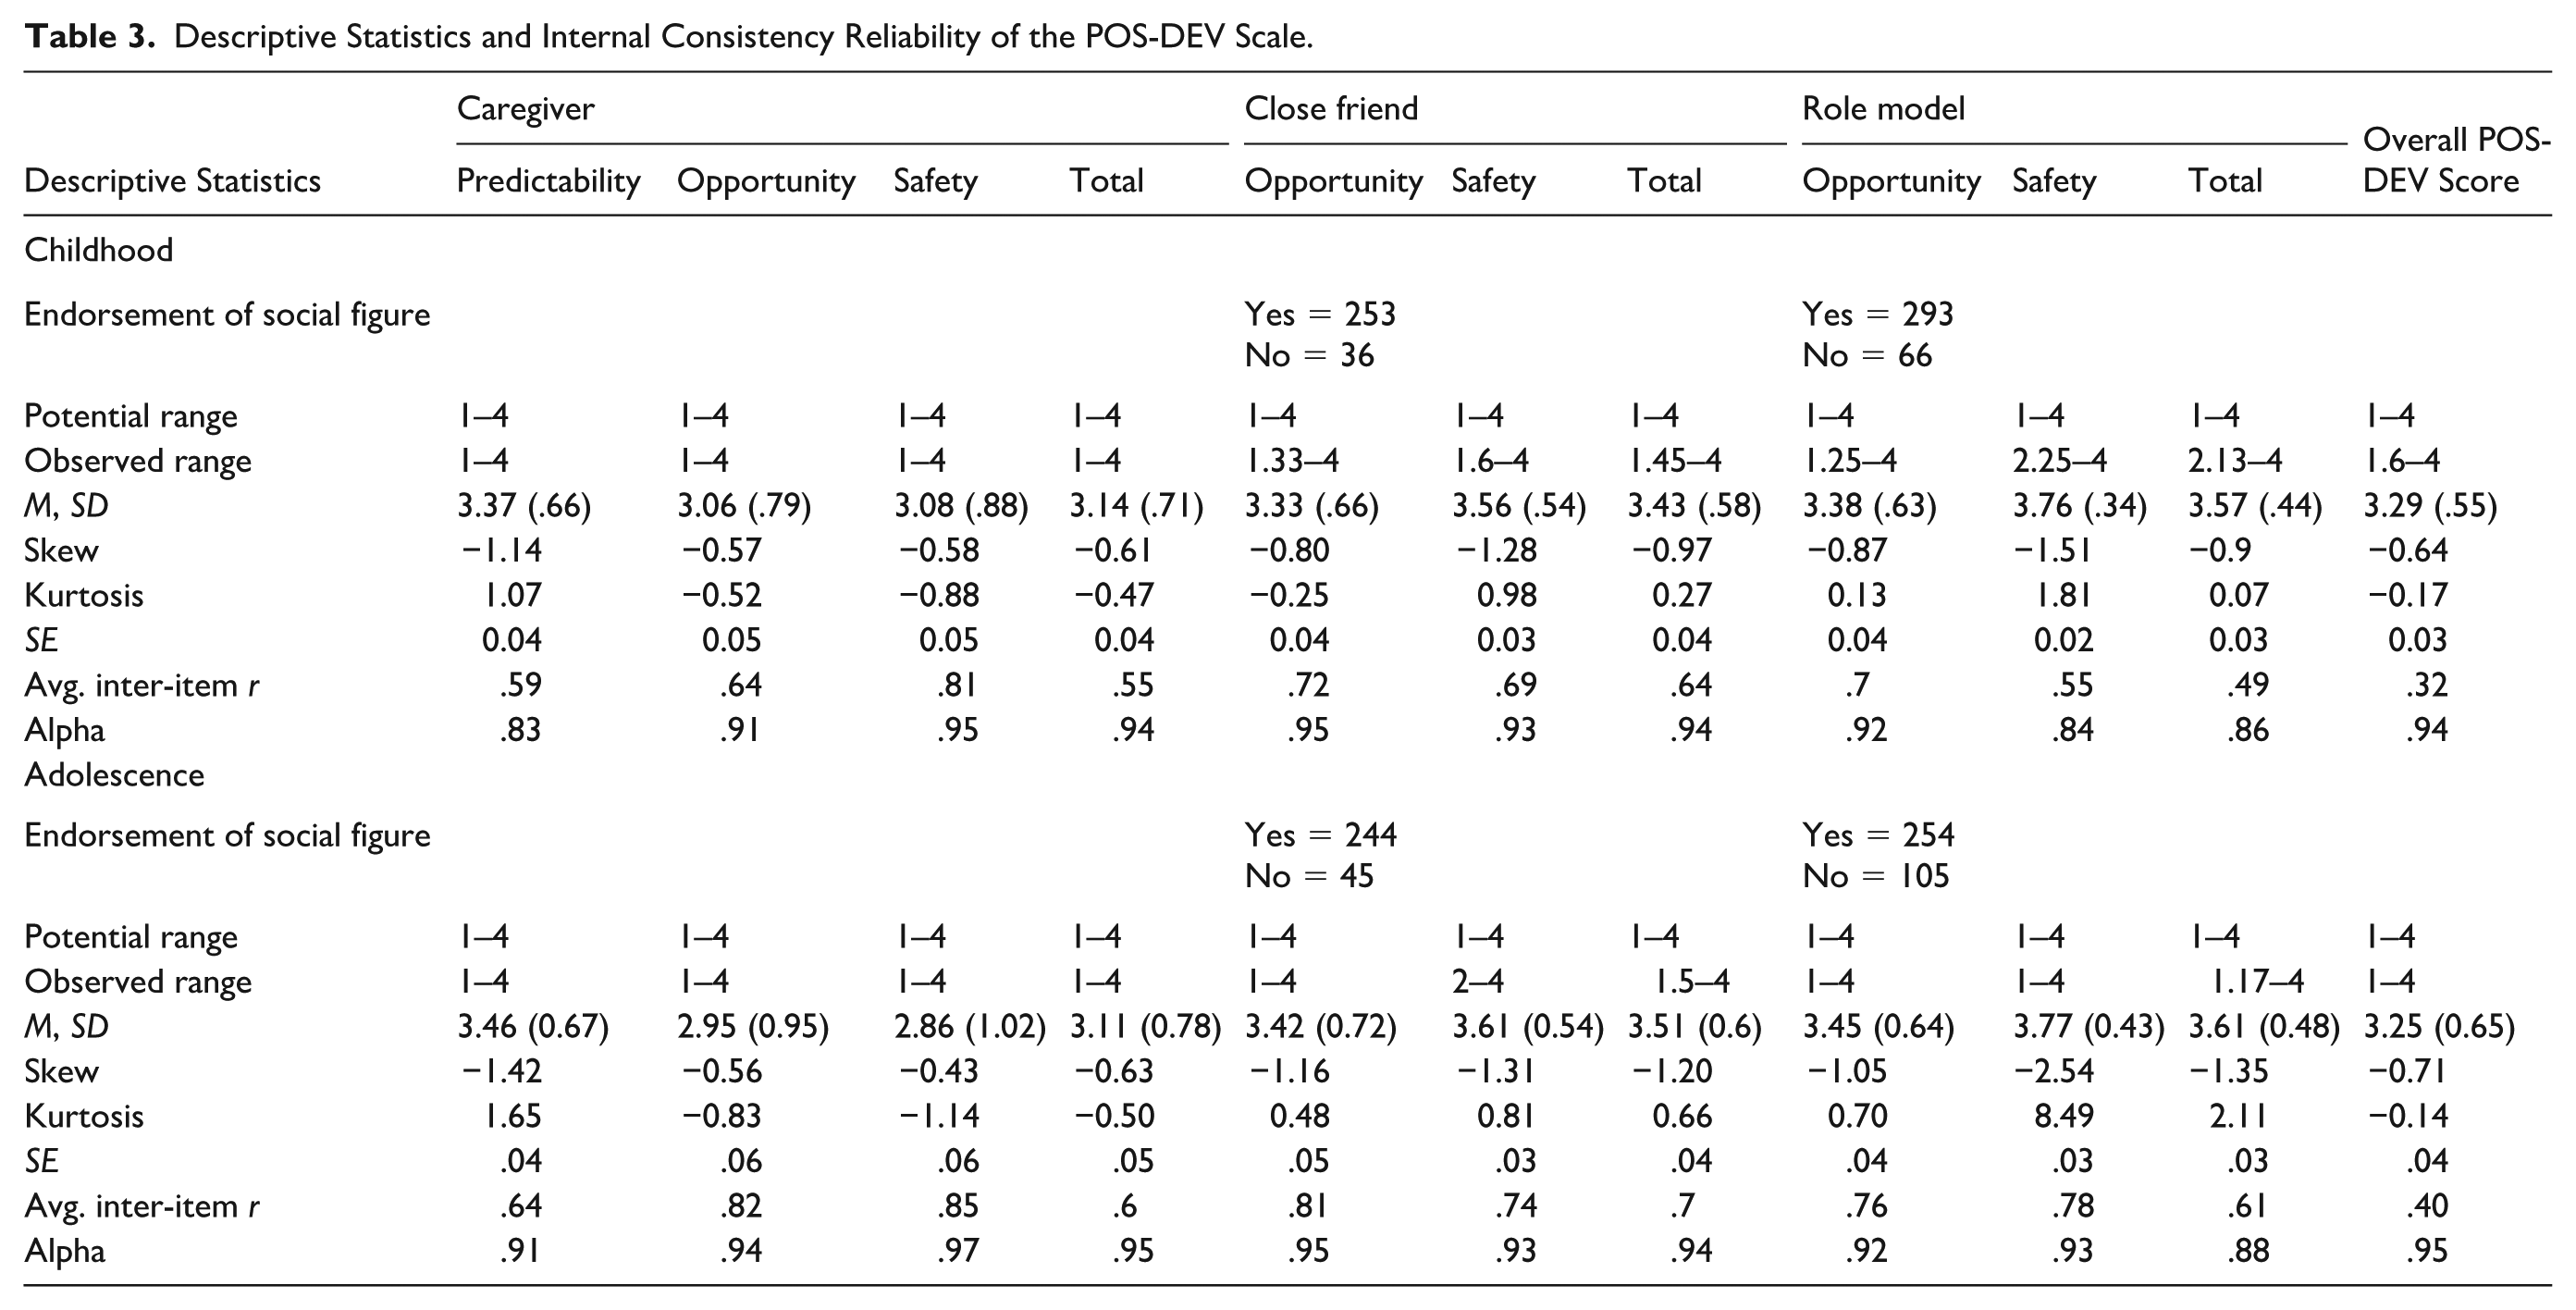
The internal consistency of each dimension’s items for each social figure in each developmental time period was calculated using Cronbach’s alpha (Cronbach, 1951). Internal consistency was excellent across all factors and social figures (range of Cronbach’s alpha: .83.97; Table 3). Additional descriptive statistics can be found in Table 3.
Descriptive Statistics and Internal Consistency Reliability of the POS-DEV Scale.
Construct Validation
The following POS-DEV constructs in childhood were related to existing, validated measures for comparison: overall POS-DEV score, caregiver predictability, caregiver opportunity, caregiver safety, friend opportunity, and friend safety and support. There were no existing measures we could identify relating to positive role model opportunity or safety and support due to the novelty of this assessment. All scales with related extant measures showed significant correlations in the expected direction(s) (all adjusted ps < .001; Table 4, Figure 10). All effect sizes were considered large (r =|.58–.75|), with the exception of the relationship between POS-DEV Caregiver Safety and Support and DT-AS Direct Physical Violence, which demonstrated a medium effect size (r = −.47).
Construct Validity of the POS-DEV Scale Relative to Existing Measurements.
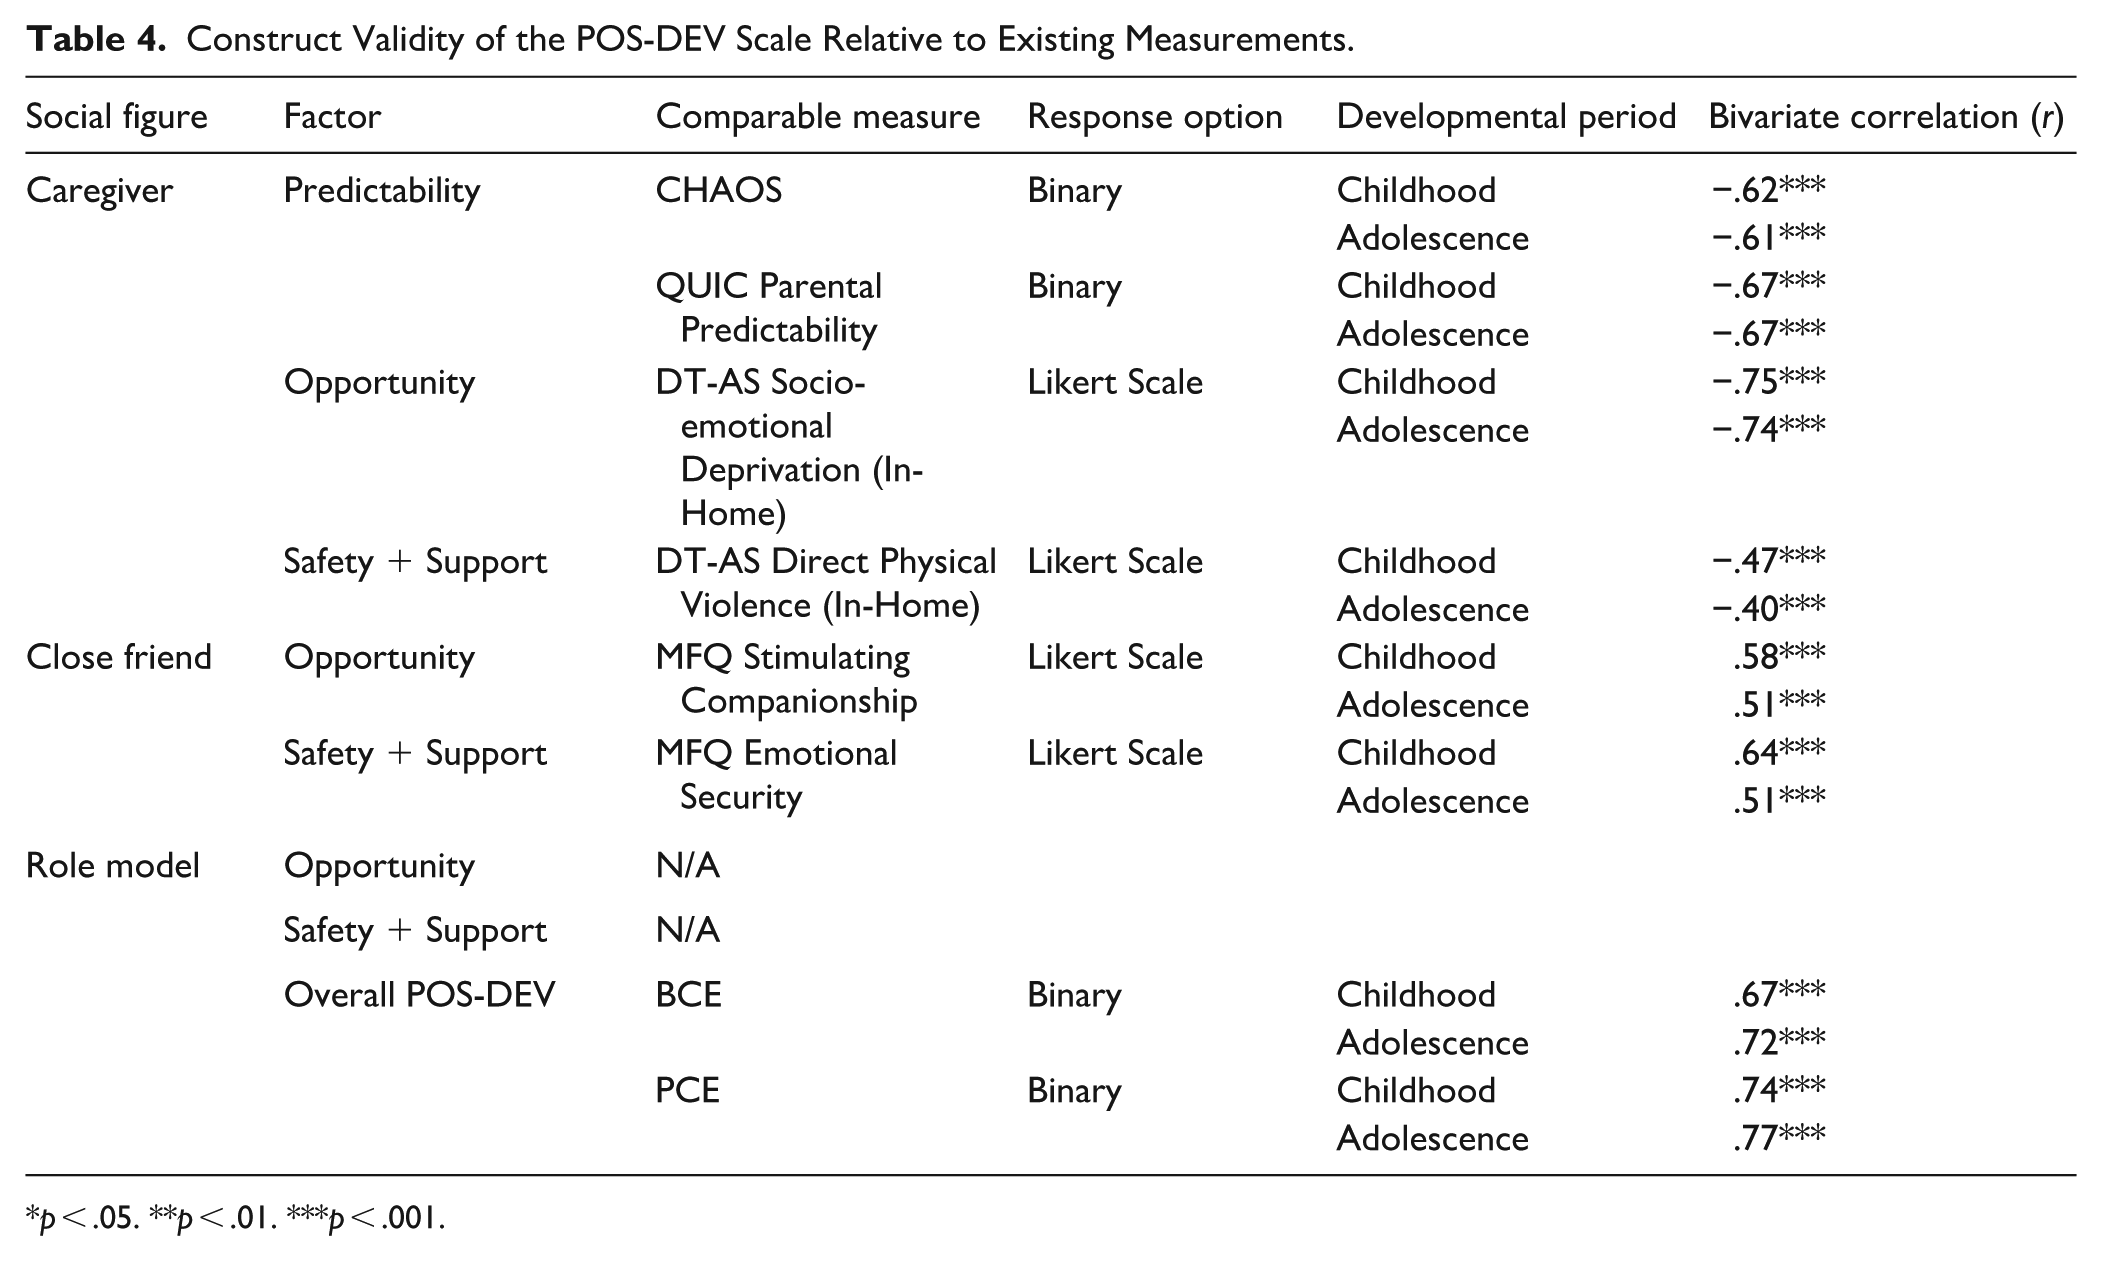
*p < .05. **p < .01. ***p < .001.
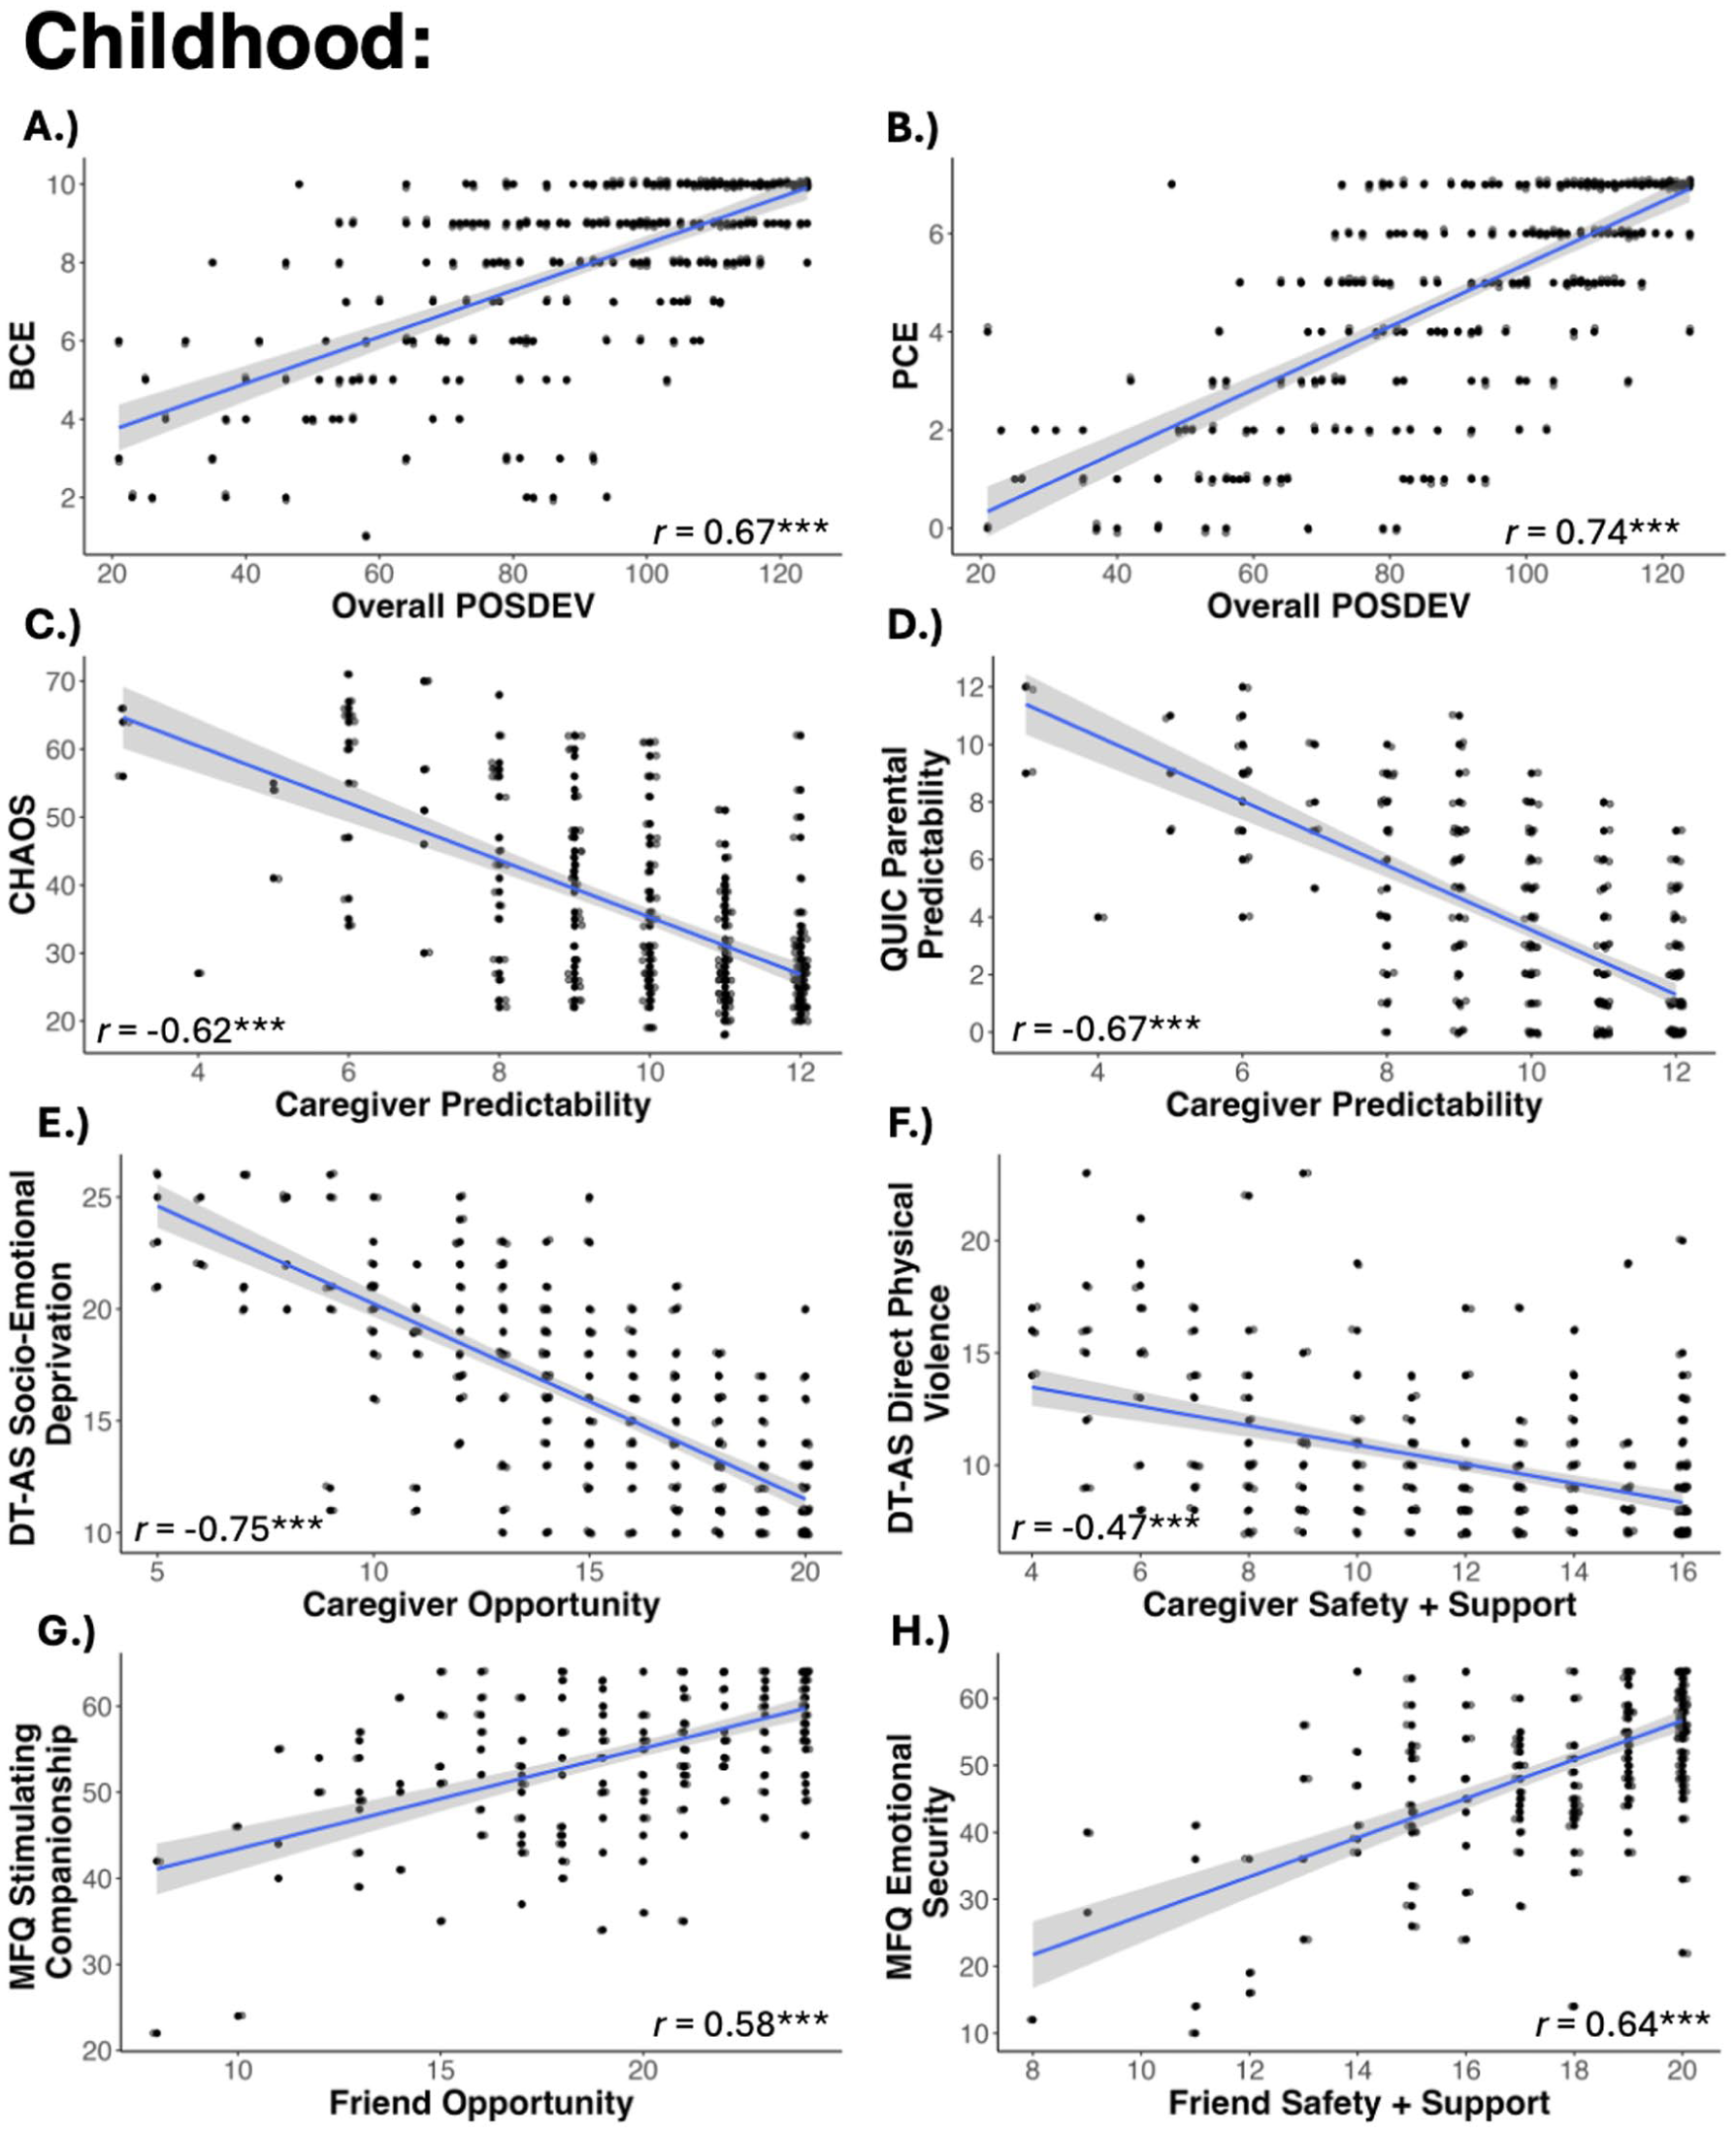
Scatterplot of bivariate correlations relating the following in the childhood window: (A) POS-DEV overall score and the Benevolent Childhood Experiences (BCE) scale. (B) POS-DEV overall score and the Positive Childhood Experiences (PCE) scale. (C) Caregiver predictability and the Confusion, Hubbub, and Order (CHAOS) scale. (D) Caregiver predictability and the Questionnaire of Unpredictability in Childhood (QUIC). (E) Caregiver opportunity and the Deprivation and Threat—Adult Self-report (DT-AS) socio-emotional deprivation subscale. (F) Caregiver safety and support and the Deprivation and Threat—Adult Self-report (DT-AS) direct physical violence subscale. (G) Friend opportunity and the Montreal Friendship Questionnaire (MFQ) stimulating companionship subscale. (H) Friend safety and support and the Montreal Friendship Questionnaire (MFQ) emotional security subscale. Gray shading indicates the 95% confidence interval of the regression line. Holm–Bonferroni adjusted *p < .05, **p < .01, ***p < .001. For all plots, points are slightly jittered for visualization.
The following POS-DEV constructs in adolescence were related to existing, validated measures: overall POS-DEV scores, caregiver predictability, caregiver opportunity, caregiver safety, friend opportunity, and friend safety and support. As before, there were no existing measures relating to positive role model opportunity or safety and support. All scales with related extant measures showed significant correlations in the expected directions (all adjusted ps < .001; Table 4, Figure 11). Effect sizes were large (r =|.50–.77|), with the exception of the relationship between POS-DEV Caregiver Safety and Support and DT-AS Direct Physical Violence, which demonstrated a medium effect size (r = −.40).
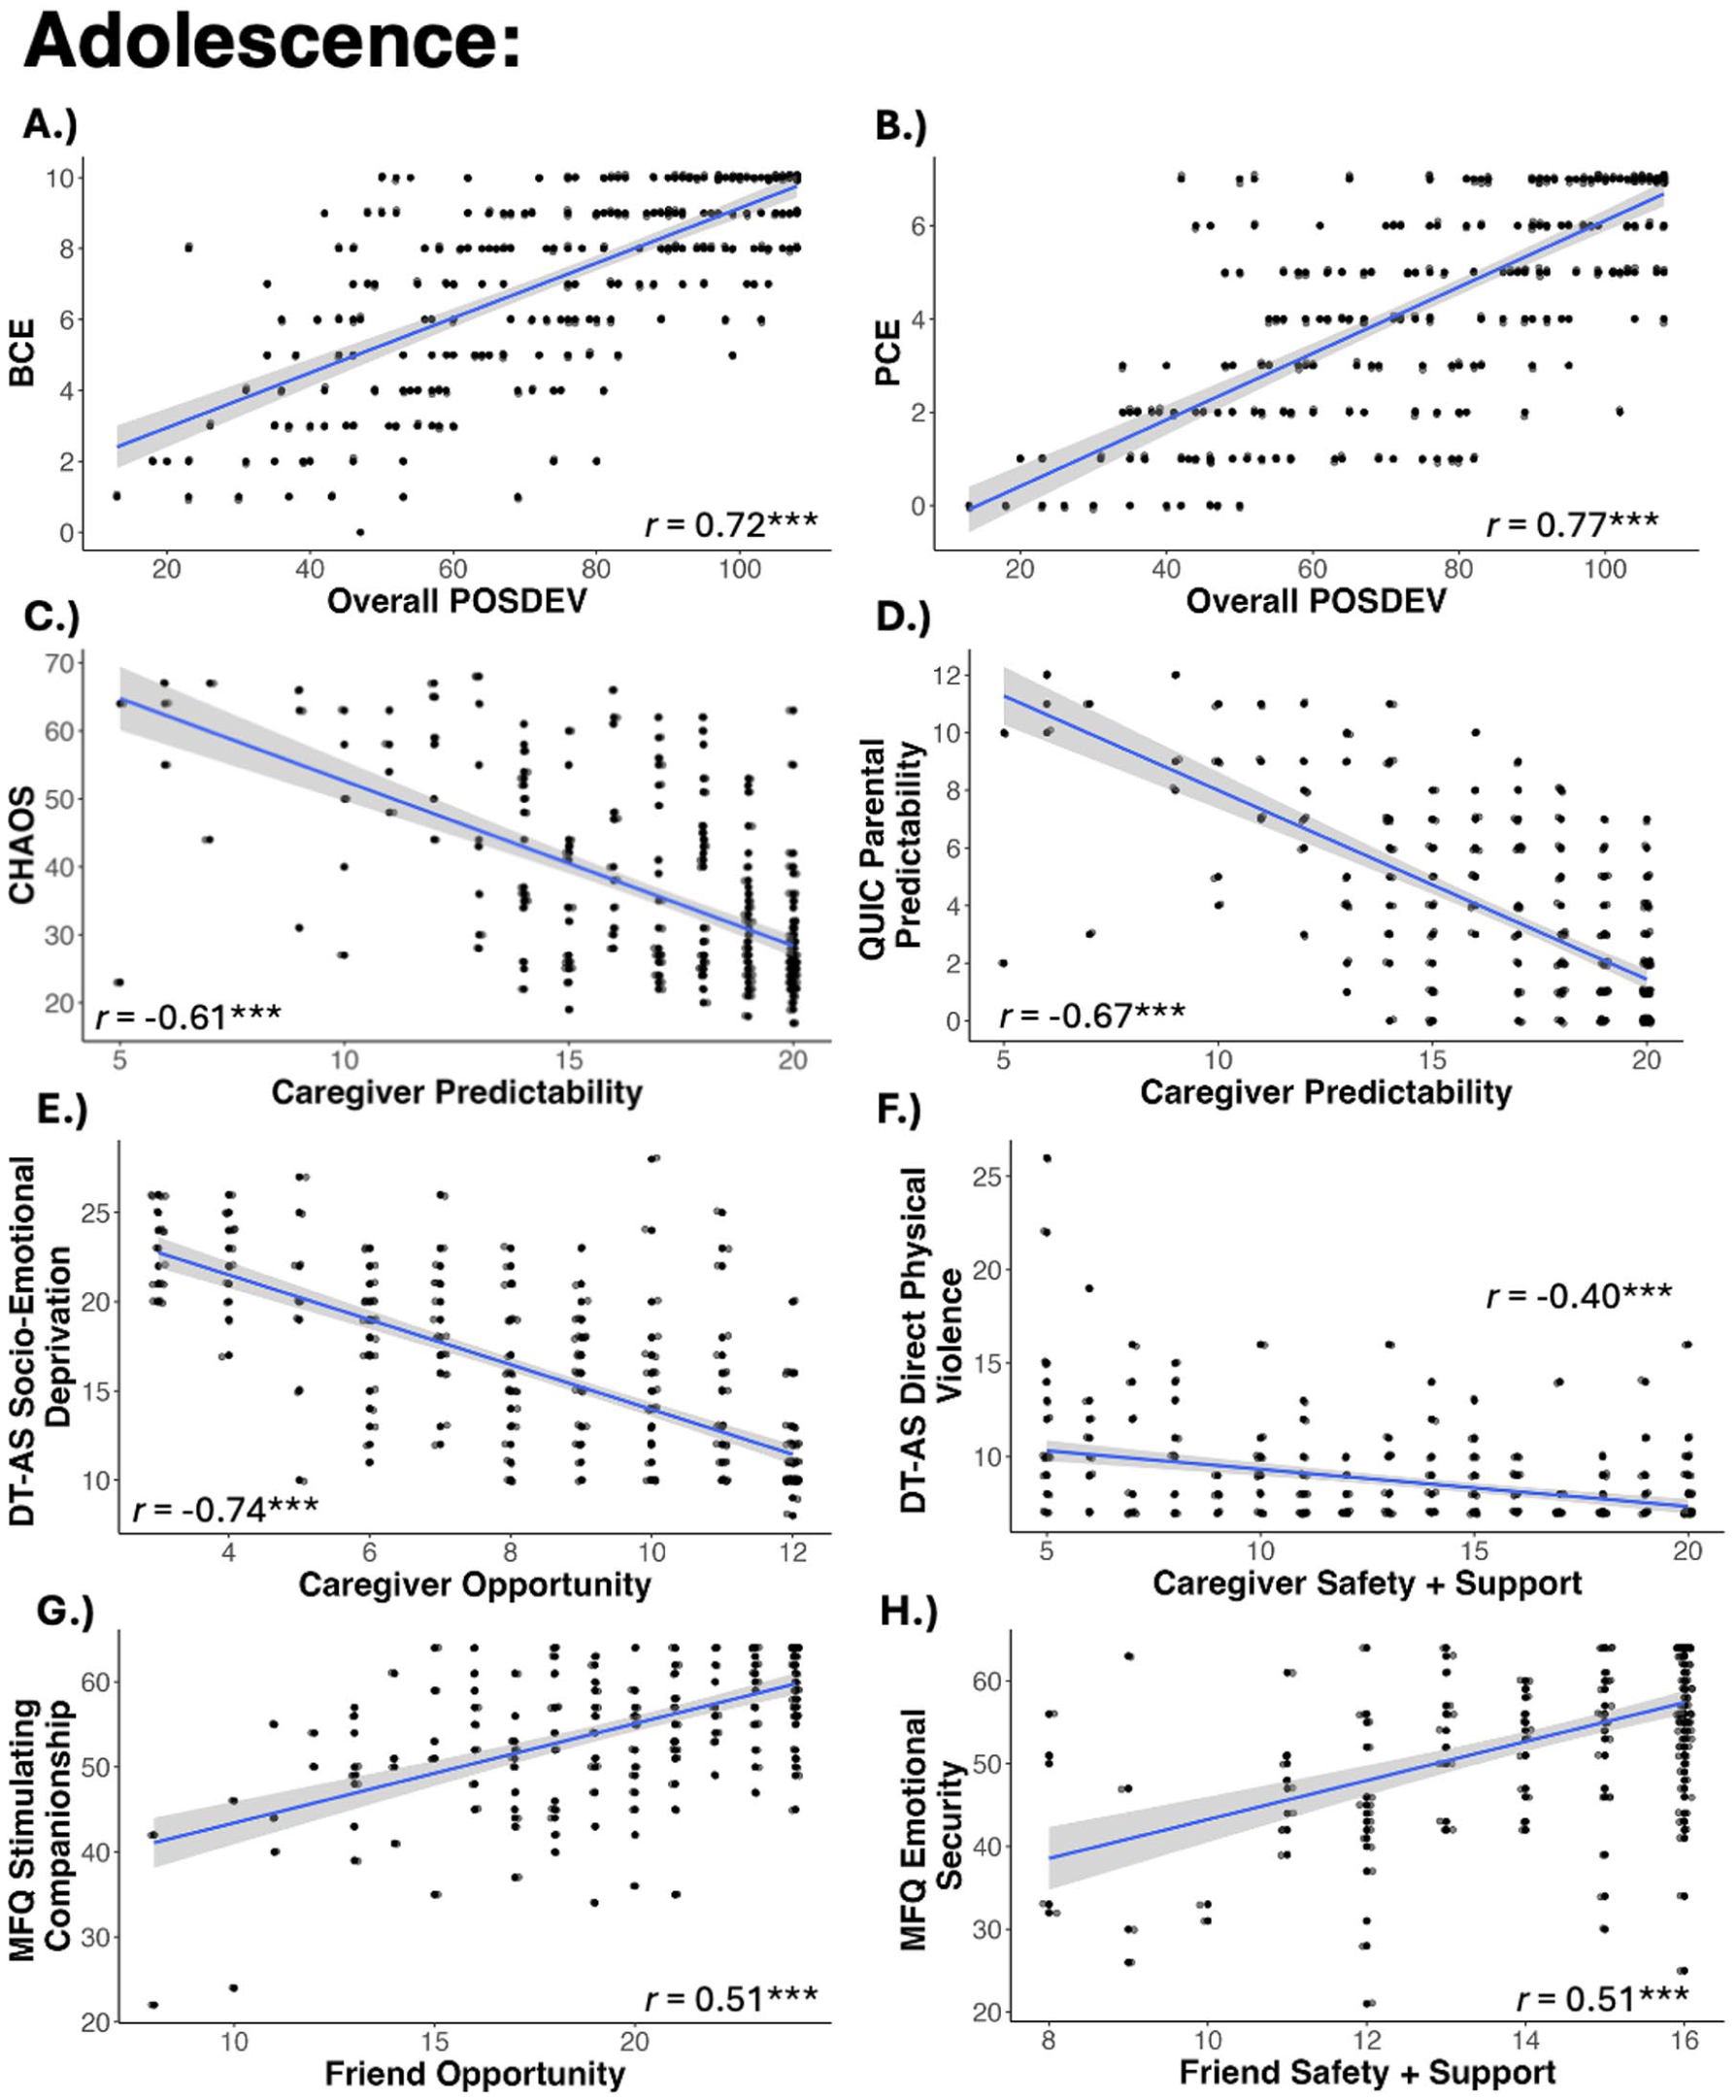
Scatterplot of bivariate correlations relating the following in the adolescent window: (A) POS-DEV overall score and the Benevolent Childhood Experiences (BCE) scale. (B) POS-DEV overall score and the Positive Childhood Experiences (PCE) scale. (C) Caregiver predictability and the Confusion, Hubbub, and Order (CHAOS) scale. (D) Caregiver predictability and the Questionnaire of Unpredictability in Childhood (QUIC). (E) Caregiver opportunity and the Deprivation and Threat—Adult Self-report (DT-AS) socio-emotional deprivation subscale. (F) Caregiver safety and support and the Deprivation and Threat—Adult Self-report (DT-AS) direct physical violence subscale. (G) Friend opportunity and the Montreal Friendship Questionnaire (MFQ) stimulating companionship subscale. (H) Friend safety and support and the Montreal Friendship Questionnaire (MFQ) emotional security subscale. Gray shading indicates the 95% confidence interval of the regression line. Holm–Bonferroni adjusted *p < .05, **p < .01, ***p < .001. For all plots, points are slightly jittered for visualization.
Interim Summary
The goals of Study 3 were to perform a confirmatory factor analysis on the item-reduced POS-DEV scale, evaluate the internal consistency of the scale, and assess construct validity against validated scales measuring positive and adverse early experiences. The confirmatory factor analysis confirmed the factor structure established in the second EFA and demonstrated a relatively good fit of the models compared to the data across social figures and developmental windows. At this stage, one item was removed from the childhood caregiver scale and six items were removed from the adolescent caregiver scale for having a negative variance estimate. As a result, the final version of the POS-DEV scale has 58 items (31 items for childhood window and 27 items for adolescent window, see Figure 12). A full list of retained and removed items can be found in Supplement A + Supplement B. In addition, we established excellent internal consistency across all factors and social figures, as well as construct validity with existing questionnaires of positive and adverse early experiences.
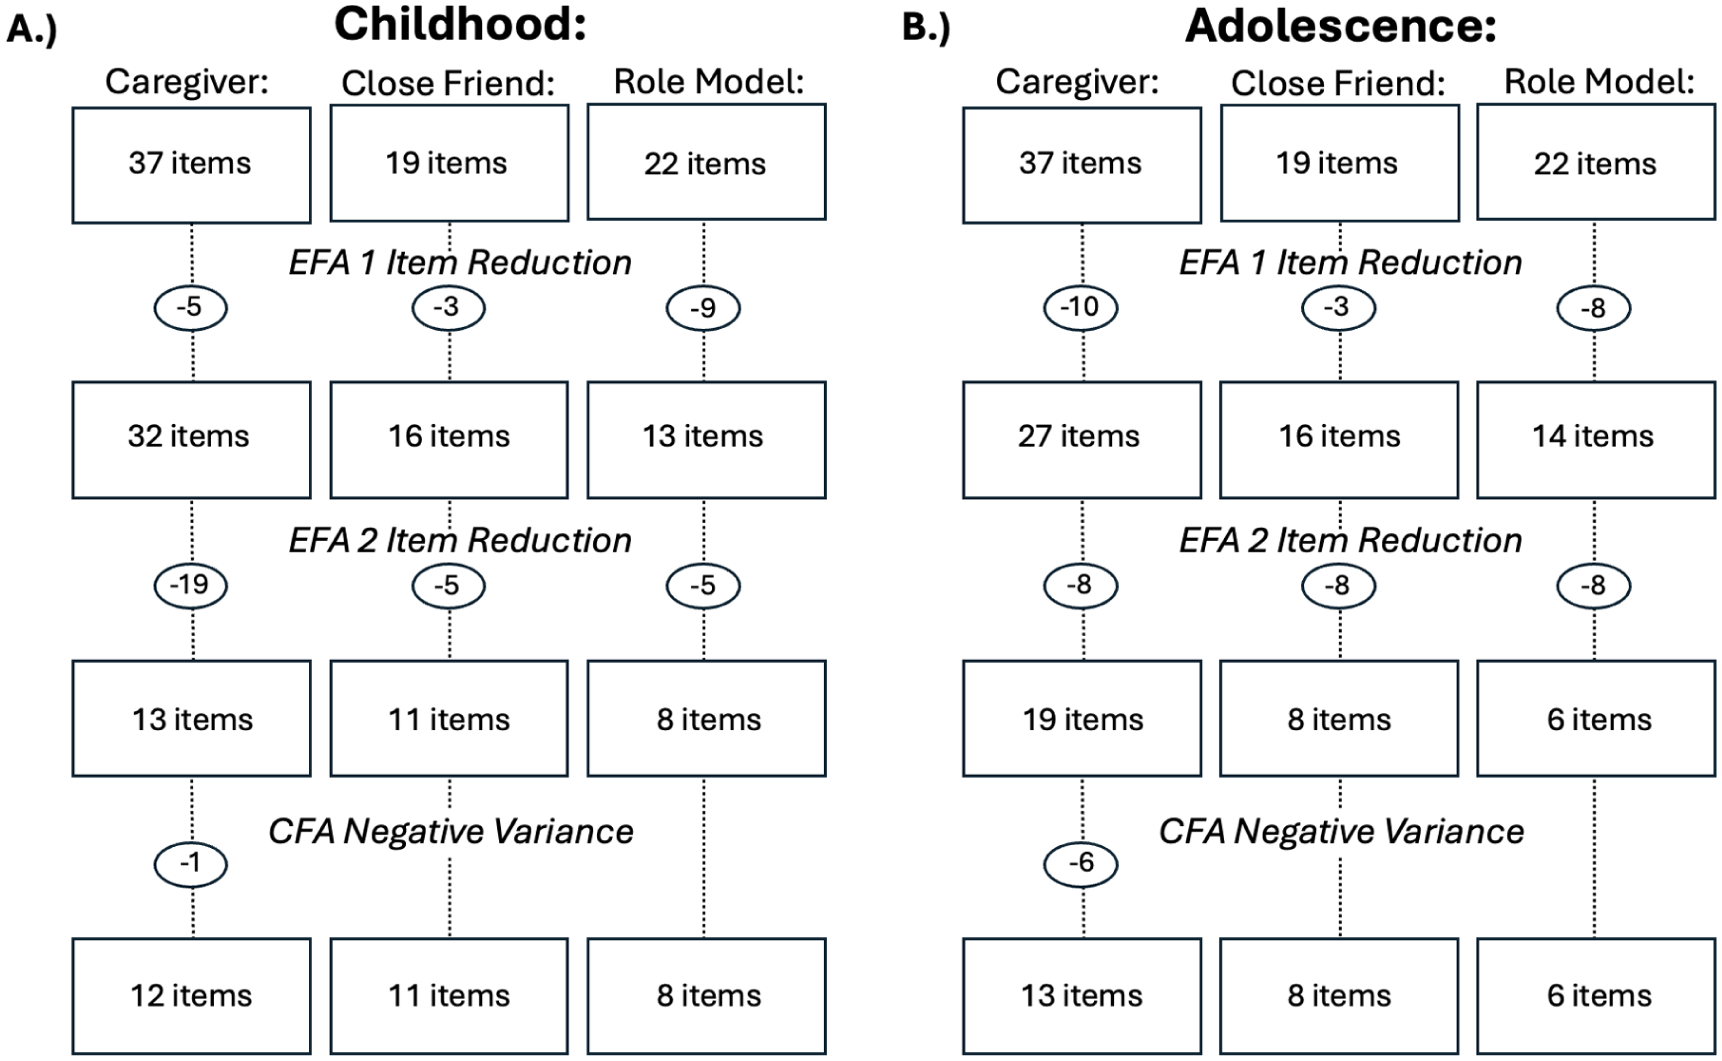
Flowchart of EFA and CFA item reduction steps for the childhood and adolescent windows of the POS-DEV scale.
Study 4: Test–Retest Reliability
Method
Participants
A total of 204 English-speaking adult Prolific workers who took part in Study 1 were recontacted 6 months later to re-complete the POS-DEV questionnaire on the online survey platform Qualtrics (Table 1). All participants from that sample were recontacted. Of these, 1 participant was removed for completing the follow-up but not the initial survey battery 6 months prior. The following are the final sample sizes for each social figure and time window: 203 for childhood caregivers, 202 for adolescent caregivers, 170 for childhood friends, 166 for adolescent friends, 137 for childhood role model, and 111 for adolescent role model.
Materials and Procedure
The goal of Study 4 was to assess the 6-month test–retest reliability of the POS-DEV scale. Participants from Study 1 were recontacted 6 months later to complete the final 58-item version of the scale (31 items for childhood window and 27 items for adolescent window) using the Qualtrics online survey tool. One item from caregiver safety and support in childhood (“I felt safe sharing my feelings and problems with my caregiver(s)”), one item from close friend opportunity in childhood (“My close friend(s) knew a lot about me.”), and one item from role model opportunity in childhood (“This positive role model knew a lot about me.”) was missing in the 6-month retest due to experimenter error. Study 4 took an average of 11 min to complete.
Analysis Plan
For participants who completed both Study 1 and Study 4 (about 6 months between studies), test–retest reliability of POS-DEV scores for each dimension per social figure and developmental time period was assessed using intraclass correlations (ICCs) generated from the ICC function within the psych 2.2.9 package (Revelle, 2024) in R. ICC thresholds were determined based on criteria set forth by Cicchetti (1994) for test–retest reliability of psychometric questionnaires: fair, .40 ≤ values ≤ .59; good, .60 ≤ values ≤ .74; and excellent, values ≥ .75.
Results
To assess test–retest reliability, we calculated intraclass correlations (ICCs) for participants who filled out the scale during Study 1 and then again 6 months later (Study 4). Overall POS-DEV childhood scores had excellent test–retest reliability (ICC = .76) based on thresholds put forth by Cicchetti (1994). ICCs were also calculated for each social figure collapsed across factors (predictability, opportunity, safety and support) for the childhood time window. Caregiver(s) (ICC = .91) and role model (ICC = .77) social figures had excellent test–retest reliability, while close friend(s) (ICC = .61) demonstrated good reliability. Each dimension was also evaluated per social figure in childhood. Caregiver predictability (ICC = .88), opportunity (ICC = .88), and safety and support (ICC = .88) all demonstrated excellent test–retest reliability. Meanwhile, close friend opportunity (ICC = .66) and safety and support (ICC = .61) had good test–retest reliability. The positive role model opportunity factor (ICC = .7) had good reliability, while the safety and support factor had excellent reliability (ICC = .77). Finally, we calculated ICCs for each dimension present for multiple social figures (opportunity, safety and support). Overall opportunity scores (ICC = .75) demonstrated excellent test–retest reliability while overall safety and support scores (ICC = .68) had good reliability with 6 months between tests (see Table 5).
Six-Month Test–Retest Reliability of the POS-DEV Scale in Childhood and Adolescence Using Intraclass Correlations (ICCs) Thresholded Based on Criteria Set Forth by Cicchetti (1994): Fair, .40 ≤ Values ≤ .59; Good, .60 ≤ Values ≤ .74; and Excellent, Values ≥ .75.
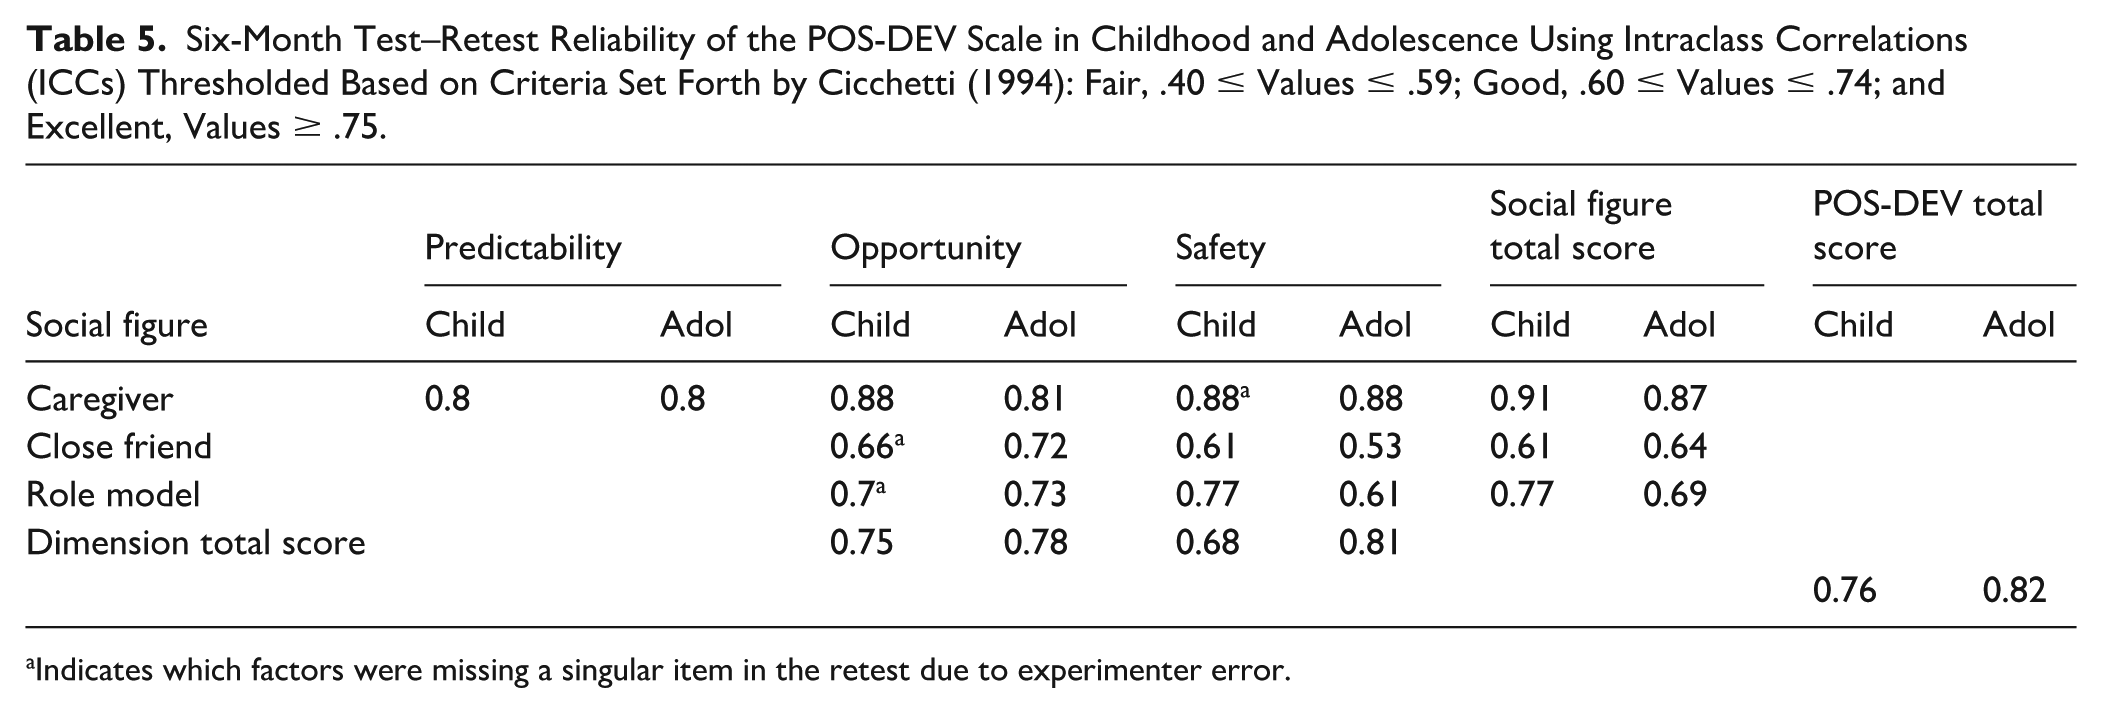
Indicates which factors were missing a singular item in the retest due to experimenter error.
Overall POS-DEV adolescence scores had excellent test–retest reliability (ICC =.82). Caregiver scores (ICC = .87) had excellent test–retest reliability, while close friend (ICC = .64) and role model (ICC = .69) scores demonstrated good reliability. Caregiver predictability (ICC = .80), opportunity (ICC = .81), and safety and support (ICC = .88) all demonstrated excellent test–retest reliability. Meanwhile, close friend opportunity (ICC = .72) had good reliability, while close friend safety and support (ICC = .53) had fair test–retest reliability. The positive role model opportunity factor (ICC = .73) and safety and support factor (ICC = .61) reliability were also good. Finally, overall opportunity scores (ICC = .78) and overall safety and support scores (ICC = .81) demonstrated excellent test–retest reliability within 6 months between tests (see Table 5).
Interim Summary
In Study 4, we established the test–retest reliability of the POS-DEV scale. With 6 months between completion of the questionnaire and POS-DEV childhood scores, there was excellent test–retest reliability, with good to excellent reliability across childhood social figures and dimensions. Similarly, adolescence scores had excellent test–retest reliability, with fair to excellent reliability across adolescent social figures and dimensions. Overall, the POS-DEV scale proved to be reliable and stable over this time period of retrospective reporting.
Study 5: Associations With Adult Mental Health
Method
Participants
Responses from Studies 1 to 3 were combined to assess relations between scores on the POS-DEV scale and adult mental health measures. Only participants who completed both the POS-DEV scale and the adult mental health measures were included in Study 5. The following are the final sample sizes for each social figure and developmental time window: 1021 for childhood caregivers, 1021 for adolescent caregivers, 909 for childhood friends, 890 for adolescent friends, 786 for childhood role model, and 679 for adolescent role model.
Materials and Procedure
The main goal of Study 5 was to evaluate how POS-DEV scale scores are associated with current adult mental health. Because there was no overlap in participation across Studies 1 to 3, responses for the POS-DEV scale were collapsed into a larger sample. Current adult mental health was measured using the trait portion of the State-Trait Anxiety Inventory (STAI; Spielberg et al., 1970), Beck Depression Inventory (BDI-II; Beck et al., 1996), and Connor-Davidson Resilience Scale (CD-RISC-10; Connor & Davidson, 2003) as part of the larger survey batteries in Studies 1 to 3. An additional goal of Study 5 was to test associations between POS-DEV scores and perceived socioeconomic status (SES) and age to explore whether the POS-DEV scale variability was driven in part by SES differences or age-related biased recall. Socioeconomic status was measured as subjective SES, with participants reporting perceived social class during each developmental window. A final aim of Study 5 was to empirically highlight the conceptual framework (Figure 1) premise that one cannot accurately infer an individual’s developmental circumstances without measuring both adverse and positive experiences by illustrating POS-DEV scores and adversity scores across a two-dimensional space.
Analysis Plan
We assessed associations between the POS-DEV scale with current, adult mental health measures by relating dimension scores for each social figure and developmental time window with scores on the STAI, BDI, and CD-RISC-10. Bivariate correlations for associations between scales, SES, and age were assessed using the cor.test function within the stats 4.2.1 package in R, while linear regressions were run using the lm function in this package. To assess whether both positive and/or adverse experiences in development were associated with adult mental health, linear regression models included both the POS-DEV dimension of interest and the closest corresponding adversity dimension score. Additional regression models also assessed the contribution from each social figure for a particular experience dimension to associations with adult mental health. If SES or age were determined to be strongly associated with the POS-DEV scale, then linear regression models would control for their influence. All questionnaires were standardized using z-scores in linear regression models for comparability across measures. For these analyses, participants across Studies 1 to 3 were included. Post hoc corrections for multiple comparisons were applied for bivariate correlations and regression models using the Holm–Bonferroni method. Effect sizes for correlations were evaluated based on thresholds set by Cohen (1988), specifically small: r = .10, medium: r = .30, and large: r = .50. Finally, using data from Study 5, we visualized z-scores from POS-DEV and adversity questionnaires across four quadrants (high positive/high adversity, high positive/low adversity, low positive/high adversity, low positive/low adversity) to capture the full range of psychosocial experiences within individuals in this dataset. An overall adversity score was obtained by averaging subscale scores on the QUIC and DT-AS.
Results
Associations Between POS-DEV and Demographic Variables
All dimensions across social figures were significantly positively correlated with SES, with the exception of role model safety and support in childhood. Where significant correlations existed, effect sizes were small for associations with close friends and adult role models while effect sizes for caregiver scores were largely medium in size (see Table 6). Meanwhile, age was not significantly correlated with most dimensions of the POS-DEV scale. Where significant correlations did exist for childhood and adolescence role model safety and support, they indicated small effect sizes (all r < .16; Table 7).
POS-DEV Correlations With Socioeconomic Status (SES).
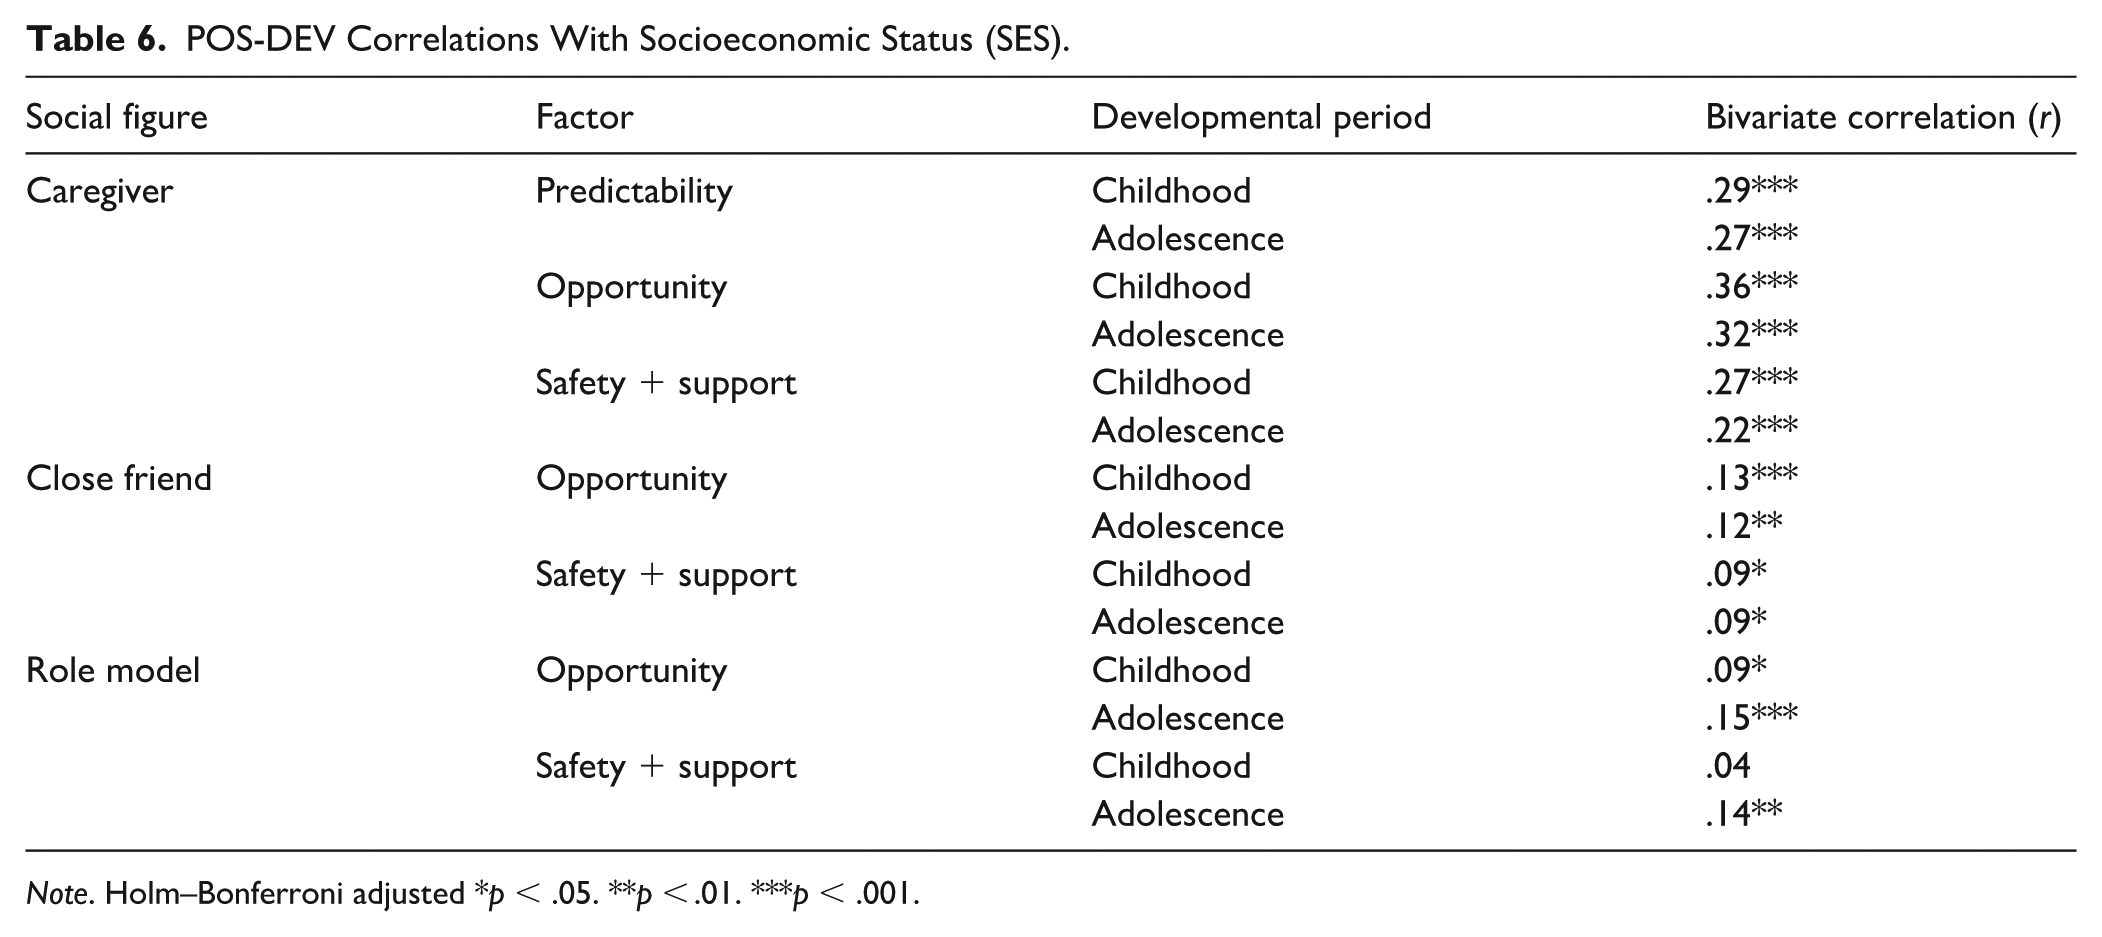
Note. Holm–Bonferroni adjusted *p < .05. **p < .01. ***p < .001.
POS-DEV Correlations With Age.
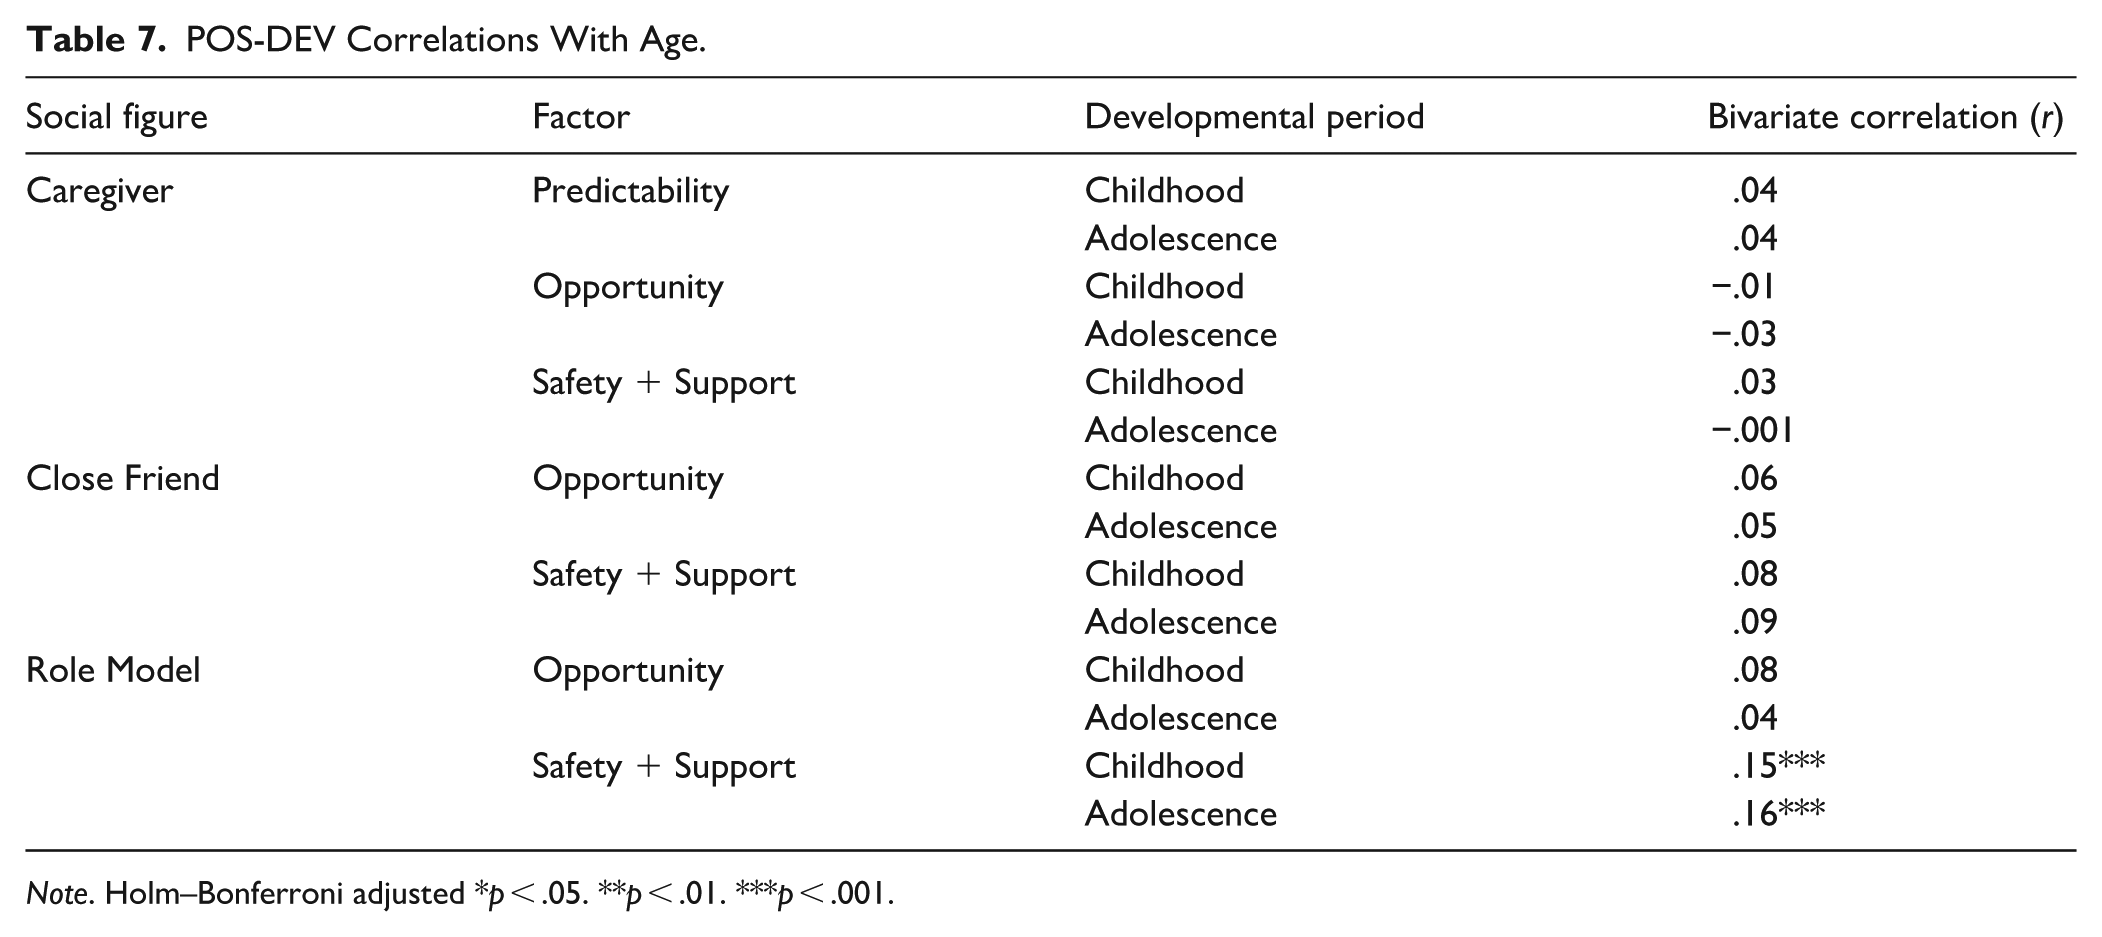
Note. Holm–Bonferroni adjusted *p < .05. **p < .01. ***p < .001.
Associations Between POS-DEV and Adult Mental Health
Finally, we tested associations between POS-DEV scores and current adult mental health across our entire three-study sample using linear regression models (see Supplement C for full results). Given the associations between SES and the POS-DEV scores, SES was included as a covariate in all models. To assess whether both positive and/or adverse experiences in development were associated with adult mental health, each model included both the POS-DEV dimension of interest and the closest corresponding adversity dimension score. Multicollinearity was assessed prior to running each model, and predictors in all models demonstrated sufficiently low multicollinearity (variance inflation factor (VIF) range: 1.07–2.35). First, we investigated early life experiences (both positive and adverse) as predictors of adult trait anxiety (as measured by the STAI) while controlling for SES during that time window. In the childhood window, almost all POS-DEV dimensions of predictability (R2 = .18), opportunity (R2 = .17), and safety and support (R2 = .19) were significantly negatively associated with STAI over and above their complementary dimension of adversity (except caregiver predictability, p > .05, n = 978; Figure 13). Similarly, in the adolescent window, almost all POS-DEV dimensions (predictability: R2 = .16; opportunity: R2 = .16; safety: R2 = .19) were significantly negatively associated with STAI over and above their complementary dimension of adversity, with the exception of caregiver predictability (p > .05, n = 759; Figure 13).
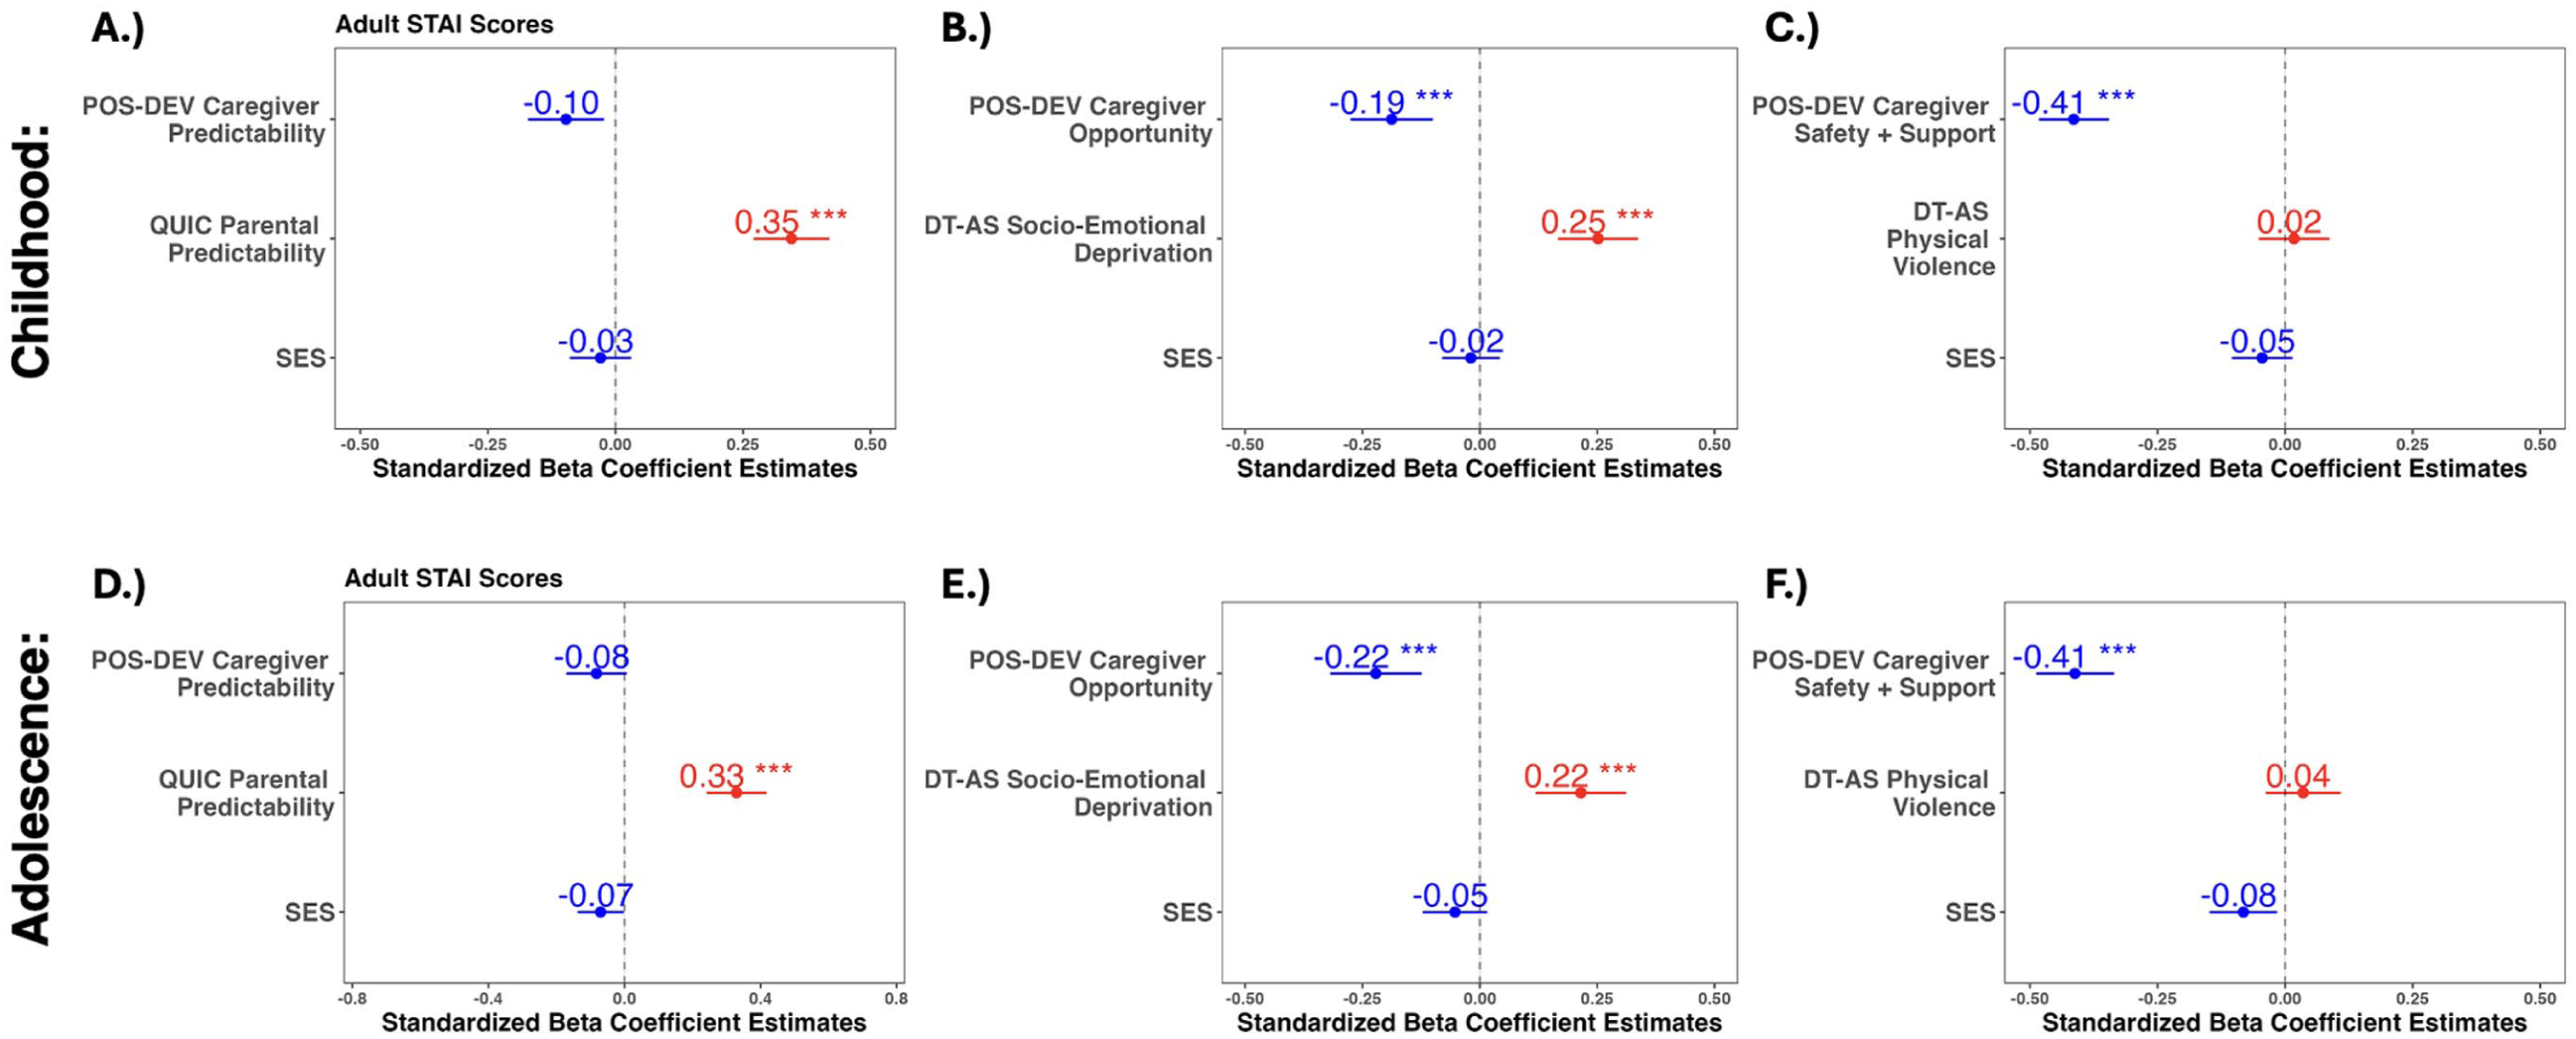
Standardized beta coefficient estimates for the following POS-DEV and adversity scale dimensions as predictors of scores on the trait subscale of the State-Trait Anxiety Index in adulthood: (A) POS-DEV caregiver predictability and QUIC parental predictability in childhood. (B) POS-DEV caregiver opportunity and DT-AS socio-emotional deprivation in childhood. (C) POS-DEV caregiver safety and support and DT-AS physical violence in childhood. (D) POS-DEV caregiver predictability and QUIC parental predictability in adolescence. (E) POS-DEV caregiver opportunity and DT-AS socio-emotional deprivation in adolescence. (F) POS-DEV caregiver safety and support and DT-AS physical violence in adolescence. Holm–Bonferroni adjusted *p < .05, **p < .01, ***p < .001.
Next, we investigated early life experiences as a predictor of adult depression (as measured by the BDI) while controlling for SES during that time window. In the childhood window, all POS-DEV dimensions of predictability (R2 = .17), opportunity (R2 = .13), and safety and support (R2 = .16) were significantly negatively associated with BDI over and above their complementary dimension of adversity (Figure 14). In the adolescent window, all POS-DEV dimensions (predictability: R2 = .16; opportunity: R2 = .13; safety: R2 = .16) were significantly negatively associated with BDI over and above their complementary dimension of adversity (Figure 14).
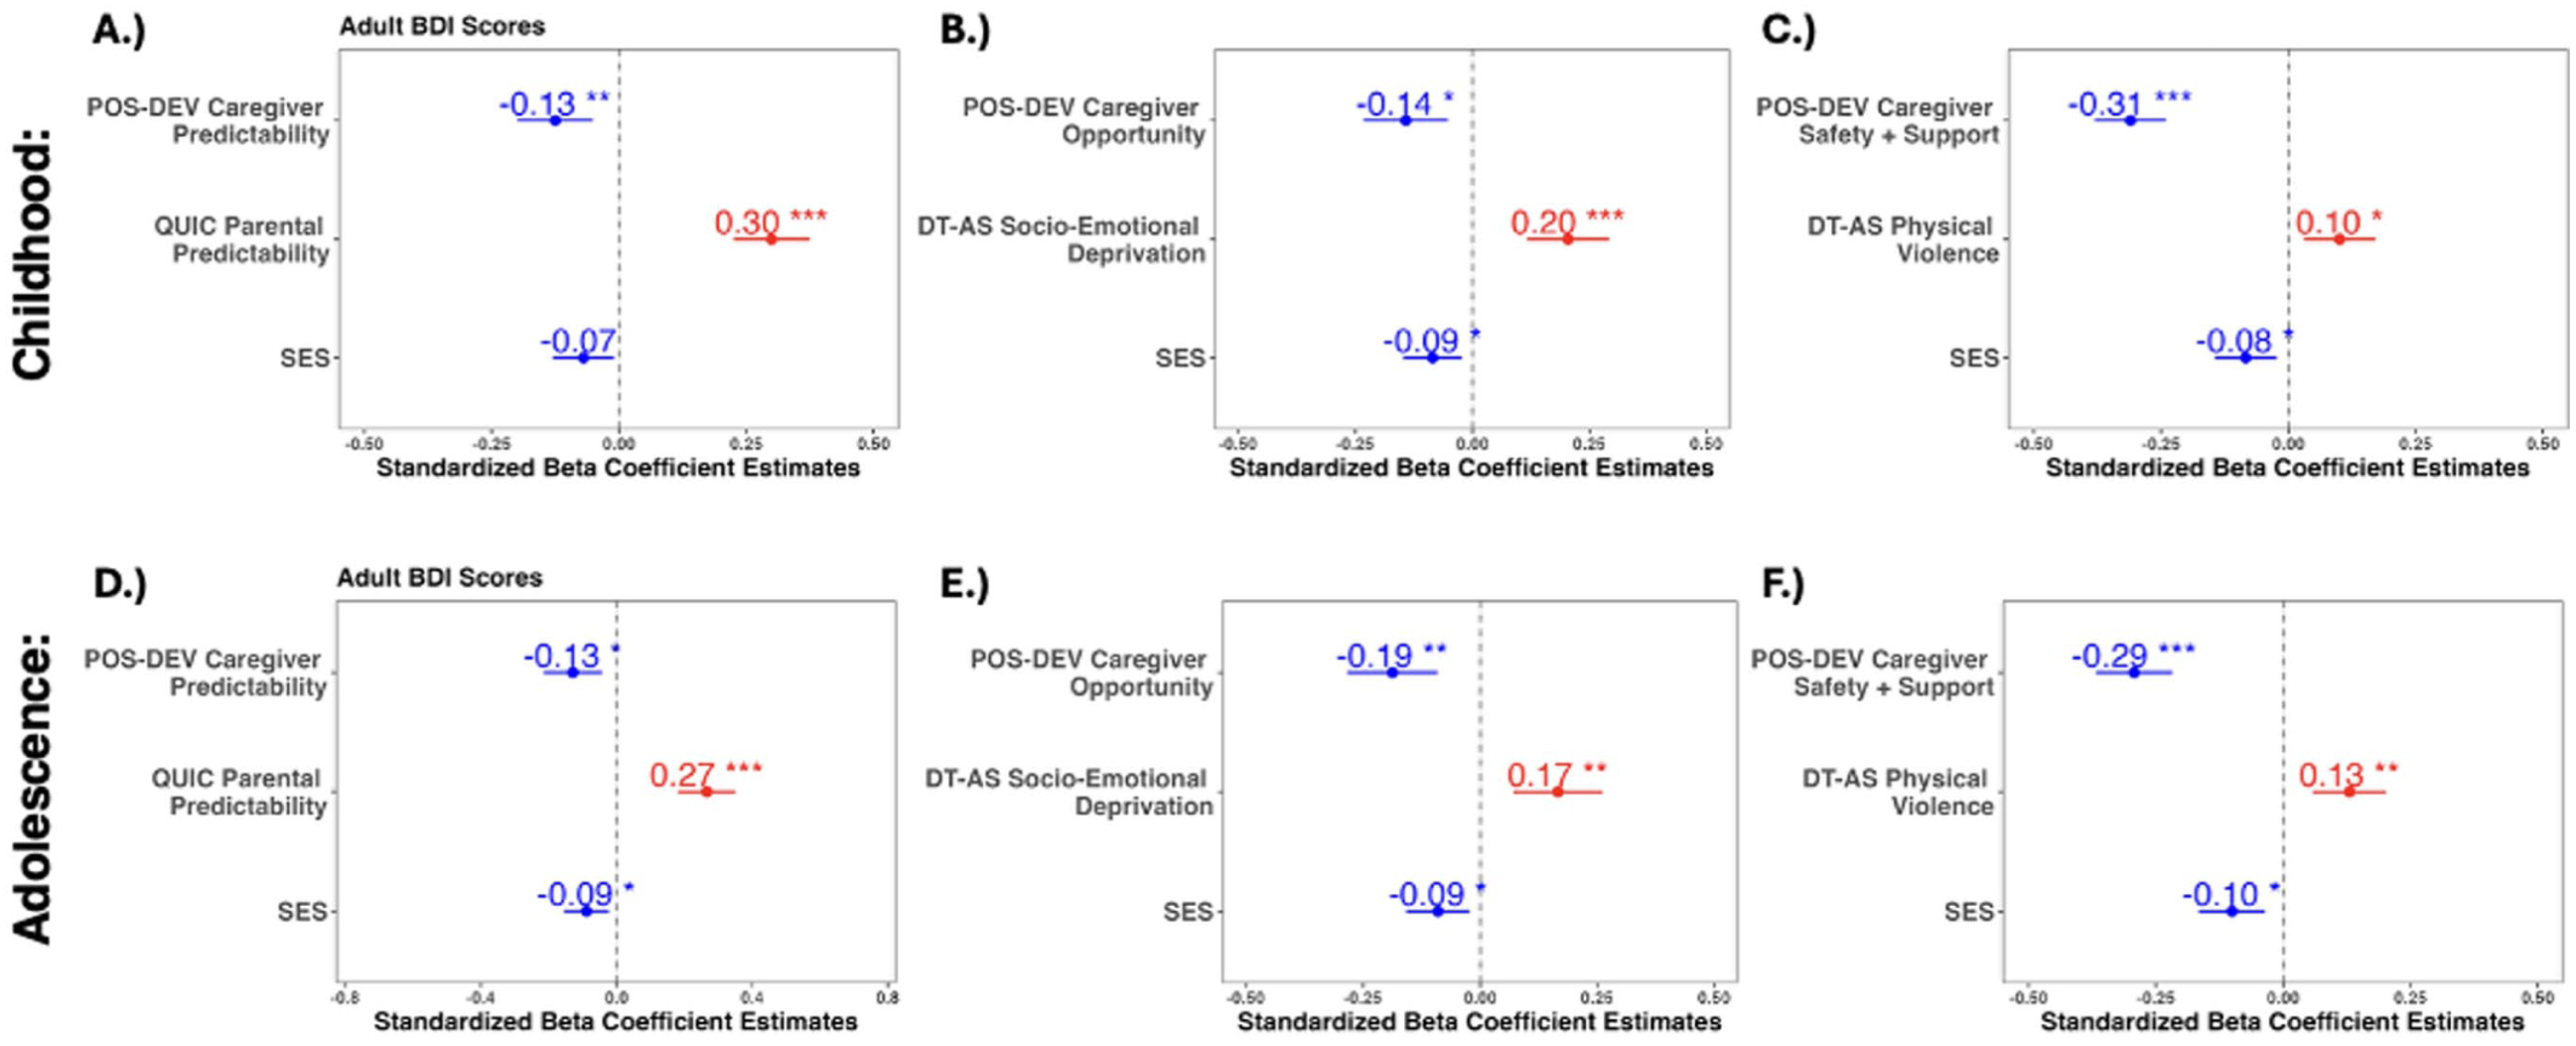
Standardized beta coefficient estimates for the following POS-DEV and adversity scale dimensions as predictors of scores on the Beck Depression Inventory in adulthood: (A) POS-DEV caregiver predictability and QUIC parental predictability in childhood. (B) POS-DEV caregiver opportunity and DT-AS socio-emotional deprivation in childhood. (C) POS-DEV caregiver safety and support and DT-AS physical violence in childhood. (D) POS-DEV caregiver predictability and QUIC parental predictability in adolescence. (E) POS-DEV caregiver opportunity and DT-AS socio-emotional deprivation in adolescence. (F) POS-DEV caregiver safety and support and DT-AS physical violence in adolescence. Holm–Bonferroni adjusted *p < .05, **p < .01, ***p < .001.
In addition, we investigated early life experiences as a predictor of adult resilience (as measured by the CD-RISC) while controlling for SES during that time window. In the childhood window, all POS-DEV dimensions of predictability (R2 = .08), opportunity (R2 = .14), and safety and support (R2 = .13) were significantly positively associated with CD-RISC over and above their complementary dimension of adversity (Figure 15). In the adolescent window, almost all POS-DEV dimensions (predictability: R2 = .09; opportunity: R2 = .15; safety: R2 = .14) were significantly positively associated with CD-RISC over and above their complementary dimension of adversity (except caregiver predictability, p > .05, n = 759; Figure 15).
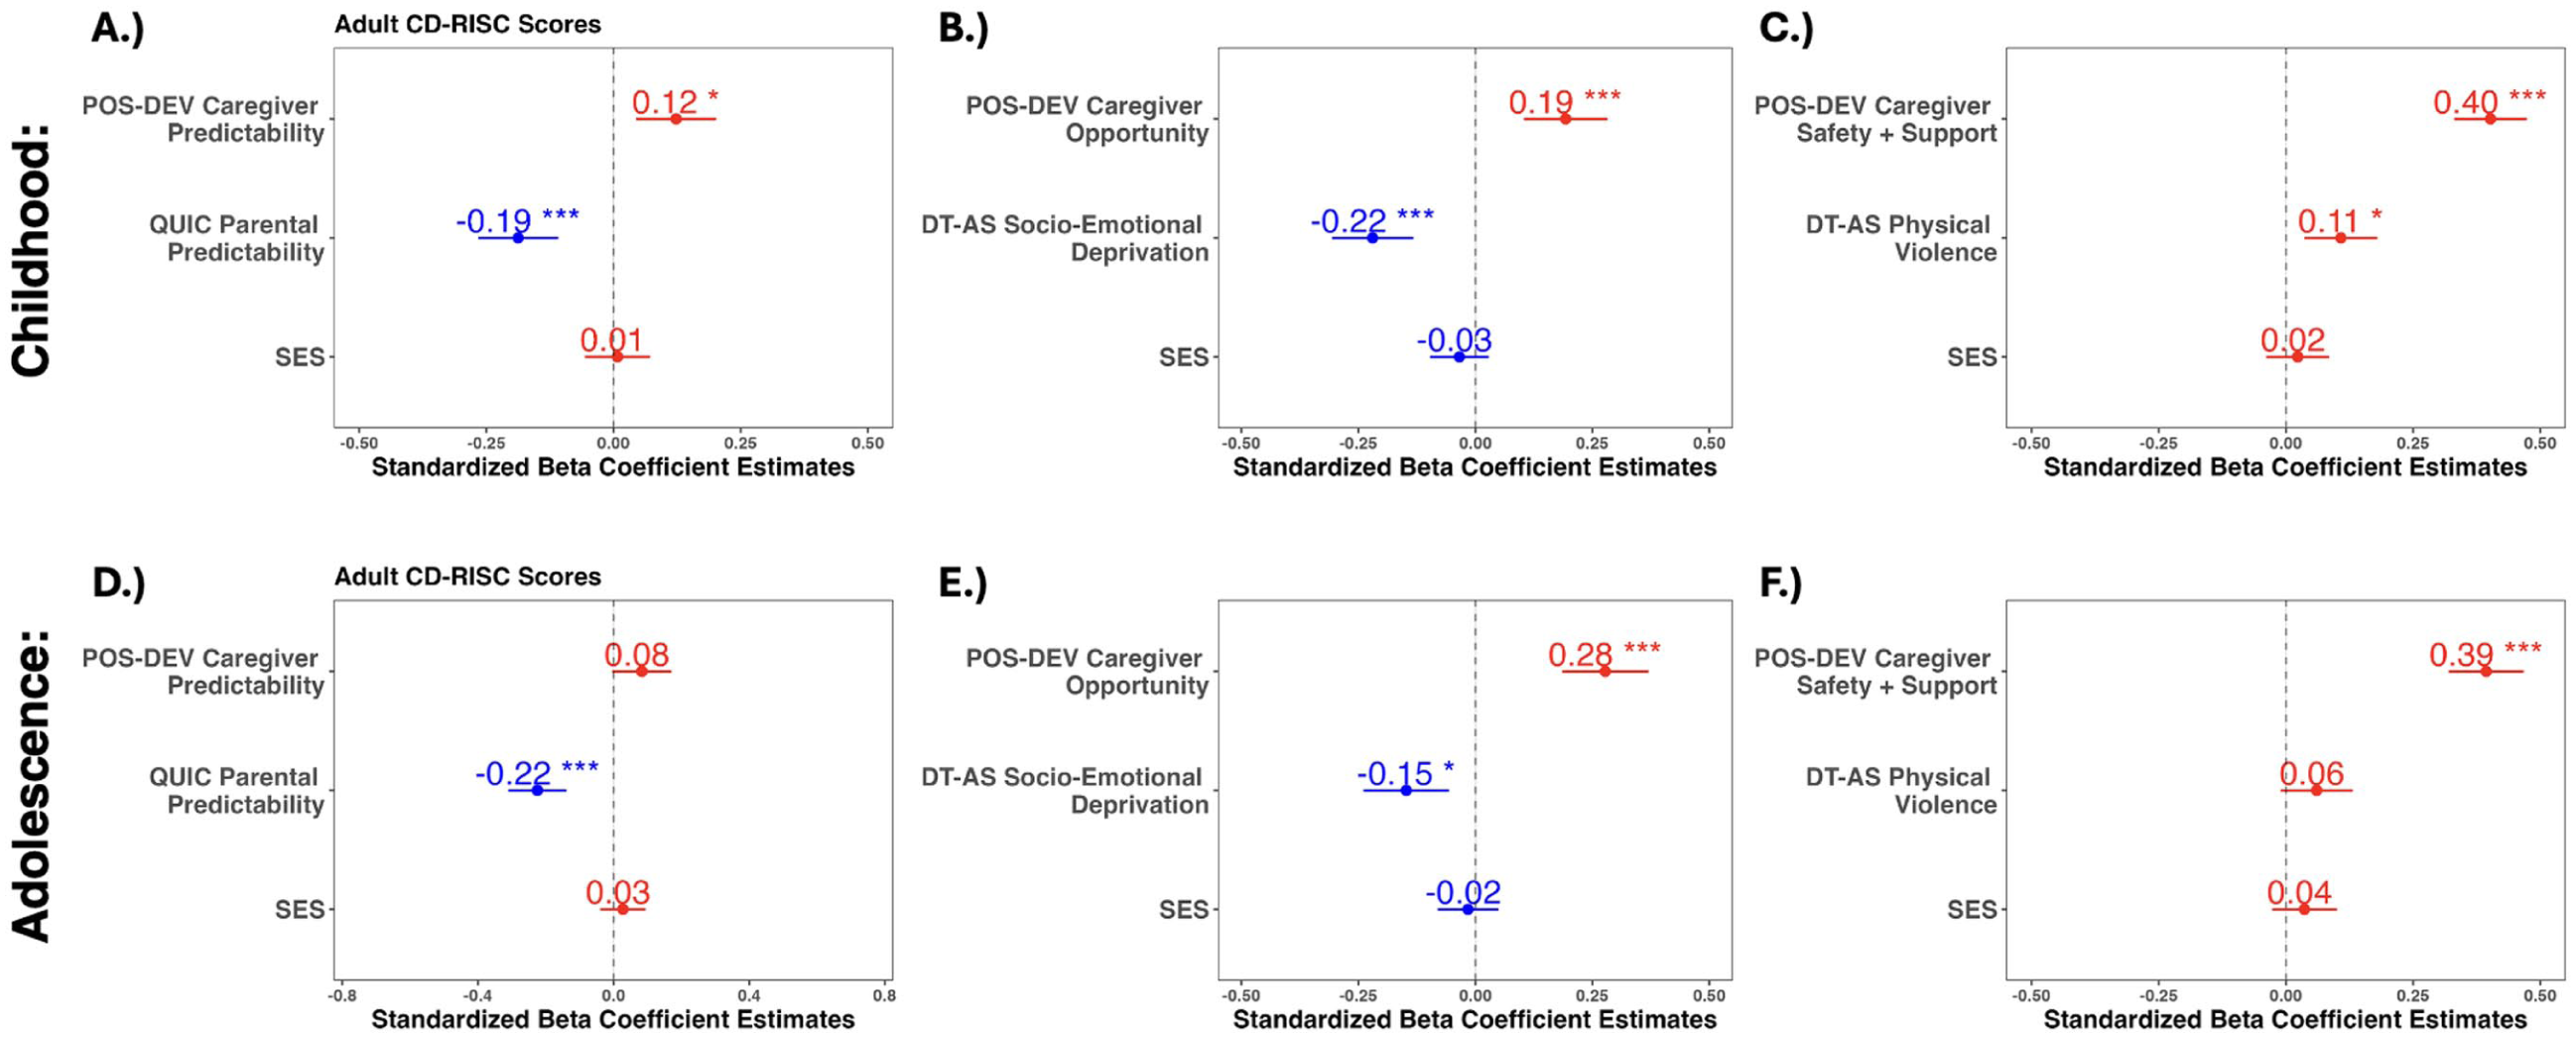
Standardized beta coefficient estimates for the following POS-DEV and adversity scale dimensions as predictors of scores on the Connor-Davidson Resilience Scale in adulthood: (A) POS-DEV caregiver predictability and QUIC parental predictability in childhood. (B) POS-DEV caregiver opportunity and DT-AS socio-emotional deprivation in childhood. (C) POS-DEV caregiver safety and support and DT-AS physical violence in childhood. (D) POS-DEV caregiver predictability and QUIC parental predictability in adolescence. (E) POS-DEV caregiver opportunity and DT-AS socio-emotional deprivation in adolescence. (F) POS-DEV caregiver safety and support and DT-AS physical violence in adolescence. Holm–Bonferroni adjusted *p < .05, **p < .01, ***p < .001.
We also assessed the contribution from each social figure for a particular experience dimension to associations with adult mental health while covarying for SES. As before, multicollinearity was assessed prior to analysis and predictors in all models demonstrated a low correlation (VIF range: 1.13–1.27). First, we investigated relationships with each social figure as a predictor of adult trait anxiety. In the childhood window, POS-DEV caregiver and role model opportunity, but not close friend opportunity (p > .05, n = 689), were significantly negatively associated with STAI scores (R2 = .17; Figure 16). Meanwhile, caregiver safety, but not close friend and role model safety (p > .05, n = 689), was negatively associated with STAI scores (R2 = .16; Figure 16). Similarly, in the adolescent window, POS-DEV caregiver and role model opportunity, but not close friend opportunity (p > .05, n = 541), were significantly negatively associated with STAI scores (R2 = .21; Figure 16). In addition, caregiver safety, but not close friend and role model safety (p > .05, n = 541), was negatively associated with STAI scores (R2 = .19; Figure 16).
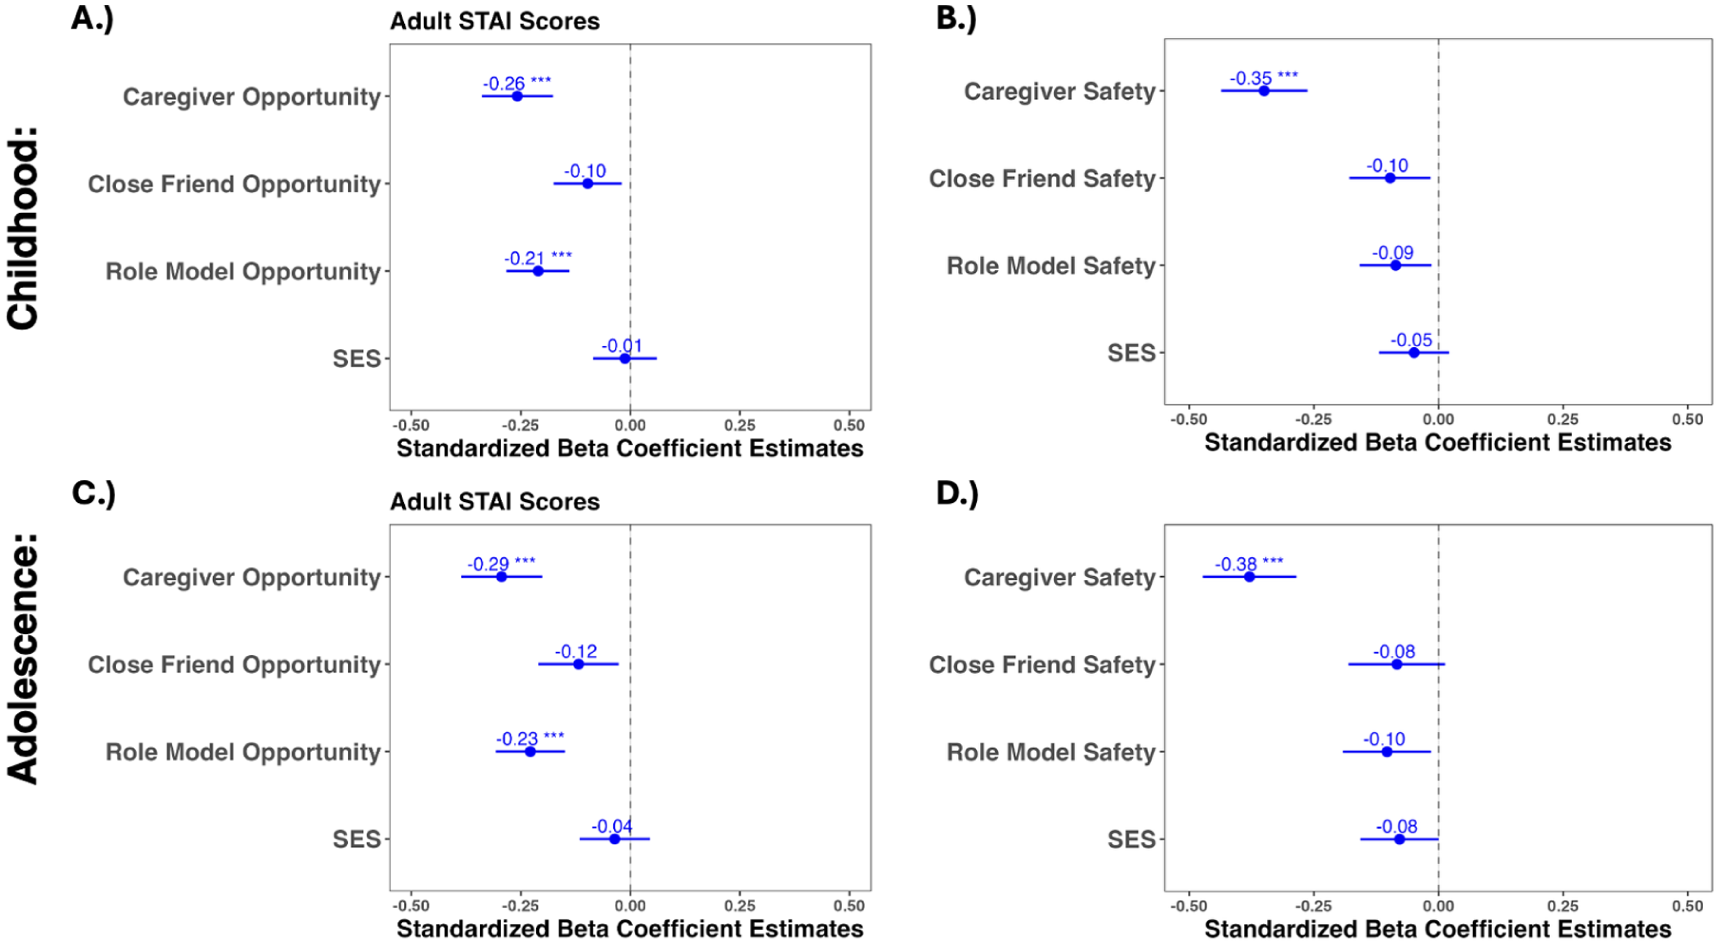
Standardized beta coefficient estimates for the following POS-DEV social figures per dimension as predictors of scores on the trait subscale of the State-Trait Anxiety Index in adulthood: (A) POS-DEV caregiver opportunity, close friend opportunity, and role model opportunity in childhood. (B) POS-DEV caregiver safety and support, close friend safety and support, and role model safety and support in childhood. (C) POS-DEV caregiver opportunity, close friend opportunity, and role model opportunity in adolescence. (D) POS-DEV caregiver safety and support, close friend safety and support, and role model safety and support in adolescence. Holm–Bonferroni adjusted *p < .05, **p < .01, ***p < .001.
Next, we investigated relationships with each social figure as a predictor of adult depression. In the childhood window, POS-DEV caregiver and role model opportunity were significantly negatively associated with BDI scores, while close friend opportunity was not associated (p > .05, n = 689; R2 = .10; Figure 17). Meanwhile, for the dimension of safety and support, caregiver was the only social figure associated with BDI scores, while close friend safety and support and role model safety and support were not associated with adult depression (p > .05, n = 689; R2 = .11; Figure 17). In the adolescent window, the same patterns emerged. Almost all POS-DEV social figures across the dimensions of opportunity (R2 = .13) and safety and support (R2 = .13) were significantly negatively associated with BDI scores, with the exception of close friend opportunity, close friend safety and support, and role model safety and support (p > .05, n = 541; Figure 17).
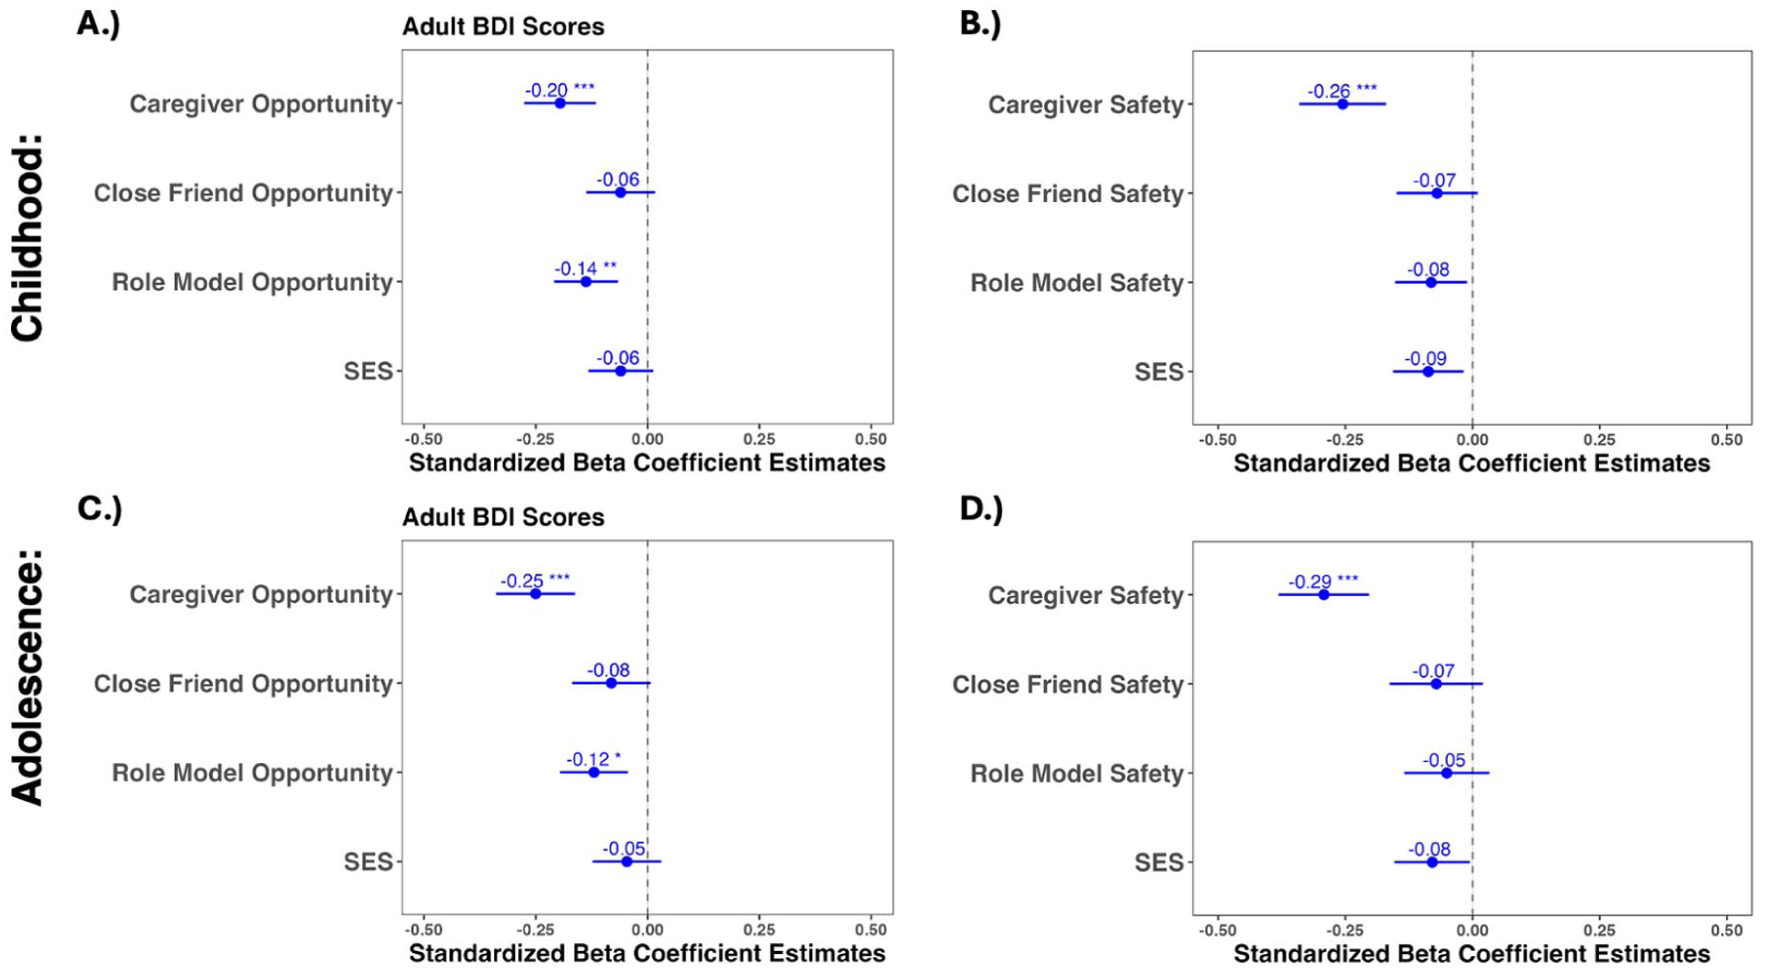
Standardized beta coefficient estimates for the following POS-DEV social figures per dimension as predictors of scores on the trait subscale of the Beck Depression Inventory in adulthood: (A) POS-DEV caregiver opportunity, close friend opportunity, and role model opportunity in childhood. (B) POS-DEV caregiver safety and support, close friend safety and support, and role model safety and support in childhood. (C) POS-DEV caregiver opportunity, close friend opportunity, and role model opportunity in adolescence. (D) POS-DEV caregiver safety and support, close friend safety and support, and role model safety and support in adolescence. Holm–Bonferroni adjusted *p < .05, **p < .01, ***p < .001.
Finally, we investigated relationships with each social figure as a predictor of adult resilience. In the childhood window, all POS-DEV social figures across the dimensions of opportunity (R2 = .19) and safety and support (R2 = .14) were significantly positively associated with CD-RISC scores (Figure 18). In the adolescent window, almost all POS-DEV social figures across the dimensions of opportunity (R2 = .22) and safety and support (R2 = .17) were significantly positively associated with CD-RISC scores, with the exception of close friend safety (p > .05, n = 541; Figure 18).
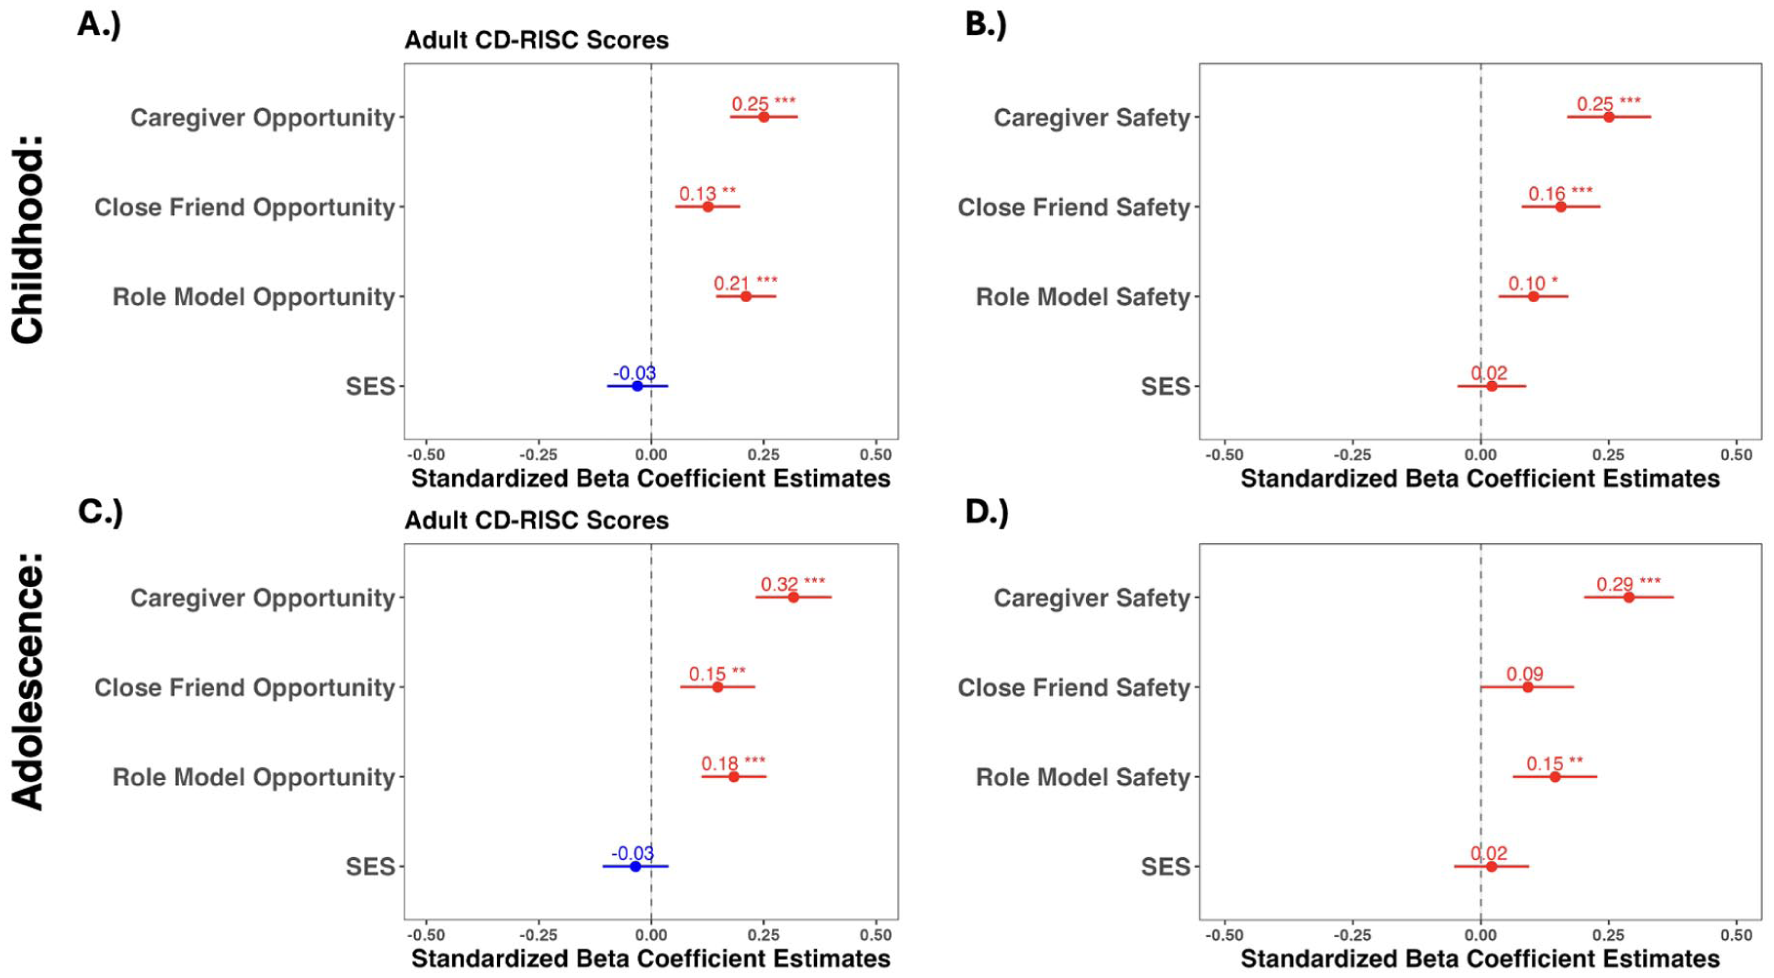
Standardized beta coefficient estimates for the following POS-DEV social figures per dimension as predictors of scores on the trait subscale of the Connor-Davidson Resilience Scale in adulthood: (A) POS-DEV caregiver opportunity, close friend opportunity, and role model opportunity in childhood. (B) POS-DEV caregiver safety and support, close friend safety and support, and role model safety and support in childhood. (C) POS-DEV caregiver opportunity, close friend opportunity, and role model opportunity in adolescence. (D) POS-DEV caregiver safety and support, close friend safety and support, and role model safety and support in adolescence. Holm–Bonferroni adjusted *p < .05, **p < .01, ***p < .001.
Finally, we empirically highlight the conceptual framework (Figure 1) premise that we cannot accurately infer an individual’s developmental circumstances without measuring both adverse and positive experiences. That is, individuals high or low on adversity measures can also be high or low on positive measures and the actual distribution of lived experiences when both adverse and positive experiences are measured will reflect this two-dimensional space. In Figure 19, we demonstrate that individuals within our sample fall within all four quadrants, underscoring the need to consider the concurrence of positive and adverse experiences when considering their long-term effects on development and well-being.
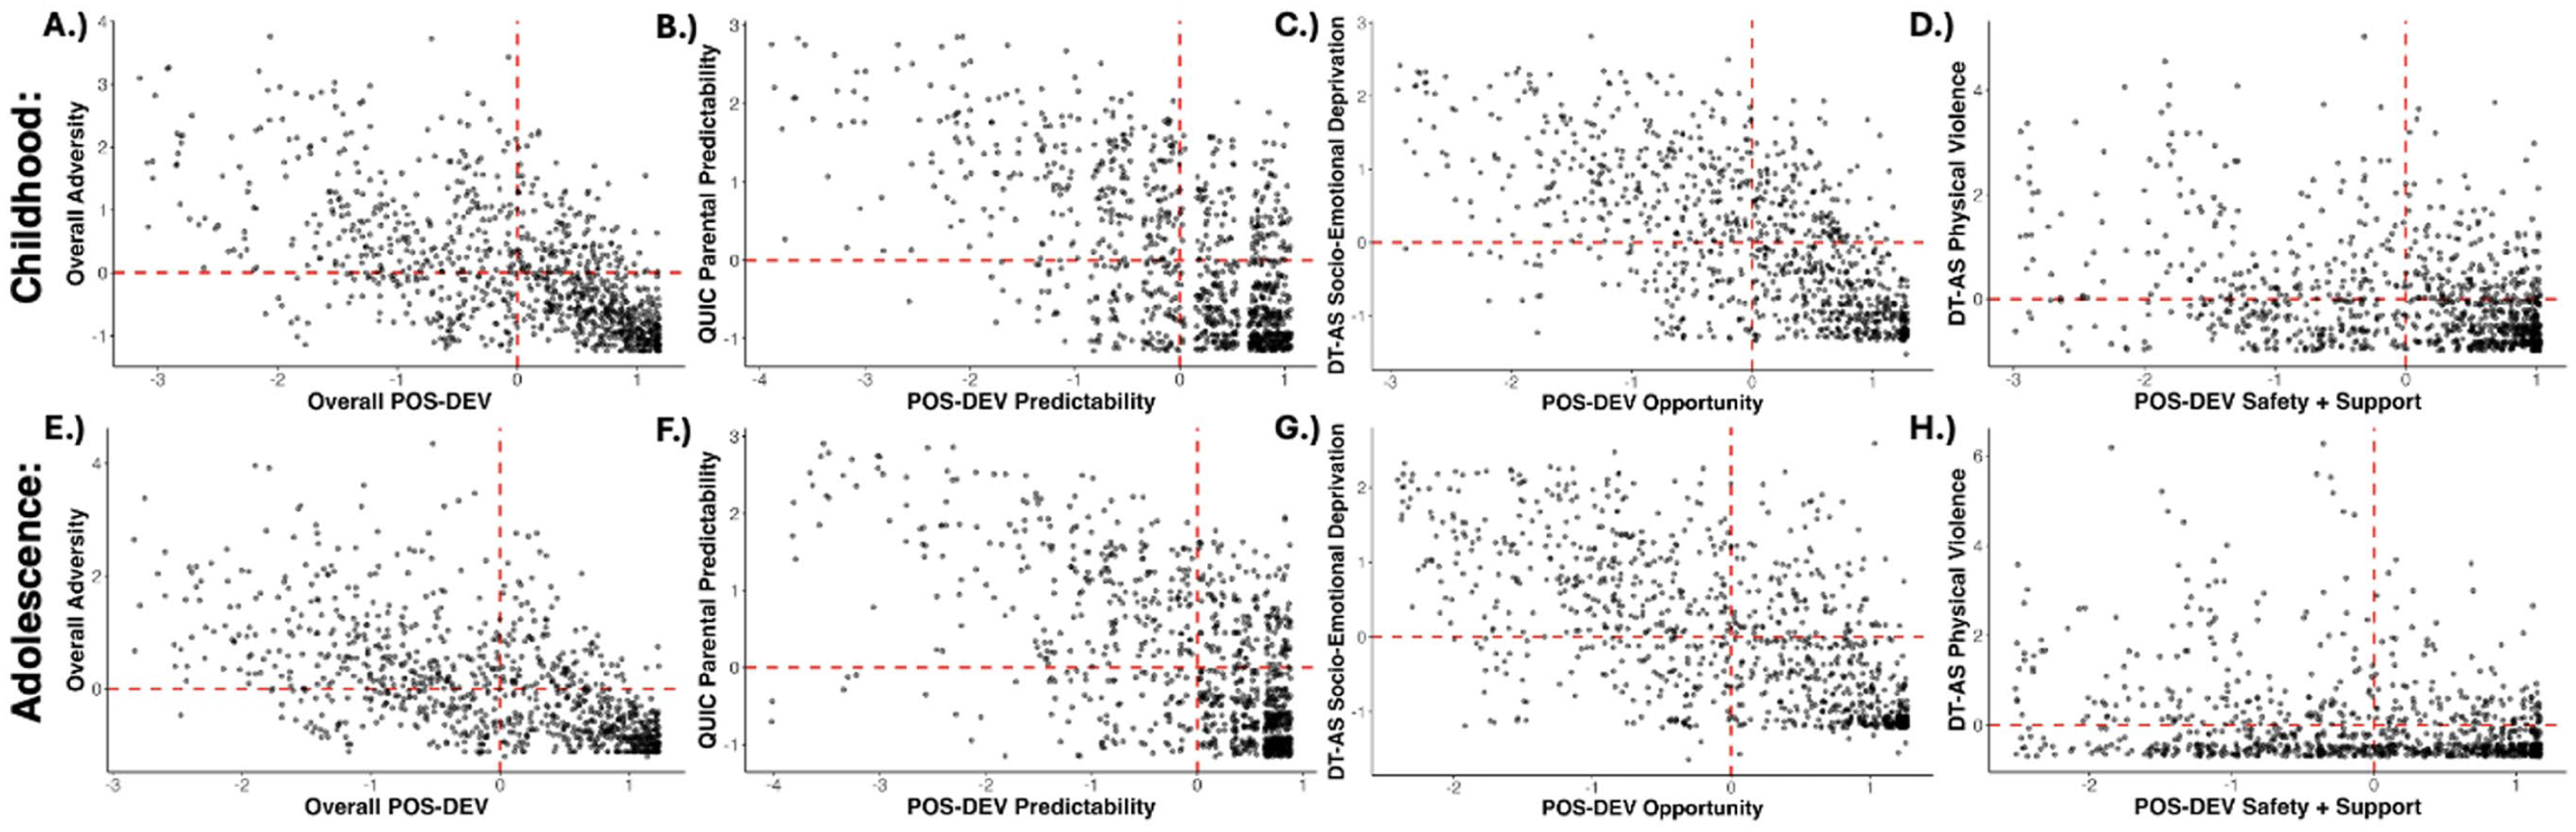
Z-scored POS-DEV and adversity questionnaires for individuals in Studies 1, 2, and 3 to demonstrate the range of experiences in the psychosocial environment. (A) Overall POS-DEV scores and overall adversity scores (averaged across QUIC and DT-AS) in childhood. (B) POS-DEV predictability scores and QUIC Parental Predictability scores in childhood. (C) POS-DEV opportunity scores and DT-AS Socio-Emotional Deprivation scores in childhood. (D) POS-DEV safety and support scores and DT-AS Physical Violence scores in childhood. (E) Overall POS-DEV scores and overall adversity scores (averaged across QUIC and DT-AS) in adolescence. (F) POS-DEV predictability scores and QUIC Parental Predictability scores in adolescence. (G) POS-DEV opportunity scores and DT-AS Socio-Emotional Deprivation scores in adolescence. (H) POS-DEV safety and support scores and DT-AS Physical Violence scores in adolescence. For all plots, points are slightly jittered for visualization.
Interim Summary
In Study 5, we established associations between POS-DEV scores and current adult anxiety, depression, and resilience. We found that positive experiences were associated with adult mental health over and above the effects of adverse experiences and SES. Further, we demonstrated differential contributions of each social figure for associations with adult mental health. Finally, we were able to visually demonstrate the utility of considering both positive and adverse experiences, as participants in our sample were represented in all four quadrants of the two-dimensional space of measured experiences.
General Discussion
Measuring developmental experiences and environments in accurate and impactful ways for understanding and serving youth is a vital but challenging remit of developmental psychological science. While scales and frameworks to capture dimensions of early adverse experiences have emerged and show utility in explaining individual differences in developing and adult health and function (Cohodes, Mandell, et al., 2023; Cohodes, McCauley, et al., 2023; Glynn et al., 2019; Matheny et al., 1995; Tsai et al., 2025), there remains a gap in assessing complementary measures of developmental positive experiences. Further, extant questionnaires of positive developmental experiences predominantly measure relationships with caregivers in the home (Caldwell & Bradley, 1984; Frongillo et al., 2022; Jensen et al., 1983), obscuring variability in the roles that other social figures can play in development (Bagwell & Bukowski, 2018; S. K. Johnson et al., 2016; Shwalb et al., 2019; Slagter et al., 2025). Here, we proposed and validated the 58-item Predictability, Opportunity, and Safety Dimensions of Environmental Variability (POS-DEV) Retrospective Scale. POS-DEV measures individual differences in positive experiences through a multi-dimensional framework aligned with existing measures of early life adversity that also includes multiple social figures as potential sources of these experiences. Results from exploratory and confirmatory factor analyses revealed a scale comprising two to three experience dimensions of predictability, opportunity, and safety and support per social figure across two developmental windows (childhood and adolescence). Average time for participants to complete POS-DEV in the current study was 5 to 6 min for each developmental window (11 min total), supporting feasibility of administering this measure. The POS-DEV scale shows strong psychometric properties, demonstrating construct validity with existing measures, good to excellent test–retest reliabilities over 6 months across almost all subscales, and robust associations with adult mental health across positive experience dimensions and experiences with different social figures. We hope the POS-DEV scale offers utility for psychological research for retrospectively assessing positive psychosocial experiences and their contributions to adult outcomes.
We found that the dimensions of experience preserved with the POS-DEV scale differed across interactions with caregivers, close friends, and positive role models. Specifically, the dimension of predictability was retained only for experiences with primary caregiver(s), not friends or adult role models. Predictability is known to be a critical component of a positive caregiver relationship. Unpredictability in caregiving relationships and routines within the home is associated with a range of negative outcomes across the lifespan (E. P. Davis & Glynn, 2024; Manczak et al., 2017; Ross & Hill, 2002). However, predictability items were not retained in measuring the positive nature of relationships with close friends and role models outside of the home, possibly due to consistently variable access to these figures across participants or reduced need for predictable interactions psychosocially. For example, a grandparent can serve as a positive role model even when living a farther distance away. While their physical presence may not be as predictable as a caregiver in the home, they can still be associated with opportunity for close psychosocial connection and safety and support during these developmental windows. Similarly, younger individuals may have less agency over when they can predictably see close friends due to proximity, access, and a reliance on caregivers to set up these interactions (Uhlendorff, 2000; Vernberg et al., 1993), perhaps making predictability a less salient aspect of the relationship. In addition, we saw one key difference in the types of items loading onto the opportunity dimension of positive experiences depending on the social figure. Specifically, items retained for opportunity with close friends and role models take the form of opportunity for close connection, to rely on and confide in this social figure, with experiences such as providing the space to share feelings and express emotions. In contrast, items retained for opportunity with caregivers encapsulate cognitively enriching activities, such as opportunities to engage in reading, partake in recreational activities, and have dialogue about schoolwork (though we administered the same items retained for friends and role models as well). It seems unlikely this result would be due purely to lack of variability on other aspects of caregiver relationships given the ranges of scores observed on the other caregiver relationship measures in our study. Instead, we suggest that these cognitive opportunity items may have shown better differentiation (compared to affective opportunity items) from the items loading onto the dimension of safety and support. Differences in the items and dimensions retained in POS-DEV therefore represent variation in the scope and types of roles these figures take on and characterize nuance in the early environment. Furthermore, we did not see variation in dimensions retained between the childhood and adolescent windows, demonstrating that the dimensions associated with each social figure are fairly stable across development.
A major goal of the POS-DEV scale was to provide a complementary measure for existing early life adversity questionnaires that use a dimensional framework (CHAOS [Matheny et al., 1995], QUIC [Glynn et al., 2019]; DT-AS [Tsai et al., 2025]; DISTAL and DISTAL-E [Cohodes, Mandell, et al., 2023; Cohodes, McCauley, et al., 2023]). To ensure this new scale would provide independent research contributions by capturing previously unexplained variance in the early environment, we tested how each positive dimension and the complementary adverse dimension of developmental experiences were independently associated with adult mental health. The pattern of results shows that both dimensions of early positive and early adverse experiences significantly explain differences in adult anxiety, depression, and resilience, providing evidence that POS-DEV captures independent aspects of the early environment that are meaningful for adult wellbeing. This set of findings is supported by prior studies finding contributions of both positive and adverse experience measures to health and wellbeing when both kinds of experiences are measured within individuals (Bethell et al., 2019; Crandall et al., 2019, 2020; Han et al., 2023; König et al., 2023; Narayan et al., 2018; Powell et al., 2021; Qu et al., 2022; Wang et al., 2021). Notably, effect sizes for positive experiences compared to adverse experiences were smaller when predicting mental health symptoms but greater when predicting resilience. This finding underscores that positive experiences may partially mitigate the effects of adversity on adult mental health while also significantly contributing to the building of resilience. Moreover, the distributions of experiences within these study samples (Figure 18) highlight how a single individual may experience a range of psychosocial experiences during development, such as facing socio-emotional deprivation from primary caregivers but simultaneously experiencing positive support from others in their lives. These distributions underscore the need to measure both positive and adverse experiences to accurately capture the nature of the early environment, as we and others have argued (Han et al., 2023; Merrick & Narayan, 2020).
Another strength of the POS-DEV scale is its consideration of multiple social influences in development within an integrated framework. Specifically, POS-DEV is the first questionnaire we know of that considers the promotional role of multiple social figures throughout development within a scale. We aimed to move beyond a framework measuring only the caregiver(s) in the home by quantifying the important roles that extended family, other adult role models (e.g., teachers, family friends), and friends play in development (Bagwell & Bukowski, 2018; S. K. Johnson et al., 2016; Shwalb et al., 2019; Slagter et al., 2025). Allowing participants to self-nominate an adult role model rather than pre-specifying specific categories revealed a wide range of positive figures in youths’ lives, such as neighbors, coaches, and family friends. We note with gratitude the promotional roles attributed often to extended family (especially grandparents) and teachers, which were highlighted by our qualitative analyses. Moreover, while we are not the first to assess friendships as a positive aspect of the early environment, typically those questions exist either specifically in independent scales measuring friendship (Mendelson & Aboud, 1999) or summarily in the context of count-based measures of positive childhood experiences (e.g., “Did you have at least one good friend?” BCEs; Narayan et al., 2018). Integrating friendship into dimensional frameworks of promotional childhood experiences is particularly important given the robust literature finding positive effects of friendships on development (Güroğlu, 2022; Vitaro et al., 2009; van Harmelen et al., 2016, 2017), especially for those who have experienced early life adversity (van Harmelen et al., 2021). The pattern of results across associations with adult mental health support the POS-DEV focus on experience measures with adult role models and friends. In particular, caregivers and role models were the most consistent social figures associated with lower anxiety and depression symptoms in adulthood. All three social figures (friends, caregiver(s), and adult role models) reliably related to adult resilience scores. These results highlight how measuring the role of multiple social influences in the early environment more accurately quantifies the range of impactful positive psychosocial experiences in an individual’s development.
An additional goal during the conceptualization phase of the POS-DEV scale was to assess positive experiences that are not highly dependent on socioeconomic status (e.g., like material enrichment). While most POS-DEV dimensions were positively associated with SES, effect sizes were small for associations with close friend(s) and the adult role model scores, underscoring the importance of considering these social figures outside of the home. A potential explanation for the medium effect sizes found for associations between caregiver POS-DEV scores and SES is that caregiver items assessed experiences with cognitively enriching activities, which may rely more on financial access than the items retained for the other POS-DEV social figures. We further note that for the same individuals, dimensions of early life adversity were strongly associated with SES, with medium effect sizes for all subscales examined. We also acknowledge the need to use subjective SES based on perceived social class during childhood and adolescence due to difficulties with recalling family income during these windows, as well as considering how to equate the range of inflation and buying power of income across our wide age range. Still, these data suggest the POS-DEV captures positive experiences across the diversity of SES experienced in development and offers independent information about the early environment.
We also note several limitations of the existing study and POS-DEV scale. To start, as mentioned above, retrospective reporting can be biased by difficulties in recalling events and inaccurate reporting of experiences from earlier developmental windows (Hardt & Rutter, 2004). However, given that the aim of the POS-DEV scale was to provide an accessible way to quantify early experiences in adults without necessitating multi-decade longitudinal designs, we believe a retrospective design is best suited for our goal. Only a few weak associations were observed between POS-DEV scores and current age when reporting (all rs < .16), suggesting age was not an important confound. In addition, while test–retest reliability ranged from good to excellent for all social figure total scores, dimensions associated with close friends demonstrated the lowest reliabilities. We believe this may stem from oversight in the prompt framing, as we did not explicitly prompt individuals to think of the same close friend(s) they reported on during their initial session when filling out the scale a second time. A further limitation is that the sample consists of a majority of White individuals who live in the United States of America, although efforts were made to reach a nationally representative sample via Prolific. Future studies can consider adapting the POS-DEV scale to capture early positive experiences across different cultural contexts.
The POS-DEV scale provides a useful tool for retrospectively measuring dimensions of positive experiences in childhood and adolescence. We hope this scale will help facilitate examination of dimensional frameworks of positive early life experiences that also acknowledge the social environment beyond the primary caregiver(s). Our approach to validating POS-DEV enables researchers to use this scale flexibly to meet their research goals. Researchers can administer the Childhood and Adolescence scales independently or together, and they can also administer any of the social figures alone or in combination (e.g., to target childhood and adolescent friendship experiences only) based on their specific research questions. POS-DEV scores can be computed along experience dimension, social figure, developmental period, or any combination of those factors, including a total POS-DEV score reflecting overall positive childhood experiences from ages 6 to 18 years. Richly characterizing positive experiences in conjunction with existing measures of early life adversity will enable progress in understanding how developmental environments shape trajectories of brain and behavior and in supporting youths and adults across this wide range of individual differences. The POS-DEV Scale is freely available as Supplement D here and maintained at: https://www.plasticityinneurodevelopmentlab.com/pos-dev-retrospective. Future versions (e.g., translations into other languages, scales for children and adolescents) and additional empirical validations of POS-DEV will be made freely available at that same location.
Supplemental Material
sj-docx-1-asm-10.1177_10731911261459205 – Supplemental material for The Predictability, Opportunity, and Safety Dimensions of Environmental Variability (POS-DEV) Retrospective Scale: A New Tool to Retrospectively Assess Positive Early Life Experiences
Supplemental material, sj-docx-1-asm-10.1177_10731911261459205 for The Predictability, Opportunity, and Safety Dimensions of Environmental Variability (POS-DEV) Retrospective Scale: A New Tool to Retrospectively Assess Positive Early Life Experiences by Kelsie L. Lopez, Nicholas Kathios, Cora E. Mukerji and Laurel J. Gabard-Durnam in Assessment
Supplemental Material
sj-docx-2-asm-10.1177_10731911261459205 – Supplemental material for The Predictability, Opportunity, and Safety Dimensions of Environmental Variability (POS-DEV) Retrospective Scale: A New Tool to Retrospectively Assess Positive Early Life Experiences
Supplemental material, sj-docx-2-asm-10.1177_10731911261459205 for The Predictability, Opportunity, and Safety Dimensions of Environmental Variability (POS-DEV) Retrospective Scale: A New Tool to Retrospectively Assess Positive Early Life Experiences by Kelsie L. Lopez, Nicholas Kathios, Cora E. Mukerji and Laurel J. Gabard-Durnam in Assessment
Footnotes

Ethical Considerations
This research received approval from a local ethics board (ID: 18-12-13).
Consent to Participate
Written informed consent was provided by all participants.
Funding
The authors disclosed receipt of the following financial support for the research, authorship, and/or publication of this article: This research was supported by NSF Grant DGE-1938052 and DGE-2439018 to KLL and NK.
Declaration of Conflicting Interests
The authors declared no potential conflicts of interest with respect to the research, authorship, and/or publication of this article.
Data Availability Statement
Supplemental Material
Supplemental material for this article is available online.
References
Supplementary Material
Please find the following supplemental material available below.
For Open Access articles published under a Creative Commons License, all supplemental material carries the same license as the article it is associated with.
For non-Open Access articles published, all supplemental material carries a non-exclusive license, and permission requests for re-use of supplemental material or any part of supplemental material shall be sent directly to the copyright owner as specified in the copyright notice associated with the article.
