
Abstract
Rapidly growing empirical evidence supports the hypothesis that the cortex operates near criticality. Although the confirmation of this hypothesis would mark a significant advance in fundamental understanding of cortical physiology, a natural question arises: What functional benefits are endowed to cortical circuits that operate at criticality? In this review, we first describe an introductory-level thought experiment to provide the reader with an intuitive understanding of criticality. Second, we discuss some practical approaches for investigating criticality. Finally, we review quantitative evidence that three functional properties of the cortex are optimized at criticality: 1) dynamic range, 2) information transmission, and 3) information capacity. We focus on recently reported experimental evidence and briefly discuss the theory and history of these ideas.
Keywords
Criticality and Balance in the Cortex
A healthy cortex is a well-balanced cortex. Although disagreement with this statement is unlikely, its interpretations vary greatly. From genes, to molecules, to neurons, to networks of neurons, proper function requires proper regulation of competing influences. Examples are too numerous to review comprehensively, but a few include the relative number of excitatory and inhibitory neurons (Alvarez-Dolado and others 2006; Gogolla and others 2009; Chen and Dzakpasu 2010), the strength of excitatory versus inhibitory synapses (Zhang and others 2011), the intrinsic excitability of neurons (Turrigiano and others 1994; Bacci and others 2004; Maffei and Turrigiano 2008), the tone of neuromodulators (Bacci and others 2004; Williams and Castner 2006; Lucas-Meunier and others 2009; Moreau and others 2010), and the expression of synapse-related proteins (Hines and others 2008; Terauchi and others 2010). Although diverse, these mechanisms share a common property: They all directly or indirectly affect the propensity of one action potential to cause another. Thus, at the network level, balance may be viewed in terms of the efficacy of signal propagation through the cortex.
In this view, balanced signal propagation can have surprising and important implications for the dynamics and function of large networks of neurons. To demonstrate this, consider the following thought experiment in which we attempt to construct a simple balanced network.
Imagine a small piece of cortex including 100 neurons that are completely interconnected. The only additional detail that we will consider is the propensity of one action potential to cause another; let’s call p the likelihood that one spike causes each other neuron to fire. In an average way, p accounts for myriad real neurobiological factors (those mentioned above and more). What value of p entails balance? Let’s try out a few guesses. Say p is 1 in 2, like a coin toss, then one spike is likely to cause half of the neurons in the network to fire (Fig. 1, top row). Subsequently those 50 spikes are likely to cause all neurons to fire. Apparently, p equal to 1 in 2 is quite imbalanced; a single spike ignites a runaway chain reaction that never stops. Next, let’s try a much lower value of p, say 1 in 1000 (Fig. 1, bottom row). Given that our network consists of 100 neurons, 10 spiking neurons are required to generate just 1 single subsequent spike (on average), which in turn will cause none (on average). Apparently, p equal to 1 in 1000 entails activity that dies out almost immediately; it is also imbalanced. The balanced p is 1 in 100 (Fig. 1, middle row). In this case, one spike is likely to cause one subsequent spike; the activity tends to neither blow up nor die out, leading to a reverberating response to the initial spike that does not overwhelm the entire network. More generally, in any network we construct in which each neuron connects to N postsynaptic neurons, p must be 1 in N to achieve balance. The consequences of p = 1/N can be surprising and require more than thought experiments to understand. For example, Shew and others (2011) found that, starting with a single spike, the total number of spikes that occur before the activity dies out is highly variable. In fact, this variability is highest for p = 1/N compared with all other possible values of p. Even more surprising is that, despite this variability, when a network receives inputs (e.g., from external sources such as the thalamus), the resulting responses distinguish different inputs most reliably when p = 1/N compared with all other values of p (Shew and others 2011). These two properties are intrinsic consequences of balanced neuronal propagation. In the following sections, we will elaborate on these and additional functional implications of cortical balance. We will focus on recent experiments that suggest that our very simple thought experiment captures many aspects of real cortical networks.
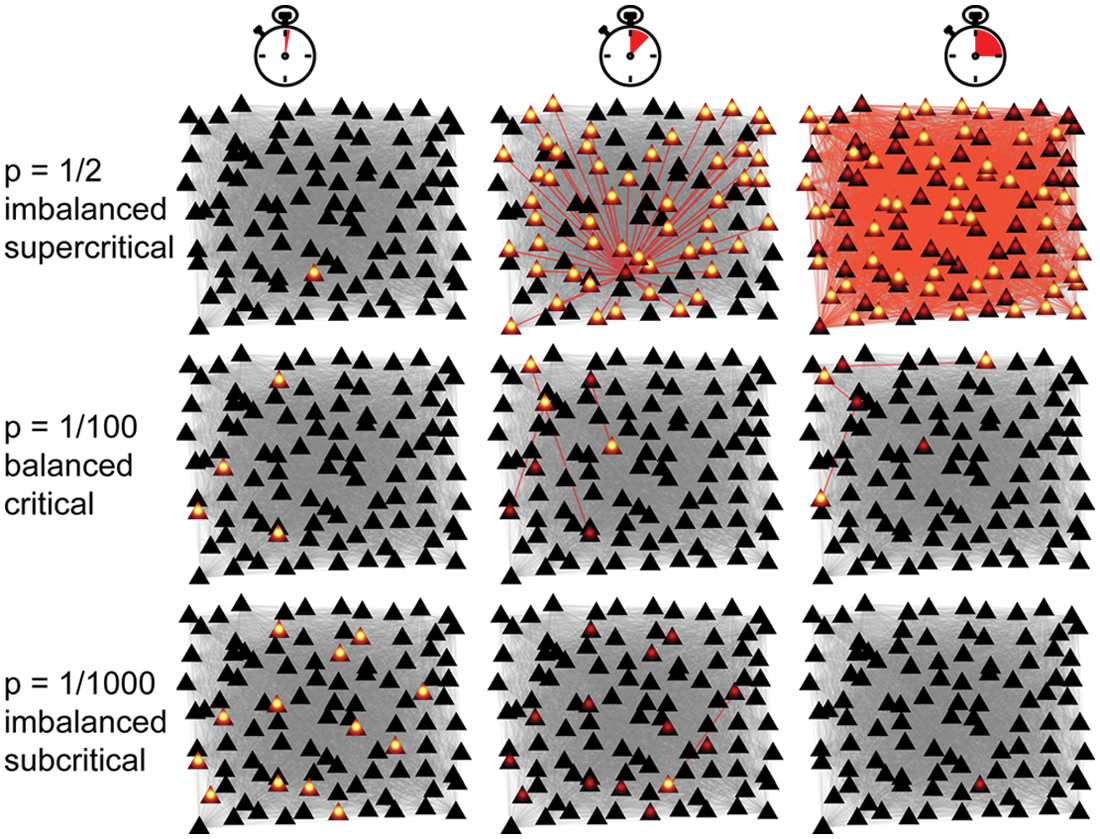
Balanced propagation of neural signals at criticality. The cartoon in each panel represents a snapshot of a population of 100 cortical neurons. Triangles represent neurons (black, quiescent; yellow center, currently spiking; red center, recently spiked), and lines represent connections between them (gray, quiescent; red, active). Time advances from left to right for each row. The top row illustrates the imbalanced scenario in which one spike causes each other neuron to spike with probability p = 1/2, causing a runaway chain reaction that consumes the whole network. The bottom row is also imbalanced (p = 1/1000); activity dies out, failing to propagate. The middle row is balanced, p = 1/100; the activity tends to persist without dying out or explosive growth. The middle row is an example of criticality; the top and bottom rows are examples of supercritical, subcritical dynamics, respectively.
When balanced at p = 1/N, the simple model described above is an example of a network operating at criticality. When imbalanced, such as when p = 1/2 and p = 1/1000, the network is not at criticality; rather, these two examples are referred to as supercritical and subcritical, respectively. Supercritical activity tends to grow, whereas subcritical activity tends to die out. We emphasize that our simple thought experiment is just one example of criticality. Criticality has been studied in a wide variety of contexts, mostly outside the realms of neuroscience, beginning around the start of the 20th century. These investigations addressed the statistical physics of phase transitions. For example, as the temperature of iron falls below a critical threshold called the Curie temperature, there are dramatic changes in the properties of the iron, namely, a phase transition from paramagnetism to ferromagnetism occurs (Hopkinson 1901; Binney and others 1992). Akin to the variability in our thought experiment above, the response to a magnetic stimulus (i.e., magnetic susceptibility) is maximized at the Curie temperature. When the temperature is exactly equal to the Curie temperature, the iron is at criticality and interactions between iron molecules are, in a sense, balanced, analogous to the balanced state of neural interactions at p = 1/N described above. A half century later, direct analogies between the brain and ferromagnets were employed in the theory of neural networks (Cragg and Temperley 1954, 1955). Although these pioneering studies acknowledged that neural circuits may undergo a phase transition, another half century passed before the emergence of the more specific hypothesis that brain circuits might be balanced at criticality. This hypothesis was primarily explored using computational models of neural networks (Kürten 1988; Kentridge 1993; Usher and others 1994; Chen and others 1995; Herz and Hopfield 1995; Stassinopoulos and Bak 1995; Bienenstock and Lehmann 1998; Chialvo and Bak 1999). However, only during the past decade have experiments begun to uncover multifaceted, direct support of the criticality hypothesis. In this review, we will focus on in vitro and in vivo experiments performed at the scales of cortical electrophysiology (Beggs and Plenz 2003, 2004; Stewart and Plenz 2006; Gireesh and Plenz 2008; Pasquale and others 2008; Stewart and Plenz 2008; Petermann and others 2009; Shew and others 2009; Hahn and others 2010; Ribeiro and others 2010; Tetzlaff and others 2010; Shew and others 2011; Yang and others 2012). Evidence has also been obtained from large-scale brain signals and behavior, but this will not be reviewed here (Fraiman and others 2009; Kitzbichler and others 2009; Kello and others 2010).
Functional Advantages of Criticality
In addition to the intuitive notion of balance, a crucial motivation for the critical cortex hypothesis is that criticality is associated with optimized information processing and computation. Our primary aim here is to review evidence for such optimized function in cortical networks at criticality. Previous reviews have explored the theory of this topic (Beggs 2008), although here we focus on experimental support. The idea was first proposed in the 1980s by scientists who were interested in how computational abilities can spontaneously emerge from the cooperation of many interacting simple elements. Their so-called cellular automata models were not explicitly designed with brain function in mind, but their simple elements may be interpreted abstractly as neurons, and thus, their discoveries are closely related to the topic of our review. Indeed, the thought experiment that we described above and a number of recent neural models (Haldeman and Beggs 2005; Kinouchi and Copelli 2006; Poil and others 2008; Larremore, Shew, and Restrepo 2011; Shew and others 2011) can be viewed as examples of probabilistic cellular automata. First, Wolfram (1984) identified a particular type of cellular automata (labeled type IV) and conjectured that, when compared with other types, it was most capable of performing “interesting computations.” Later, it was shown that Wolfram’s type IV automata operate near criticality (Li and others 1990). Advancing beyond conjecture, Crutchfield and Young (1989) presented a quantitative demonstration of peak computational power near criticality, although this was in a simpler system (the logistic map) with less obvious applicability for neural networks. Additional investigations also suggested that automata operating near criticality were imbued with certain optimal properties for information processing (Crutchfield and Young 1990; Huberman 1990; Kauffman 1990; Langton 1990; Li and others 1990; Arnold 1996). Many of these and other related studies were published together in volumes 42 and 45 of Physica D in 1990. These ideas soon began to be explored in the context of neural networks (Kentridge 1997). More recent model studies have begun to rigorously address the optimization of information-processing capabilities of neural networks at criticality (Greenfield and Lecar 2001; Beggs and Plenz 2003; Bertschinger and Natschläger 2004; Haldeman and Beggs 2005; Kinouchi and Copelli 2006; Legenstein and Maass 2007; Tanaka and others 2009; Chen and others 2010; Larremore, Shew, Ott, and others 2011; Larremore, Shew, and Restrepo 2011). However, these predictions from models remained untested in experiments until very recently, which will be discussed in more detail in the following sections.
In this review, we focus on three specific functional properties of cortical networks that are optimized near criticality. The first is dynamic range, which is the range of stimulus intensities that are distinguishable based on the population response of the network. Second, we discuss information transmission. Here, the fidelity of information transfer from externally imposed stimuli to population neural responses is quantified using mutual information. Third is information capacity, which characterizes the repertoire of activated neural assemblies available to a neural population and imposes limits on many information-processing tasks including, but not limited to, information transmission. We review theoretical predictions and the recently acquired evidence from experiments that support them.
How to Test the Criticality Hypotheses in Experiments
To test if these functional properties of the cortex are optimal near criticality, one requires a research strategy that achieves two criteria.
Criterion 1: a means of altering the overall balance of interactions between the neurons (e.g., changing p in the thought experiment described above).
Criterion 2: a means of assessing how close to criticality the cortex is operating (e.g., how close is p to 1/N).
In computational models, these two criteria are easily met; the strength of interactions is a parameter controlled by the modeler, and it is easy to determine what value of the parameter results in criticality. In experiments, there are many possible strategies to achieve the first criterion. For example, one may apply pharmacological antagonists of excitatory synapses, creating an imbalance favoring inhibition. However, the second criterion presents a challenge because it is not feasible to directly measure the overall balance of interactions in even a small piece of cortex. Moreover, meeting criterion 2 is especially crucial in experiments because one’s attempt to alter the cortical balance may fail because of unexpected compensatory mechanisms that restore the balance without the experimenter’s “permission.” Given the importance of balance, such compensatory mechanisms may be numerous. One solution is to carefully assess network dynamics, testing for indirect signatures of criticality that are predicted by theory. Here we focus on neuronal avalanches, which are a type of network dynamics expected to occur at criticality. Importantly, the second criterion above can be achieved with an analysis strategy that assesses how close the system is to criticality based on how close the observed dynamics are to neuronal avalanches.
We define neuronal avalanches based on the statistics of network dynamics. According to theory, a neural network at criticality will exhibit population events (i.e., periods with elevated activity among many interacting neurons) with the following statistical characteristic: the probability distribution of population event sizes will have power-law functional form (Beggs and Plenz 2003; Hinrichsen 2006; Levina and others 2007; Buice and Cowan 2009; Millman and others 2010). That is, one expects to observe population events of size s with probability P(s)~s α. Neuronal avalanches are defined by a power-law exponent α ≈ −1.5. Theory as well as mounting empirical evidence from models and experiments suggests that −1.5 is expected for critical neural networks, but other exponents are also possible at criticality (Muñoz and others 1999). (For methods of defining population events and their sizes, see Beggs and Plenz [2003]; Petermann and others [2009]; and Shew and others [2009].) At criticality, other attributes of the network dynamics also emerge with power-law functional forms in addition to the event size distribution. Two examples include the functions that describe temporal and spatial correlations. Such correlations extend over much greater temporal and spatial scales at criticality, compared with either subcritical or supercritical regimes. However, these properties have not been experimentally studied in real neural tissue to the extent that neuronal avalanches have, and therefore, we will not review them in greater depth here.
Experimentally, the observation of neuronal avalanches requires measurement tools with good temporal and spatial resolution covering an extended spatial area in order to assess the sizes of population events. We note that the precise requirements—exactly how large an area and how well resolved—remain incompletely studied. Although other techniques should meet these requirements, the method of choice to date has been multielectrode arrays (MEAs). So far, neuronal avalanches have been observed in MEA recordings from the cortex of awake monkeys (Petermann and others 2009; Shew and others 2011), awake and sleeping rats (Ribeiro and others 2010), anesthetized rats (Gireesh and Plenz 2008; Ribeiro and others 2010; Shew and others 2011) and cats (Hahn and others 2010), and in vitro in acute slices (Stewart and Plenz 2006) and cultures (Beggs and Plenz 2003; Gireesh and Plenz 2008; Pasquale and others 2008; Stewart and Plenz 2008; Shew and others 2009; Tetzlaff and others 2010; Shew and others 2011; Yang and others 2012).
Acknowledging that not every animal and not every brain slice will be identical, a useful analysis technique was recently developed to assess how close a given measurement is to neuronal avalanches (see Fig. 2; Shew and others 2009, 2010; Yang and others 2012). The input to this analysis is a population event size distribution, and the output is a single number, denoted κ. The closer κ is to 1, the closer the size distribution is to a perfect power-law with exponent −1.5. A similar measure was recently introduced by Tetzlaff and others (2010) to quantify how power-law event size distributions emerge during early development. Because theory predicts that neuronal avalanches occur at criticality, κ can be interpreted as an estimate of how far the system was from criticality when the measurement was taken. Experimentally, κ offers a tool that meets criterion 2. Thus, κ allows for testing whether aspects of animal behavior or network function are different when the system exhibits neuronal avalanches compared with other types of network dynamics. Moreover, κ provides a convenient way to directly compare experiments with models, because κ can be readily computed using an event size distribution derived from a computational model as well. The experiments reviewed below employ κ to test the hypotheses that dynamic range, information transmission, and information capacity are maximized near criticality.
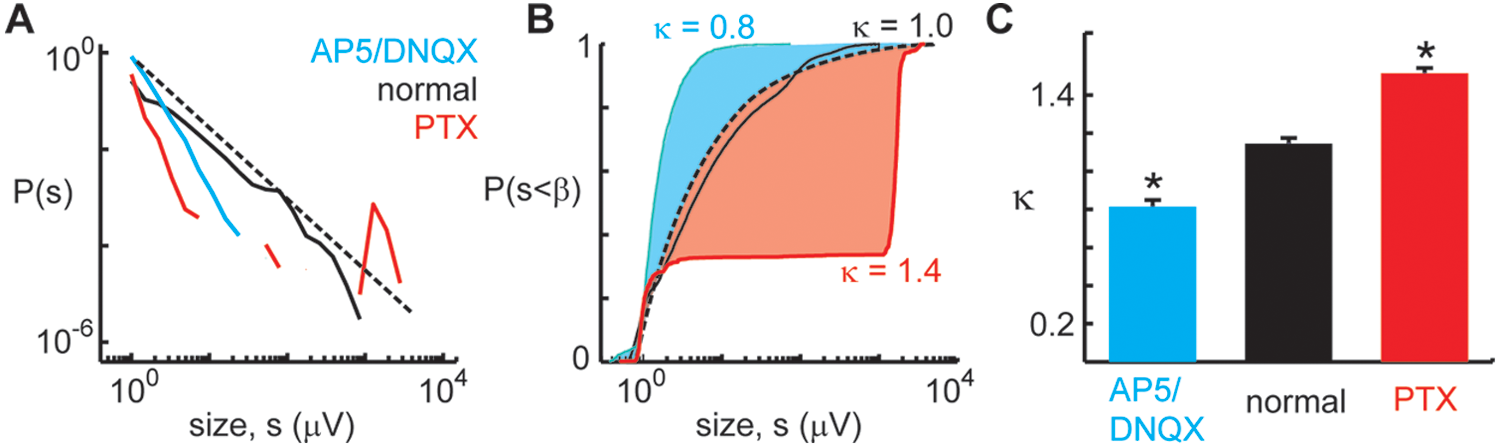
Empirically testing deviations from criticality with κ. Criticality is associated with power-law population event size distribution with exponent −1.5. Thus, proximity to criticality can be assessed by κ, a measure devised to test deviation from such a power-law (Shew and others 2009, 2011). (A) Three population event size distributions measured under different experimental conditions (blue, excitatory [NMDA and AMPA] synapses were partially blocked by drugs AP5 and DNQX; red, inhibitory [GABAA] synapses partially blocked by drug picrotoxin; black, no drug). The drug-altered cases deviate from a power-law (dashed line) more than the no-drug case does. Note that the graph axes are logarithmic, and therefore deviation from a −1.5 power-law corresponds to deviation from the straight dashed line. (B) The distributions shown in (A) are recast as cumulative distributions. κ is computed based on the shaded areas between the reference distribution and the measured distribution. The area above the reference (blue) results in κ < 1, whereas the area below (red) results in κ > 1. When κ ≈ 1, the distribution is near a −1.5 power law, and thus the cortical network is putatively near criticality. (C) Summary of many experiments under different drug conditions. Note that κ ≈ 1 was typically found for the normal condition, suggesting that criticality is the default state of these networks.
We note that, in principle, κ = 1 does not guarantee that the event size distribution is a −1.5 power-law. For instance, imagine a situation with equal area above and below the reference distribution in Figure 2B. In the experiments reviewed below, such distributions were not observed, but if employed in a new context, care should be taken to be sure κ works as expected.
Dynamic Range Is Maximized at Criticality
Among the most prominent jobs of the cortex is to receive and process incoming signals from the senses and other brain regions. Dynamic range, symbolized by Δ, quantifies the range of different input signals a cortical circuit can process (Fig. 3A). Usually, a range of stimulus intensities is explored (e.g., sound intensities for auditory dynamic range or current amplitudes for electrical stimulation). In principle, the larger the dynamic range of an organism’s cortical circuits, the more capably it will interact with its environment. Among the most clear theoretical predictions of a functional benefit bestowed to the cortex when operating near criticality was that made by Kinouchi and Copelli (2006), hereafter abbreviated KC. They showed that dynamic range is maximized at criticality in a computational model of a neural network (Fig. 3B). Their model was very similar to our introductory thought experiment above; essentially, they measured Δ as a function of the spike propagation probability p. To be more precise, they considered a network in which a different p
ij
specified the connection between each pair of neurons and defined
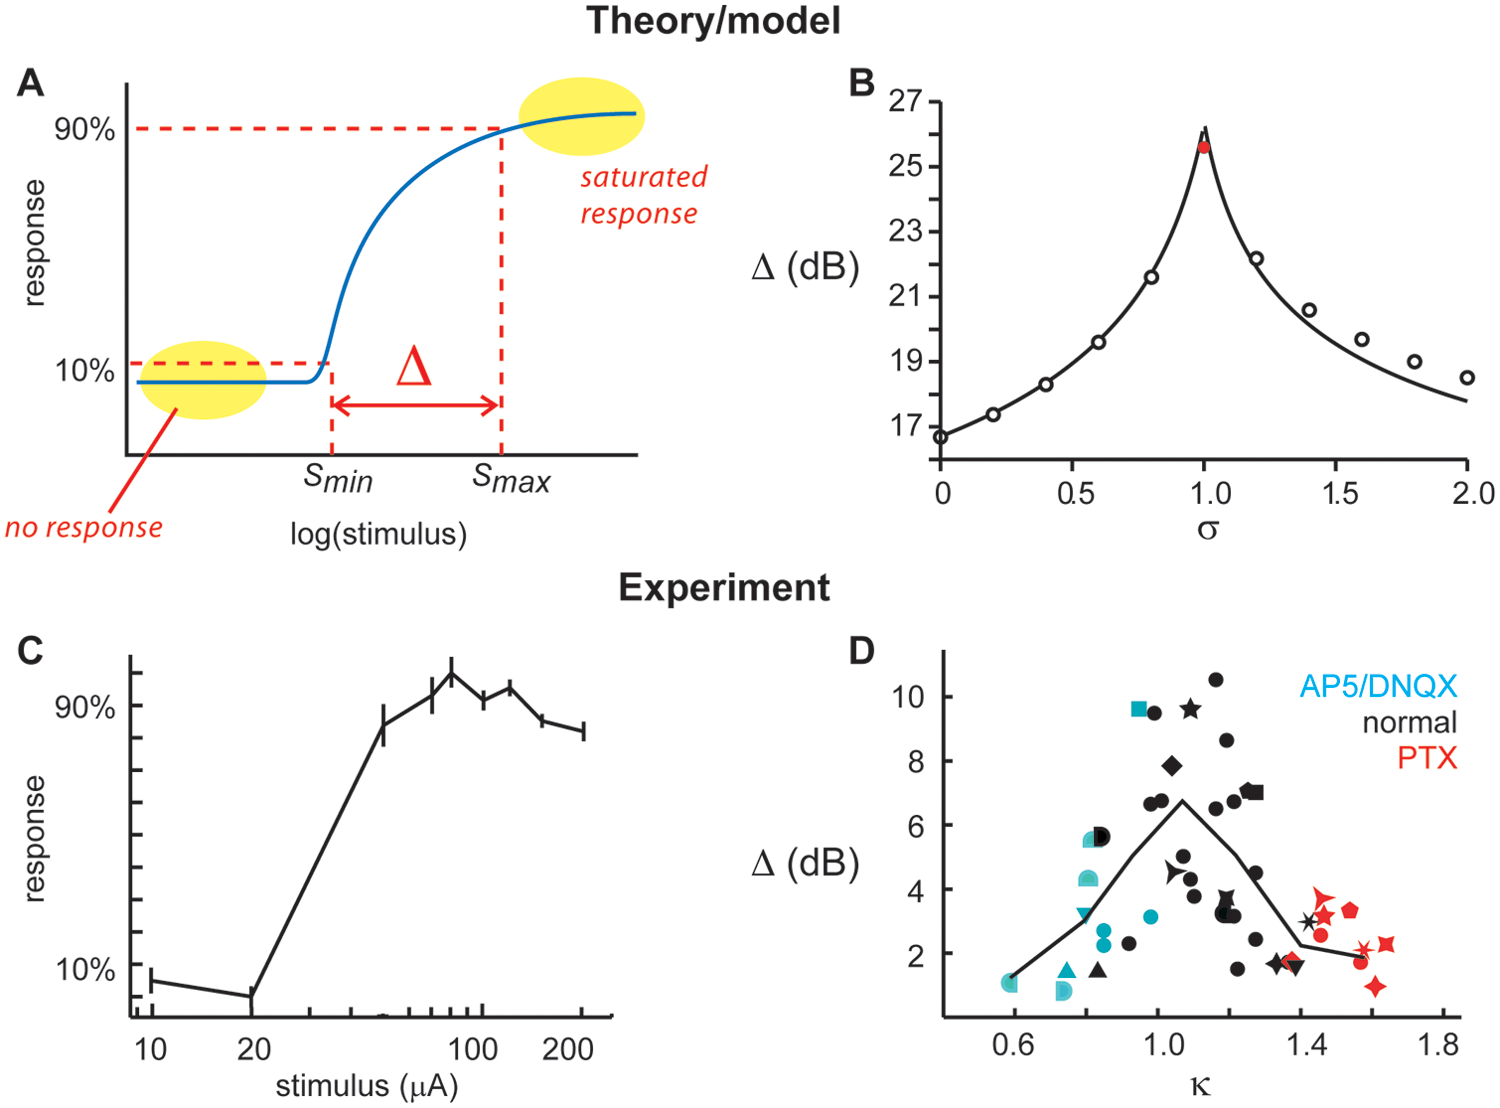
Dynamic range of stimulus response. Dynamic range Δ quantifies the range of stimulus intensities that result in distinguishable response amplitudes (i.e., nonzero and nonsaturated response). (B) Kinouchi and Copelli (2006) showed with models (points) and theoretical analysis (line) that dynamic range is maximized at criticality (red dot, σ = 1). Adapted from Kinouchi and Copelli (2006). (C) An example of an experimental stimulus-response curve obtained by Shew and others (2009). Stimuli were electric shocks, and the network response was measured with multielectrode arrays. (D) A summary of dynamic range measurements from many experiments. The horizontal axis κ parameterizes deviation from criticality (κ ≈ 1 indicates criticality). Blue points indicate experiments in which glutamate receptors (AMPA and NMDA) were antagonized with AP5/DNQX, thus imbalancing the system. Red points indicate GABAA receptors were antagonized with picrotoxin, imbalancing the system in the opposite sense. Adapted from Shew and others (2009).
When the network is critical,
Like our thought experiment, KC’s model was parsimonious, lumping most biological details of cortical balance into the parameter σ, which raised the question of whether their prediction would be confirmed in real brain tissue. The experiments of Shew and others (2009), hereafter abbreviated S09, provided the first experimental support for the idea that cortical dynamic range is maximized at criticality. They studied cortex slice cultures grown on the surface of multielectrode arrays, which allowed them to both electrically stimulate the tissue and record the resulting population activity. Although KC altered the spike propagation probability, S09 altered the balance of excitatory and inhibitory interactions in the cortical network using pharmacological means. S09’s pharmacological manipulations targeted either GABAA receptors or NMDA and AMPA receptors and therefore must also alter the spike propagation probability, but this is not an experimentally measurable property of the network. Instead, they followed the approach described in the previous section. Empirically, S09 found that reducing inhibition resulted in spontaneous network dynamics very similar to the supercritical dynamics observed in models, and reducing excitation led to dynamics that were similar to subcritical activity. Importantly, neuronal avalanches typically occurred when no drug was applied to the tissue, suggesting that, by default, the cortex operates near criticality and that the drugs push the network away from criticality. S09 developed the statistic κ to quantify this deviation from putative criticality.
Next, to assess dynamic range, S09 applied electrical stimuli with varying amplitudes. For sufficiently small stimuli, there was no network response, and for sufficiently large stimuli, the response tended to saturate (Fig. 3C). The range of distinguishable stimuli was quantified by the dynamic range. They found that the dynamic range was highest in cortical networks that generate neuronal avalanches (i.e., displayed κ ≈ 1), in support of the hypothesis that dynamic range is maximized at criticality (Fig. 3D). This result is consistent with other experiments that also show that network dynamic range is reduced when cortical inhibition is reduced (Pouille and others 2009).
Because κ is based on population event size distributions and KC did not study such distributions, S09 also repeated KC’s model findings, making direct measurements of κ in the model. Moreover, the stimulus property changed by KC (i.e., rate) was different than that changed by S09 (i.e., amplitude). In this way, S09 confirmed that neuronal avalanches, κ ≈ 1, and maximum dynamic range are theoretically expected at criticality.
Why is cortical dynamic range maximized at criticality? As discussed in the introduction, criticality strikes a balance between runaway excitation (supercritical) and activity that tends to die out quickly (subcritical). In the subcritical regime, poor sensitivity to low-intensity stimuli results in low dynamic range. This makes sense because small stimuli die out quickly in the subcritical regime. In the supercritical regime, the ability to distinguish large stimuli is reduced, thus reducing the dynamic range. Here, the runaway excitation causes a saturated response, which makes large stimuli indistinguishable.
Fidelity of Information Transmission Is Maximized at Criticality
The transmission of information either from external stimulus to neural response or from one neural group to another is often quantified using mutual information (Rieke and others 1997). In the context of stimulus and response, mutual information is similar to but more general than dynamic range. Both assess how well neural response distinguishes different stimuli, but dynamic range is limited to characterizing a one-dimensional property of a stimulus and response (e.g., intensity or rate). In contrast, mutual information can quantify the ability of a network to encode a set of stimuli with multidimensional differences (e.g., different spatial patterns of stimuli). Likewise, more complex features of responses can be considered. Like dynamic range, the higher the mutual information between sensory input and neural response, the better an organism’s chances of correctly perceiving and surviving in a complex environment.
Several studies have predicted that mutual information is maximized at criticality. Li and others (1990) used cellular automata to show that mutual information between different cells was maximized at criticality. To our knowledge, the first study of mutual information and criticality in a model of a neural network was performed by Greenfield and Lecar (2001). They showed that mutual information between different neurons in the network was peaked at criticality. Beggs and Plenz (2003) later found similar results in a feed-forward neural network model. Taking the reverse approach, Tanaka and others (2009) implemented a rule governing synaptic plasticity designed to maximize information transmission through a network. Starting from various initial networks, the learning process resulted in a network that maximized mutual information and, importantly, generated neuronal avalanches. As mentioned above, neuronal avalanches are expected at criticality. Similarly, it was shown that a learning rule that optimizes mutual information between input and output can result in a network that operates near criticality (Shriki 2003).
Until recently, these predictions were untested in real living brain tissue. This was done by Shew and others (2011), hereafter abbreviated S11, using a very similar experimental paradigm as in S09. They applied a range of different electric shock stimulus intensities (input) and measured the response (output) from cortex cultures grown on MEAs. In contrast to the dynamic range measurements, in which only the amplitude of the response was considered, here they characterized the response based on the spatial pattern of the activity measured on an 8 × 8 grid covering a 1.4-mm × 1.4-mm patch of cortical network (Fig. 4A). In short, each response was reduced to a multisite binary pattern with one bit per recording site. A pattern bit was set to one if the corresponding recording site exhibited local field potential fluctuations larger than a certain threshold during the response and zero otherwise. They found that mutual information of the stimulus set and the set of observed response patterns was maximized near putative criticality (i.e., when κ ≈ 1; Fig. 4B). In light of this result, it may be surprising that at κ ≈ 1 they also found maximized variability of response patterns for a single stimulus repeated many times. Thus, as foreshadowed in our introductory thought experiment, information transmission from stimulus to response is both maximally variable and maximally reliable when the network is balanced (i.e., near κ ≈ 1).
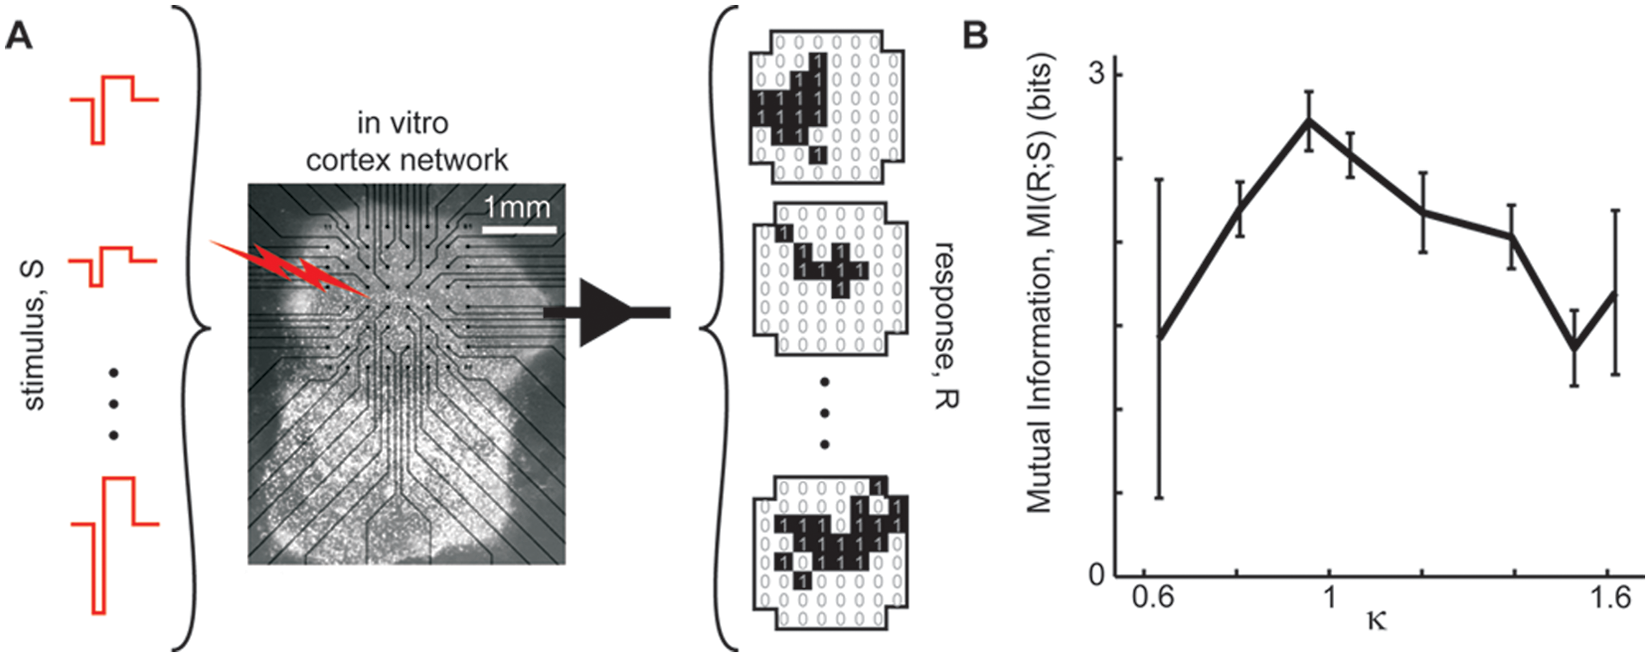
Information transmission. (A) Schematic of experiments. Shock stimuli of varying amplitudes were applied (40 times for each amplitude). Each response was characterized as a binary spatial pattern (1, 0 for active, inactive sites, respectively). (B) Fidelity of information transfer from stimulus to response was quantified with mutual information of the full stimulus set and the resulting response set. The mutual information was highest when the system was balanced near κ ≈ 1 (i.e., near putative criticality).
Information Capacity Is Maximized at Criticality
In this section, we discuss a property of the cortex that is related to information transmission and variability as discussed in the previous section but has wider implications. Information capacity is concerned with the following question: What are the limits on how informative the dynamics of the cortex can be? One approach to answer this question is to quantify the diversity of the cortical activity pattern repertoire. For an extreme example, consider a cortical network capable of generating only two different activity patterns. It cannot encode as much information as a network that can generate hundreds of patterns. In practice, it is not feasible to experimentally measure the full activity pattern repertoire. For example, if one obtains a 10-min recording from two electrodes it, is likely to reveal an apparently smaller repertoire compared with a 100-min recording from 20 electrodes. However, one can keep such recording details fixed and make meaningful comparisons between different conditions. For example, S11 compared conditions of imbalanced excitation/inhibition with balanced conditions (Fig. 5).
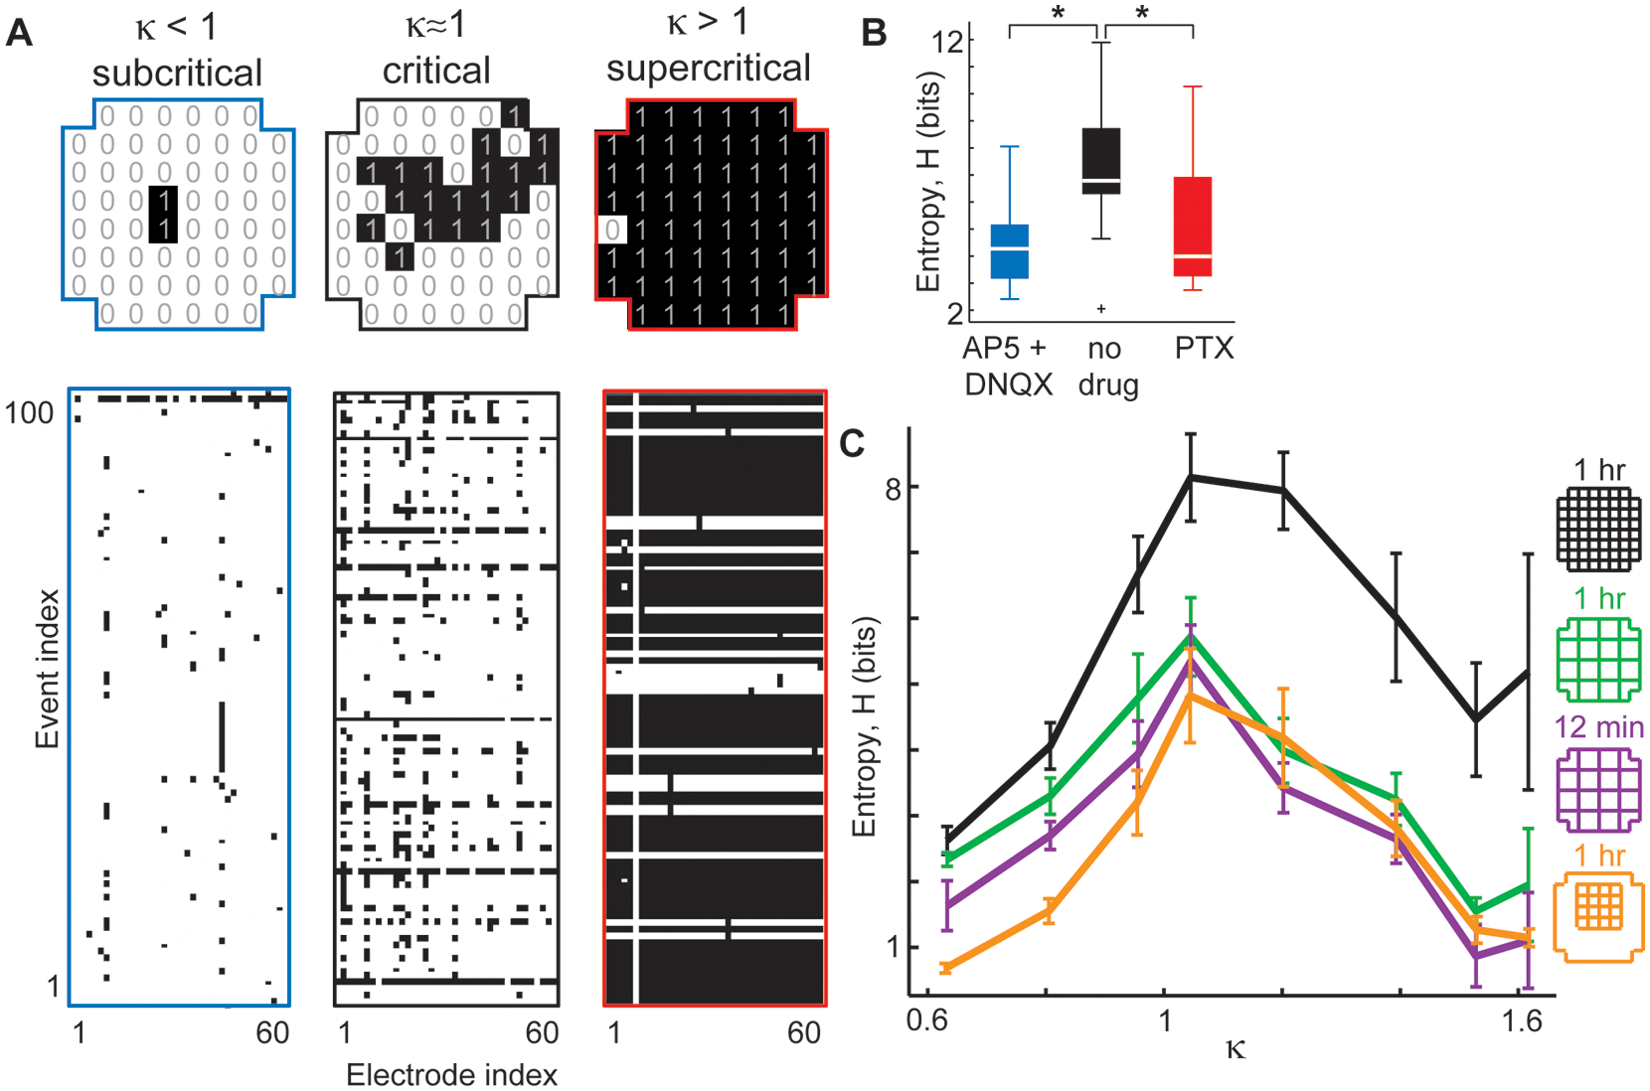
Information capacity. Cortical networks are capable of generating a vast repertoire of different spatial patterns of activation. The size of this repertoire is thought to be proportional to the capacity for information representation and transformation by the network. In experiments, the repertoire has been quantified by computing the entropy of a large number of activation patterns recorded during a certain time. (A) Example sets of activation patterns recorded under conditions of reduced excitation (left), normal, and reduced inhibition (right). (B) Entropy (i.e., information capacity) was always lower under imbalanced conditions. (C) For a given number of electrodes and recording time, the peak entropy occurred for κ ≈ 1 (i.e., near putative criticality). Adapted from Shew and others (2011).
The size of the cortical activity repertoire can be quantified by calculating the entropy of a set of measured activity patterns. In fact, Shannon (1948) defined the term information capacity in terms of entropy. For an introduction to information theory as applied to neuroscience, see Rieke and others (1997). Entropy is defined as,
Several studies have experimentally demonstrated how sensory systems can optimize performance by maximizing response entropy with respect to a given distribution of sensory input (Laughlin 1981; Dong and Atick 1995; Dan and others 1996; Rieke and others 1997). However, in principle, information capacity is important for more operations than just stimulus-response information transmission. For example, the ability to spontaneously assemble new concepts based on stored information is considered the hallmark of creativity. One might speculate that having a large repertoire of neural activity patterns from which to assemble new concepts may result in greater potential for creativity. Some have even suggested that having a large pattern repertoire is related to consciousness (Sleigh and others 2004; Alkire and others 2008; Fekete and others 2009).
Here we review several recent studies that suggest that cortical information capacity is maximized at criticality (Haldeman and Beggs 2005; Stewart and Plenz 2006; Ramo and others 2007; Shew and others 2011). Haldeman and Beggs (2005) used a model similar to that discussed in the introduction and found that when p = 1/N, the number of activity patterns that repeat at least once was highest. Stewart and Plenz (2006) varied dopamine tone in acute cortex slices and found that conditions that were most favorable to generating neuronal avalanches also resulted in peak levels of diverse activity patterns, suggestive of peak information capacity at criticality. Using a Boolean network model, Ramo and others (2007) showed that the size distribution of activity patterns has the highest entropy at criticality. Although these studies suggest that pattern entropy may peak at criticality, the first direct support of this hypothesis came from experiments and modeling performed by Shew and others (2011). They defined activity patterns as constellations of recording sites with elevated activity. When the cortical networks were balanced near putative criticality (i.e., κ ≈ 1), they exhibited maximized information capacity.
This result was explained based on how the cortical balance affects two features of cortical activity: 1) correlations between sites and 2) the rates of activity. If rates are fixed, then correlations determine the entropy; the lower the correlations between sites, the higher the entropy. However, if rates are not fixed, the situation is not so simple, and sufficiently low rates can cause low entropy no matter how low the correlations drop. Shew and others (2011) found that by reducing inhibition, both rates and correlations were high, resulting in low entropy. When they reduced excitation, both correlations and rates of activity dropped. The combined effect was low entropy; the lowered rates won the competition with the low correlations. Under balanced conditions, both rates and correlations were moderate, resulting in peak entropy. They also found that measurements of κ in awake monkeys were very close to unity and that entropy matched predictions from in vitro experiments near κ ≈ 1, suggesting that the monkeys were operating near criticality.
Network Topology and Other Ways to Tune toward/away from Criticality
In the S09 and S11 experiments, the system was tuned through criticality by altering the balance of excitation and inhibition. However, in line with the fact that a wide range of mechanisms can affect balance, tuning excitation and inhibition is not the only way that the cortex can be tuned through criticality. For example, the amount of tonic dopamine D1-receptor stimulation has also been shown to regulate neuronal avalanche dynamics (Stewart and Plenz 2006; Gireesh and Plenz 2008). Moreover, recent theoretical studies have demonstrated how changing the topology of connections in the cortical network can also affect critical phenomena. For example, networks with modular structure can facilitate robust critical dynamics (Kaiser and Hilgetag 2010; Rubinov and others 2011; Wang and Zhou 2012). These studies highlight the fact that criticality is not inconsistent with traditional views of hierarchical processing (Felleman and Van Essen 1991). Indeed, if each different stage of the hierarchy is composed of a network of neurons, then the system may perform optimally when those networks operate at criticality. Even at a higher level, interactions across modules of a hierarchical system may be optimized when they are balanced at criticality. However, more detailed studies are required to determine how criticality may affect specific hierarchical processing schemes (e.g., the refinement of visual stimulus selectivity from simple cells to complex cells in the visual system). Nonetheless, at a general level, it has been shown in computational models that information transmission through a feed-forward network is maximized at criticality (Beggs and Plenz 2003).
For most network topologies, the connection strengths between neurons can be tuned to achieve criticality. Conversely, for fixed connection strengths, one may change the topology to tune the system toward or away from criticality. Indeed, such changes in topology have been used to attain criticality and maximize dynamic range (Larremore, Shew, Ott, and others 2011; Larremore, Shew, and Restrepo 2011). Importantly, for general network topologies, the criterion for criticality is not σ = 1 (p = 1/N). Rather, Larremore and others showed that criticality occurs when the largest eigenvalue of the network adjacency matrix is equal to 1. In line with this finding, studies of reservoir computing, for example, liquid-state machines and echo-state networks, also found that certain aspects of computation were optimized when this largest eigenvalue was 1 (Verstraeten and others 2007). Thus, these studies are consistent with the studies we review here; reservoir computing is likely to be most effective when the reservoir operates at criticality. One situation in which the distinction between p = 1/N and the largest eigenvalue equal to 1 becomes important is when the afferent connections of a neuron are correlated in strength or numbers with the efferent connections. In this case, our introductory thought experiment would not be balanced when p = 1/N; rather, balance occurs when the largest eigenvalue of the matrix of all p ij values is 1. Moreover, comparing different network topologies (all operating at criticality), Larremore, Shew, and Restrepo (2011) predicted that the highest achievable dynamic range is expected in homogeneous network topologies.
Not Just Balanced, Critically Balanced
In much of the above, we have described criticality in terms of a dynamical balance in cortical network dynamics (essentially characterized by p = 1/N in the first section). A fundamental concept in many other studies of cortical electrophysiology is the balance of excitation and inhibition. Empirical observations suggest that the excitatory and inhibitory postsynaptic currents of any given cortical neuron are proportional (Shu and others 2003; Haider and others 2006; Okun and Lampl 2008). In the context of our discussion, these findings raise the question: does the balance of excitation and inhibition serve to maintain criticality in the cortex? We speculate that this is so. Previous in vivo studies have separately found neuronal avalanches (Gireesh and Plenz 2008; Petermann and others 2009; Shew and others 2011) and a constant ratio of excitation to inhibition (Haider and others 2007; Okun and Lampl 2008). In the in vitro studies discussed in the above sections, when excitation and inhibition were pharmacologically imbalanced, neuronal avalanches were abolished. Taken together, these facts suggest that the constant ratio of excitatory to inhibitory currents measured in multiple studies is in line with a cell-level indicator of network-level criticality in the cortex. However, careful experiments in which synaptic currents are measured together with neuronal avalanches will be required to directly test this possibility.
Maintenance of Criticality and Functional Consequences of Its Loss
The experimental studies reviewed here suggest that certain aspects of cortex function are optimized by operating at criticality. Along with the notion that criticality corresponds with well-balanced cortical dynamics, this evidence suggests that homeostatic mechanisms may serve to maintain criticality. This concept of self-organized criticality has received significant theoretical attention, particularly in recent models of cortex dynamics (Levina and others 2007; Meisel and Gross 2009; Millman and others 2010; Rubinov and others 2011). Some experimental evidence supports the idea that living neural networks can evolve toward criticality (Stewart and Plenz 2008; Tetzlaff and others 2010). However, experiments on in vivo homeostasis have not yet been performed with attention to the possibility that criticality may be the end goal of homeostatic processes. More experiments along these lines are required.
The experimental studies reviewed here are just the first steps toward understanding how cortex function and dysfunction may be tied to criticality and loss thereof. If the reviewed results prove to hold for in vivo information processing in future experiments, then many implications emerge for brain disorders associated with imbalance in excitatory or inhibitory systems. For instance, 30% of autistic people experience epileptic seizures (Spence and Schneider 2009), which is a hallmark of such imbalance. The studies reviewed here raise the question: Could autism be due to slight supercriticality at the level of neural network dynamics? Behavioral characteristics associated with autism are consistent with this possibility. For example, a restricted repertoire of movements and interests is one of three diagnostic features of autistic behavior (DSM-IV). This is expected if these individuals have supercritical neural circuits and thus a restricted repertoire of neural activity patterns (i.e., reduced information capacity). Second, a large majority of autistic persons react abnormally to sensory stimulation (e.g., auditory hyperreactivity; Gomot and others 2008). Such behavior would be expected if their sensory dynamic range is reduced because of supercritical neural circuits. Many studies have linked autism with disruptions in the balance of excitation and inhibition (Rubenstein and Merzenich 2003; Markram and others 2007; Gomot and others 2008; Tannan and others 2008; Fatemi and others 2009; Gogolla and others 2009; Oblak and others 2009; Chao and others 2010; Oblak and others 2010; Silverman and others 2010; Yizhar and others 2011). Can loss of function in such brain disorders be attributed to a loss of the critical balance? Can it be restored with a strategy based on restoring criticality? We are optimistic that new studies that extend the ideas reviewed here to animal disease models and brain imaging in humans will answer these questions and reveal criticality to be a general framework in which normal as well as abnormal brain function can be precisely quantified and understood.
Footnotes
Declaration of Conflicting Interests
The authors declared no potential conflicts of interest with respect to the research, authorship, and/or publication of this article.
Funding
The authors disclosed receipt of the following financial support for the research, authorship, and/or publication of this article: All work was supported by DIRP of NIMH.